Engineering paralog-specific PSD-95 recombinant binders as minimally interfering multimodal probes for advanced imaging techniques
- University of Bordeaux, CNRS, Interdisciplinary Institute for Neuroscience, IINS, UMR 5297, France
- University of Bordeaux, CNRS, INSERM, Bordeaux Imaging Center, BIC, UMS 3420, US 4, France
- University of Bordeaux, Bordeaux Proteome, France
- University of Bordeaux, Inserm U1212, CNRS UMR 5320, IECB, France
Figures
Figure 1 with 3 supplements
Evaluation of the impact of evolved 10FN3 domains binding on the PDZ domains function.
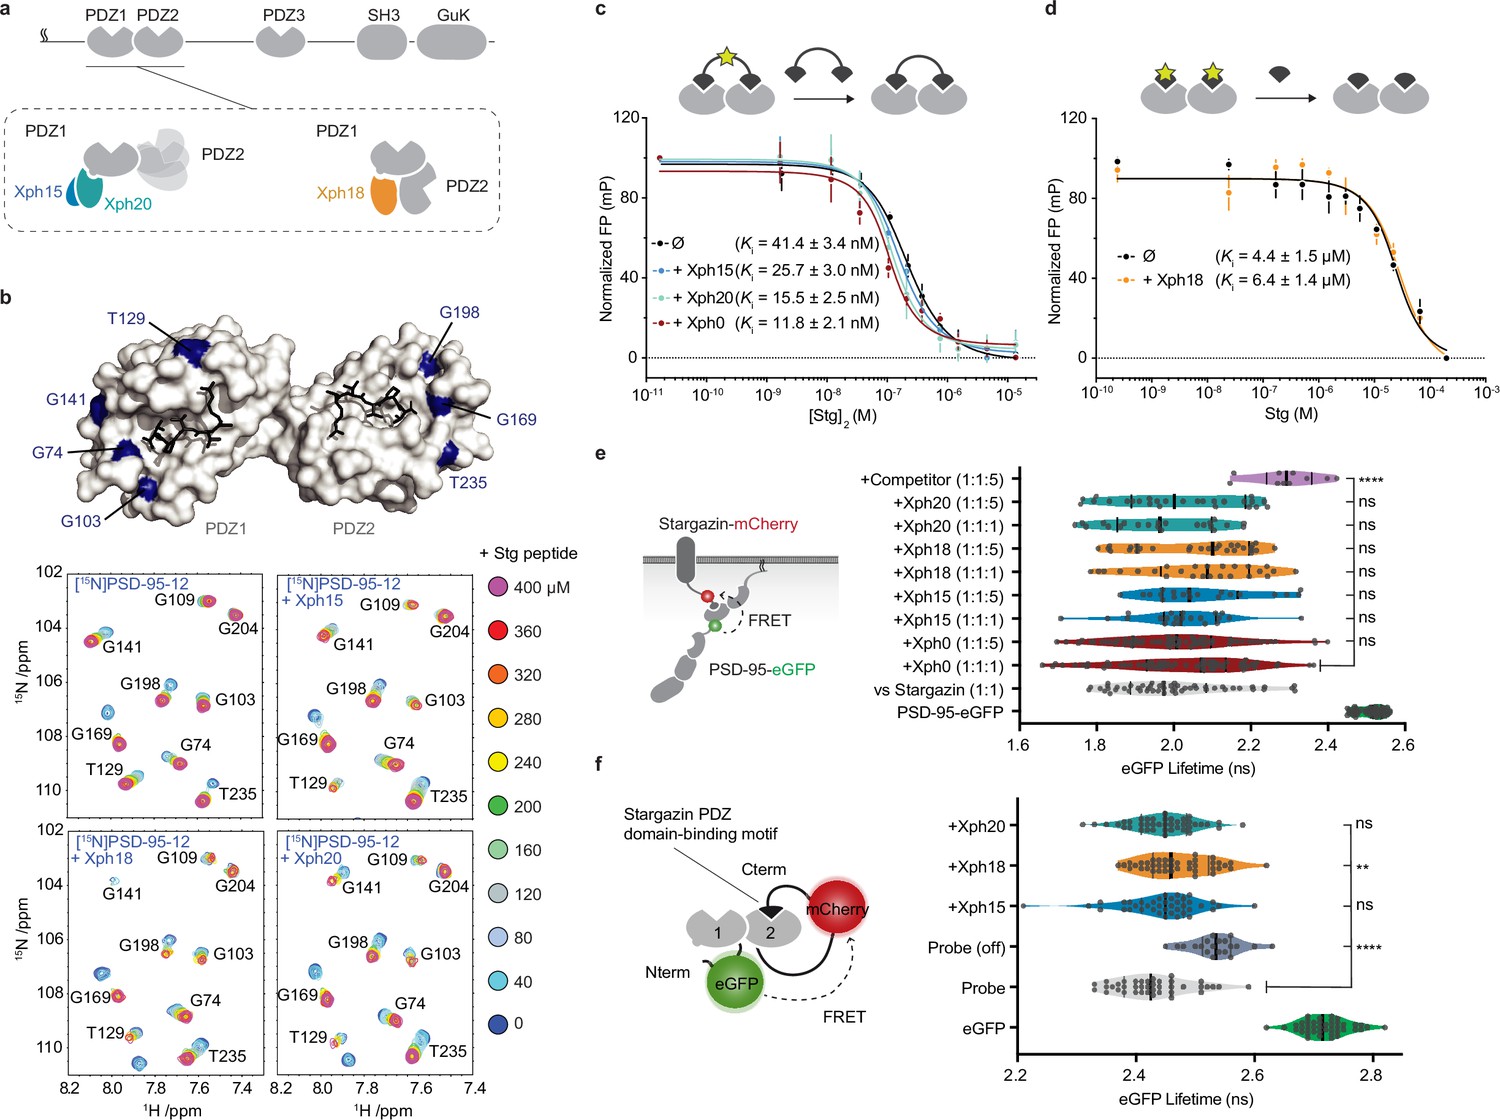
(a) PSD-95 domain organization and binding models of the three clones investigated. (b) Titrations of a monovalent stargazin-derived peptide against PSD-95-12 in the absence or presence of Xph15, Xph18, and Xph20. Surface representations of PSD-95 tandem PDZ domains (PDB ID 3GSL, domain 1 on the left and domain 2 on the right) with ligand modeled in (RTTPV derived from stargazin C-terminus and aligned from PDB ID 3JXT, black sticks) and with location of the residues annotated in the NMR titration spectra in blue: Gly74, Gly103, Thr129, and Gly141 report on stargazin binding to PDZ1; Gly169, Gly198, and Thr235 report on stargazin binding to PDZ2. Selected region of an overlay of 1H,15N-HSQC spectra corresponding to 200 μM of [15N]PSD-95-12 titrated with 0, 40, 80, 120, 160, 200, 240, 280, 320, 360, and 400 μM peptide ligand based on the C-terminus of stargazin (Stg) in the absence of evolved binder or in complex with 240 μM of Xph15, Xph18, or Xph20. Complete spectra can be found in Figure 1—figure supplement 1. (c) Competitive fluorescence polarization titrations between divalent stargazin-derived ligands and PSD-95-12 with or without Xph clones (5 µM each, mean ± SD of three independent titrations). (d) Competitive fluorescence polarization titrations between monovalent stargazin-derived ligands and PSD-95-12 with or without Xph18 (20 µM, mean ± SD of three independent titrations). (e) Lifetime of eGFP inserted in PSD-95 in the presence of stargazin (acceptor-containing protein) and indicated constructs (molar ratio of DNA constructs specified as donor:acceptor:ligand). Violin plots show median, first and third quartile, and all individual data points (each corresponding to a single cell) pooled from at least two independent experiments. Statistical significance determined by one-way ANOVA followed by Dunnett’s multiple-comparison test. (f) Lifetime of eGFP in a PSD-95-12-derived FRET reporter system in the presence of indicated constructs (used at five molar equivalents of DNA compared to the FRET probe). Violin plots show median, first and third quartile, and all individual data points (each corresponding to a single cell) pooled from at least two independent experiments. Statistical significance determined by one-way ANOVA followed by Dunnett’s multiple-comparison test.
-
Figure 1—source data 1
Spreadsheet with the normalized fluorescence polarization data (Figure 1c).
- https://cdn.elifesciences.org/articles/69620/elife-69620-fig1-data1-v2.xlsx
-
Figure 1—source data 2
Spreadsheet with the normalized fluorescence polarization data (Figure 1d).
- https://cdn.elifesciences.org/articles/69620/elife-69620-fig1-data2-v2.xlsx
-
Figure 1—source data 3
Spreadsheet with the raw fluorescence lifetime data (Figure 1e).
- https://cdn.elifesciences.org/articles/69620/elife-69620-fig1-data3-v2.xlsx
-
Figure 1—source data 4
Spreadsheet with the raw fluorescence lifetime data (Figure 1f).
- https://cdn.elifesciences.org/articles/69620/elife-69620-fig1-data4-v2.xlsx
Figure 1—figure supplement 1
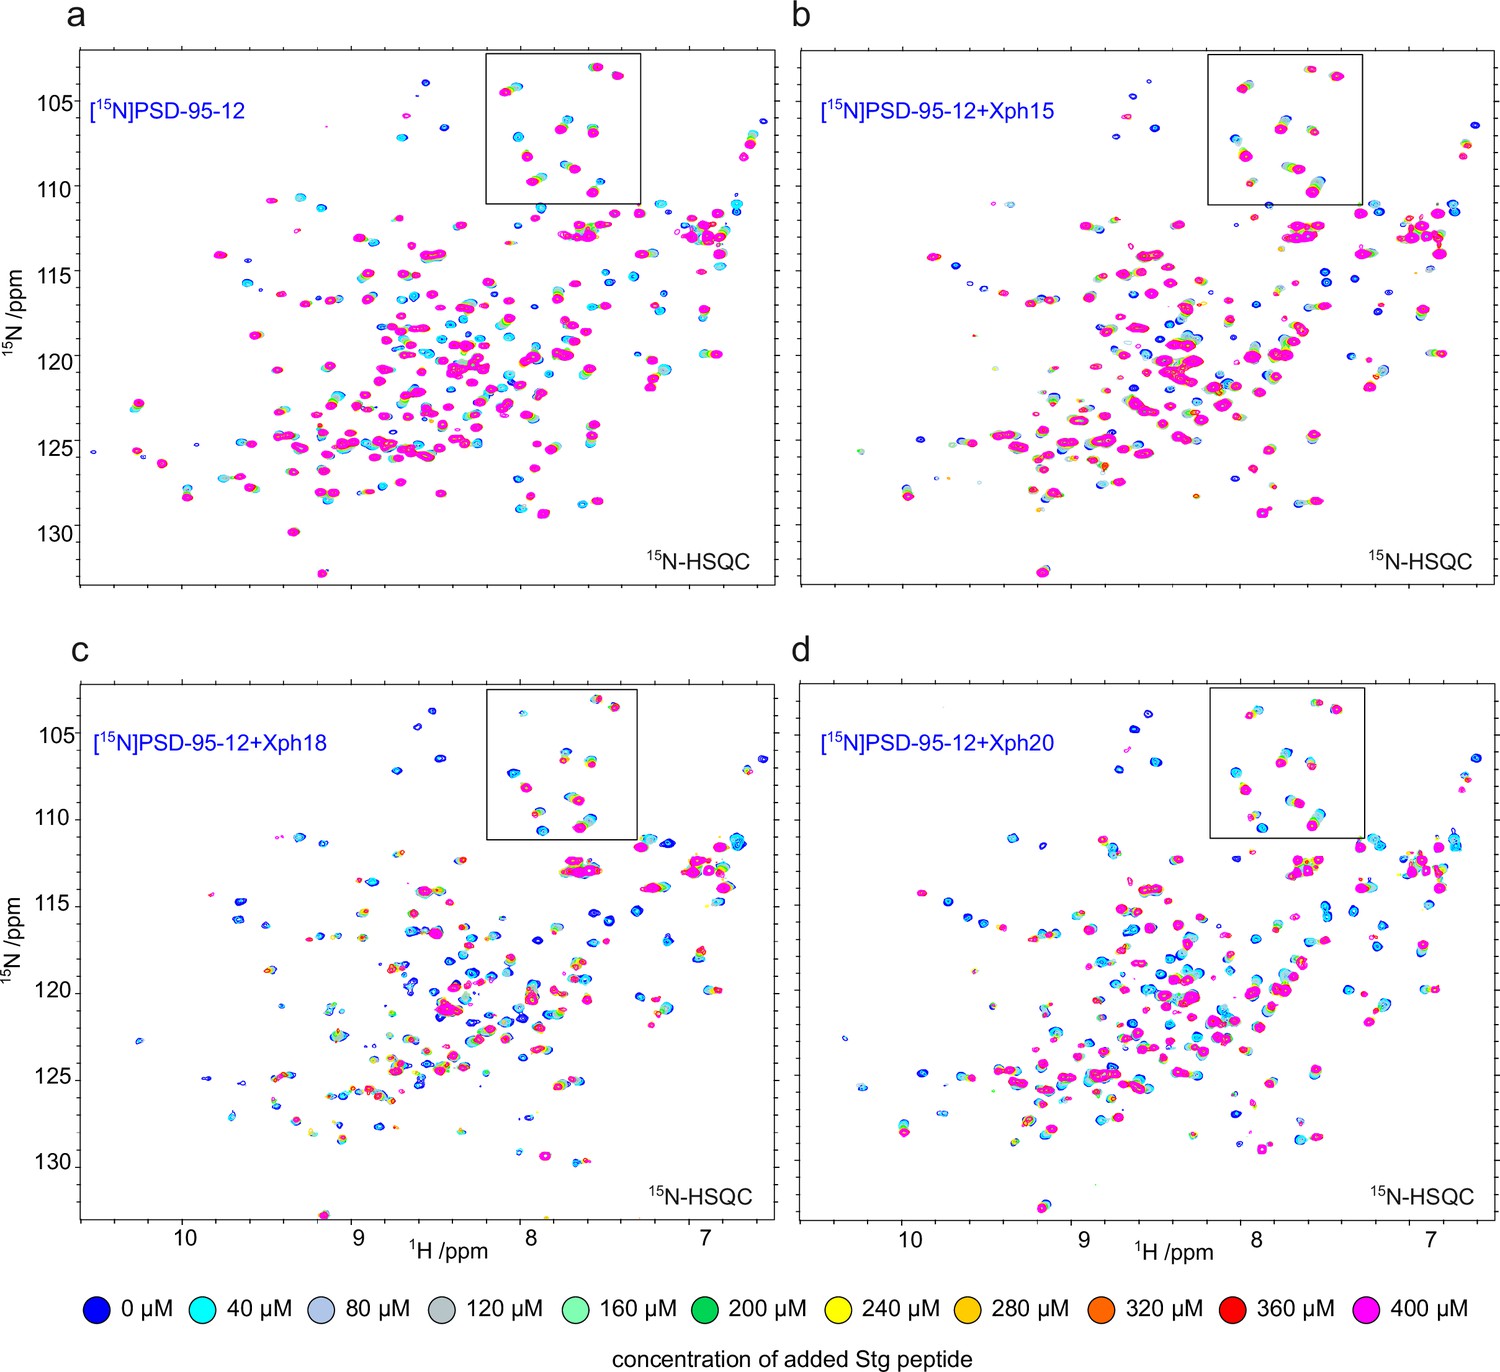
[15N]-HSQC spectra collected on 200 µM [15N]PSD-95-12 and titrated in with increasing concentrations of a monovalent stargazin-derived peptide (Stg) (a) in the absence of binder or in the presence of 240 µM Xph15 (b), Xph18 (c), or Xph20 (d).
The region in the box corresponds to the selected regions presented in Figure 1b.
Figure 1—figure supplement 2
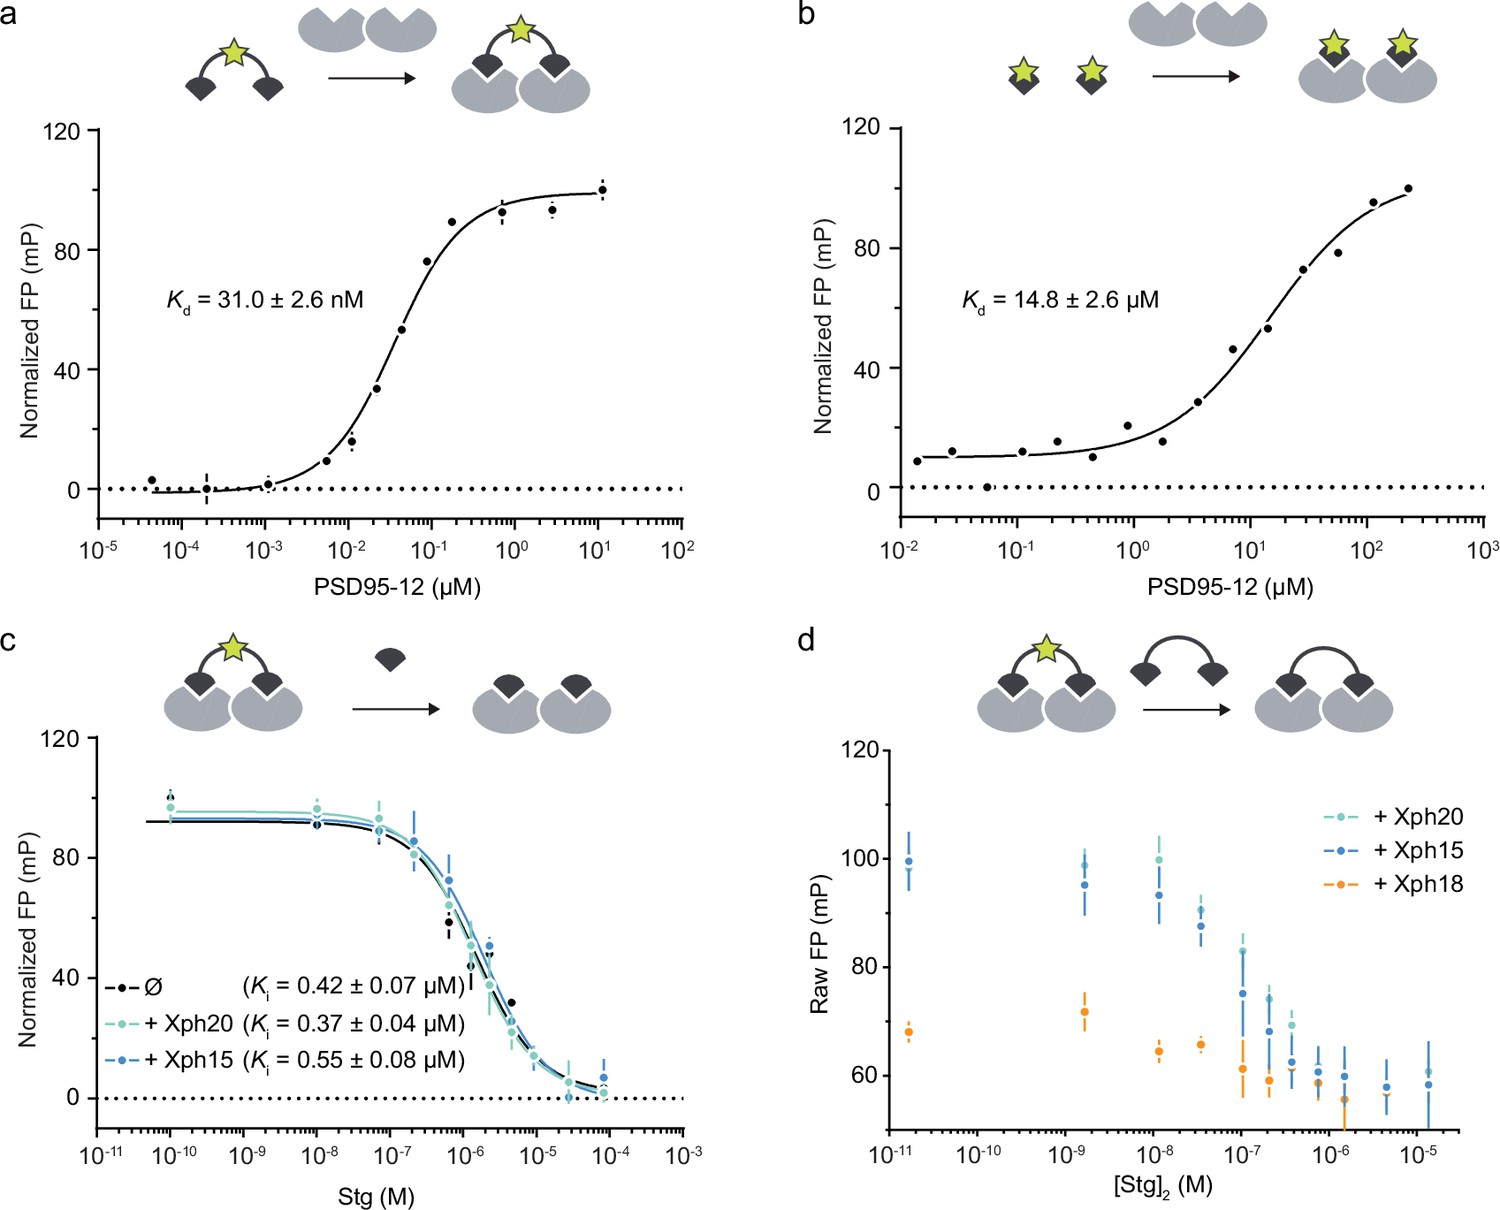
Fluorescence polarization titrations.
(a) Direct titration of FITC-labeled stargazin-derived divalent ligand (10 nM) against PSD-95 tandem PDZ domains. Each data point represents the average of three measurements ± SD. The dissociation constants obtained by fitting are reported with the calculated SEM. (b) Direct titration of FITC-labeled stargazin-derived monovalent ligand (10 nM) against PSD-95 tandem PDZ domains. Each data point represents a single measurement. The dissociation constants obtained by fitting are reported with the calculated SEM. (c) Competitive titrations with non-fluorescent (acetylated) stargazin monovalent ligand against the complexes between FITC-labeled stargazin divalent ligand, PSD-95 PDZ domains 1 and 2, and either Xph15, Xph20, or no binder (∅). Each data point represents the average of two independent measurements ± SD. The inhibition constants obtained by fitting are reported with the calculated SEM. (d) Competitive titrations with non-fluorescent (acetylated) stargazin divalent ligand against the complexes between FITC-labeled stargazin divalent ligand, PSD-95 PDZ domains 1 and 2, and either Xph15, Xph20, or Xph18. Each data point represents the average of two independent measurements ± SD. The FP values are not normalized and indicate, in the presence of Xph18, an impaired binding of the fluorescent probe.
-
Figure 1—figure supplement 2—source data 1
Spreadsheet with the normalized fluorescence polarization data (Figure 1—figure supplement 2a).
- https://cdn.elifesciences.org/articles/69620/elife-69620-fig1-figsupp2-data1-v2.xlsx
-
Figure 1—figure supplement 2—source data 2
Spreadsheet with the normalized fluorescence polarization data (Figure 1—figure supplement 2b).
- https://cdn.elifesciences.org/articles/69620/elife-69620-fig1-figsupp2-data2-v2.xlsx
-
Figure 1—figure supplement 2—source data 3
Spreadsheet with the normalized fluorescence polarization data (Figure 1—figure supplement 2c).
- https://cdn.elifesciences.org/articles/69620/elife-69620-fig1-figsupp2-data3-v2.xlsx
-
Figure 1—figure supplement 2—source data 4
Spreadsheet with the normalized fluorescence polarization data (Figure 1—figure supplement 2d).
- https://cdn.elifesciences.org/articles/69620/elife-69620-fig1-figsupp2-data4-v2.xlsx
Figure 1—figure supplement 3
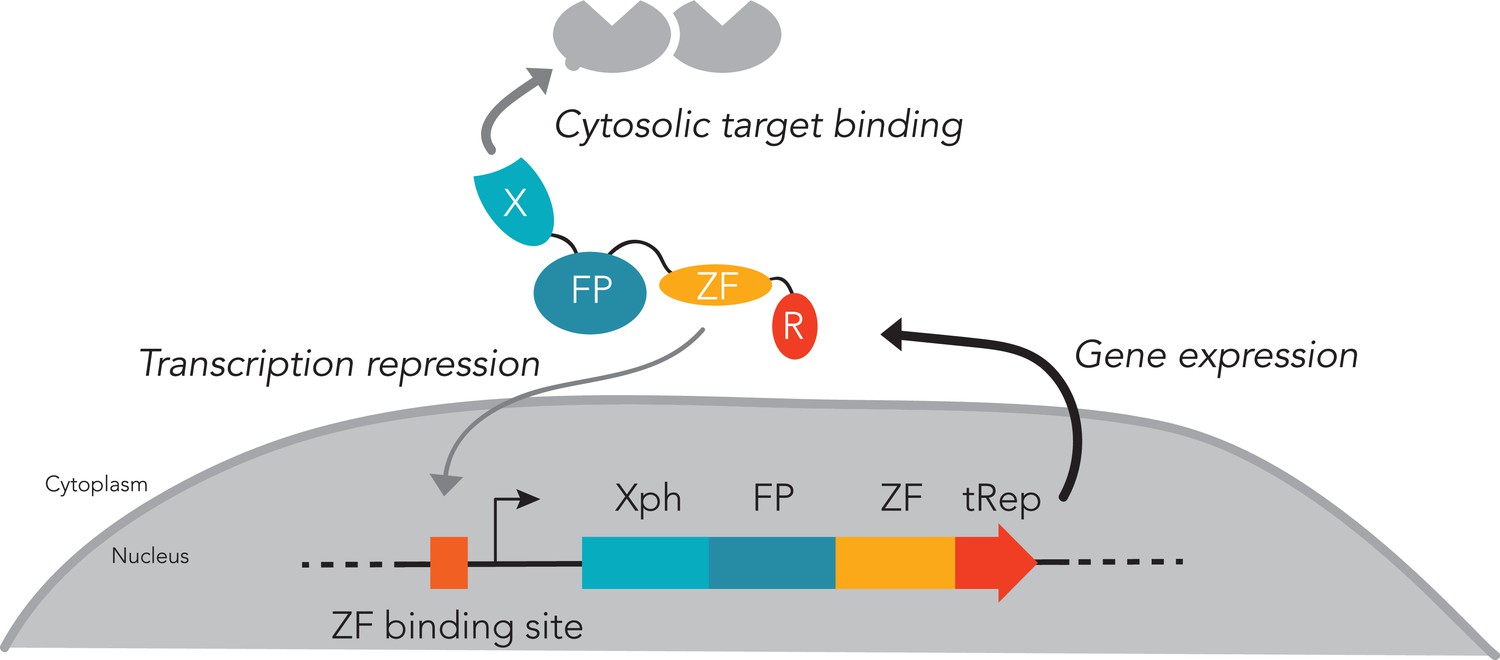
Expression regulation system.
The system relies on a competition for the expressed probe between binding to its cytosolic target (favored) or preventing further transcription (unfavored until the target is saturated). Xph/X: binding module; FP: fluorescent protein; ZF: zinc finger; tRep/R: transcription repressor. For clarity, the expression regulation system is omitted in the schematic representation of the various probes used in neurons when its presence is not a variable.
Figure 2 with 3 supplements

Evaluation of monobodies binding to endogenous PSD-95.
(a–e) Synaptic currents in wild-type mouse neurons infected with adeno-associated viruses expressing either eGFP, Xph15, Xph18, or Xph20 (n = 19, 15, 17, and 16, respectively, from three independent cultures). (a) Representative traces of glutamatergic miniature excitatory postsynaptic currents (mEPSCs) recorded from neurons expressing eGFP, Xph15, Xph18, or Xph20, (b) mEPSC amplitude, (c) mEPSC frequency, (d) mEPSC decay time, and (e) mEPSC rise time. Data are expressed as mean ± SEM, statistic significances were tested using the nonparametric Kruskal–Wallis test followed by Dunn’s post hoc test. Each dot represents a recorded cell. (f) Representative images for AMPARs single-particle tracking by uPAINT (left, epifluorescence image of non-transfected control and Xph15-, Xph18-, or Xph20-eGFP expression pattern in transfected rat neuron culture; right, trajectories; scale bar 5 µm). (g) Average distribution of instantaneous diffusion coefficients obtained by uPAINT of synaptic AMPAR with typical bimodal distribution. Error bars indicate cell-to-cell variability. (h) Percentage of mobile AMPARs (mean ± SEM, each dot represents the mean value of mobile AMPAR per cell). Statistical analysis was performed with an ordinary one-way ANOVA. (i) Evaluation of Xph20 expression on PSD-95 interactome. Volcano plot of the proteins identified by mass spectrometry following immunoprecipitation of endogenous PSD-95 in rat hippocampal culture infected by either Xph20-eGFP or eGFP (overlay of two independent experiments, experiment 1, diamonds; experiment 2, circles). Known PSD-95 partners are represented in blue shades while other proteins are represented in purple shades. Protein identity (gene name) is provided for those below a p-value of 0.05 and above an absolute log2(abundance ratio) value of 1.5.
-
Figure 2—source data 1
Spreadsheet with the miniature excitatory postsynaptic currents (mEPSCs) amplitude data (Figure 2b).
- https://cdn.elifesciences.org/articles/69620/elife-69620-fig2-data1-v2.xlsx
-
Figure 2—source data 2
Spreadsheet with the miniature excitatory postsynaptic currents (mEPSCs) frequency data (Figure 2c).
- https://cdn.elifesciences.org/articles/69620/elife-69620-fig2-data2-v2.xlsx
-
Figure 2—source data 3
Spreadsheet with the miniature excitatory postsynaptic currents (mEPSCs) decay data (Figure 2d).
- https://cdn.elifesciences.org/articles/69620/elife-69620-fig2-data3-v2.xlsx
-
Figure 2—source data 4
Spreadsheet with the miniature excitatory postsynaptic currents (mEPSCs) rise time data (Figure 2e).
- https://cdn.elifesciences.org/articles/69620/elife-69620-fig2-data4-v2.xlsx
-
Figure 2—source data 5
Spreadsheet with the diffusion distribution data (Figure 2g).
- https://cdn.elifesciences.org/articles/69620/elife-69620-fig2-data5-v2.xlsx
-
Figure 2—source data 6
Spreadsheet with the percentage of mobile AMPARs data (Figure 2h).
- https://cdn.elifesciences.org/articles/69620/elife-69620-fig2-data6-v2.xlsx
-
Figure 2—source data 7
The mass spectrometry proteomics data have been deposited to the ProteomeXchange Consortium via the PRIDE partner repository with the dataset identifier PXD045002 (Figure 2i).
- https://cdn.elifesciences.org/articles/69620/elife-69620-fig2-data7-v2.xlsx
Figure 2—figure supplement 1
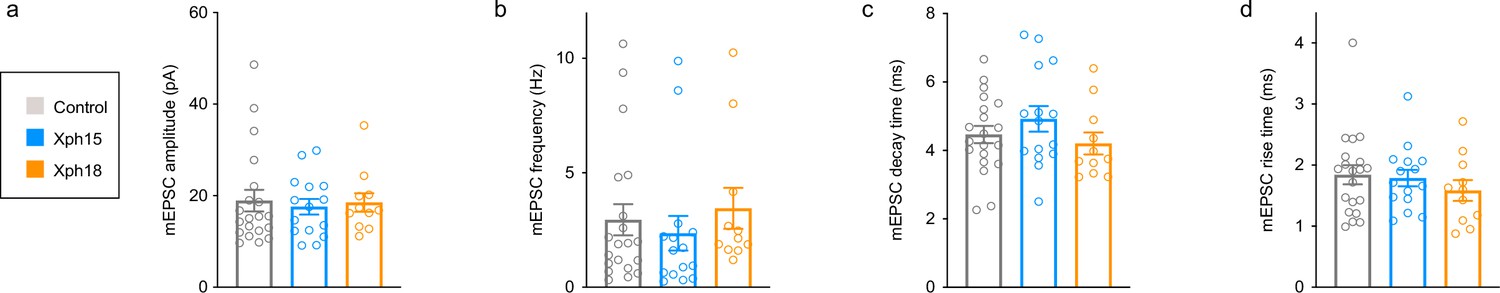
Spontaneous miniature excitatory postsynaptic currents properties based on the analysis of the 100 first events of control non-transfected or Xph15 and Xph18 (fused to eGFP and the expression regulation system) transfected rat culture neurons.
(a) Amplitude (in pA, control: 18.92 ± 2.37 [n = 20]; Xph15: 17.58 ± 1.71 [n = 15]; Xph18: 18.52 ± 2.03 [n = 11]; mean ± SEM with p>0.61 by ordinary one-way ANOVA). (b) Frequency (in Hz, control: 2.95 ± 0.68 [n = 20]; Xph15: 2.36 ± 0.75 [n = 15]; Xph18: 3.44 ± 0.90 [n = 11]; mean ± SEM with p>0.65 by ordinary one-way ANOVA). (c) Decay time (in ms, control: 4.46 ± 0.25 [n = 20]; Xph15: 4.92 ± 0.37 [n = 15]; Xph18: 4.20 ± 0.32 [n = 11]; mean ± SEM with p>0.32 by ordinary one-way ANOVA). (d) Rise time (in ms, control: 1.84 ± 0.16 [n = 20]; Xph15: 1.79 ± 0.14 [n = 15]; Xph18: 1.58 ± 0.17 [n = 11]; mean ± SEM with p>0.53 by ordinary one-way ANOVA).
-
Figure 2—figure supplement 1—source data 1
Spreadsheet with the miniature excitatory postsynaptic currents (mEPSCs) amplitude data (Figure 2—figure supplement 1a).
- https://cdn.elifesciences.org/articles/69620/elife-69620-fig2-figsupp1-data1-v2.xlsx
-
Figure 2—figure supplement 1—source data 2
Spreadsheet with the miniature excitatory postsynaptic currents (mEPSCs) frequency data (Figure 2—figure supplement 1b).
- https://cdn.elifesciences.org/articles/69620/elife-69620-fig2-figsupp1-data2-v2.xlsx
-
Figure 2—figure supplement 1—source data 3
Spreadsheet with the miniature excitatory postsynaptic currents (mEPSCs) decay time data (Figure 2—figure supplement 1c).
- https://cdn.elifesciences.org/articles/69620/elife-69620-fig2-figsupp1-data3-v2.xlsx
-
Figure 2—figure supplement 1—source data 4
Spreadsheet with the miniature excitatory postsynaptic currents (mEPSCs) rise time data (Figure 2—figure supplement 1d).
- https://cdn.elifesciences.org/articles/69620/elife-69620-fig2-figsupp1-data4-v2.xlsx
Figure 2—figure supplement 2

Cumulative distribution of average distribution of instantaneous diffusion coefficients obtained by uPAINT of synaptic AMPAR (Figure 2g).
Error bars indicate cell-to-cell variability.
-
Figure 2—figure supplement 2—source data 1
Spreadsheet with the cumulative diffusion distribution data.
- https://cdn.elifesciences.org/articles/69620/elife-69620-fig2-figsupp2-data1-v2.xlsx
Figure 2—figure supplement 3

Rat hippocampal culture transduced with adeno-associated viruses expressing either eGFP or Xph20-eGFP at 3 d in vitro (DIV) and imaged and lysed at 16 DIV for proteomics analysis (scale bar 40 µm).
Figure 3 with 1 supplement
Evaluation of monobodies as intrabody fluorescent reporter probes.
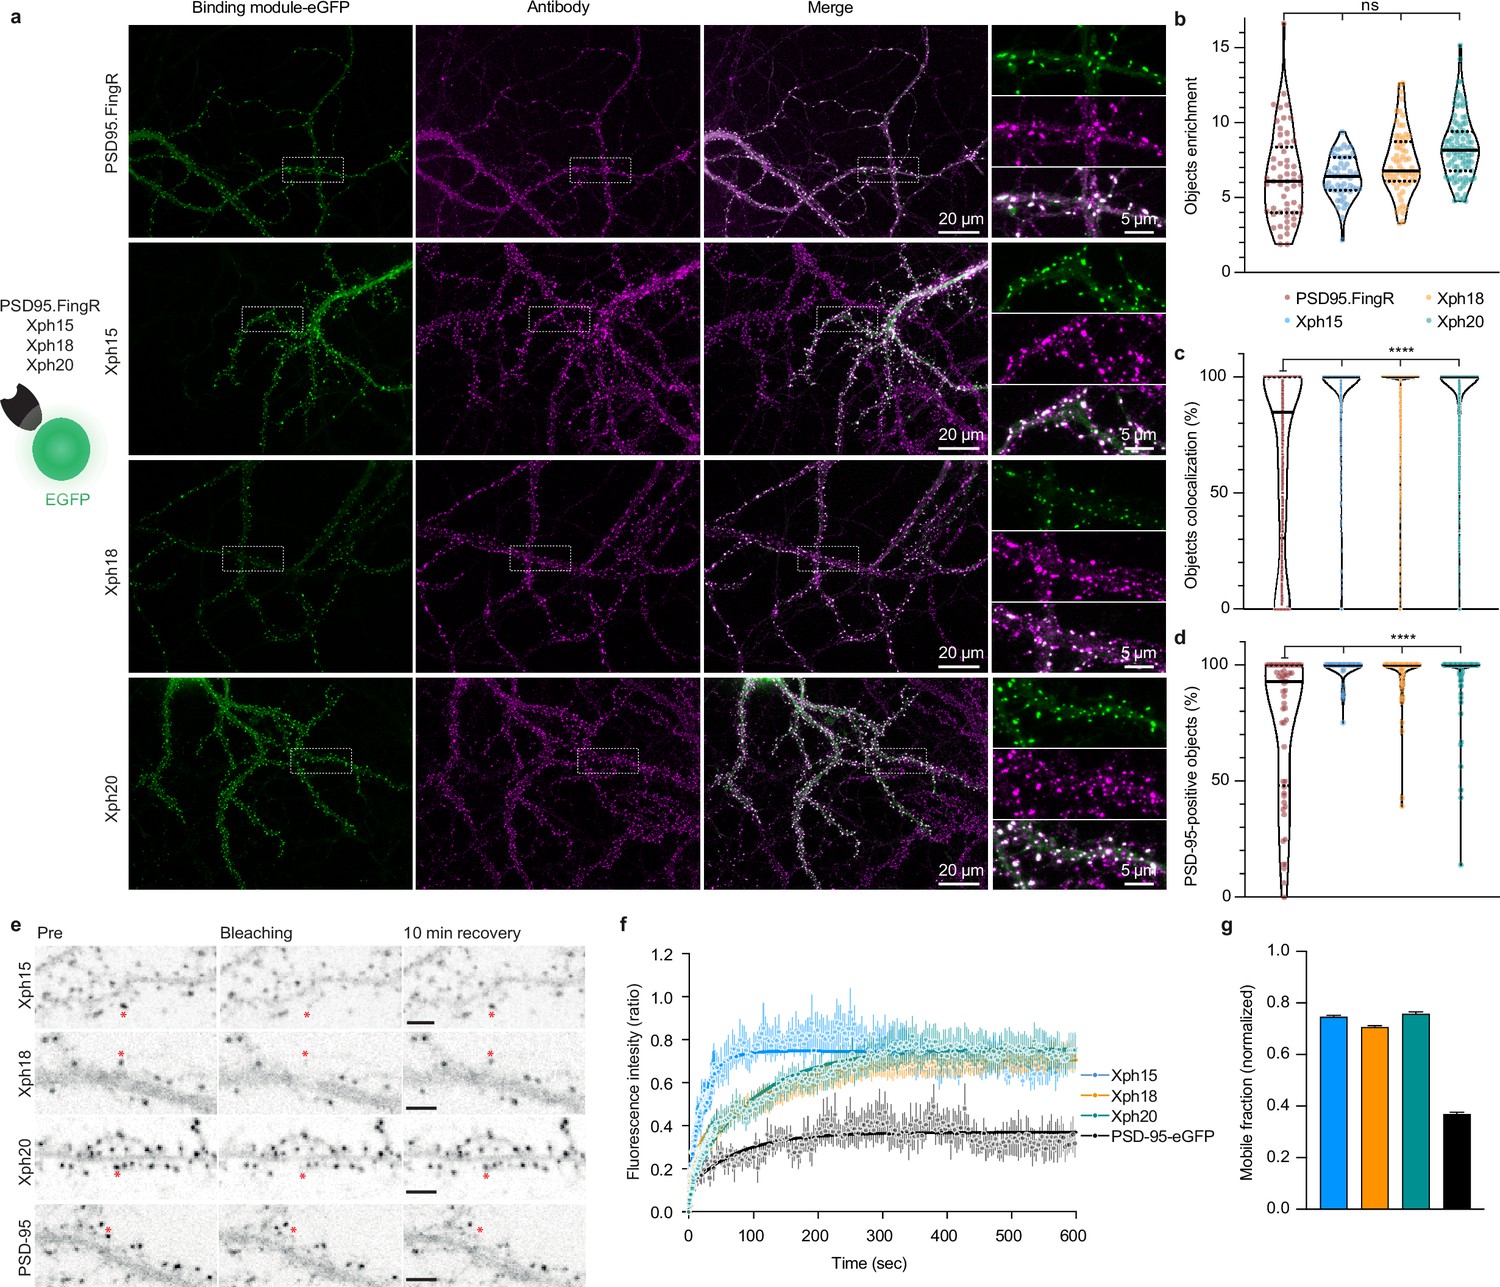
(a) Representative epifluorescence images of the eGFP-fused binding modules vs immunostaining of endogenous PSD-95 domain. For the zoomed regions, top: binding module; middle: antibody staining; bottom: merge. (b) Enrichment of object vs shaft fluorescence signal. Violin plots show median, first and third quartile, and all individual data points (each corresponding to the analysis of a single acquired image) pooled from at least three independent experiments. (c) Percentage of eGFP vs antibody objects colocalization (obtained by determining the percentage of common pixels within a probe labeled object with PSD-95 immunostaining). Violin plots show median, first and third quartile, and all individual data points (each corresponding to a detected object) pooled from at least three independent experiments. (d) Percentage of PSD-95-positive objects defined as objects with more than 50% pixel in common. Violin plots show median, first and third quartile, and all individual data points (each corresponding to the analysis of a single image) pooled from at least three independent experiments. (e) Representative images for fluorescence recovery after photobleaching (FRAP) experiments with eGFP fusion proteins, the red asterisk indicating the bleached dendritic spine. Scale bars 5 µm. (f) Fluorescence recovery analysis (mean ± SEM with fitted curve, n = 8/73, 10/108, 9/107, 5/77 cells/spines for Xph15, Xph18, Xph20, and PSD-95-eGFP, respectively, from at least two independent experiments). (g) Mobile probe fraction (mean ± SEM, n and color code same as f).
-
Figure 3—source data 1
Spreadsheet with the raw object enrichment data (Figure 3b).
- https://cdn.elifesciences.org/articles/69620/elife-69620-fig3-data1-v2.xlsx
-
Figure 3—source data 2
Spreadsheet with the raw object colocalization percentage data (Figure 3c).
- https://cdn.elifesciences.org/articles/69620/elife-69620-fig3-data2-v2.xlsx
-
Figure 3—source data 3
Spreadsheet with the raw PSD-95-positive objects percentage data (Figure 3d).
- https://cdn.elifesciences.org/articles/69620/elife-69620-fig3-data3-v2.xlsx
-
Figure 3—source data 4
Spreadsheet with the fluorescence recovery data (Figure 3f).
- https://cdn.elifesciences.org/articles/69620/elife-69620-fig3-data4-v2.xlsx
-
Figure 3—source data 5
Spreadsheet with the mobile fraction extracted from the fluorescence recovery data (Figure 3g).
- https://cdn.elifesciences.org/articles/69620/elife-69620-fig3-data5-v2.xlsx
Figure 3—figure supplement 1
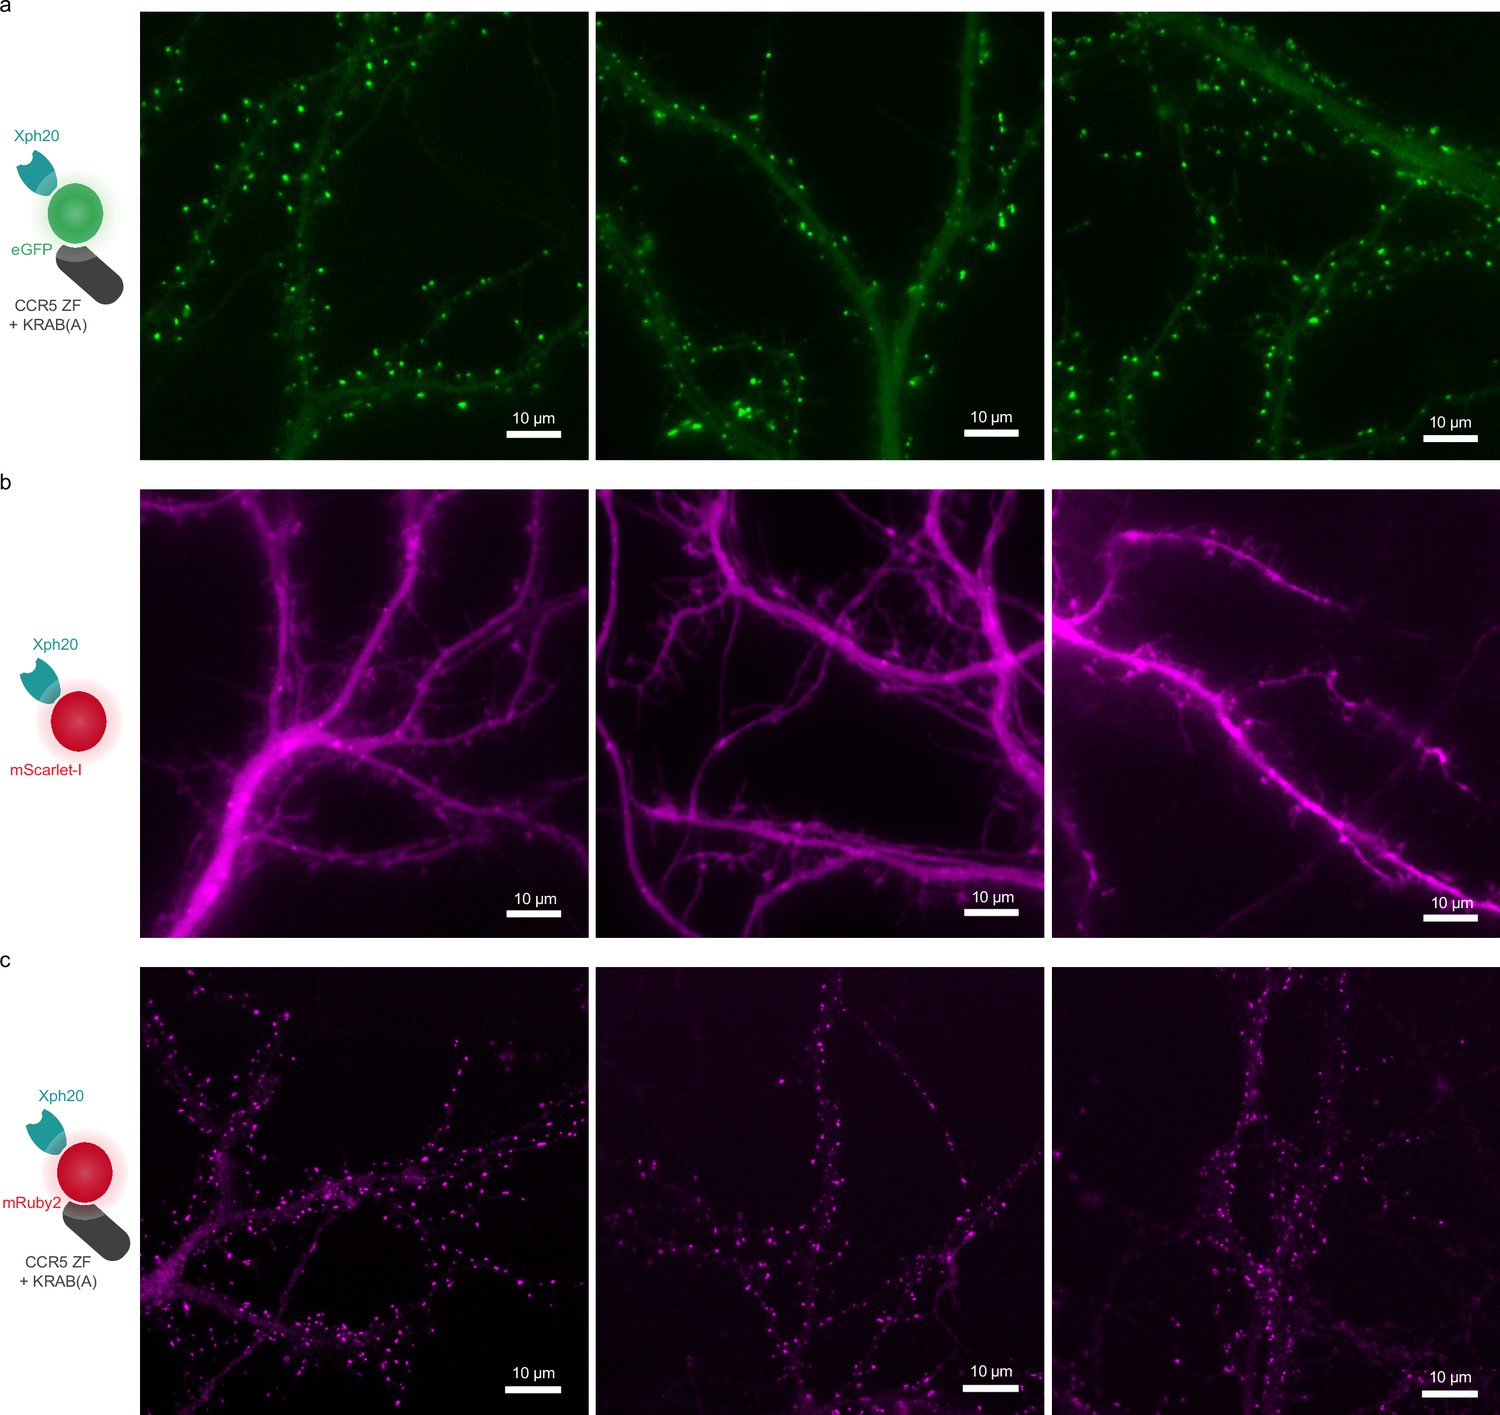
Regulated vs non-regulated expression of Xph20-FP fusion.
(a) Representative images obtained on neurons transfected with Xph20-eGFP fusion (regulated with a zinc finger and a transcription repressor fusion together with the corresponding zinc finger binding site upstream of the promoter on the expression plasmid). (b) Representative images obtained on neurons from the same dissection as (a), and transfected with Xph20-mScarlet-I fusion (non-regulated). (c) Representative images obtained on neurons transfected with Xph20-Ruby2 fusion (regulated).
Figure 4
Evaluation of Xph15 and Xph20 intrabodies specificity.
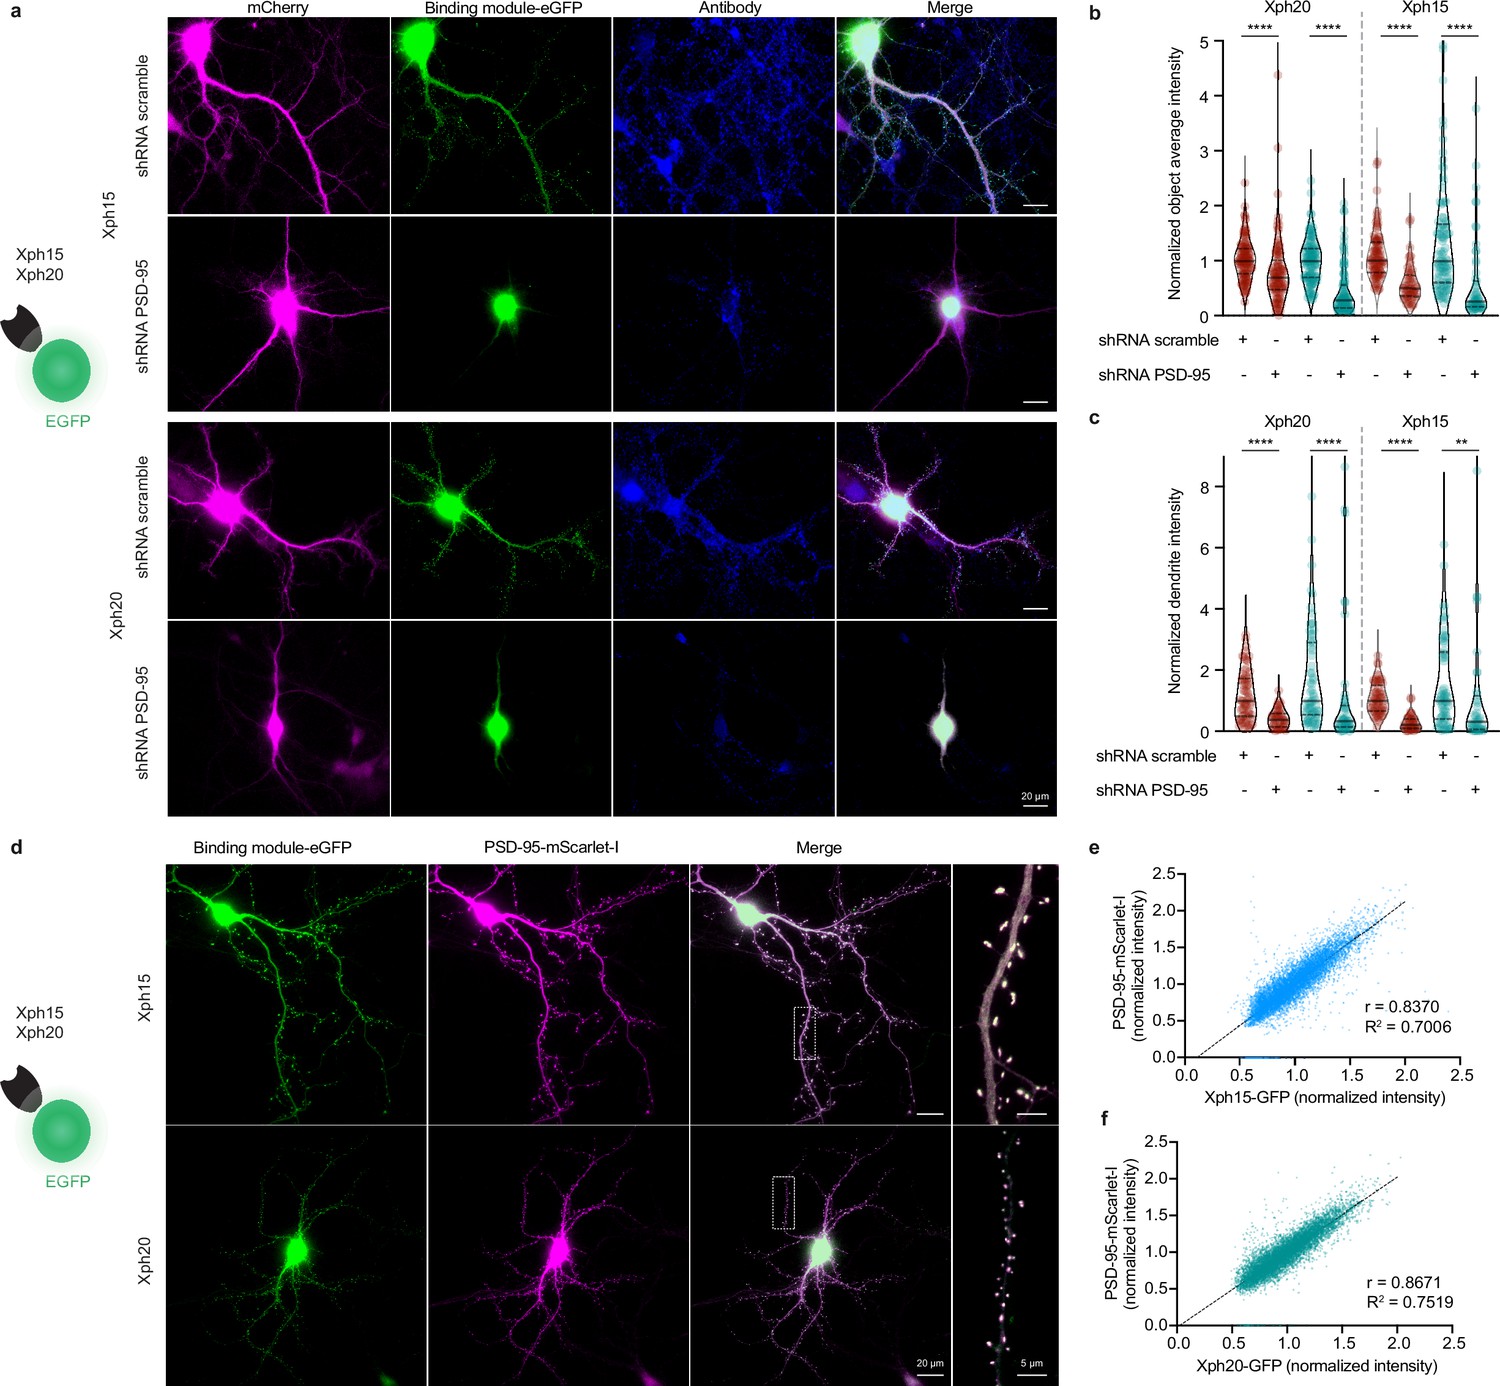
(a) Representative epifluorescence images showing Xph15-eGFP (top) and Xph20-eGFP (bottom) expressed in pyramidal neuron together with a scramble shRNA or the shRNA against PSD-95 both associated to a mCherry soluble fluorescent reporter (magenta). The neurons are fixed and immunostained for PSD-95 (blue). (b) Comparison of objects average fluorescence intensity (red: immunostaining fluorescence signal; teal: Xph-eGFP signal) on neurons transfected with the scramble shRNA or the shRNA against PSD-95. Normalization was performed by using the median of the scramble shRNA condition. Violin plots show median, first and third quartile, and all individual data points (each corresponding to the analysis of a single detected object) pooled from three independent experiments, statistic significances were tested using the nonparametric Kruskal–Wallis test followed by Dunn’s post hoc test. (c) Comparison of dendrites fluorescence intensity (red: immunostaining fluorescence signal; teal: Xph-eGFP signal; integrated fluorescence signal per area units) on neurons transfected with the scramble shRNA or the shRNA against PSD-95. Normalization was performed by using the median of the scramble shRNA condition. Violin plots show median, first and third quartile, and all individual data points (each corresponding to the analysis of a single dendritic fragment) pooled from two independent experiments, statistic significances were tested using the nonparametric Kruskal–Wallis test followed by Dunn’s post hoc test. (d–f) Correlation of Xph15 and Xp20 intrabodies with PSD-95. (d) Representative immunofluorescent images showing Xph15-eGFP (top), Xph20-eGFP (bottom), and PSD-95-mScarlet-I. The dendritic region within the white box is enlarged below to better illustrate colocalization the eGFP and mScarlet-I signal. Scatter plots showing the correlation between Xph15- (e) or Xph20-eGFP (f) and PSD-95-mScarlet-I normalized fluorescence intensity. Pearson correlation coefficients and slopes (simple linear regression) between eGFP and mScarlet-I fluorescent intensity were calculated using GraphPad Prism 8. Data from 67 dendrites and 8362 synapses for Xph15, and 63 dendrites and 8004 synapses for Xph20 (two independent experiments).
-
Figure 4—source data 1
Spreadsheet with the normalized object average intensity data (Figure 4b).
- https://cdn.elifesciences.org/articles/69620/elife-69620-fig4-data1-v2.xlsx
-
Figure 4—source data 2
Spreadsheet with the normalized dendrite intensity data (Figure 4c).
- https://cdn.elifesciences.org/articles/69620/elife-69620-fig4-data2-v2.xlsx
-
Figure 4—source data 3
Spreadsheet with the normalized fluorescence intensity data (Figure 4e).
- https://cdn.elifesciences.org/articles/69620/elife-69620-fig4-data3-v2.xlsx
-
Figure 4—source data 4
Spreadsheet with the normalized fluorescence intensity data (Figure 4f).
- https://cdn.elifesciences.org/articles/69620/elife-69620-fig4-data4-v2.xlsx
Figure 5 with 1 supplement
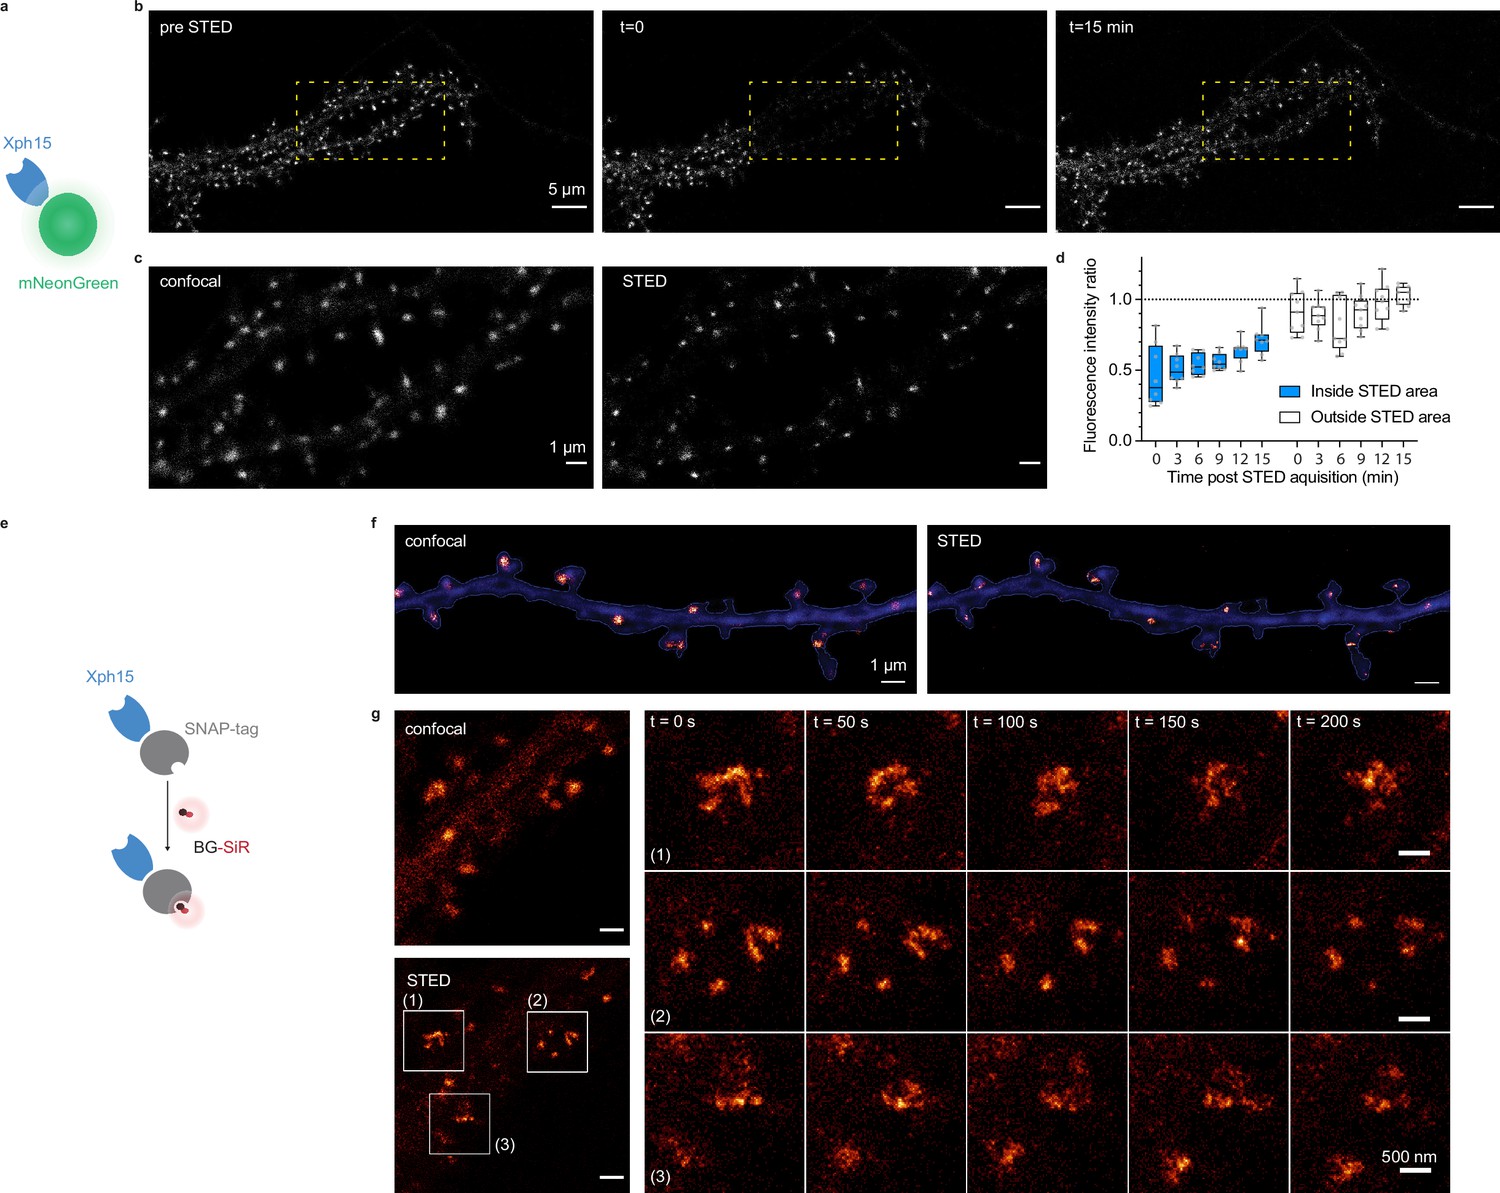
Evaluation of probes for stimulated emission depletion (STED) imaging.
(a) Schematic representation of fluorescent protein-fused STED probe. (b) Representative confocal images of a neuron transfected with Xph15-mNeonGreen before and after STED. The yellow box corresponds to the STED region. (c) Confocal and STED images of the yellow box region from (b). (d) Evolution of fluorescence intensity over time of fluorescent objects subjected or not to STED (n = 8 and 9 for regions outside and inside of STED area, respectively). Box plots show median, first and third quartile, with whiskers extending to the minimum and maximum and all individual data points (each corresponding to a single object) pooled from at least two independent experiments. (e) Schematic representation of SNAP-tag-fused STED probe with the BG-SiR fluorophore. (f) Confocal and STED images of a neuron transfected with Xph15-SNAP-tag after incubation with BG-SiR. (g) Time course of repeated STED acquisitions with Xph15-SNAP-tag/BG-SiR.
-
Figure 5—source data 1
Spreadsheet with the fluorescence intensity ratio data (Figure 5d).
- https://cdn.elifesciences.org/articles/69620/elife-69620-fig5-data1-v2.xlsx
Figure 5—figure supplement 1
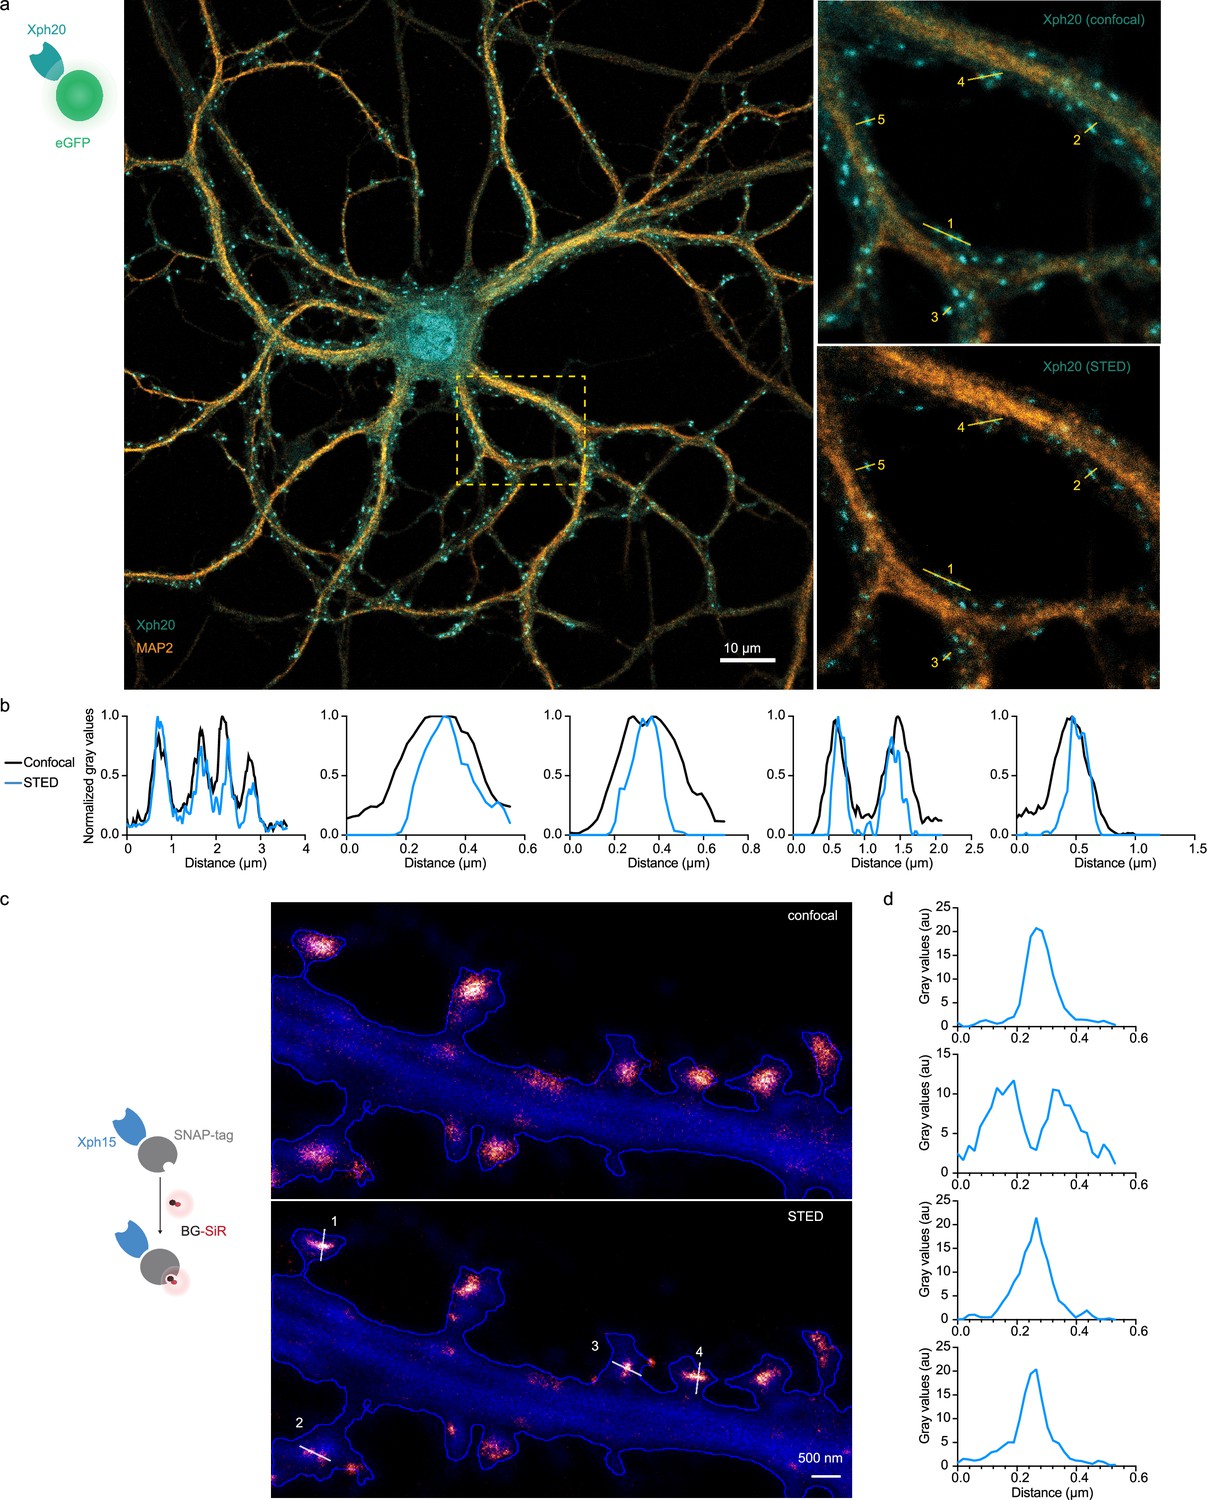
Stimulated emission depletion (STED) imaging.
(a) Representative image obtained on fixed neurons transfected with Xph20-eGFP fusion and immunolabeled with an antibody against MAP2 to identify dendritic shaft. Zoom region obtained by confocal and STED modalities. (b) Intensity profiles of Xph20-eGFP from the linescans indicated in the zoom region from (a). (c) Representative images obtained by confocal and STED modalities on live neurons transfected with Xph15-SNAP-tag fusion and cytosolic GFP (blue), labeled with BG-SiR. (d) Intensity profiles of Xph15-SNAP-tag from the linescans indicated in the zoom region from (c).
Figure 6 with 1 supplement
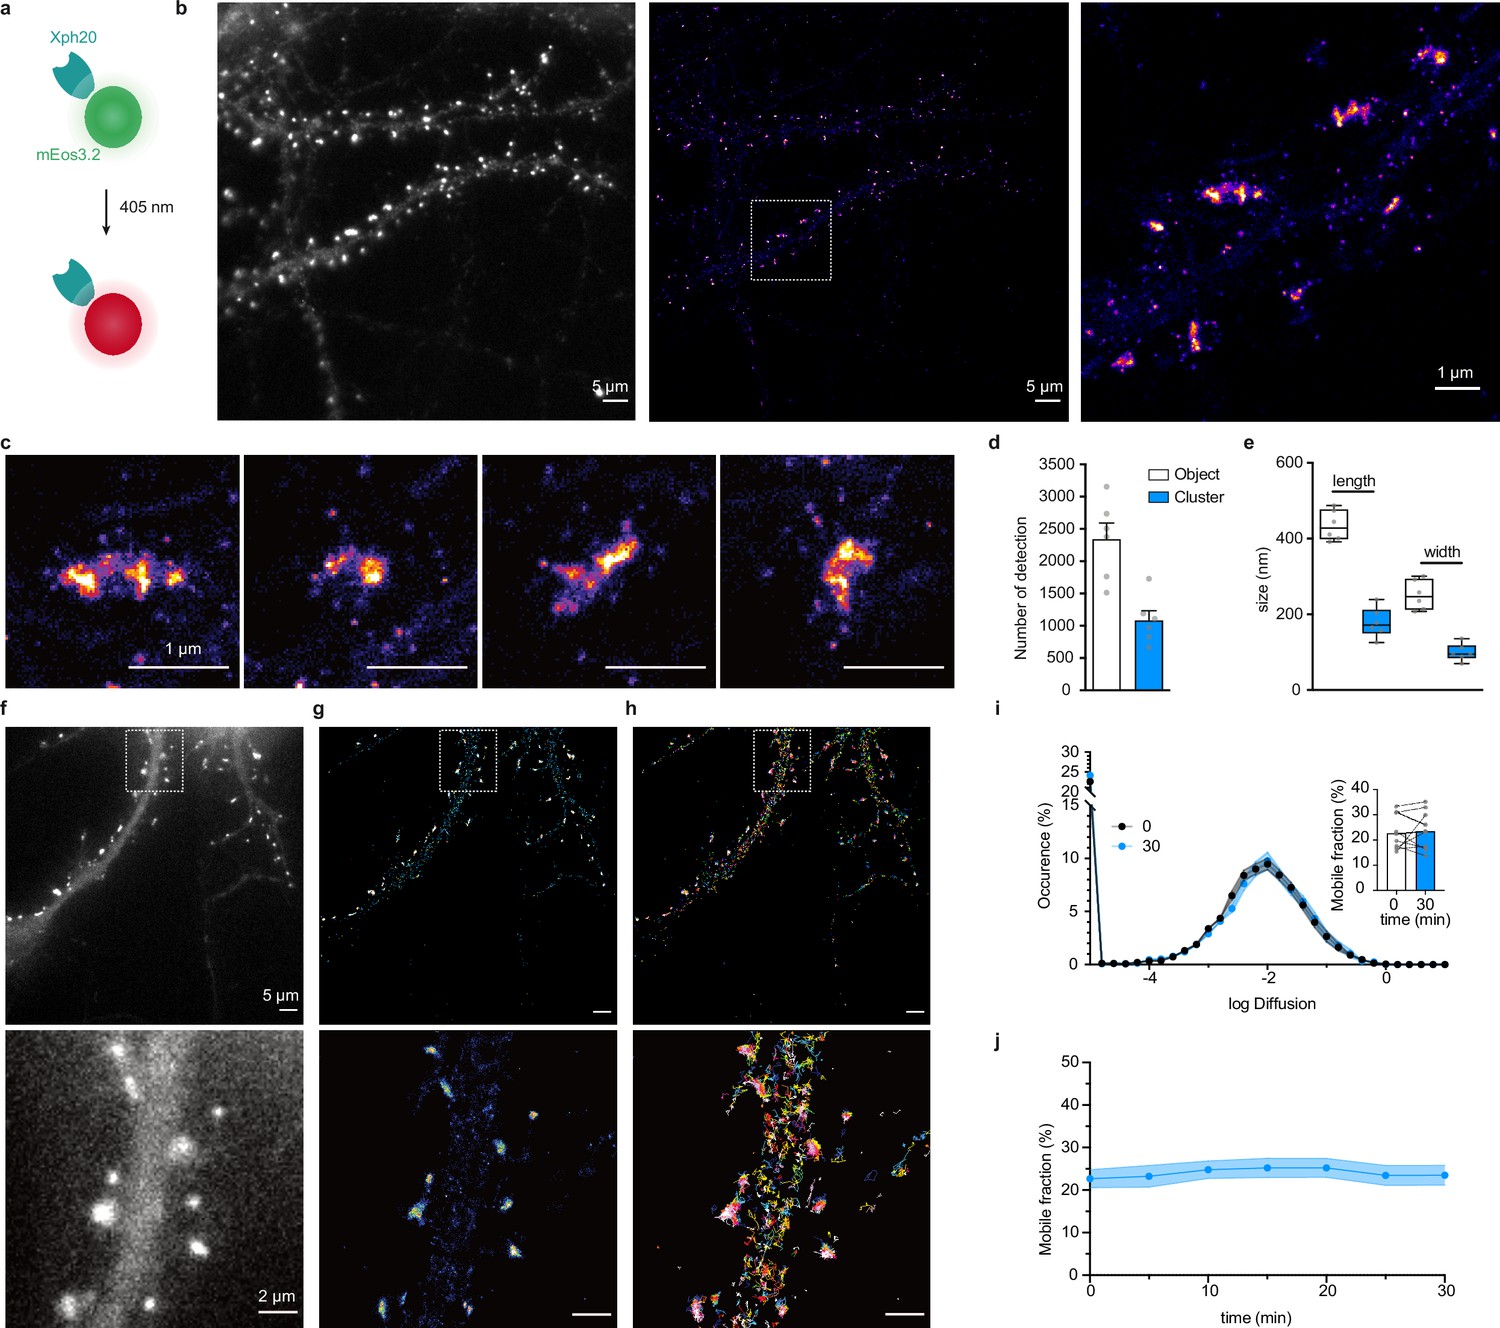
Evaluation of mEos3.2-derived probes for photoactivation localization microscopy (PALM) and spt-PALM applications.
(a) Schematic representation of mEos3.2-fused probe. (b) Representative epifluorescence and PALM images of Xph20-mEos3.2 in fixed culture neurons. Left: epifluorescence image obtained from the native non-photoconverted green form of mEos3.2; middle: super-resolution image obtained by PALM from a sequence of 20,000 images of sparse single molecules of the photoconverted red from of mEos3.2 (scale bar 5 µm); right: zoomed region (scale bar 1 µm). (c) Examples of individual synapses showing PSD-95 organization at the postsynaptic density (‘object’) and sub-synaptic domain (‘cluster’). Scale bar 1 µm. (d) Number of detections in ‘objects’ vs ‘clusters’ (mean ± SEM, each data point represents a single neuron). (e) Morphological analysis of ‘objects’ and ‘clusters’ (mean ± SEM, each data point represents a single neuron). (f–h) Representative epifluorescence and spt-PALM images of live culture neurons expressing Xph20-mEos3.2. epifluorescence of the expressed probe (before photoconversion) (f), super-resolution intensity map obtained by sptPALM from a sequence of 4000 images of sparse single molecules of the photoconverted red from of mEos3.2 (g), and trajectories of PSD-95 tagged with Xph20-mEos3.2 (h). Scale bars 5 and 2 µm for top and bottom images, respectively. (i) Average distribution of instantaneous diffusion coefficients obtained by spt-PALM of PSD-95 labeled with Xph20-mEos3.2 (at 0 min, t0, beginning of the imaging session) or after 30 min of imaging (t30). Error bars indicate cell-to-cell variability. Inset: percentage of the mobile fraction of probes at t0 vs t30 (mean ± SEM, each dot represents a single cell, n = 10). (j) Time course of the percentage of mobile probes (mean ± SEM, each dot represents a single cell, n = 10).
-
Figure 6—source data 1
Spreadsheet with the number of detection data (Figure 6d).
- https://cdn.elifesciences.org/articles/69620/elife-69620-fig6-data1-v2.xlsx
-
Figure 6—source data 2
Spreadsheet with the length and width data (Figure 6e).
- https://cdn.elifesciences.org/articles/69620/elife-69620-fig6-data2-v2.xlsx
-
Figure 6—source data 3
Spreadsheet with the diffusion distribution data (Figure 6i).
- https://cdn.elifesciences.org/articles/69620/elife-69620-fig6-data3-v2.xlsx
-
Figure 6—source data 4
Spreadsheet with the mobile fraction percentage over time data (Figure 6j).
- https://cdn.elifesciences.org/articles/69620/elife-69620-fig6-data4-v2.xlsx
Figure 6—figure supplement 1
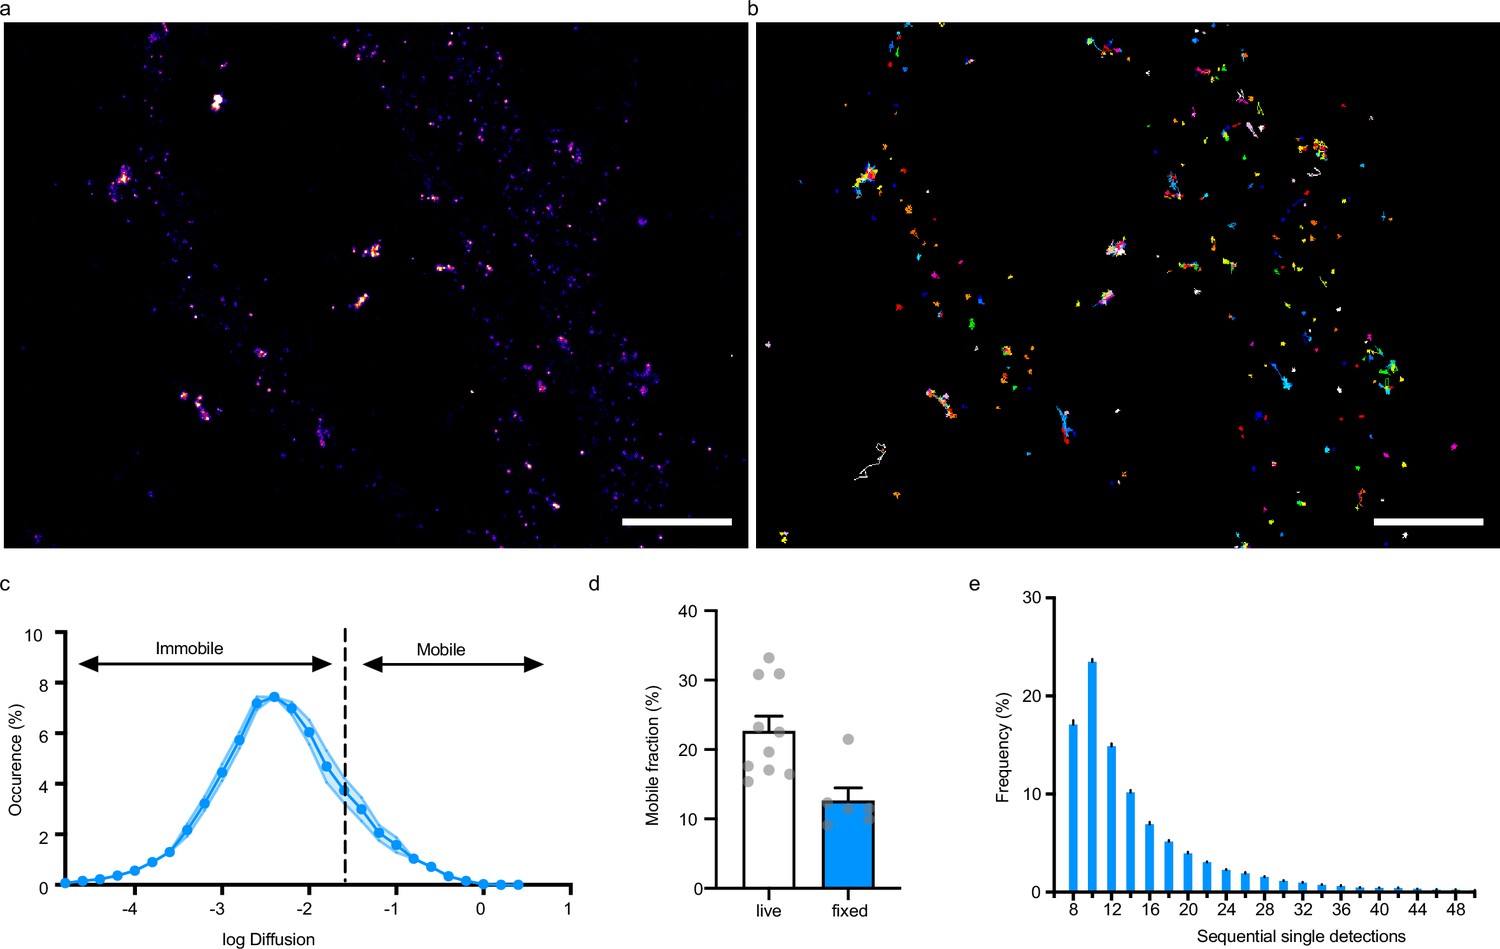
Evaluation of mEos3.2-derived probes for photoactivation localization microscopy (PALM) applications.
(a, b) Representative spt-PALM images of fixed culture neurons expressing Xph20-mEos3.2. Super-resolution intensity map obtained by sptPALM from a sequence of 4000 images of sparse single molecules of the photoconverted red from of mEos3.2 (a) and trajectories of Xph20-mEos3.2 (b). (c) Average distribution of instantaneous diffusion coefficients obtained by spt-PALM of Xph20-mEos3.2. Error bars indicate cell-to-cell variability. (d) Percentage of the mobile fraction of probes (mean ± SEM, each dot represents a single cell). (e) Frequency distribution of sequential single Xph20-mEos3.2 detections.
-
Figure 6—figure supplement 1—source data 1
Spreadsheet with the diffusion distribution data (Figure 6—figure supplement 1c).
- https://cdn.elifesciences.org/articles/69620/elife-69620-fig6-figsupp1-data1-v2.xlsx
-
Figure 6—figure supplement 1—source data 2
Spreadsheet with the mobile fraction percentage data (Figure 6—figure supplement 1d).
- https://cdn.elifesciences.org/articles/69620/elife-69620-fig6-figsupp1-data2-v2.xlsx
-
Figure 6—figure supplement 1—source data 3
Spreadsheet with the frequency distribution of single detection data (Figure 6—figure supplement 1e).
- https://cdn.elifesciences.org/articles/69620/elife-69620-fig6-figsupp1-data3-v2.xlsx
Figure 7 with 1 supplement
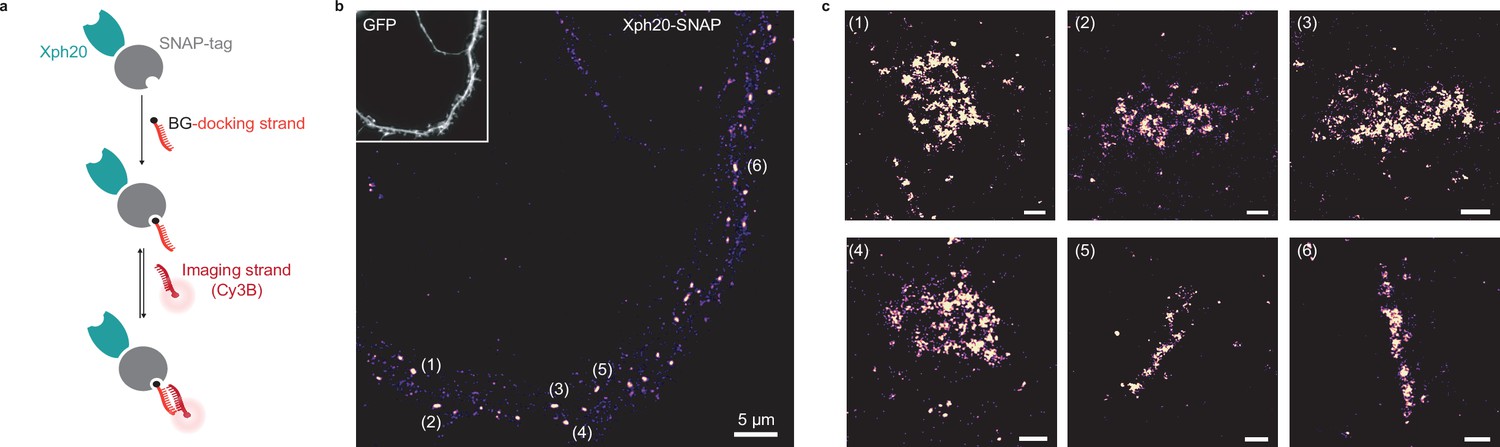
Evaluation of SNAP-tag-derived probes for DNA-PAINT super-resolution microscopy.
(a) Probe design and labeling scheme (BG: benzylguanine). (b) Reconstructed DNA-PAINT image (10 Hz, 32,000 frames) of Xph20-SNAP-tag in the dendrites of a 14 day in vitro (DIV) hippocampal primary neuron (inset corresponding to soluble GFP). (c) Magnified views of the regions marked in (b) (scale bars 100 nm).
Figure 7—figure supplement 1
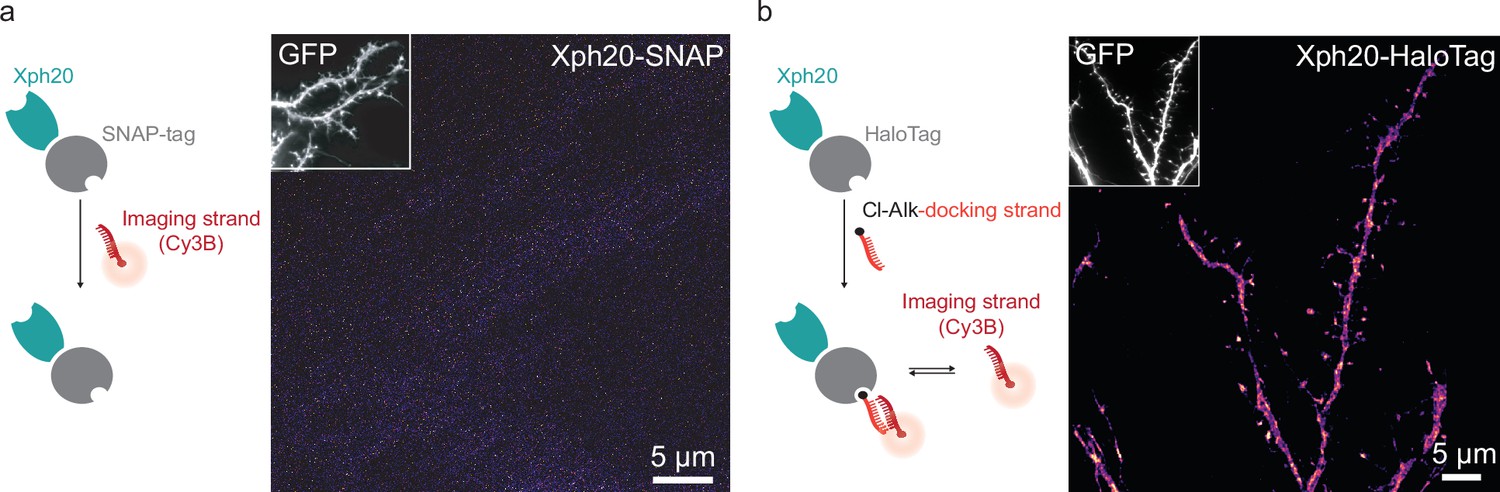
DNA-PAINT imaging.
(a) Representative DNA-PAINT image obtained on neurons co-transfected with a soluble GFP marker and Xph20-SNAP-tag, not incubated with BG-docking strand and in the presence of Cy3-imaging strand. (b) Representative DNA-PAINT image obtained on neurons co-transfected with a soluble GFP marker and Xph20-HaloTag (Cl-Alk: chloroalkane). The reconstructed image shows an evident lack of synaptic enrichment.
Figure 8 with 3 supplements

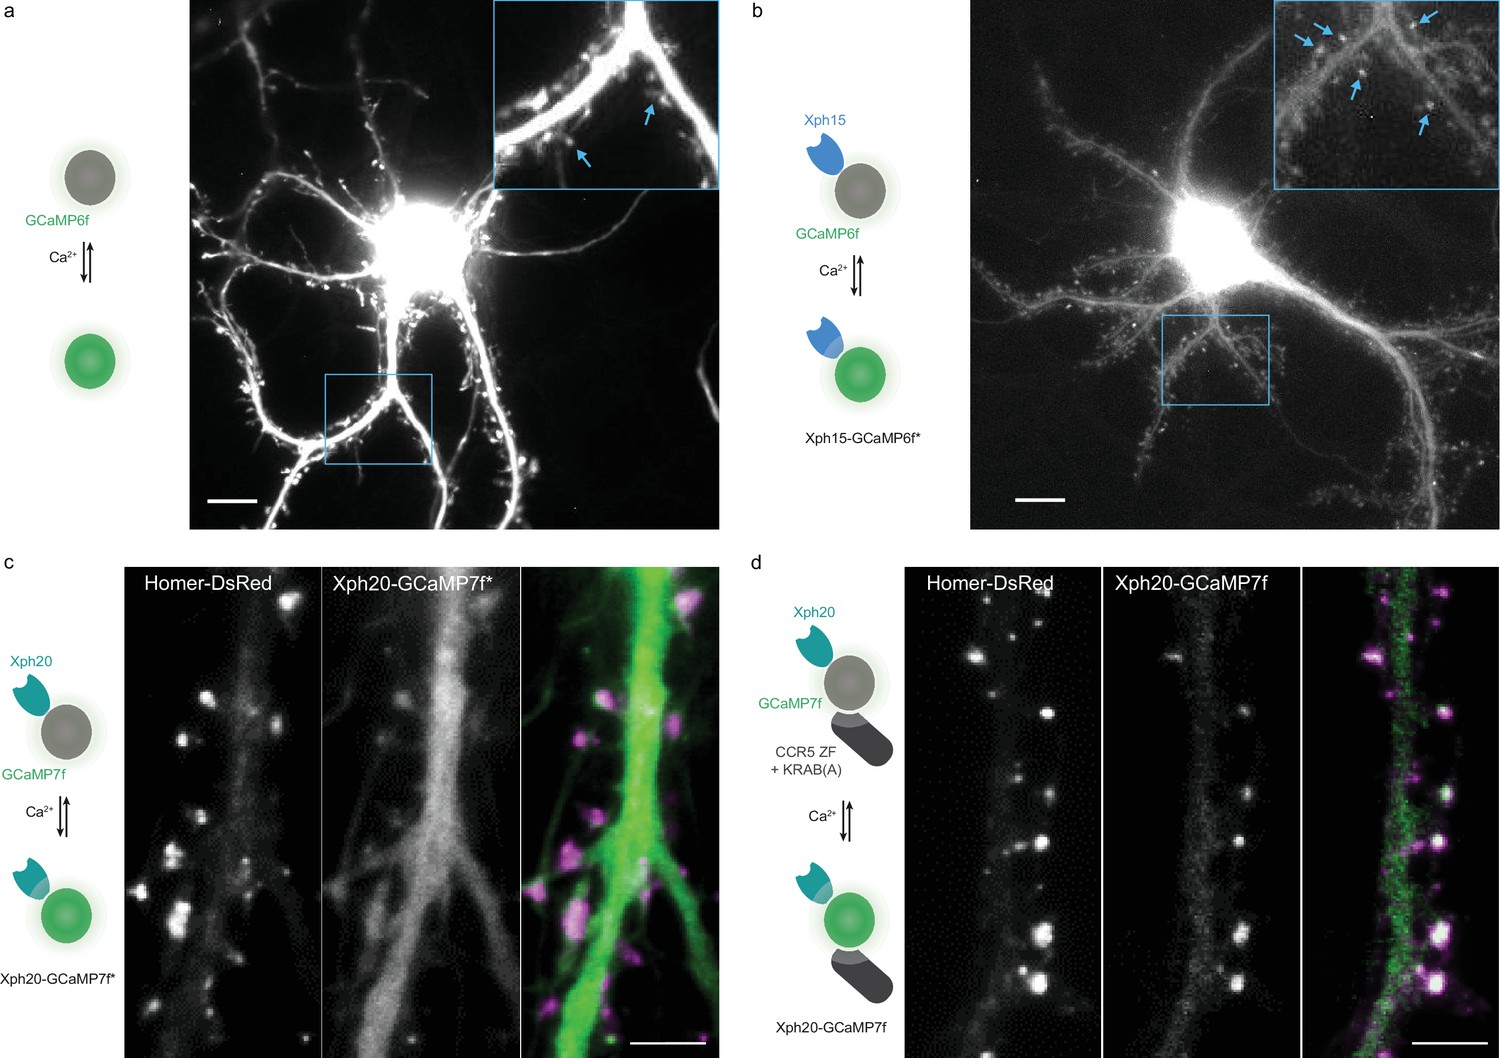
Application of the ReMoRa method for the synaptic targeting of calcium reporters.
(a) Schematic representation of calcium signaling probe. (b) Comparison of the expression profile of targeted and regulated (Xph20-GCaMP7f, bottom panel) vs parental calcium sensor (GCaMP7f, top panel) for GCaMP7f synaptic targeting (GCaMP in green and Homer-DsRed in magenta in the merged images). (c) Linescans from (b) comparing the probe repartition between shaft and spine compartments. The linescans show a clear enrichment of the regulated probe in neuronal spines. (d) Probes synaptic enrichment determined using Homer-DsRed staining as a synaptic marker (n = 9 and 7 cells for GCaMP7f and Xph20-GCaMP7f, respectively, from two independent experiments, p=0.0002 by Mann–Whitney test).
-
Figure 8—source data 1
Spreadsheet with the synaptic enrichment data (Figure 8d).
- https://cdn.elifesciences.org/articles/69620/elife-69620-fig8-data1-v2.xlsx
Figure 8—figure supplement 1
Engineered calcium reporters expression.
(a, b) Maximum projection of the fluorescence movies collected for hippocampal neurons expressing GCaMP6f (a) or Xph15-GCaMP6f* (non-regulated) (b). In the insets, the blue arrows indicate individual spines. Scale bars, 10 µm. (c, d) Comparison of the expression profile of regulated (Xph20-GCaMP7f) vs non-regulated probe (Xph20-GCaMP7f*) for GCaMP7f synaptic targeting. (c) Representative images obtained on neurons co-transfected with a Homer-DsRed as a synaptic marker and GCaMP7f fused to Xph20 without the expression regulation system (Xph20-GCaMP7f*). (d) Representative images obtained on neurons co-transfected with a Homer-DsRed as a synaptic marker and GCaMP7f fused to Xph20 with the expression regulation system (Xph20-GCaMP7f). The expression regulation system allows to obtain a robust synaptic enrichment. Scale bars, 5 µm.
Figure 8—video 1
Spontaneous responses of GCaMP6f.
Figure 8—video 2
Xph15-GCaMP6f expressed in hippocampal Banker cultures and recorded at 50 Hz.
Tables
Key resources table
| Reagent type (species) or resource | Designation | Source or reference | Identifiers | Additional information |
|---|---|---|---|---|
| Strain, strain background (Escherichia coli) | BL21 CodonPlus (DE3)-RIPL | Agilent | Cat# 230280 | |
| Strain, strain background (E. coli) | T7 Express lysY | New England Biolabs | Cat# C3010I | |
| Cell line (simian) | COS-7 | ECACC-87021302 | ||
| Antibody | Anti-GluA2 ATTO-647N (mouse monoclonal) | Gift from Eric Gouaux, coupled in lab. | PMID:23926273 | 30 ng/ml |
| Antibody | Anti-PSD-95 (mouse monoclonal) | Thermo Fisher | Cat# MA1-046 | 1:1000 |
| Antibody | Goat anti-mouse Alexa Fluor 568 (goat polyclonal) | Thermo Fisher | Cat# A-11031 | 1:1000 |
| Antibody | Anti-MAP2 (chicken polyclonal) | Synaptic Systems | Cat# 188 006 | 1:2000 |
| Antibody | Goat anti-chicken Alexa Fluor 594 (goat polyclonal) | Thermo Fisher | Cat# A-11042 | 1:800 |
| Recombinant DNA reagent | Numerous | See Supplementary file 2 | https://www.addgene.org/Matthieu_Sainlos/ | |
| Sequence-based reagent | Numerous | See Supplementary file 3 | ||
| Peptide, recombinant protein | PSD-95-12 [61-249] | Rimbault et al., 2019 | PMID:31586061 | |
| Peptide, recombinant protein | Xph20 | Rimbault et al., 2019 | PMID:31586061 | https://www.addgene.org/Matthieu_Sainlos/ |
| Peptide, recombinant protein | Xph18 | Rimbault et al., 2019 | PMID:31586061 | https://www.addgene.org/Matthieu_Sainlos/ |
| Peptide, recombinant protein | Xph15 | Rimbault et al., 2019 | PMID:31586061 | https://www.addgene.org/Matthieu_Sainlos/ |
| Peptide, recombinant protein | Xph0 | Rimbault et al., 2019 | PMID:31586061 | https://www.addgene.org/Matthieu_Sainlos/ |
| Peptide, recombinant protein | Stg15 (Ac-YSLHANTANRRTTPV) | Rimbault et al., 2019 | PMID:31586061 | |
| Peptide, recombinant protein | FITC-Stg15 (FITC-PEG-YSLHANTANRRTTPV) | Rimbault et al., 2019 | PMID:31586061 | |
| Peptide, recombinant protein | [Stg15]2 | Rimbault et al., 2019 | PMID:31586061 | |
| Peptide, recombinant protein | FITC-[Stg15]2 | Rimbault et al., 2019 | PMID:31586061 | |
| Commercial assay or kit | X-treme GENE HP DNA transfection reagent | Roche | ||
| Commercial assay or kit | Effectene Kit | QIAGEN | ||
| Chemical compound, drug | SNAP-Cell 647-SiR (BG-SiR) | New England Biolabs | Cat# S9102S | |
| Software, algorithm | PyMOL | Warren DeLano | RRID:SCR_000305 | |
| Software, algorithm | Fiji | PMID:22743772 | RRID:SCR_002285 | |
| Software, algorithm | Adobe Illustrator | Adobe Systems | RRID:SCR_010279 | |
| Software, algorithm | Prism 7.04, 8 | GraphPad | RRID:SCR_002798 | |
| Software, algorithm | TopSpin v4.0 | Bruker | RRID:SCR_014227 | |
| Software, algorithm | MetaMorph v7.8.10.0 | Molecular Devices | RRID:SCR_002368 | |
| Software, algorithm | LI-FLIM v1.2.12 | Lambert Instruments | ||
| Software, algorithm | POLARstar Omega v5.11 | BMG Labtech | ||
| Software, algorithm | NMRPipe v8.6 | Delaglio et al., 1995 | PMID:8520220 | |
| Software, algorithm | Sparky v3.113 | D. Goddard and D. G. Kneller, SPARKY 3, University of California, San Francisco | RRID:SCR_014228 | |
| Software, algorithm | POLARstar MARS data analysis software v3.20 | BMG Labtech | ||
| Software, algorithm | Patchmaster | Heka Elektronik | ||
| Software, algorithm | SR-Tesseler | Levet et al., 2015 | PMID:26344046 | |
| Software, algorithm | IJ-Macro_FRAP-MM | https://github.com/fabricecordelieres/IJ-Macro_FRAP-MM | ||
| Software, algorithm | IJ-Plugin_Metamorph-Companion | https://github.com/fabricecordelieres/IJ-Plugin_Metamorph-Companion | ||
| Software, algorithm | PICASSO | Schnitzbauer et al., 2017 | PMID:28518172 | |
| Other | SNAPligand-modified DNA oligomer | Schnitzbauer et al., 2017 | PMID:28518172 | 5' BG-TTATACATCTA 3' |
| Other | Cy3b-labeled DNA imager strands | Schnitzbauer et al., 2017 | PMID:28518172 | 5' CTAGATGTAT-Cy3b 3' |
Additional files
-
Supplementary file 1
FRAP data.
- https://cdn.elifesciences.org/articles/69620/elife-69620-supp1-v2.xlsx
-
Supplementary file 2
List of plasmids used in this work (c = commercial source; *from this study).
- https://cdn.elifesciences.org/articles/69620/elife-69620-supp2-v2.xlsx
-
Supplementary file 3
Primers used in this study.
- https://cdn.elifesciences.org/articles/69620/elife-69620-supp3-v2.xlsx
-
Transparent reporting form
- https://cdn.elifesciences.org/articles/69620/elife-69620-transrepform1-v2.docx
Download links
A two-part list of links to download the article, or parts of the article, in various formats.
Downloads (link to download the article as PDF)
Open citations (links to open the citations from this article in various online reference manager services)
Cite this article (links to download the citations from this article in formats compatible with various reference manager tools)
Engineering paralog-specific PSD-95 recombinant binders as minimally interfering multimodal probes for advanced imaging techniques
eLife 13:e69620.
https://doi.org/10.7554/eLife.69620


