The influence of biological and lifestyle factors on circulating cell-free DNA in blood plasma
- Gynaecological Cancer Research Group, Adult Cancer Program, Lowy Cancer Research Centre, Department of Obstetrics & Gynaecology, School of Women's and Children's Health, Faculty of Medicine & Health, University of New South Wales, Australia
Figures
Figure 1
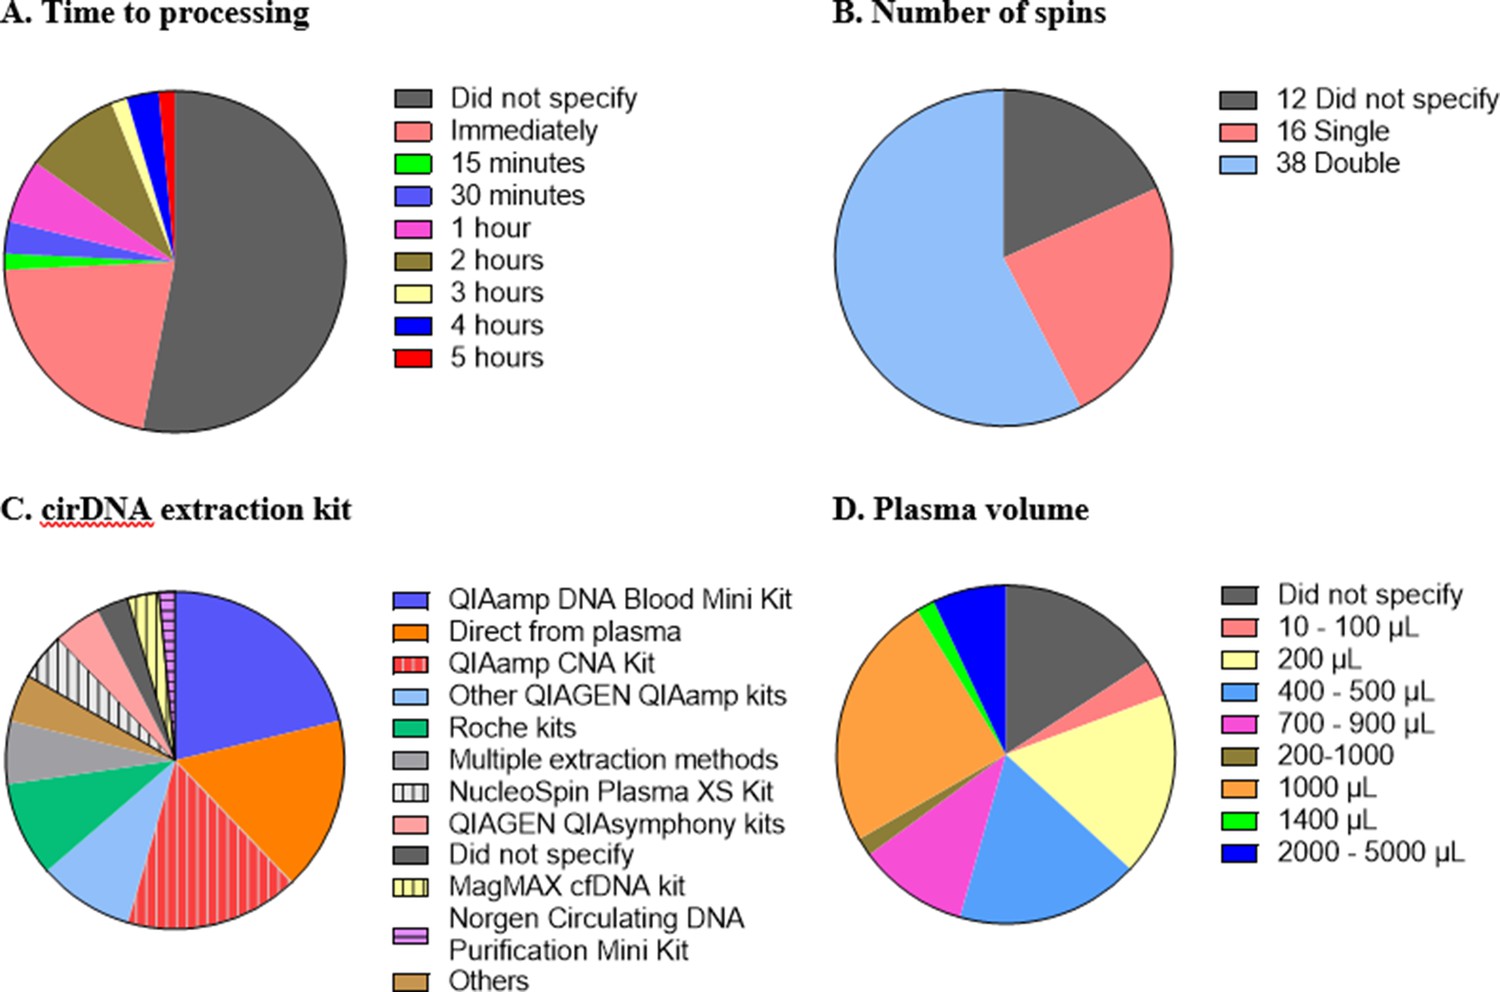
Technical aspects and protocol reporting in the 66 publications summarised in this review.
(A) Interval time between blood collection and processing. (B) Number of centrifugations performed to obtain plasma samples from whole blood. (C) cirDNA extraction methods (specialised cirDNA kits are denoted by stripes). (D) Input volume of plasma into extraction (D).
Figure 2
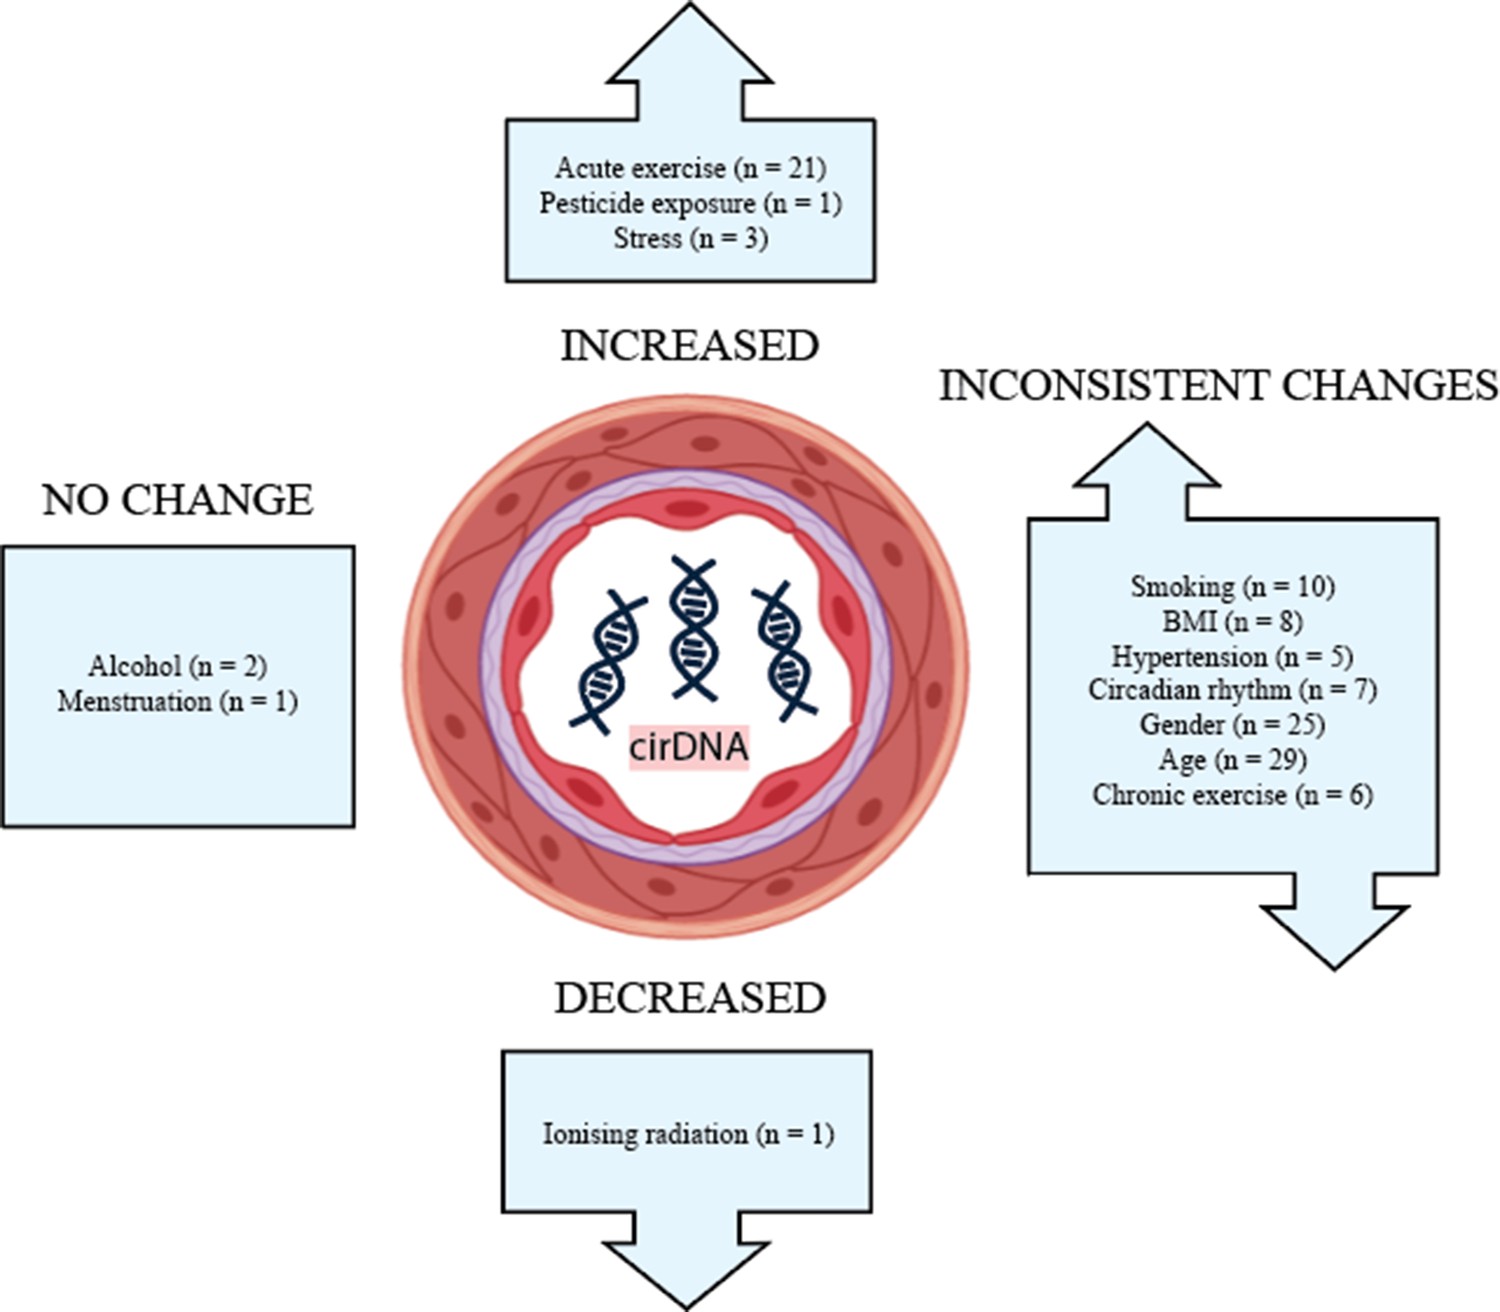
The effect of biological and lifestyle factors on blood plasma cirDNA concentration in healthy individuals and patients with various diseases and treatments.
Tables
Table 1
Association of cirDNA with gender.
| Authors (year) | Subject | Conclusion to gender differences on cirDNA amount | ||
|---|---|---|---|---|
| Cohort | Male (n) | Female (n) | ||
| Coulet et al., 2000 | Head and neck squamous cell carcinoma patients (n = 117) | 105 | 12 | No effect |
| Sozzi et al., 2001 | Control (n = 43) | NA | NA | No effect |
| Lung cancer patients (n = 84) | 72 | 12 | No effect (p=0.403) | |
| Tamkovich et al., 2005 | Healthy volunteers (n = 35) | 15 | 20 | No effect |
| Zhong et al., 2007 | Healthy adults (n = 54) | 27 | 27 | No effect |
| Lee et al., 2011 | Lung cancer patients (n = 134) | 13 | 121 | No effect (p=0.947) |
| Beiter et al., 2011 | Recreational runners (n = 53) | 34 | 19 | No effect |
| Jylhävä et al., 2012 | Nonagenarians (n = 258) | 62 | 196 | Significantly higher in male (p=0.018) |
| Kim et al., 2014 | Control (n = 34) | 15 | 19 | No effect (p=0.598) |
| Gastric cancer patients (n = 30) | 23 | 7 | Significantly higher in female (p=0.01) | |
| Spindler et al., 2014 | Metastatic colorectal cancer patients (n = 86) | 55 | 31 | No effect (p=0.24) |
| Jylhävä et al., 2014 | Finnish population | 609–681 | 366–409 | Significantly higher in male (p=0.00) |
| Jeong et al., 2015 | Haemodialysis patients (n = 95) | NA | NA | No effect |
| Diabetic haemodialysis patients (n = 50) | NA | NA | No effect (p=0.22) | |
| Spindler et al., 2015 | Metastatic colorectal cancer patients (n = 223) | 126 | 97 | No effect (p=0.1) |
| Chen et al., 2016 | Stage I and II non-small cell lung cancer patients | 33 | 25 | No effect (p=0.318) |
| Hsieh et al., 2016 | Oesophageal squamous cell carcinoma patients | 70 | 11 | No effect (p=0.315) |
| Karlas et al., 2017 | Non-alcoholic fatty liver disease patients (n = 58) | 32 | 26 | 90 bp fragment – no effect; 222 bp fragment – higher in female (p=0.0051) |
| Li et al., 2017 | All lymphoma patients (n = 174) | 107 | 67 | No effect (p=0.769) |
| Diffuse large B cell lymphoma (n = 98) | 61 | 37 | No effect (p=0.507) | |
| Çayir et al., 2018 | Control (n = 51) | 28 | 23 | Significantly higher in male |
| Greenhouse workers (n = 72) | 41 | 31 | Significantly higher in male | |
| Meddeb et al., 2019 | Healthy individuals (n = 104) | 62 | 42 | Significantly higher in male (p=0.048) |
| Colorectal cancer patients (n = 118) | 68 | 50 | No effect | |
| van der Drift et al., 2010 | Healthy controls (n = 21) | 19 | 2 | No effect |
| Lung cancer patients (n = 46) | 30 | 16 | ||
| Catarino et al., 2012 | Healthy controls (n = 205) | 78 | 127 | Significantly higher in male (p<0.001) |
| Lung cancer patients (n = 104) | 86 | 20 | No effect (p=0.123) | |
| Wu et al., 2019 | Newly diagnosed lymphoma patients (n = 60) | 32 | 28 | No effect (p=0.76) |
| Treated lymphoma patients (n = 107) | 59 | 48 | No effect (p=0.4967) | |
| Alghofaili et al., 2019 | Healthy volunteers (n = 275) | 124 | 151 | Significantly higher in male (p=0.000103) |
| Caglar et al., 2020 | Thyroiditis (n = 33) | NA | NA | No effect (p>0.7) |
| Benign (n = 37) | NA | NA | No effect (p=0.054) | |
| Malignant (n = 30) | NA | NA | No effect | |
| All thyroid patients (n = 100) | NA | NA | No effect (p=0.08) | |
| Bryk et al., 2019 | T2D patients (n = 111) | NA | NA | No effect (p=0.51) |
| Bu et al., 2020 | Gastric cancer patients (n = 61) | 41 | 20 | No effect |
-
T2D: type II diabetes.
Table 2
Association of cirDNA with age.
| Authors (year) | Subject | Age analysed | Conclusion to age effect on cirDNA amount |
|---|---|---|---|
| Sozzi et al., 2001 | Control (n = 43) | - | No effect |
| Lung cancer patients (n = 84) | 39–59 (n = 31) vs. 60–69 (n = 34) vs. ≥70 (n = 19) | ||
| Sozzi et al., 2003 | Lung cancer patients(n = 100)Mean age: 65.1 ± 8.9 | ≤60 vs. 61–71 vs. ≥72 | Significantly higher with increasing age |
| Tamkovich et al., 2005 | Healthy participants (n = 35 [15 M + 20 W]) | 18–53 | No effect |
| Zhong et al., 2007 | Healthy adults | 20–40 vs. 41–60 vs. >60 | No effect (men and women mixed)Significantly higher cirDNA for >60 years old compared to 20–40 and 41–60 groups in women only |
| Lee et al., 2011 | Lung cancer patients (n = 134) | ≤65 (n = 108) vs. >65 (n = 26) | No effect (p=0.333) |
| Beiter et al., 2011 | Recreational runners (n = 53)Mean age: 34.8 | 17–60 years | No effect |
| Jylhävä et al., 2011 | Control (n = 11, females, 22–37 years old) vs. nonagenarians (n = 12, females, born 1917) | Significantly higher in elderly (p=0.035, < 0.001, 0.015)* | |
| Jylhävä et al., 2013 | Young controls (n = 30 [9 M + 21 W], aged 19–30 years old) vs. nonagenarians (n = 144 [43 M + 101 W], aged ≥90 years old) | Significantly higher in nonagenarian group (p=0.002) | |
| Kim et al., 2014 | Control (n = 34)Mean age = 63.79 ± 6.76 years | <65 vs. ≥65 | No effect |
| Gastric cancer patientsMean age = 66.72 ± 13.16 years | Significantly higher with increasing age | ||
| Spindler et al., 2014 | Metastatic colorectal cancer patients (n = 86)Median age: 66 (37–83) | <66 (n = 43) vs. >66 (n = 43) | No effect |
| Jylhävä et al., 2014 | Women (n = 366–409, mean age 60.48 [8.98]) | Significantly higher with increasing age (p=0.002) | |
| Women (oestrogen HRT user, n = 131–148, mean age 58.57 [6.88]) | No effect (p=0.391) | ||
| Women (oestrogen + progestin HRT user, n = 87–98, mean age 57.23 [6.39]) | No effect (p=0.869) | ||
| Men (n = 609–681), mean age (58.31 [7.91]) | No effect (p=0712) | ||
| Breitbach et al., 2014a | Male athletes (n = 26 [13 handball players + 13 triathletes])Mean age 24.7 (3.1) | No effect | |
| Jeong et al., 2015 | Haemodialysis patients (n = 95) | 58 ± 1.5 | No effect |
| Haemodialysis patients (n = 95) | 58 ± 1.5 | No effect (p=0.80) | |
| Diabetic haemodialysis patients (n = 50) | 66.4 ± 1.8 | No effect (p=0.93) | |
| Spindler et al., 2015 | Metastatic colorectal cancer patients (n = 223)Median age: 63 (35-82) years old | ≤63 (n = 119) vs. >63 (n = 104) | No effect (p=0.39) |
| Korzeneva et al., 2015 | Average age for all groups: 48.5 ± 16.3 years | ||
| Never-exposed control group (n = 109) | *21–86 | No effect (p=0.13) | |
| Chronic gamma-neutron radiation-exposed group (n = 88) | *26–79 | No effect (p=0.6) | |
| Chronic tritium β-radiation-exposed group (n = 88) | *20–80 | No effect (p=0.06) | |
| Never-exposed control group (n = 109) | <65 years old vs. ≥65 years old | Significantly higher with increasing age | |
| Chronic gamma-neutron radiation-exposed group (n = 88) | <65 years old vs. ≥65 years old | Significantly lower with increasing age | |
| Chronic tritium β-radiation-exposed group (n = 88) | <65 years old vs. ≥65 years old | No effect | |
| Hsieh et al., 2016 | Oesophageal squamous cell carcinoma patients (n = 81 [70 M + 11 F]) | <60 (N = 43) vs. >60 (N = 38) | No effect (p=0.588) |
| Tosevska et al., 2016 | Institutionalised elderly aged 65–98 (n = 105) | 65–98 | No effect |
| Karlas et al., 2017 | Non-alcoholic fatty liver disease patients (n = 58) | Age (mean age 62.1 ± 11 years old) | No effect |
| Li et al., 2017 | All lymphoma patients (n = 174) | ≤60 (N = 117) vs. ≥60 (N = 57) | No effect (p=0.414) |
| Diffuse large B cell lymphoma (n = 98) | ≤60 (N = 61) vs. ≥60 (N = 37) | No effect (p=0.668) | |
| Beranek et al., 2017 | Exacerbated psoriasis vulgaris patients (n = 28 [15 M + 13 W]) | 18–69 (median age 50) | No effect |
| Teo et al., 2019 | Young (n = 3) vs. elderly (n = 3) vs. healthy centenarians (n = 3) vs. unhealthy centenarians (n = 3) | No effect | |
| Meddeb et al., 2019 | Healthy individuals (n = 104)Age range: 18–69 | <47 (n = 52) vs. ≥47 (n = 52) | Significantly higher with increasing age (p=0.009) |
| Healthy individuals (n = 104) | Young (n = 79) vs. older (n = 25)† | Significantly higher with increasing age (p=0.0026) | |
| Colorectal cancer patients (n = 118)Age range: 22–91 | <65 (n = 52) vs. ≥65 (n = 66) | No effect | |
| Colorectal cancer patients (n = 118) | Young (n = 25) vs. older (n = 93)† | No effect (p=0.913) | |
| van der Drift et al., 2010 | Healthy controls | <60 vs. ≥60 | No effect (p=0.43) |
| Lung cancer | <60 vs. ≥60 | No effect (p=0.25) | |
| Catarino et al., 2012 | Healthy controls (n = 205) | <64 vs. ≥64 | No effect (p=0.342) |
| Lung cancer patients (n = 104) | <64 vs. ≥64 | No effect (p=0.614) | |
| Wu et al., 2019 | Newly diagnosed lymphoma patients (n = 60) | <60 vs. ≥60 | No effect (p=0.4041) |
| Treated lymphoma patients (n = 107) | <60 vs. ≥60 | No effect (p=0.3127) | |
| Alghofaili et al., 2019 | Healthy volunteers (n = 275) | Correlation plot (0–57 years old; median 27 years old) | No effect (r = –0.09) |
| Caglar et al., 2020 | Thyroiditis (n = 33) | 37.6 ± 10.9 | No effect |
| Benign (n = 37) | 54.1 ± 13.1 | No effect | |
| Malignant (n = 30) | 47.8 ± 11.9 | No effect | |
| All thyroid patients (n = 100) | Significant positive correlation (p<0.05) | ||
| Bryk et al., 2019 | T2D patients | No effect (p=0.63) | |
| Bu et al., 2020 | Gastric cancer patients (n = 61) | 40–83 | No effect (p=0.323 and p=0.280)‡ |
-
*
Three different extraction kits.
-
†
Using same cutoff for both healthy and cancer cohort as the median age (56) of all individuals tested.
-
‡
Two different extraction kits.
-
HRT: hormone replacement therapy; T2D: type II diabetes.
Table 3
cirDNA measurements in acute exercise.
| Authors (year) | Setting | Subject | CirDNA measurement time points |
|---|---|---|---|
| Atamaniuk et al., 2004 | Race (did not specify duration and distance) | Healthy half-marathon runners (n = 25 [12 M + 13 F]) | Before the race, immediately after race, 2 hr post-race |
| Margeli et al., 2005 | 246 km ultra-marathon | Healthy males (n = 15) | Pre-race, post-race (within 15 min), post-race (48 hr) |
| Atamaniuk et al., 2008 | 6 hr race | Experienced ultra-marathon runners (n = 14 [9 M + 5 F]) | Pre-race, post-race, post-race (2 hr), post-race (24 hr) |
| Fatouros et al., 2010 | Control (rest): remain seated/lying in the labExercise: 45 min treadmill run followed by increase in speed until exhaustion | Moderately trained men (n = 11) | Pre-exercise, post-exercise, post-exercise (0.5 hr, 1, 2, 3, 4, 5, 6, 8, 10, 24 hr) |
| Atamaniuk et al., 2010 | Six sets of six weightlifting exercise | Male competitive weightlifters (n = 12) | Pre-exercise, post-exercise (immediately after), post-exercise (2 hr) |
| Beiter et al., 2011 | Public 10 km cross-country interval run | Recreational runners (n = 53 [34 M + 19 W]) | Pre-exercise, immediately after |
| Incremental test on treadmill (until exhaustion) | Well-trained male athletes (n = 9) | Pre-exercise, immediately after, post-exercise (30 min) | |
| Strenuous treadmill until exhaustion | Well-trained endurance male athlete (n = 1), moderately trained female participant (n = 1), well-trained recreational male runner (n = 1) | Pre-exercise, mid-exercise (3, 6, 9, 12, 15 min), post-exercise (5, 10, 15, 20, 30 min) | |
| de Sousa et al., 2012 | Overload training programme (day 1–8) then 10 × 800 m sprints on day 9 | Highly competitive male endurance runners (n = 24) | Day 1, day 9 (pre-exercise [–140 min], post-exercise [immediate, 80 min]) |
| Breitbach et al., 2014a | Treadmill until exhaustion (average 17.9 min) | Male athletes (n = 26 [13 handball players + 13 triathletes]) | Pre-exercise, post-exercise |
| Beiter et al., 2014 | Increment treadmill until exhaustion | Well-trained male athletes (n = 6) | Pre-exercise, post-exercise (immediately), post-exercise (30 min) |
| High-intensity 60 min cycling | Untrained males (n = 6) | Pre-exercise, post-exercise (immediately), post-exercise (3 hr) | |
| Regularly endurance trained males (n = 6) | Pre-exercise, post-exercise (immediately), post-exercise (3 hr) | ||
| Breitbach et al., 2014b | 10 km relay race | Recreational runners (n = 10 [6 M + 4 F]) | Pre-exercise, post-exercise |
| Tug et al., 2015 | Incremental treadmill test | Healthy male controls (n = 3) | Pre-exercise, post-exercise (immediately), post-exercise (90 min) |
| Healthy female controls (n = 3) | |||
| Sex-mismatched haematopoietic stem cell transplantation patients (n = 5 females with male donors) | |||
| Sex-mismatched haematopoietic stem cell transplantation patients (n = 2 males with female donors) | |||
| Helmig et al., 2015 | Incremental treadmill test until exhaustion | Physically active men (n = 5) | Pre-exercise, post-exercise (immediately after, 10, 30, 90 min) |
| Frühbeis et al., 2015 | Increment cycling test until exhaustion | Physically active male (more than 3 hr/week) tested twice (n = 1) | Pre-exercise, mid-exercise (3, 6, 9, 12, 15, 18, 21 min), post-exercise (immediately after, 10, 30, 90 min) |
| Tug et al., 2017b | Acute strength exercise (whole-body exercises, deadlifts, squats and muscle-targeted exercises) | Regular strength trained men (n = 16) | 12th, 13th, 14th, 15th, 16th exercise |
| High-intensity training | n = 5/16 | Before first exercise, after last exercise | |
| Differential training | n = 5/16 | Before first exercise, after last exercise | |
| Conservation training | n = 6/16 | Before first exercise, after last exercise | |
| Tug et al., 2017a | Incremental bicycle exercise until exhaustion | Competitive male cyclists (n = 11) | Pre-exercise, post-exercise, post-exercise (90 min) |
| Stawski et al., 2017 | Treadmill until exhaustion | Averaged-trained men (n = 11) | Pre- and post-1st bout, 2nd bout and 3rd bout of exercise |
| Haller et al., 2017 | Stepwise increment running test until exhaustion | Athletes (n = 14 [7 M + 7 W]) | Pre-exercise, mid-exercise (3, 6, 9, 12, 15, 18, 21 min), post-exercise (15, 30 min) |
| 40 min endurance run at 9.6 km/hr | Athletes (n = 13 [7 M + 6 W]) | Pre-exercise, post-exercise | |
| Hummel et al., 2018 | Treadmill until exhaustion | Male students of sports science (n = 20) | Pre-exercise (–2 min), post-exercise (2, 15, 30, 40 min) |
| Haller et al., 2018 | 5 × 40 m sprints (5.94 ± 0.50 s) | Healthy subjects (n = 9 [7 M + 2 F]) | Pre-exercise, post-exercise |
| Treadmill test | Male football players playing more than 70 min in game and participated in treadmill test (n = 10) | Pre-exercise, post-exercise | |
| Season football game | Pre-exercise, post-exercise | ||
| Ferrandi et al., 2018 | High-intensity interval exercise (30 min) | Healthy male subjects (n = 14 [seven normal weight and seven obese]) | Pre-exercise, post-exercise, post-exercise (1 hr) |
| Ohlsson et al., 2020 | Cycling until maximal heart rate | Healthy volunteers (n = 8 [4 M and 4 W]) | Pre-exercise, sub-max load, max load, post-exercise (30, 90 min) |
| Mavropalias et al., 2021 | Eccentric cycling | Men unaccustomed to eccentric exercise (n = 20) | Pre-exercise, post-exercise, post-exercise (24, 48, 72 hr) |
Additional files
-
Supplementary file 1
Impact of biological and lifestyle factors on cirDNA level.
- https://cdn.elifesciences.org/articles/69679/elife-69679-supp1-v1.xlsx
Download links
A two-part list of links to download the article, or parts of the article, in various formats.
Downloads (link to download the article as PDF)
Open citations (links to open the citations from this article in various online reference manager services)
Cite this article (links to download the citations from this article in formats compatible with various reference manager tools)
The influence of biological and lifestyle factors on circulating cell-free DNA in blood plasma
eLife 10:e69679.
https://doi.org/10.7554/eLife.69679


