The influence of biological and lifestyle factors on circulating cell-free DNA in blood plasma
- Gynaecological Cancer Research Group, Adult Cancer Program, Lowy Cancer Research Centre, Department of Obstetrics & Gynaecology, School of Women's and Children's Health, Faculty of Medicine & Health, University of New South Wales, Australia
Abstract
Research and clinical use of circulating cell-free DNA (cirDNA) is expanding rapidly; however, there remain large gaps in our understanding of the influence of lifestyle and biological factors on the amount of cirDNA present in blood. Here, we review 66 individual studies of cirDNA levels and lifestyle and biological factors, including exercise (acute and chronic), alcohol consumption, occupational hazard exposure, smoking, body mass index, menstruation, hypertension, circadian rhythm, stress, biological sex and age. Despite technical and methodological inconsistences across studies, we identify acute exercise as a significant influence on cirDNA levels. Given the large increase in cirDNA induced by acute exercise, we recommend that controlling for physical activity prior to blood collection is routinely incorporated into study design when total cirDNA levels are of interest. We also highlight appropriate selection and complete reporting of laboratory protocols as important for improving the reproducibility cirDNA studies and ability to critically evaluate the results.
Introduction
Circulating cell-free DNA (cirDNA) in blood has been extensively researched due to its potential as a biomarker across multiple settings including oncology, prenatal testing, toxicology, organ transplantation, and cardiovascular and autoimmune diseases. In cancer alone, cirDNA-related publications have increased exponentially (Trigg et al., 2018) with nearly 2000 publications solely in 2020. Considering the enormous investment and effort that has gone into the development of cirDNA biomarkers, understanding the biological and lifestyle factors that impact cirDNA levels is important for appropriate study design.
The release of cirDNA from cells into the blood is thought to be driven by apoptosis, which is closely linked to inflammation and cell damage. In this review, we aim to gather and summarise all published studies that have investigated an association between biological and lifestyle factors and cirDNA. By ‘biological factor‘, we refer to intrinsic physiological variables such as body mass index (BMI), menstruation, hypertension, circadian rhythm, stress, biological sex and age. By ‘lifestyle factor’, we refer to all external variables that involve individual choice, such as exercise, alcohol consumption, occupation and smoking. We have chosen to include only studies conducted on plasma and exclude all studies on serum as serum has been shown to be the less preferred substrate due to its propensity for leukocyte DNA contamination and dependence on processing time (Ammerlaan and Betsou, 2019; Trigg et al., 2018; Warton et al., 2014). The use of serum was the only exclusion criterion that we imposed. We included all identified plasma studies regardless of the sample size, cohort type (healthy or diseased) and laboratory methodology. The cohorts included, but were not limited to, people with cancer, hormone therapy-treated women and haemodialysis patients. In those studies, there are confounding factors related to pathology, and the cirDNA level is partly, if not primarily, influenced by disease-driven cirDNA changes.
In total, this review summarises the results from 66 individual studies published between January 2000 and January 2021 (Supplementary file 1). It is important to note that we did not aim to provide a statistical evaluation of the impacts of each factor on cirDNA level, but rather to create a summary of research endeavours in the field and to raise awareness of the need for large, adequately powered studies with appropriate technical protocols.
1 Biological factors
1.1 Body mass index
BMI, calculated by dividing weight (kg) by the square of height (m2), categorises an individual as underweight (<18.5), normal weight (18.5–24.9), overweight (25–29.9) or obese (>30). BMI, however, does not distinguish whether the weight is fat or muscle mass, hence its usage is not accurate for groups of people such as body builders and athletes.
Eight individual studies on cirDNA and BMI were identified, containing six healthy cohorts (n = 1464) and six cohorts that included individuals with various diseases and women undergoing hormone replacement therapy (HRT). Five of the studies conducted on healthy individuals, totalling to 1098 subjects, reported no relationship between cirDNA and BMI. They contained relatively large, combined numbers of healthy male and female subjects (763 males and 701 females), but most did not sex-disaggregate their data for analysis. A single study reported significantly higher cirDNA level with increasing BMI in a group of 366 healthy women (Jylhävä et al., 2014). Although this is the only study that discovered an association in healthy individuals, it has the strongest statistical power, albeit no information on how the cirDNA was processed (time to processing, number of spins and extraction method).
A positive correlation between BMI and cirDNA was found in 62 hepatitis-related liver fibrosis patients (46 males and 16 females) (Yan et al., 2018). However, in 30 gastric cancer patients (Kim et al., 2014), 218 women receiving oestrogen and/or progestin hormone treatment (Jylhävä et al., 2014), 58 non-alcoholic fatty liver disease patients (Karlas et al., 2017) and 113 type II diabetes (T2D) patients (Bryk et al., 2019) all did not show any relationship between BMI and cirDNA level. It may be that the effect of BMI on cirDNA is moderate and requires a large sample size (such as in the Jylhävä et al., 2014 study) for the effect to be observed. The positive correlation reported in the fibrosis patients may be due to BMI being associated with the disease itself (Cristina et al., 2018). If BMI is indeed linked to cirDNA, one proposed mechanism is that obesity disrupts the balance of the adipose tissue microenvironment, resulting in adipocytes undergoing apoptosis and/or necrosis and releasing cirDNA into the circulation (Nishimoto et al., 2016; Yan et al., 2018).
As discussed in Section 4, accurate cirDNA quantification is strongly dependent on extraction and measurement methods. Limiting discussion to studies that either measured cirDNA directly from plasma or used a dedicated extraction kit, two studies from the same group reported no relationship between BMI and cirDNA concentration in a total of 402 nonagenarians (Jylhävä et al., 2012; Jylhävä et al., 2013), while a single study with 62 liver fibrosis patients reported a positive relationship (Yan et al., 2018). Given the methodological limitations and the lack of consistent results, a definitive answer regarding the effect of BMI on cirDNA levels is still pending.
It is accepted that BMI is not an accurate reflection of obesity (Nuttall, 2015). The question then arises, if cirDNA is not correlated with BMI, is it correlated with fat mass itself? This was further supported by data from a cohort of 131 people (88 men and 44 women) investigated during medical examination. Higher visceral (abdominal) fat area (VFA ≥100 cm2), as determined by computed tomography, positively correlated with plasma single-stranded DNA concentration (Nishimoto et al., 2016). The authors further showed that cirDNA released from obese mice can bind to TLR9 receptors expressed by macrophages, leading to cell accumulation and assisting in causing chronic low inflammation associated with obesity (Nishimoto et al., 2016). In humans, although acute inflammation is associated with cirDNA increase, the correlation with chronic inflammation is inconclusive (Frank, 2016).
BMI is well known to be a risk factor for T2D (Al-Goblan et al., 2014; Bhowmik et al., 2015), a state where reduced insulin production or insulin resistance causes high blood glucose and ultimately leads to many physiological complications. Higher cirDNA has been found to be positively correlated with higher fasting glucose in 113 T2D patients (Bryk et al., 2019), but not in healthy female and male controls or females receiving oestrogen and/or progestin (Jylhävä et al., 2014). Furthermore, cirDNA is positively correlated with insulin levels in healthy women and women receiving oestrogen. but not in healthy men and women receiving oestrogen and progestin (Jylhävä et al., 2014).
1.2 Menstruation
The menstrual cycle is the regular succession of menstruation and ovulation in women. During the follicular phase, the endometrium thickens from approximately 5.4 mm to 9.2 mm (Tsuda et al., 2018). If fertilisation is absent, menstruation follows and is characterised by breakdown of the outer endometrial epithelium layer via apoptosis (Armstrong et al., 2017; Kokawa et al., 1996; Tabibzadeh, 1996) and extensive angiogenesis (Demir et al., 2010).
A single study examined the impact of menstruation on plasma cirDNA levels (Yuwono et al., 2021). Matched plasma samples from 40 women at the menstruating and non-menstruating phases of the cycle were compared, for total and endothelium-derived cirDNA, and no differences were observed. The strengths of this study were the adequate sample size (powered at 90% to detect 30% change), optimum cirDNA processing and good assay sensitivity.
These findings were unexpected given the extensive cell death and proliferation that occurs during the menstrual cycle. In addition to apoptosis occurring within the endometrium, leukocyte numbers increase during menstruation and contribute to the matrix metalloproteinases that break down the endometrial tissue (Maybin and Critchley, 2015); however, the eventual leukocyte cell death was not reflected by an increase in cirDNA amount. Shedding of apoptotic cell debris into the uterine cavity may account for lack of cirDNA increase during menstruation (Greystoke et al., 2013). This contrasts with scenarios like cancer or any diseases involving internal tissue damage, in which cell death occurs completely surrounded by stroma and therefore apoptotic or necrotic DNA is more likely to spill over into the circulation.
1.3 Hypertension
Hypertension, defined by World Health Organization (WHO), as having diastolic blood pressure (DBP) and systolic blood pressure (SBP) of ≥140 mm Hg and ≥90 mm Hg, respectively, can lead to stroke, kidney failure, blindness, rupture of blood vessels and cognitive impairment. The elevated pressure can cause endothelial cell DNA damage, inflammation and oxidative stress (Ranchoux et al., 2016), all of which could potentially result in cirDNA changes.
Five individual studies on cirDNA and hypertension were identified, containing four healthy cohorts (n = 1247) and five cohorts that included patients with various diseases and women undergoing HRT. Overall, conflicting findings were reported. No correlation between cirDNA levels and hypertension was found in 258 nonagenarians (Jylhävä et al., 2012), 218 women receiving oestrogen and/or progestin therapy (Jylhävä et al., 2014), 14 healthy women (Brodbeck et al., 2020) and 113 T2D patients (Bryk et al., 2019). The use of HRT has been shown to improve blood pressure (Butkevich et al., 2000; McCubbin et al., 2002) while the synergy between T2D and hypertension is well established (Lastra et al., 2014). By contrast, in 366 healthy women and 609 healthy men, cirDNA was positively correlated with SBP and/or DBP (Jylhävä et al., 2014). cirDNA was also positively correlated with SBP in 95 haemodialysis patients, 50 of whom were also diabetic (Jeong et al., 2015). Taking into account only studies that use cirDNA dedicated extraction kits or direct from plasma measurement (Brodbeck et al., 2020; Jeong et al., 2015; Jylhävä et al., 2012) retains a mixed picture of the impact of hypertension on cirDNA levels. It is likely that the effect, if any, is small, and may be mitigated by interaction with gender and HRT use.
Due to its global prevalence, the effects of hypertension on cirDNA are of interest. Future studies should include hypertensive people both with and without medication, as well as healthy controls. The studies should be disaggregated by sex and include subjects selected for the absence of other comorbidities and lifestyle variables that can potentially be confounding factors.
1.4 Circadian rhythm
The circadian rhythm, driven by the suprachiasmatic nucleus of the anterior hypothalamus of the brain, influences physiological profiles such as temperature, hormone levels and urine volume, as well as behaviour such as activity and sleep. Daytime is characterised by high body temperature, high urine volume, low melatonin and high cortisol, while the opposite occurs during night-time (Czeisler and Buxton, 2011; Silver and Schwartz, 2005). Disturbances in circadian rhythm lead to increased risk for a range of cancers including lung, colon, bladder and prostate cancers (Parent et al., 2012; Wendeu-Foyet et al., 2018).
Seven individual studies on cirDNA and circadian rhythm were identified, containing seven healthy cohorts (n = 73) and two cancer patient cohorts (colorectal and lung cancers). Overall, there is mixed evidence regarding circadian rhythm influence on cirDNA. No differences in cirDNA as a function of time were observed in a group of 11 healthy subjects measured at 7 AM, 12 PM and 5 PM (Korabecna et al., 2011) or in 4 healthy individuals measured every 2 hr and 45 min between 8:30 AM and 7:30 PM (Wagner et al., 2020). This lack of effect was also seen in 11 moderately trained men measured 11 times over 24 hr (Fatouros et al., 2010) as well as 1 healthy control and 10 colorectal cancer patients (stages I–IV) measured every 6 hr over a 24 hr interval (Tóth et al., 2017). In contrast, two studies reported a decrease in cirDNA levels between morning and evening in 13 and 4 subjects, respectively (Madsen et al., 2019; Meddeb et al., 2019).
Two studies implemented cirDNA tailored pre-analytical practice (short blood processing time, double centrifugation and appropriate cirDNA extraction kit), as well as limiting physical activity of study participants to minimise changes due to exercise. As described above, no circadian pattern was observed in four healthy subjects measured five times between 8:30 AM and 7:30 PM, with the experiment repeated on two separate days (Wagner et al., 2020). However, the study by Madsen and colleagues extended three hourly measurements from 9 AM to 9 PM in 13 healthy subjects and observed a gradual decrease that reached statistical significance at 9 PM (Madsen et al., 2019).
Two studies measured cirDNA fluctuations over short time intervals, specifically over 1 hr (Madsen et al., 2019) and every 5–15 min over 75 min (Brodbeck et al., 2020), both reporting no effect. Two studies compared cirDNA levels between days. There was no difference between days 1, 2 and 3 at 9 AM in either 33 healthy subjects or 10 lung cancer patients (Madsen et al., 2019) or in cirDNA measured 1 week apart (Wagner et al., 2020). All three aforementioned studies employed optimum cirDNA processing.
A relationship between cirDNA levels and circadian rhythm can be expected as multiple studies have shown cirDNA is primarily haematopoietic in origin (Lam et al., 2017; Lui et al., 2002; Moss et al., 2018; Snyder et al., 2016; Sun et al., 2015; Sun et al., 2019; Wong et al., 2016; Zheng et al., 2012) and haematopoietic cell numbers display a 24 hr circadian cycle (Ackermann et al., 2012; Pritchett and Reddy, 2015). On the other hand, the mechanism of cirDNA release into the bloodstream is mainly apoptosis (Jahr et al., 2001; Jiang et al., 2018; Jiang and Lo, 2016), and there is no evidence circadian rhythm influences apoptosis in healthy individuals, and only limited evidence in disease states (Gaddameedhi et al., 2015; Rabinovich-Nikitin et al., 2019; Wang et al., 2015).
The circadian rhythm studies do not report the time interval between waking and blood collection from subjects. Given the rapid clearance of cirDNA following exercise-induced increase, it is possible that cirDNA does change during sleep but returns to normal by the time a blood sample is taken for measurement. Furthermore, only two studies report what activity the participants were involved in between blood draws. In those studies, participants were told to minimise physical activity before blood draws (Madsen et al., 2019) or given access to recliner chairs and allowed to walk around freely (Wagner et al., 2020).
1.5 Psychological stress
Psychological stress burden has been linked to cirDNA changes through inflammation mechanisms (Liu et al., 2017) and DNA damage (Jenkins et al., 2014). Three individual studies on cirDNA and psychological stress were identified, containing two healthy cohorts and a cohort of women undergoing IVF treatment.
Brodbeck et al., 2020 took advantage of the stress created by venepuncture to look for a relationship between stress and cirDNA levels. The nervousness of study participants was quantified on a 0–10 scale. No relationship was observed between self-reported nervousness about the venepuncture procedure and cirDNA levels in 14 healthy women volunteers. However, the subjects might not be a true representative of a cohort experiencing a lot of stress since they volunteered for the venepuncture and were informed of the study procedure, and scaling, while easy and simple, is prone to bias.
Within a longer timeframe, Czamanski-Cohen et al., 2014 examined cirDNA in 14 women undergoing IVF treatment. Women who were offered 5–6 sessions with an experienced psychotherapist and implemented twice daily stress reduction techniques (n = 8) had significantly lower cirDNA levels at the end of the IVF cycle than women who received standard psychological care from IVF nursing staff (n = 6). The cirDNA was quantitated directly from plasma using a nucleic acid stain; however, pre-analytical procedures regarding blood tube type, blood processing time and centrifugation were not described.
Hummel et al., 2018 examined the acute effect of stress on cirDNA using the Trier social stress test – a validated and standardised acute laboratory stress challenge – in 20 healthy male sports science students. The test involved a free speech and an unanticipated math task performed in front of judges and a camera, all leading to consistently raised levels of cortisol. Immediately after the test cirDNA was found to have increased by about twofold, followed by a rapid drop back down to pre-test levels within 15 min. However, there was no correlation between cortisol and cirDNA (Hummel et al., 2018). With 20 paired samples, this study had the highest statistical power. The technical strengths were circadian rhythm control, with all blood sampling performed between 9 and 11 AM and optimum pre-analytical procedures (appropriate kit, immediate blood processing time, double centrifugation). Overall, there is some evidence for the impact of psychological stress on cirDNA.
1.6 Biological sex
Twenty-five individual studies on cirDNA and biological sex were identified. These included 12 cohorts of healthy subjects and 24 cohorts of patients with diagnosed disease (Table 1). In the healthy cohorts, 6/12 studies (n = 240) reported no difference while the remaining half (n = 1868) reported males having significantly higher cirDNA compared to females.
Table 1
Association of cirDNA with gender.
| Authors (year) | Subject | Conclusion to gender differences on cirDNA amount | ||
|---|---|---|---|---|
| Cohort | Male (n) | Female (n) | ||
| Coulet et al., 2000 | Head and neck squamous cell carcinoma patients (n = 117) | 105 | 12 | No effect |
| Sozzi et al., 2001 | Control (n = 43) | NA | NA | No effect |
| Lung cancer patients (n = 84) | 72 | 12 | No effect (p=0.403) | |
| Tamkovich et al., 2005 | Healthy volunteers (n = 35) | 15 | 20 | No effect |
| Zhong et al., 2007 | Healthy adults (n = 54) | 27 | 27 | No effect |
| Lee et al., 2011 | Lung cancer patients (n = 134) | 13 | 121 | No effect (p=0.947) |
| Beiter et al., 2011 | Recreational runners (n = 53) | 34 | 19 | No effect |
| Jylhävä et al., 2012 | Nonagenarians (n = 258) | 62 | 196 | Significantly higher in male (p=0.018) |
| Kim et al., 2014 | Control (n = 34) | 15 | 19 | No effect (p=0.598) |
| Gastric cancer patients (n = 30) | 23 | 7 | Significantly higher in female (p=0.01) | |
| Spindler et al., 2014 | Metastatic colorectal cancer patients (n = 86) | 55 | 31 | No effect (p=0.24) |
| Jylhävä et al., 2014 | Finnish population | 609–681 | 366–409 | Significantly higher in male (p=0.00) |
| Jeong et al., 2015 | Haemodialysis patients (n = 95) | NA | NA | No effect |
| Diabetic haemodialysis patients (n = 50) | NA | NA | No effect (p=0.22) | |
| Spindler et al., 2015 | Metastatic colorectal cancer patients (n = 223) | 126 | 97 | No effect (p=0.1) |
| Chen et al., 2016 | Stage I and II non-small cell lung cancer patients | 33 | 25 | No effect (p=0.318) |
| Hsieh et al., 2016 | Oesophageal squamous cell carcinoma patients | 70 | 11 | No effect (p=0.315) |
| Karlas et al., 2017 | Non-alcoholic fatty liver disease patients (n = 58) | 32 | 26 | 90 bp fragment – no effect; 222 bp fragment – higher in female (p=0.0051) |
| Li et al., 2017 | All lymphoma patients (n = 174) | 107 | 67 | No effect (p=0.769) |
| Diffuse large B cell lymphoma (n = 98) | 61 | 37 | No effect (p=0.507) | |
| Çayir et al., 2018 | Control (n = 51) | 28 | 23 | Significantly higher in male |
| Greenhouse workers (n = 72) | 41 | 31 | Significantly higher in male | |
| Meddeb et al., 2019 | Healthy individuals (n = 104) | 62 | 42 | Significantly higher in male (p=0.048) |
| Colorectal cancer patients (n = 118) | 68 | 50 | No effect | |
| van der Drift et al., 2010 | Healthy controls (n = 21) | 19 | 2 | No effect |
| Lung cancer patients (n = 46) | 30 | 16 | ||
| Catarino et al., 2012 | Healthy controls (n = 205) | 78 | 127 | Significantly higher in male (p<0.001) |
| Lung cancer patients (n = 104) | 86 | 20 | No effect (p=0.123) | |
| Wu et al., 2019 | Newly diagnosed lymphoma patients (n = 60) | 32 | 28 | No effect (p=0.76) |
| Treated lymphoma patients (n = 107) | 59 | 48 | No effect (p=0.4967) | |
| Alghofaili et al., 2019 | Healthy volunteers (n = 275) | 124 | 151 | Significantly higher in male (p=0.000103) |
| Caglar et al., 2020 | Thyroiditis (n = 33) | NA | NA | No effect (p>0.7) |
| Benign (n = 37) | NA | NA | No effect (p=0.054) | |
| Malignant (n = 30) | NA | NA | No effect | |
| All thyroid patients (n = 100) | NA | NA | No effect (p=0.08) | |
| Bryk et al., 2019 | T2D patients (n = 111) | NA | NA | No effect (p=0.51) |
| Bu et al., 2020 | Gastric cancer patients (n = 61) | 41 | 20 | No effect |
-
T2D: type II diabetes.
In patient cohorts and workers exposed to occupational hazards, most studies (21/24) report no differences in cirDNA between males and females. A single study of 72 greenhouse workers reported higher cirDNA level in males (Çayir et al., 2018), but the remaining two patient studies reported higher cirDNA in females (Karlas et al., 2017; Kim et al., 2014). However, of these, one analysis, conducted in 30 gastric patients, had imbalanced sample numbers with 23 males and only 7 females (Kim et al., 2014), while the other only saw the association with long cirDNA fragments (222 bp), with no effect on short fragments (90 bp) (Karlas et al., 2017).
Considering only studies in healthy volunteers that either measured cirDNA directly from plasma or used a dedicated extraction kit, higher cirDNA levels in males relative to females were measured in three cohorts (total of 584 subjects) (Alghofaili et al., 2019; Çayir et al., 2018; Jylhävä et al., 2012), while no effect was observed in a single cohort of 43 subjects (Sozzi et al., 2001). If sex plays a role, the evidence favours males having higher cirDNA than females. However, the effect of sex appears fairly small, and may be confounded by lifestyle differences between males and females. Carefully controlled studies with large sample numbers, combined with meta-analyses, will be helpful in quantifying the association.
1.7 Age
Twenty-nine individual studies on cirDNA and age were identified. These contained 45 cohorts, with 19 groups of healthy individuals and 26 of patients with diagnosed disease and women undergoing HRT (Table 2). Amongst the healthy cohorts, 14/19 reported no impact of age on cirDNA. Of those that showed a significant difference (5/19), all found that cirDNA is positively correlated with age (Jylhävä et al., 2011; Jylhävä et al., 2014; Jylhävä et al., 2013; Meddeb et al., 2019; Zhong et al., 2007); however, a significant effect was observed in women only in three out of the five studies (Jylhävä et al., 2011; Jylhävä et al., 2014; Zhong et al., 2007). Three of the five studies showing a relationship between age and cirDNA levels in healthy cohorts are from a single research group (Jylhävä et al., 2011; Jylhävä et al., 2014; Jylhävä et al., 2013). While the laboratory methodology is comparable to other published work, two of the studies were unique in investigating cohorts with a large age difference, rather than looking for a continuous effect. cirDNA was compared between two distinct cohorts (19–37 years versus nonagenarians) (Jylhävä et al., 2011; Jylhävä et al., 2013), both mostly women. Since the age difference is large, it is possible the effect is apparent even when the sample size is modest (11 controls and 12 nonagenarians) (Jylhävä et al., 2011). Another publication by the same group reported an age effect in healthy women (average age 60.48 years ± 8.98) and had a substantial sample size of 366 (Jylhävä et al., 2014).
Table 2
Association of cirDNA with age.
| Authors (year) | Subject | Age analysed | Conclusion to age effect on cirDNA amount |
|---|---|---|---|
| Sozzi et al., 2001 | Control (n = 43) | - | No effect |
| Lung cancer patients (n = 84) | 39–59 (n = 31) vs. 60–69 (n = 34) vs. ≥70 (n = 19) | ||
| Sozzi et al., 2003 | Lung cancer patients(n = 100)Mean age: 65.1 ± 8.9 | ≤60 vs. 61–71 vs. ≥72 | Significantly higher with increasing age |
| Tamkovich et al., 2005 | Healthy participants (n = 35 [15 M + 20 W]) | 18–53 | No effect |
| Zhong et al., 2007 | Healthy adults | 20–40 vs. 41–60 vs. >60 | No effect (men and women mixed)Significantly higher cirDNA for >60 years old compared to 20–40 and 41–60 groups in women only |
| Lee et al., 2011 | Lung cancer patients (n = 134) | ≤65 (n = 108) vs. >65 (n = 26) | No effect (p=0.333) |
| Beiter et al., 2011 | Recreational runners (n = 53)Mean age: 34.8 | 17–60 years | No effect |
| Jylhävä et al., 2011 | Control (n = 11, females, 22–37 years old) vs. nonagenarians (n = 12, females, born 1917) | Significantly higher in elderly (p=0.035, < 0.001, 0.015)* | |
| Jylhävä et al., 2013 | Young controls (n = 30 [9 M + 21 W], aged 19–30 years old) vs. nonagenarians (n = 144 [43 M + 101 W], aged ≥90 years old) | Significantly higher in nonagenarian group (p=0.002) | |
| Kim et al., 2014 | Control (n = 34)Mean age = 63.79 ± 6.76 years | <65 vs. ≥65 | No effect |
| Gastric cancer patientsMean age = 66.72 ± 13.16 years | Significantly higher with increasing age | ||
| Spindler et al., 2014 | Metastatic colorectal cancer patients (n = 86)Median age: 66 (37–83) | <66 (n = 43) vs. >66 (n = 43) | No effect |
| Jylhävä et al., 2014 | Women (n = 366–409, mean age 60.48 [8.98]) | Significantly higher with increasing age (p=0.002) | |
| Women (oestrogen HRT user, n = 131–148, mean age 58.57 [6.88]) | No effect (p=0.391) | ||
| Women (oestrogen + progestin HRT user, n = 87–98, mean age 57.23 [6.39]) | No effect (p=0.869) | ||
| Men (n = 609–681), mean age (58.31 [7.91]) | No effect (p=0712) | ||
| Breitbach et al., 2014a | Male athletes (n = 26 [13 handball players + 13 triathletes])Mean age 24.7 (3.1) | No effect | |
| Jeong et al., 2015 | Haemodialysis patients (n = 95) | 58 ± 1.5 | No effect |
| Haemodialysis patients (n = 95) | 58 ± 1.5 | No effect (p=0.80) | |
| Diabetic haemodialysis patients (n = 50) | 66.4 ± 1.8 | No effect (p=0.93) | |
| Spindler et al., 2015 | Metastatic colorectal cancer patients (n = 223)Median age: 63 (35-82) years old | ≤63 (n = 119) vs. >63 (n = 104) | No effect (p=0.39) |
| Korzeneva et al., 2015 | Average age for all groups: 48.5 ± 16.3 years | ||
| Never-exposed control group (n = 109) | *21–86 | No effect (p=0.13) | |
| Chronic gamma-neutron radiation-exposed group (n = 88) | *26–79 | No effect (p=0.6) | |
| Chronic tritium β-radiation-exposed group (n = 88) | *20–80 | No effect (p=0.06) | |
| Never-exposed control group (n = 109) | <65 years old vs. ≥65 years old | Significantly higher with increasing age | |
| Chronic gamma-neutron radiation-exposed group (n = 88) | <65 years old vs. ≥65 years old | Significantly lower with increasing age | |
| Chronic tritium β-radiation-exposed group (n = 88) | <65 years old vs. ≥65 years old | No effect | |
| Hsieh et al., 2016 | Oesophageal squamous cell carcinoma patients (n = 81 [70 M + 11 F]) | <60 (N = 43) vs. >60 (N = 38) | No effect (p=0.588) |
| Tosevska et al., 2016 | Institutionalised elderly aged 65–98 (n = 105) | 65–98 | No effect |
| Karlas et al., 2017 | Non-alcoholic fatty liver disease patients (n = 58) | Age (mean age 62.1 ± 11 years old) | No effect |
| Li et al., 2017 | All lymphoma patients (n = 174) | ≤60 (N = 117) vs. ≥60 (N = 57) | No effect (p=0.414) |
| Diffuse large B cell lymphoma (n = 98) | ≤60 (N = 61) vs. ≥60 (N = 37) | No effect (p=0.668) | |
| Beranek et al., 2017 | Exacerbated psoriasis vulgaris patients (n = 28 [15 M + 13 W]) | 18–69 (median age 50) | No effect |
| Teo et al., 2019 | Young (n = 3) vs. elderly (n = 3) vs. healthy centenarians (n = 3) vs. unhealthy centenarians (n = 3) | No effect | |
| Meddeb et al., 2019 | Healthy individuals (n = 104)Age range: 18–69 | <47 (n = 52) vs. ≥47 (n = 52) | Significantly higher with increasing age (p=0.009) |
| Healthy individuals (n = 104) | Young (n = 79) vs. older (n = 25)† | Significantly higher with increasing age (p=0.0026) | |
| Colorectal cancer patients (n = 118)Age range: 22–91 | <65 (n = 52) vs. ≥65 (n = 66) | No effect | |
| Colorectal cancer patients (n = 118) | Young (n = 25) vs. older (n = 93)† | No effect (p=0.913) | |
| van der Drift et al., 2010 | Healthy controls | <60 vs. ≥60 | No effect (p=0.43) |
| Lung cancer | <60 vs. ≥60 | No effect (p=0.25) | |
| Catarino et al., 2012 | Healthy controls (n = 205) | <64 vs. ≥64 | No effect (p=0.342) |
| Lung cancer patients (n = 104) | <64 vs. ≥64 | No effect (p=0.614) | |
| Wu et al., 2019 | Newly diagnosed lymphoma patients (n = 60) | <60 vs. ≥60 | No effect (p=0.4041) |
| Treated lymphoma patients (n = 107) | <60 vs. ≥60 | No effect (p=0.3127) | |
| Alghofaili et al., 2019 | Healthy volunteers (n = 275) | Correlation plot (0–57 years old; median 27 years old) | No effect (r = –0.09) |
| Caglar et al., 2020 | Thyroiditis (n = 33) | 37.6 ± 10.9 | No effect |
| Benign (n = 37) | 54.1 ± 13.1 | No effect | |
| Malignant (n = 30) | 47.8 ± 11.9 | No effect | |
| All thyroid patients (n = 100) | Significant positive correlation (p<0.05) | ||
| Bryk et al., 2019 | T2D patients | No effect (p=0.63) | |
| Bu et al., 2020 | Gastric cancer patients (n = 61) | 40–83 | No effect (p=0.323 and p=0.280)‡ |
-
*
Three different extraction kits.
-
†
Using same cutoff for both healthy and cancer cohort as the median age (56) of all individuals tested.
-
‡
Two different extraction kits.
-
HRT: hormone replacement therapy; T2D: type II diabetes.
Considering only studies with healthy cohorts and cirDNA-tailored methodology, two studies with a total of 197 subjects observed a relationship between cirDNA levels and age (Jylhävä et al., 2011; Jylhävä et al., 2013), while five studies with a total of 461 subjects reported no relationship (Alghofaili et al., 2019; Breitbach et al., 2014a; Sozzi et al., 2001; Teo et al., 2019; Tosevska et al., 2016). However, as discussed below, comparisons between individual studies are difficult due to the different age ranges of subjects included, for example, very young versus very old (Jylhävä et al., 2011; Jylhävä et al., 2013), compared to studies with a smaller age range (Breitbach et al., 2014a).
In a comprehensive study of the tissue sources of cirDNA conducted by Moss et al., 2018, the sources of cirDNA were unchanged with age; however, older people had higher cirDNA levels. The consistent tissue profile could indicate decreased capacity of cirDNA clearance rather than an increase in apoptosis of specific tissues (Moss et al., 2018). Similarly, Teo et al., 2019 found little change between young people (25 ± 0.5 years old) and healthy centenarians but found larger fluctuations among healthy older subjects (71 ± 1.6 years old) and unhealthy centenarians, including decreased pituitary gland and increased tibial artery cirDNA.
In the patient cohorts, 23/26 observed no age effect, while in three studies comprising 100 thyroid-related pathology patients (Caglar et al., 2020), 30 gastric cancer patients (Kim et al., 2014) and 100 lung cancer patients (Sozzi et al., 2003), a positive correlation with age was seen.
Comparing the effect of age across different studies is difficult for several reasons. Firstly, the way the subjects are categorised, and therefore analysed, varies between the studies. Some studies use specific age cutoffs (younger than or older than a certain age) to split their cohorts into two or three continuous groups. For example, Korzeneva et al., 2015 found no effect in either 109 healthy controls or 88 people chronically exposed to gamma-neutron radiation, unless the cohorts were split into two age groups, which resulted in significantly higher and lower cirDNA with increasing age, respectively. Some studies compared two groups with distinct ages such as Jylhävä et al., 2011, where a young age group (22–37 years old) is compared to nonagenarians. Some studies do not split their subjects but perform a correlation statistical analysis (Table 2). Overall, based on the evidence, the effect of age on cirDNA levels appears small.
2 Lifestyle factors
2.1 Exercise
Of all variables reviewed, exercise holds the most evidence to support its effect on cirDNA levels. A large and robust increase in cirDNA levels is associated with acute exercise, while less consistent changes are reported with chronic exercise (reviewed by Breitbach et al., 2012 and Vittori et al., 2019). Studies of exercise and cirDNA levels are summarised in Table 3.
Table 3
cirDNA measurements in acute exercise.
| Authors (year) | Setting | Subject | CirDNA measurement time points |
|---|---|---|---|
| Atamaniuk et al., 2004 | Race (did not specify duration and distance) | Healthy half-marathon runners (n = 25 [12 M + 13 F]) | Before the race, immediately after race, 2 hr post-race |
| Margeli et al., 2005 | 246 km ultra-marathon | Healthy males (n = 15) | Pre-race, post-race (within 15 min), post-race (48 hr) |
| Atamaniuk et al., 2008 | 6 hr race | Experienced ultra-marathon runners (n = 14 [9 M + 5 F]) | Pre-race, post-race, post-race (2 hr), post-race (24 hr) |
| Fatouros et al., 2010 | Control (rest): remain seated/lying in the labExercise: 45 min treadmill run followed by increase in speed until exhaustion | Moderately trained men (n = 11) | Pre-exercise, post-exercise, post-exercise (0.5 hr, 1, 2, 3, 4, 5, 6, 8, 10, 24 hr) |
| Atamaniuk et al., 2010 | Six sets of six weightlifting exercise | Male competitive weightlifters (n = 12) | Pre-exercise, post-exercise (immediately after), post-exercise (2 hr) |
| Beiter et al., 2011 | Public 10 km cross-country interval run | Recreational runners (n = 53 [34 M + 19 W]) | Pre-exercise, immediately after |
| Incremental test on treadmill (until exhaustion) | Well-trained male athletes (n = 9) | Pre-exercise, immediately after, post-exercise (30 min) | |
| Strenuous treadmill until exhaustion | Well-trained endurance male athlete (n = 1), moderately trained female participant (n = 1), well-trained recreational male runner (n = 1) | Pre-exercise, mid-exercise (3, 6, 9, 12, 15 min), post-exercise (5, 10, 15, 20, 30 min) | |
| de Sousa et al., 2012 | Overload training programme (day 1–8) then 10 × 800 m sprints on day 9 | Highly competitive male endurance runners (n = 24) | Day 1, day 9 (pre-exercise [–140 min], post-exercise [immediate, 80 min]) |
| Breitbach et al., 2014a | Treadmill until exhaustion (average 17.9 min) | Male athletes (n = 26 [13 handball players + 13 triathletes]) | Pre-exercise, post-exercise |
| Beiter et al., 2014 | Increment treadmill until exhaustion | Well-trained male athletes (n = 6) | Pre-exercise, post-exercise (immediately), post-exercise (30 min) |
| High-intensity 60 min cycling | Untrained males (n = 6) | Pre-exercise, post-exercise (immediately), post-exercise (3 hr) | |
| Regularly endurance trained males (n = 6) | Pre-exercise, post-exercise (immediately), post-exercise (3 hr) | ||
| Breitbach et al., 2014b | 10 km relay race | Recreational runners (n = 10 [6 M + 4 F]) | Pre-exercise, post-exercise |
| Tug et al., 2015 | Incremental treadmill test | Healthy male controls (n = 3) | Pre-exercise, post-exercise (immediately), post-exercise (90 min) |
| Healthy female controls (n = 3) | |||
| Sex-mismatched haematopoietic stem cell transplantation patients (n = 5 females with male donors) | |||
| Sex-mismatched haematopoietic stem cell transplantation patients (n = 2 males with female donors) | |||
| Helmig et al., 2015 | Incremental treadmill test until exhaustion | Physically active men (n = 5) | Pre-exercise, post-exercise (immediately after, 10, 30, 90 min) |
| Frühbeis et al., 2015 | Increment cycling test until exhaustion | Physically active male (more than 3 hr/week) tested twice (n = 1) | Pre-exercise, mid-exercise (3, 6, 9, 12, 15, 18, 21 min), post-exercise (immediately after, 10, 30, 90 min) |
| Tug et al., 2017b | Acute strength exercise (whole-body exercises, deadlifts, squats and muscle-targeted exercises) | Regular strength trained men (n = 16) | 12th, 13th, 14th, 15th, 16th exercise |
| High-intensity training | n = 5/16 | Before first exercise, after last exercise | |
| Differential training | n = 5/16 | Before first exercise, after last exercise | |
| Conservation training | n = 6/16 | Before first exercise, after last exercise | |
| Tug et al., 2017a | Incremental bicycle exercise until exhaustion | Competitive male cyclists (n = 11) | Pre-exercise, post-exercise, post-exercise (90 min) |
| Stawski et al., 2017 | Treadmill until exhaustion | Averaged-trained men (n = 11) | Pre- and post-1st bout, 2nd bout and 3rd bout of exercise |
| Haller et al., 2017 | Stepwise increment running test until exhaustion | Athletes (n = 14 [7 M + 7 W]) | Pre-exercise, mid-exercise (3, 6, 9, 12, 15, 18, 21 min), post-exercise (15, 30 min) |
| 40 min endurance run at 9.6 km/hr | Athletes (n = 13 [7 M + 6 W]) | Pre-exercise, post-exercise | |
| Hummel et al., 2018 | Treadmill until exhaustion | Male students of sports science (n = 20) | Pre-exercise (–2 min), post-exercise (2, 15, 30, 40 min) |
| Haller et al., 2018 | 5 × 40 m sprints (5.94 ± 0.50 s) | Healthy subjects (n = 9 [7 M + 2 F]) | Pre-exercise, post-exercise |
| Treadmill test | Male football players playing more than 70 min in game and participated in treadmill test (n = 10) | Pre-exercise, post-exercise | |
| Season football game | Pre-exercise, post-exercise | ||
| Ferrandi et al., 2018 | High-intensity interval exercise (30 min) | Healthy male subjects (n = 14 [seven normal weight and seven obese]) | Pre-exercise, post-exercise, post-exercise (1 hr) |
| Ohlsson et al., 2020 | Cycling until maximal heart rate | Healthy volunteers (n = 8 [4 M and 4 W]) | Pre-exercise, sub-max load, max load, post-exercise (30, 90 min) |
| Mavropalias et al., 2021 | Eccentric cycling | Men unaccustomed to eccentric exercise (n = 20) | Pre-exercise, post-exercise, post-exercise (24, 48, 72 hr) |
2.1.1 Acute exercise
Twenty-two individual studies on cirDNA and acute exercise were identified. In acute exercise, all studies reviewed reported a significant increase in cirDNA during exercise and a decline to pre-exercise levels after cessation. This applied in both resistance and endurance exercise. Resistance exercise works to enhance the strength and build skeletal muscles by repeatedly overcoming resistance force. Two studies in this category reported a 1.4- to 1.7-fold and 3-fold increase in cirDNA after performing strength exercise (Tug et al., 2017b) and weightlifting exercises (Atamaniuk et al., 2010), respectively.
Endurance exercise is activity that increases breathing and heart rate, such as walking, jogging and cycling. Five studies used cycling regime to test their participants. All reported a significant increase in cirDNA ranging from 1.6- to 7.82-fold (Beiter et al., 2014; Frühbeis et al., 2015; Mavropalias et al., 2021; Ohlsson et al., 2020; Tug et al., 2017a). All remaining endurance studies subjected participants to running, ranging from 800 m sprints to 246 km ultra-marathons, with the majority using ‘treadmill test until exhaustion’ (Table 3). All studies reported the same transient rise and fall cirDNA pattern, spanning from 1.6- to 18.6-fold increase from pre-exercise level.
Endurance exercise appears to induce a larger cirDNA response than resistance exercise. Nearly half (10/25) of the endurance exercises reported cirDNA increases ≥9-fold, and the maximum reported increase was 18.6-fold (Atamaniuk et al., 2004). In contrast, amongst the resistance studies, the highest difference was a threefold increase in cirDNA after weightlifting (Atamaniuk et al., 2010). However, this needs further investigation as the number of studies examining resistance exercise was limited to 2.
Duration and intensity of acute exercise
There is some evidence for a positive relationship between duration of exercise and fold change in cirDNA. Mavropalias and colleagues investigated the effect of exercise intensity by splitting their cohort of 20 men into low- or high-intensity eccentric cycling groups. High-intensity cycling induced a significantly higher cirDNA increase in plasma than low-intensity cycling (Mavropalias et al., 2021). Furthermore, five 40 m sprint sessions with long rest intervals (5 min) caused a lower rise in cirDNA than five sprint sessions with short rest intervals (1 min) (Haller et al., 2018), and 24 competitive endurance runners reported a >9.8-fold increase after ten 800 m sprints (de Sousa et al., 2012), while 14 ultra-marathon runners experienced roughly an 18-fold increase after a 6 hr race, with a level above baseline persisting for at least 2 hr (Atamaniuk et al., 2008). Additionally, Haller et al., 2017 and Haller et al., 2018 showed a positive association between duration and distance covered and cirDNA increase during a low-intensity running exercise (Haller et al., 2017) and a football game (Haller et al., 2018), respectively.
Kinetics of cirDNA change during acute exercise
The kinetics of cirDNA during exercise indicate rapid initiation of clearance, with cirDNA peaking either immediately (Fatouros et al., 2010; Haller et al., 2017), 15 min (Hummel et al., 2018) or 30 min (Ohlsson et al., 2020) after exercise. The time required for cirDNA levels to return to baseline is not well defined as studies have reported both elevated (Ohlsson et al., 2020) and a return to baseline levels (Frühbeis et al., 2015) 1.5 hr post-cycling exercise.
Grouping participant results in kinetic studies might not be appropriate due to interindividual differences in cirDNA clearance. Beiter et al., 2011 examined the variation in cirDNA kinetics between individuals, subjecting three people to a treadmill test until exhaustion: one well-trained male endurance athlete, one moderately trained female participant and one well-trained recreational male runner. Although all three had the same general transient pattern, the peak occurred at different times and the decline time also varied (Beiter et al., 2011).
Since 55% of cirDNA comes from leukocytes (Moss et al., 2018), it is possible that the kinetics of leukocytes during exercise influence the kinetics of cirDNA. Increases in leukocyte number during exercise have been observed in several studies (de Sousa et al., 2012; Ohlsson et al., 2020; Tug et al., 2017a). For example, during a cycling exercise, the number of leukocytes peaked at maximal workload while the cirDNA level peaked 30 min after the cessation of exercise (Ohlsson et al., 2020). This burst of cirDNA occurring just after the leukocyte peak could be the result of leukocyte apoptosis during exercise (Krüger and Mooren, 2014). Additionally, circulating DNases may play a part in the clearance of cirDNA following exercise. Beiter et al., 2014 found that DNase activity follows the kinetic pattern of cirDNA, rising by 15-fold immediately after a treadmill test and decreasing to pre-exercise activity levels after 30 min. Moreover, exercise changes blood and plasma volume, which might also affect total cirDNA quantitation (Fellmann, 1992; Kawabata et al., 2004).
Individual fitness
Individual fitness levels appear to have little impact on cirDNA increase and clearance rates. Beiter et al., 2014 investigated the difference in cirDNA changes between untrained and endurance-trained males after 60 min of high-intensity cycling. Both groups had similar pre-exercise cirDNA levels, and the untrained and trained group had 6.9- and 4.5-fold increases, respectively. For both groups, cirDNA returned to normal after 3 hr and there was no statistically significance difference between the two groups in the way the cirDNA level responded to exercise.
Sex differences in cirDNA change during exercise
It is difficult to conclude if there are any differences in the way cirDNA levels respond to exercise in men compared to women. Half of the research studies conducted (11/21) involved male subjects only. Eight studies had a mix of males and females with equal or near equal representation, while two consisted predominantly of male subjects (Table 3). The lack of equal representation is an ongoing issue in the field of sports science, including in cirDNA-related exercise studies, which we highlighted in our recent publication (Hagstrom et al., 2021). Furthermore, in all studies except one, the data on male and female participants were combined, making delineation of sex differences not possible.
2.1.2 Chronic exercise
Six individual studies on cirDNA and chronic exercise were identified, far fewer studies compared to acute exercise. Overall, it appears to have less robust effects than acute exercise. The chronic exercise studies ranged in duration from 8 days (de Sousa et al., 2012) to 6 months (Tosevska et al., 2016), and the predominant exercise examined was resistance-type (4/6 studies) rather than endurance-type (2/6 studies). In all studies, blood samples were collected at least 1 day following cessation of exercise to avoid the confounding effect of acute exercise.
No change in cirDNA levels was observed following a chronic intense running programme in male endurance runners (de Sousa et al., 2012), resistance training in 23 (control group) and 27 (resistance training) elderly participants (Tosevska et al., 2016) or 8 weightlifters (Gentles et al., 2017). In contrast, two studies reported a significant cirDNA increase after performing resistance multi-joint exercises (Fatouros et al., 2006) and a range of strength exercises (Tug et al., 2017b) in 17 recreationally and 16 regularly trained men, respectively. One study of male soccer players observed a significant mid-season cirDNA increase only in players who started games in autumn season (A. Gentles et al., 2015).
Inconsistent effects of chronic exercise intensity are also reported. Fatouros et al., 2006 subjected participants to four 3-week training blocks of varying intensity and found that cirDNA peaked during the highest volume of training and fell as training intensity was decreased. This is opposed by the finding of Tug et al., 2017b that neither low- nor high-intensity acute strength training showed significant association with cirDNA levels. In addition, the frequency of habitual exercise (ranging from 0 to 7 times a week) had no association with cirDNA levels in 14 healthy women (Brodbeck et al., 2020).
2.1.3 Origin of cirDNA increase during exercise
The increase in cirDNA during exercise has been attributed to apoptosis due to the ladder pattern of DNA fragments (Thierry et al., 2016). This pattern is clearly shown in plasma collected before an ultra-marathon race, immediately after, and 2, and 4 hr after the race (Atamaniuk et al., 2008).
Sex-mismatched haematopoietic stem cell transplantation provides a means to determine whether the exercise-induced cirDNA increase originates from haematopoietic lineage cells. In one study, male and female patients with sex-mismatched transplant donors performed incremental treadmill exercise until exhaustion and their total and Y-chromosome cirDNA levels were measured. The results showed that most of the increase in cirDNA is from haematopoietic cells and not from the liver (Tug et al., 2015). Further evidence supporting exercise-induced leukocyte apoptosis is the significant decrease of Bcl2 mRNA expression immediately after exercise, while Bax and Bad mRNA levels increased slightly (Atamaniuk et al., 2008). However, post-exercise blood smears and immunohistochemistry indicated that the damaged cells are neutrophils undergoing a phenomenon termed neutrophil extracellular traps (NETs). In another study, cirDNA was positively associated with myeloperoxidase which is abundant in primary granules of neutrophils (Beiter et al., 2014), providing further evidence for the role of neutrophils in the origin of cirDNA.
Another clear candidate for a cirDNA source during exercise is skeletal muscle; however, only one study to date has specifically measured muscle-derived cirDNA in this setting. Surprisingly, no increase in skeletal muscle-derived cirDNA, as identified via the methylated HOXD4 promoter, was observed after exercise. The authors only analysed 5 out of 20 men recruited in this tissue-origin investigation (Mavropalias et al., 2021). Muscle tissue does not normally contribute to cirDNA (Moss et al., 2018); however, biochemical markers of tissue damage such as creatinine kinase and myoglobin have been reported (Nédélec et al., 2012; Thorpe and Sunderland, 2012). More research is required to validate the result by Mavropalias et al., 2021 and also to determine other possible sources of cirDNA in exercise.
2.2 Alcohol
There is a strong association between alcohol consumption and increased risk of cancers such as liver, breast, oesophageal and pancreatic cancer (Ratna and Mandrekar, 2017). Due to the DNA-damaging properties of alcohol, it has been hypothesised that cirDNA levels increase as a result of alcohol-induced apoptosis (Brooks and Theruvathu, 2005).
Two studies measured association between alcohol consumption and plasma cirDNA levels (Hsieh et al., 2016; Kim et al., 2014) and found no correlation between alcohol intake and cirDNA concentration in either 24 healthy subjects, 23 gastric cancer patients (Kim et al., 2014) or 81 oesophageal cancer patients (Hsieh et al., 2016). Their technical limitations include missing methodological reporting, non-specialised cirDNA extraction kit and no clear specification of alcohol intake used for ‘moderate-severe’ categorisation (Kim et al., 2014) as well as the grouping of ‘social drinker’ and ‘had quit drinking for >5 years’ subjects into a single cohort (Hsieh et al., 2016). Combining data from ‘social drinkers’ with ‘non-drinkers’ can obscure physiological effects since people with long-term abstinence can have different health characteristics to current drinkers (Fein et al., 2006; Sullivan et al., 2010).
In both studies, alcohol consumption was recorded as a part of investigating plasma cirDNA in the context of cancer. A more focused study that utilises protocols tailored to cirDNA measurements to confirm the effect of alcohol on cirDNA is needed. Both acute and chronic effects of alcohol should be investigated with clear information on alcohol intake amounts and duration. Recall bias is also a major issue in self-count-based studies which leads to under-reporting particularly for heavy and non-routine drinking (Boniface et al., 2014; Cherpitel et al., 2018).
2.3 Occupational hazard exposure
Two studies on cirDNA and occupational hazard exposure were identified. One study examined ionising radiation in 176 people working at nuclear sites (Korzeneva et al., 2015) and the second study examined pesticide exposure in 72 greenhouse workers (Çayir et al., 2018). cirDNA was significantly lower in subjects exposed to gamma-neutron radiation (n = 88) and chronic tritium β-radiation (n = 88) compared to a never-exposed group (n = 109). The authors postulated that this decrease may be due to an elevated level of DNase I in the exposed group (Korzeneva et al., 2015). The second study measured DNA directly from plasma and found that greenhouse workers exposed to pesticides for 5–15 years have near double cirDNA levels compared to non-exposed controls and showed a positive correlation between cirDNA concentration and pesticide exposure interval (Çayir et al., 2018). The strengths of the latter study include accounting for smoking, ethnic, social and cultural differences, as well as black tea consumption between exposed and control groups, but information on blood processing time was lacking and a second plasma centrifugation was omitted. Both studies have moderate combined sample sizes (160 control and 248 exposed subjects total). No analysis of the specific tissues that contribute to the increase in cirDNA concentration was carried out in either study.
2.4 Smoking
Cigarette smoke has potent DNA-damaging constituents (Pfeifer et al., 2002; Weng et al., 2018; Zhao et al., 2009); therefore, it is surprising that the documented effect of smoking on cirDNA is scarce. Smoking status is routinely collected in clinical records, especially in the context of cancer.
Ten individual studies on cirDNA and smoking were identified, containing 6 healthy cohorts and 13 cohorts that include cancer patients, women undergoing IVF treatment and greenhouse workers. Four out of six studies that included healthy cohorts reported no effect of smoking on cirDNA levels in a combined sample size of 444 (Catarino et al., 2012; Kim et al., 2014; Sozzi et al., 2003; Yoon et al., 2009). The remaining two studies reported opposing results – higher cirDNA level in former smokers (n = 8) versus current smokers (n = 12) in a study that used a non-specialised kit (van der Drift et al., 2010) and, conversely, higher cirDNA levels in current smokers (n = 13) versus non-smokers (n = 38) quantitated directly from plasma and measured within a cohort that did not segregate the pesticide-exposed greenhouse workers and unexposed controls (Çayir et al., 2018).
Amongst the cancer studies, four lung cancer (Catarino et al., 2012; Sozzi et al., 2003; van der Drift et al., 2010; Yoon et al., 2009), one oesophageal squamous cell cancer (Hsieh et al., 2016) and one thyroid cancer (Caglar et al., 2020) study reported no effect of smoking on cirDNA levels. One gastric cancer study reported significantly lower cirDNA amount in current smokers versus former smokers and non-smokers (Kim et al., 2014). The authors suggested that this may be because the cancer type that occurs in the aged, female, non-smoking cohort is more aggressive than others.
There were no cirDNA differences between former and current smokers versus non-smokers in a group of 37 women undergoing IVF-embryo transfer treatment (Czamanski-Cohen et al., 2013) or in T2D patients (Bryk et al., 2019). cirDNA was not associated with number of packs per year (Yoon et al., 2009), or smoking duration; however, smokers did have more extreme elevated values among cancer-free individuals, possibly reflecting smoking-associated health problems (Sozzi et al., 2003).
One limitation across the published studies is the imbalance of non-smoking and smoking cohorts. For example, in the study conducted by Sozzi et al., 2003, there were 7 never smokers, and 82 and 65 smokers in the healthy controls and lung cancer patients, respectively. This can be controlled for in future investigations, as well as matching the groups in age and gender. Due to the self-reported nature of smoking data and the tendency for underestimation (Connor Gorber et al., 2009), large cohort numbers would also be important.
3 Other factors
Many other variables have been investigated in smaller individual studies. No effect on cirDNA has been noted in studies examining height (Breitbach et al., 2014a), spring versus autumn season (Çayir et al., 2018), number of blood volunteering times (Zhong et al., 2007), history of betel nut chewing (Hsieh et al., 2016) or haematocrit or cannula placement pain (Brodbeck et al., 2020).
There is evidence that meal-derived DNA is present in the circulation. This DNA is mostly intact (>10 kbp) (Spisák et al., 2013). However, whether this impacts measurably on the cirDNA concentration remains unclear. Only a single study, which found no relationship between cirDNA and time since last food intake, has been published (Meddeb et al., 2019), and the effect of specific foods has not been examined.
4. Study methodology
While there is general agreement that standardised methodology and complete reporting of experimental parameters is desirable, consensus for a standardised set of protocols for cirDNA analysis has not been developed. There are numerous steps in cirDNA analysis, starting from blood collection all the way through to quantification, and variation at each step creates difficulty in comparing studies and a hindrance in translating biomarkers to the clinic. Here, we highlight some of the differences in the technical aspects of the 66 publications reviewed (Figure 1).
Figure 1
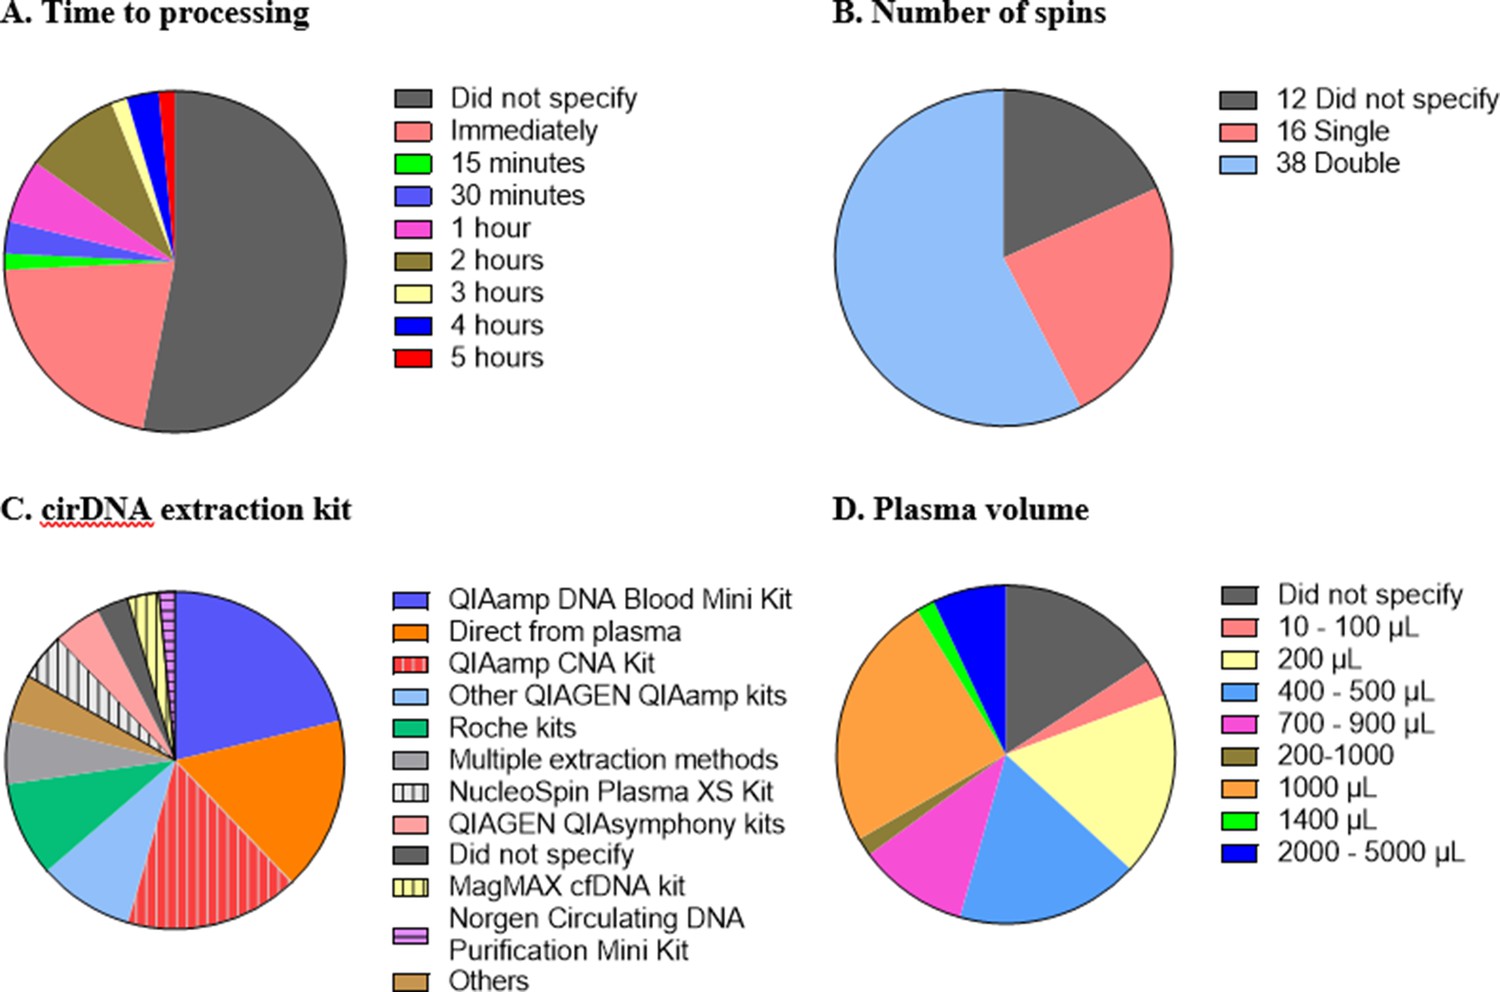
Technical aspects and protocol reporting in the 66 publications summarised in this review.
(A) Interval time between blood collection and processing. (B) Number of centrifugations performed to obtain plasma samples from whole blood. (C) cirDNA extraction methods (specialised cirDNA kits are denoted by stripes). (D) Input volume of plasma into extraction (D).
Blood collection tube
A range of tubes for blood collection and plasma separation are available, including tubes stabilised to avoid leukocyte lysis. Most studies used EDTA tubes; however, 3 studies used heparin-based additives (Atamaniuk et al., 2010; Korzeneva et al., 2015; Sozzi et al., 2001), 15 studies did not specify the tube type (Supplementary file 1) and 2 were ambiguous (Czamanski-Cohen et al., 2013; Korabecna et al., 2011). The study by Meddeb et al., 2019 used Streck tubes when measuring the effect of circadian rhythm, and included a direct comparison to EDTA tubes, with no consistent differences observed.
Time to blood processing
It is important that the time between blood collection and plasma processing is considered and reported as prolonged blood storage allows leukocytes to lyse and hence create genomic DNA contamination (Trigg et al., 2018; Warton et al., 2014). Different studies have used different ‘cutoff’ times such as 1 (Ohlsson et al., 2020; van der Drift et al., 2010), two (Brodbeck et al., 2020; Spindler et al., 2014) or 5 (Bu et al., 2020) hr. Out of the 66 studies, 35 (53%) did not provide any information regarding the duration between blood collection and processing. Of the 31 studies that do specify the time to processing, all fall within a reasonable time, with a maximum of 5 hr between blood collection and plasma separation (Figure 1A).
Number of spins
A key step in blood processing for cirDNA extraction is centrifugation to separate the plasma from the red blood cells and leukocytes. Thirty-eight out of 66 studies (58%) centrifuged the blood samples twice, 16 studies (24%) did so once and 12 studies (18%) did not specify (Figure 1B). The role of the second spin is to minimise the potential for leukocyte contamination (Trigg et al., 2018), especially in case of inaccurate pipetting.
cirDNA extraction
Sixty-four studies used a single extraction method while three utilised multiple methods to analyse the same cohort, including quantifying the cirDNA directly from plasma. In total, there are 11 studies that omitted the extraction step and quantitated cirDNA directly (Figure 1C).
Most studies used commercial kits to purify cirDNA. There are several kits available to specifically extract cirDNA such as QIAamp Circulating Nucleic Acid (CNA) Kit, NucleoSpin Plasma XS Kit, MagMAX Cell-free DNA Isolation Kit and Circulating DNA Purification Mini Kit. Only 37% of the 46 studies that involved a DNA extraction step used a kit specifically formulated for cirDNA. Using non-specialised kits results in substantially reduced cirDNA yields (Devonshire et al., 2014; Warton et al., 2018). For example, a comparison of the QIAamp CNA kit and the QIAamp DNA Blood Mini kit showed that the latter extracted less than one third of the DNA extracted by QIAamp CNA kit, with a bias towards high-molecular-weight DNA (Warton et al., 2018).
Out of these studies that did not use a dedicated kit, nearly half used QIAGEN kits (mostly QIAamp DNA Blood Mini Kit) and the remaining used a variety of other kits such as MagNA Pure LC DNA Isolation Kit-Large Volume. Some studies used various non-kit methods such as phenol-chloroform-based extraction (Jylhävä et al., 2011; Korzeneva et al., 2015; Tug et al., 2015) and in-house protocols (Tamkovich et al., 2005). Only two studies did not specify any information about DNA extraction method, nor if they did so.
Volume of plasma used for extraction/quantitation
Both more (Alborelli et al., 2019) and less (Devonshire et al., 2014) efficient extraction of cirDNA has been reported with increasing plasma volume. About 40% of the studies used volumes below 1 mL for cirDNA extraction, down to as low as 50 µL (Tug et al., 2015; Figure 1D). Some of the low starting amounts are likely due to kit configuration, for example, the QIAamp DNA Blood Mini Kit specifies 1–200 µL of sample input. This again highlights the importance of using the appropriate kit to extract cirDNA.
Quantitation method
The quantitation methods were predominantly qPCR, which remains the ‘gold standard’ for cirDNA quantitation (just over 50% of studies), followed by Qubit. Other means of quantitation were PicoGreen, cell death detection ELISA, SYBR nucleic acid gel stain, DNA DipStick TM Kit and GB genetic human DNA assay.
It is apparent in this analysis of 66 studies that there remain major inconsistences in the methods used to extract and analyse cirDNA. This not only raises questions about the validity of individual results but makes comparing studies and evaluating results difficult.
Conclusion
The effects of lifestyle and biological factors on cirDNA are summarised in Figure 2. Despite technical and methodological variation between studies, acute exercise has consistently been shown to produce a robust but transient increase in cirDNA. The effect of exercise is very pronounced, with increases in cirDNA concentration that dwarf the rises reported in some disease states. In most exercise regimes, cirDNA returns to baseline level within a short amount of time (30–60 min); however, rigorous exercise induces a slower decline, with a measurable increase persisting at 48 hr (Margeli et al., 2005). Furthermore, the lowest level of exercise required for a measurable increase in cirDNA is not known, thus we propose limiting physical activity prior to a blood draw as a strategy to decrease baseline variation and improve capacity to detect differences between study groups. In line with this, study methods should report whether participant physical activity was controlled for.
Figure 2
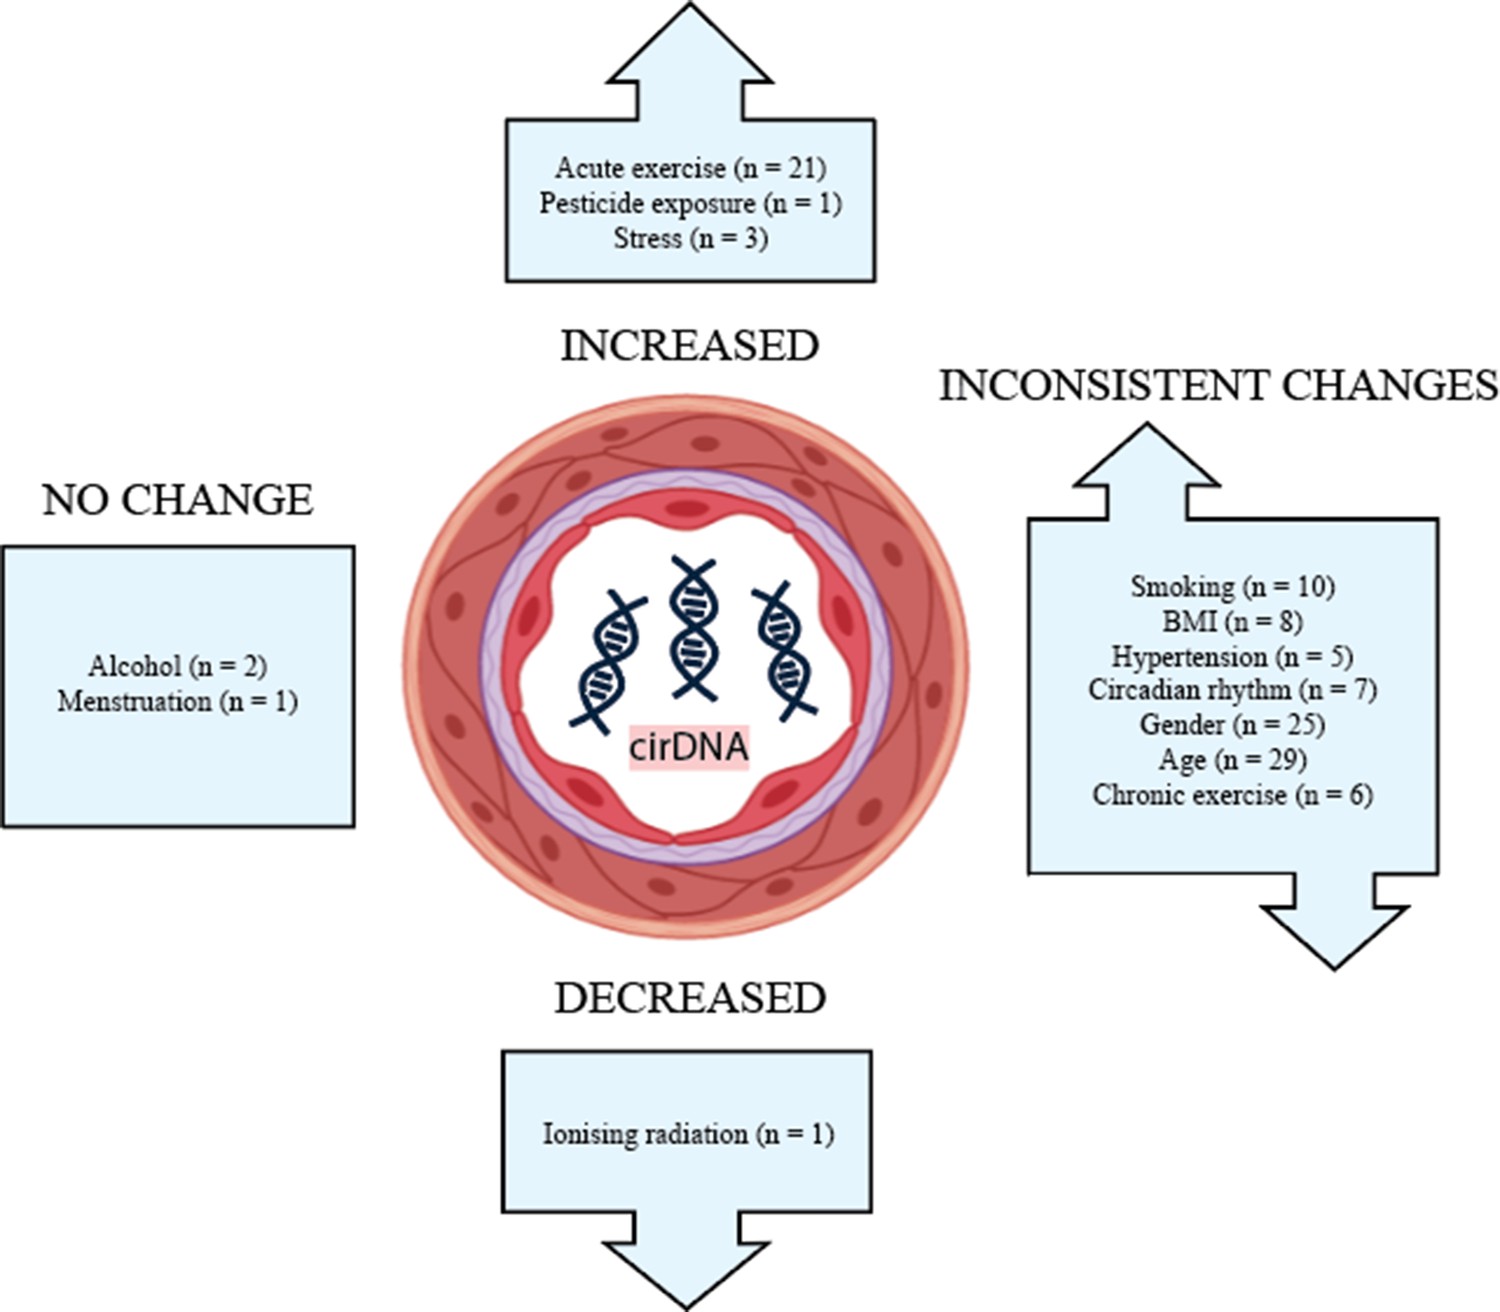
The effect of biological and lifestyle factors on blood plasma cirDNA concentration in healthy individuals and patients with various diseases and treatments.
Alcohol use and menstruation appear to have a negligible effect on cirDNA levels; however, the number of studies is small. Most other biological and lifestyle factors have been reported to both increase and decrease cirDNA levels. Better-designed and disaggregated studies are required to confidently rule in or out their effect.
Addressing each of these factors to accurately answer how they impact cirDNA level would require a very large study with a substantial number of participants and multidiscipline expertise to ensure that each factor is investigated and controlled properly. If this type of study was to be conducted, the best practice should be applied. Blood should be collected in a single-tube type, with short and consistent time between blood collection and centrifugation. Double centrifugation and specialised cirDNA kit for extraction should also be used.
A step towards obtaining more reliable data is choosing methods appropriate for cirDNA analysis, as well as careful sample handling and detailed reporting of protocols. Transparency in disclosing the way samples are processed and analysed may be aided by the development of reporting guidelines analogous to the Minimum Information for Publication of Quantitative Real-Time PCR Experiments (MIQE) guidelines (Bustin et al., 2009).
There remain large knowledge gaps in how common biological and lifestyle factors impact cirDNA. An understanding of cirDNA dynamics outside of a disease context is important for establishing accurate baseline levels and developing sensitive clinical tests that minimise the confounding effect of healthy variation.
References
-
Changes in cell free DNA during a college soccer seasonJournal of Trainology 4:25–31.https://doi.org/10.17338/trainology.4.1_25
-
Mechanism linking diabetes mellitus and obesityDiabetes, Metabolic Syndrome and Obesity 7:587–591.https://doi.org/10.2147/DMSO.S67400
-
Biospecimen Science of Blood for cfDNA Genetic AnalysesCurrent Pathobiology Reports 7:9–15.https://doi.org/10.1007/s40139-019-00193-7
-
Increased concentrations of cell-free plasma DNA after exhaustive exerciseClinical Chemistry 50:1668–1670.https://doi.org/10.1373/clinchem.2004.034553
-
Effects of ultra-marathon on circulating DNA and mRNA expression of pro- and anti-apoptotic genes in mononuclear cellsEuropean Journal of Applied Physiology 104:711–717.https://doi.org/10.1007/s00421-008-0827-2
-
Cell-free plasma DNA and purine nucleotide degradation markers following weightlifting exerciseEuropean Journal of Applied Physiology 110:695–701.https://doi.org/10.1007/s00421-010-1532-5
-
Neutrophils release extracellular DNA traps in response to exerciseJournal of Applied Physiology 117:325–333.https://doi.org/10.1152/japplphysiol.00173.2014
-
Changes in circulating cell-free DNA and nucleosomes in patients with exacerbated psoriasisArchives of Dermatological Research 309:815–821.https://doi.org/10.1007/s00403-017-1785-5
-
Circulating Cell-Free DNASports Medicine 42:565–586.https://doi.org/10.2165/11631380-000000000-00000
-
Direct measurement of cell-free DNA from serially collected capillary plasma during incremental exerciseJournal of Applied Physiology 117:119–130.https://doi.org/10.1152/japplphysiol.00002.2014
-
Biological variability of cell-free DNA in healthy females at rest within a short time courseTernational Journal of Legal Medicine 134:911–919.https://doi.org/10.1007/s00414-019-02240-9
-
Hormone replacement therapy and 24-hour blood pressure profile of postmenopausal womenAmerican Journal of Hypertension 13:1039–1041.https://doi.org/10.1016/S0895-7061(00)00284-3
-
Evaluation of circulating cell free DNA in plasma as a biomarker of different thyroid diseasesBrazilian Journal of Otorhinolaryngology 86:321–326.https://doi.org/10.1016/j.bjorl.2018.12.008
-
DNA damage and circulating cell free DNA in greenhouse workers exposed to pesticidesEnvironmental and Molecular Mutagenesis 59:161–169.https://doi.org/10.1002/em.22148
-
Detection of Plasma Tumor DNA in Head and Neck Squamous Cell Carcinoma by Microsatellite Typing and p53 Mutation AnalysisCancer Research 60:707–711.
-
Characterization and evaluation of liver fibrosis grade in patients with chronic hepatitis B virus infection and normal transaminasesClinical and Molecular Hepatology 24:384–391.https://doi.org/10.3350/cmh.2018.0004
-
Increased plasma cell-free DNA is associated with low pregnancy rates among women undergoing IVF-embryo transferReproductive BioMedicine Online 26:36–41.https://doi.org/10.1016/j.rbmo.2012.09.018
-
Decrease in cell free DNA levels following participation in stress reduction techniques among women undergoing infertility treatmentArchives of Women’s Mental Health 17:251–253.https://doi.org/10.1007/s00737-013-0407-2
-
BookChapter 35 - The Human Circadian Timing System and Sleep–Wake RegulationIn: Kryger MH, Roth T, Dement WC, editors. Principles and Practice of Sleep Medicine. W.B. Saunders. pp. 402–419.
-
Carbohydrate supplementation delays DNA damage in elite runners during intensive microcycle trainingEuropean Journal of Applied Physiology 112:493–500.https://doi.org/10.1007/s00421-011-2000-6
-
Towards standardisation of cell-free DNA measurement in plasma: controls for extraction efficiency, fragment size bias and quantificationAnalytical and Bioanalytical Chemistry 406:6499–6512.https://doi.org/10.1007/s00216-014-7835-3
-
Cognitive performance in long-term abstinent alcoholic individualsAlcoholism, Clinical and Experimental Research 30:1538–1544.https://doi.org/10.1111/j.1530-0277.2006.00185.x
-
Circulating Cell-Free DNA Differentiates Severity of InflammationBiological Research For Nursing 18:477–488.https://doi.org/10.1177/1099800416642571
-
Physical exercise induces rapid release of small extracellular vesicles into the circulationJournal of Extracellular Vesicles 4:28239.https://doi.org/10.3402/jev.v4.28239
-
The Circadian Clock Controls Sunburn Apoptosis and Erythema in Mouse SkinThe Journal of Investigative Dermatology 135:1119–1127.https://doi.org/10.1038/jid.2014.508
-
Cell free DNA as a marker of training status in weightliftersBiology of Sport 3:287–294.https://doi.org/10.5114/biolsport.2017.67855
-
Assessment of diurnal changes and confounding factors that affect circulating cell death biomarker levels: a short communicationJournal of Pharmaceutical and Biomedical Analysis 84:184–188.https://doi.org/10.1016/j.jpba.2013.06.010
-
Sex Bias in Cohorts Included in Sports Medicine ResearchSports Medicine 51:1799–1804.https://doi.org/10.1007/s40279-020-01405-6
-
Increases in Circulating Cell-Free DNA During Aerobic Running Depend on Intensity and DurationTernational Journal of Sports Physiology and Performance 12:455–462.https://doi.org/10.1123/ijspp.2015-0540
-
Release of bulk cell free DNA during physical exercise occurs independent of extracellular vesiclesEuropean Journal of Applied Physiology 115:2271–2280.https://doi.org/10.1007/s00421-015-3207-8
-
Circulating Cell-Free DNA Levels Could Predict Oncological Outcomes of Patients Undergoing Esophagectomy for Esophageal Squamous Cell CarcinomaTernational Journal of Molecular Sciences 17:2131.https://doi.org/10.3390/ijms17122131
-
Cell-free DNA release under psychosocial and physical stress conditionsTranslational Psychiatry 8:236.https://doi.org/10.1038/s41398-018-0264-x
-
DNA fragments in the blood plasma of cancer patients: quantitations and evidence for their origin from apoptotic and necrotic cellsCancer Research 61:1659–1665.
-
Effects on DNA Damage and/or Repair Processes as Biological Mechanisms Linking Psychological Stress to Cancer RiskJournal of Applied Biobehavioral Research 19:3–23.https://doi.org/10.1111/jabr.12019
-
Effect of blood pressure and glycemic control on the plasma cell-free DNA in hemodialysis patientsKidney Research and Clinical Practice 34:201–206.https://doi.org/10.1016/j.krcp.2015.09.002
-
Aging is associated with quantitative and qualitative changes in circulating cell-free DNA: the Vitality 90+ studyMechanisms of Ageing and Development 132:20–26.https://doi.org/10.1016/j.mad.2010.11.001
-
Correlation of cell-free DNA plasma concentration with severity of non-alcoholic fatty liver diseaseJournal of Translational Medicine 15:106.https://doi.org/10.1186/s12967-017-1208-6
-
Effect of blood volume on plasma volume shift during exerciseJournal of Thermal Biology 29:775–778.https://doi.org/10.1016/j.jtherbio.2004.08.054
-
Circulating cell-free DNA as a promising biomarker in patients with gastric cancer: diagnostic validity and significant reduction of cfDNA after surgical resectionAnnals of Surgical Treatment and Research 86:136–142.https://doi.org/10.4174/astr.2014.86.3.136
-
Apoptosis in the human uterine endometrium during the menstrual cycleThe Journal of Clinical Endocrinology & Metabolism 81:4144–4147.https://doi.org/10.1210/jcem.81.11.8923873
-
BookCircadian Rhythmicity and Clearance of Cell-Free DNA in Human PlasmaIn: Gahan P, editors. Circulating Nucleic Acids in Plasma and Serum. Springer. pp. 195–198.https://doi.org/10.1007/978-90-481-9382-0_26
-
DNA of Erythroid Origin is Present in Human Plasma and Informs the Types of AnemiaClinical Chemistry 63:1614–1623.https://doi.org/10.1373/clinchem.2017.272401
-
Type 2 diabetes mellitus and hypertension: an updateEndocrinology and Metabolism Clinics of North America 43:103–122.https://doi.org/10.1016/j.ecl.2013.09.005
-
Inflammation: The Common Pathway of Stress-Related DiseasesFrontiers in Human Neuroscience 11:316.https://doi.org/10.3389/fnhum.2017.00316
-
Predominant hematopoietic origin of cell-free DNA in plasma and serum after sex-mismatched bone marrow transplantationClinical Chemistry 48:421–427.
-
Dramatic elevations of interleukin-6 and acute-phase reactants in athletes participating in the ultradistance foot race spartathlon: severe systemic inflammation and lipid and lipoprotein changes in protracted exerciseThe Journal of Clinical Endocrinology and Metabolism 90:3914–3918.https://doi.org/10.1210/jc.2004-2346
-
Changes in plasma hydroxyproline and plasma cell-free DNA concentrations after higher- versus lower-intensity eccentric cyclingEuropean Journal of Applied Physiology 121:1087–1097.https://doi.org/10.1007/s00421-020-04593-1
-
Menstrual physiology: implications for endometrial pathology and beyondHuman Reproduction Update 21:748–761.https://doi.org/10.1093/humupd/dmv038
-
Quantifying circulating cell-free DNA in humansScientific Reports 9:5220.https://doi.org/10.1038/s41598-019-41593-4
-
Body Mass Index: Obesity, BMI, and Health: A Critical ReviewNutrition Today 50:117–128.https://doi.org/10.1097/nt.0000000000000092
-
Increased level of circulating cell-free mitochondrial DNA due to a single bout of strenuous physical exerciseEuropean Journal of Applied Physiology 120:897–905.https://doi.org/10.1007/s00421-020-04330-8
-
Night Work and the Risk of Cancer Among MenAmerican Journal of Epidemiology 176:751–759.https://doi.org/10.1093/aje/kws318
-
Circadian Clocks in the Hematologic SystemJournal of Biological Rhythms 30:374–388.https://doi.org/10.1177/0748730415592729
-
DNA Damage and Pulmonary HypertensionTernational Journal of Molecular Sciences 17:E990.https://doi.org/10.3390/ijms17060990
-
BookThe Suprachiasmatic Nucleus is a Functionally Heterogeneous Timekeeping OrganIn: Young MW, editors. Methods in Enzymology. Academic Press. pp. 451–465.
-
Analysis of Circulating Tumor DNA in Plasma at Diagnosis and during Follow-Up of Lung Cancer PatientsCancer Research 61:4675–4678.
-
Quantification of free circulating DNA as a diagnostic marker in lung cancerJournal of Clinical Oncology 21:3902–3908.https://doi.org/10.1200/jco.2003.02.006
-
Cell-free DNA in healthy individuals, noncancerous disease and strong prognostic value in colorectal cancerTernational Journal of Cancer 135:2984–2991.https://doi.org/10.1002/ijc.28946
-
Circulating nucleic acids in blood of healthy male and female donorsClinical Chemistry 51:1317–1319.https://doi.org/10.1373/clinchem.2004.045062
-
Origins, structures, and functions of circulating DNA in oncologyCancer Metastasis Reviews 35:347–376.https://doi.org/10.1007/s10555-016-9629-x
-
Muscle damage, endocrine, and immune marker response to a soccer matchJournal of Strength and Conditioning Research 26:2783–2790.https://doi.org/10.1519/JSC.0b013e318241e174
-
Circadian Rhythm of Methylated Septin 9, Cell-Free DNA Amount and Tumor Markers in Colorectal Cancer PatientsPathology Oncology Research 23:699–706.https://doi.org/10.1007/s12253-016-0174-2
-
Measurement of endometrial thickness in premenopausal women in office gynecologyReproductive Medicine and Biology 17:29–35.https://doi.org/10.1002/rmb2.12062
-
Exercise-induced increases in cell free DNA in human plasma originate predominantly from cells of the haematopoietic lineageExercise Immunology Review 21:164–173.
-
Exploring the Potential of Cell-Free-DNA Measurements After an Exhaustive Cycle-Ergometer Test as a Marker for Performance-Related ParametersTernational Journal of Sports Physiology and Performance 12:597–604.https://doi.org/10.1123/ijspp.2016-0157
-
BookCirculating Cell-Free DNA in Physical ActivitiesIn: Casadio V, Salvi S, editors. Cell-Free DNA as Diagnostic Markers: Methods and Protocols. New York, NY: Springer. pp. 183–197.https://doi.org/10.1007/978-1-4939-8973-7
-
The Circadian Gene Clock Plays an Important Role in Cell Apoptosis and the DNA Damage Response In VitroTechnology in Cancer Research & Treatment 15:480–486.https://doi.org/10.1177/1533034615585433
-
Night work and prostate cancer risk: results from the EPICAP StudyOccupational and Environmental Medicine 75:573–581.https://doi.org/10.1136/oemed-2018-105009
-
Diagnostic value of circulating cell-free DNA levels for hepatocellular carcinomaInternational Journal of Infectious Diseases 67:92–97.https://doi.org/10.1016/j.ijid.2017.12.002
-
Comparison of circulating plasma DNA levels between lung cancer patients and healthy controlsThe Journal of Molecular Diagnostics 11:182–185.https://doi.org/10.2353/jmoldx.2009.080098
Article and author information
Author details
Nicole Laurencia Yuwono

Caroline Elizabeth Ford
Funding
CAMILLA AND MARC
- Kristina Warton
Australian Research Training Program
- Nicole Laurencia Yuwono
Translational Cancer Research Network
- Nicole Laurencia Yuwono
Beth Yarrow Memorial Fund
- Nicole Laurencia Yuwono
Ovarian Cancer Research Foundation (GA-2018-14)
- Kristina Warton
The funders had no role in study design, data collection and interpretation, or the decision to submit the work for publication.
Acknowledgements
NY was supported by the Australian Government Research Training Program (RTP) Stipend through The University of New South Wales, Beth Yarrow Memorial Award in Medical Science and Translational Cancer Research Network PhD Scholarship Top Up Award, via the Cancer Institute NSW. KW was supported by Ovarian Cancer Research Foundation (GA-2018-14) and CAMILLA AND MARC. The funders had no role in the decision to publish or preparation of the manuscript. The authors also acknowledge The University of New South Wales (Lowy Cancer Research Centre) for providing support for carrying out the review.
Copyright
© 2021, Yuwono et al.
This article is distributed under the terms of the Creative Commons Attribution License, which permits unrestricted use and redistribution provided that the original author and source are credited.
Metrics
-
- 2,220
- views
-
- 339
- downloads
-
- 63
- citations
Views, downloads and citations are aggregated across all versions of this paper published by eLife.
Citations by DOI
-
- 63
- citations for umbrella DOI https://doi.org/10.7554/eLife.69679
Download links
A two-part list of links to download the article, or parts of the article, in various formats.
Downloads (link to download the article as PDF)
Open citations (links to open the citations from this article in various online reference manager services)
Cite this article (links to download the citations from this article in formats compatible with various reference manager tools)
The influence of biological and lifestyle factors on circulating cell-free DNA in blood plasma
eLife 10:e69679.
https://doi.org/10.7554/eLife.69679


