Molecular reconstruction of recurrent evolutionary switching in olfactory receptor specificity
- Center for Integrative Genomics, Faculty of Biology and Medicine, University of Lausanne, Switzerland
- The Francis Crick Institute, United Kingdom
Figures
Figure 1
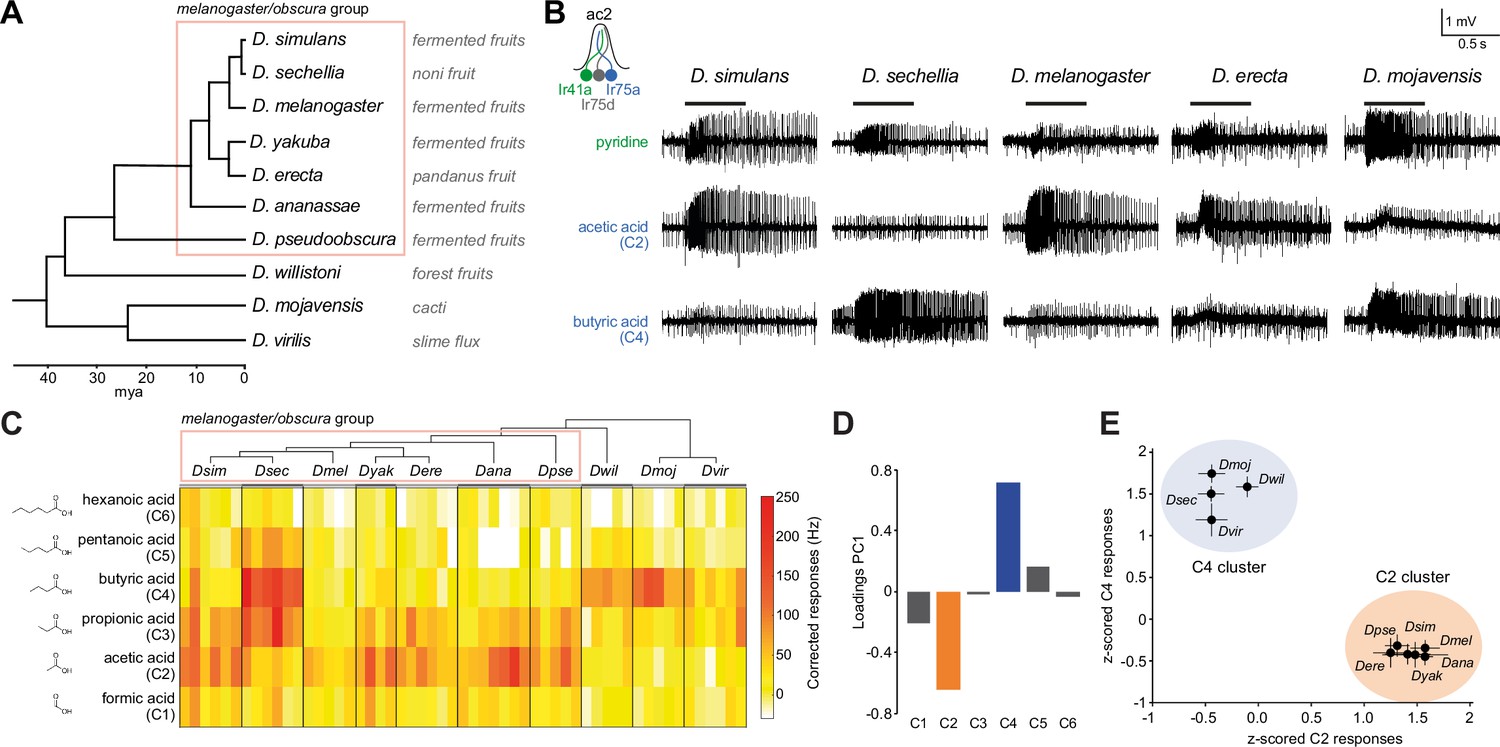
Evolution of olfactory responses of Ir75a neurons across the drosophilid phylogeny.
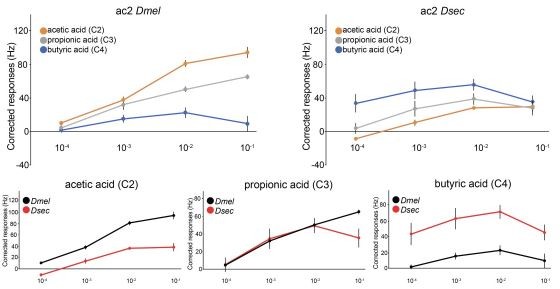
(A) Phylogeny of analyzed drosophilid species and their known ecological niches adapted from Figure 2, Markow, 2015. (B) Representative traces of extracellular recordings of neuronal responses in antennal coeloconic 2 (ac2) sensilla (schematized top left) to the indicated odors in different drosophilid species. ac2 sensilla were identified based on their morphology, their location on the antennal surface – either near the entry to the sacculus or in the distal posterior part intermingled with ac3 sensilla (Silbering et al., 2011) – their pattern of basal firing, and the conserved responses of the Ir41a neuron toward pyridine and the lack of response to octanol which is detected by the Or35a neuron in ac3 sensilla (Yao et al., 2005). (C) Heatmap of electrophysiological solvent-corrected responses (see Materials and methods) of ac2 sensilla of all species in (A) to a series of linear carboxylic acids; the color scale is on the right. Each rectangle represents the responses measured in a single sensillum. (D) Loadings of the first principal component of all responses shown in (C). (E) Responses of ac2 sensilla for all species plotted as z-scored responses (see Materials and methods) of C2 against z-scored responses to C4. This plotting reveals two clear clusters with species responding maximally to C2 (orange) or C4 (blue).
-
Figure 1—source data 1
Data for Figure 1 showing the solvent-corrected spikes/s responses of antennal coeloconic 2 (ac2) sensilla for each of the species (Figure 1C).
The same responses z-scored (Figure 1E) and the results of the principal component analysis (PCA), showing loadings and variance explained by each PC (Figure 1D). Here and in subsequent source data files ‘NaN’ (‘not a number’) indicates cases where data were not available, usually due to the electrode coming out of the sensillum before the end of the series of stimulations.
- https://cdn.elifesciences.org/articles/69732/elife-69732-fig1-data1-v2.xlsx
Figure 2 with 1 supplement
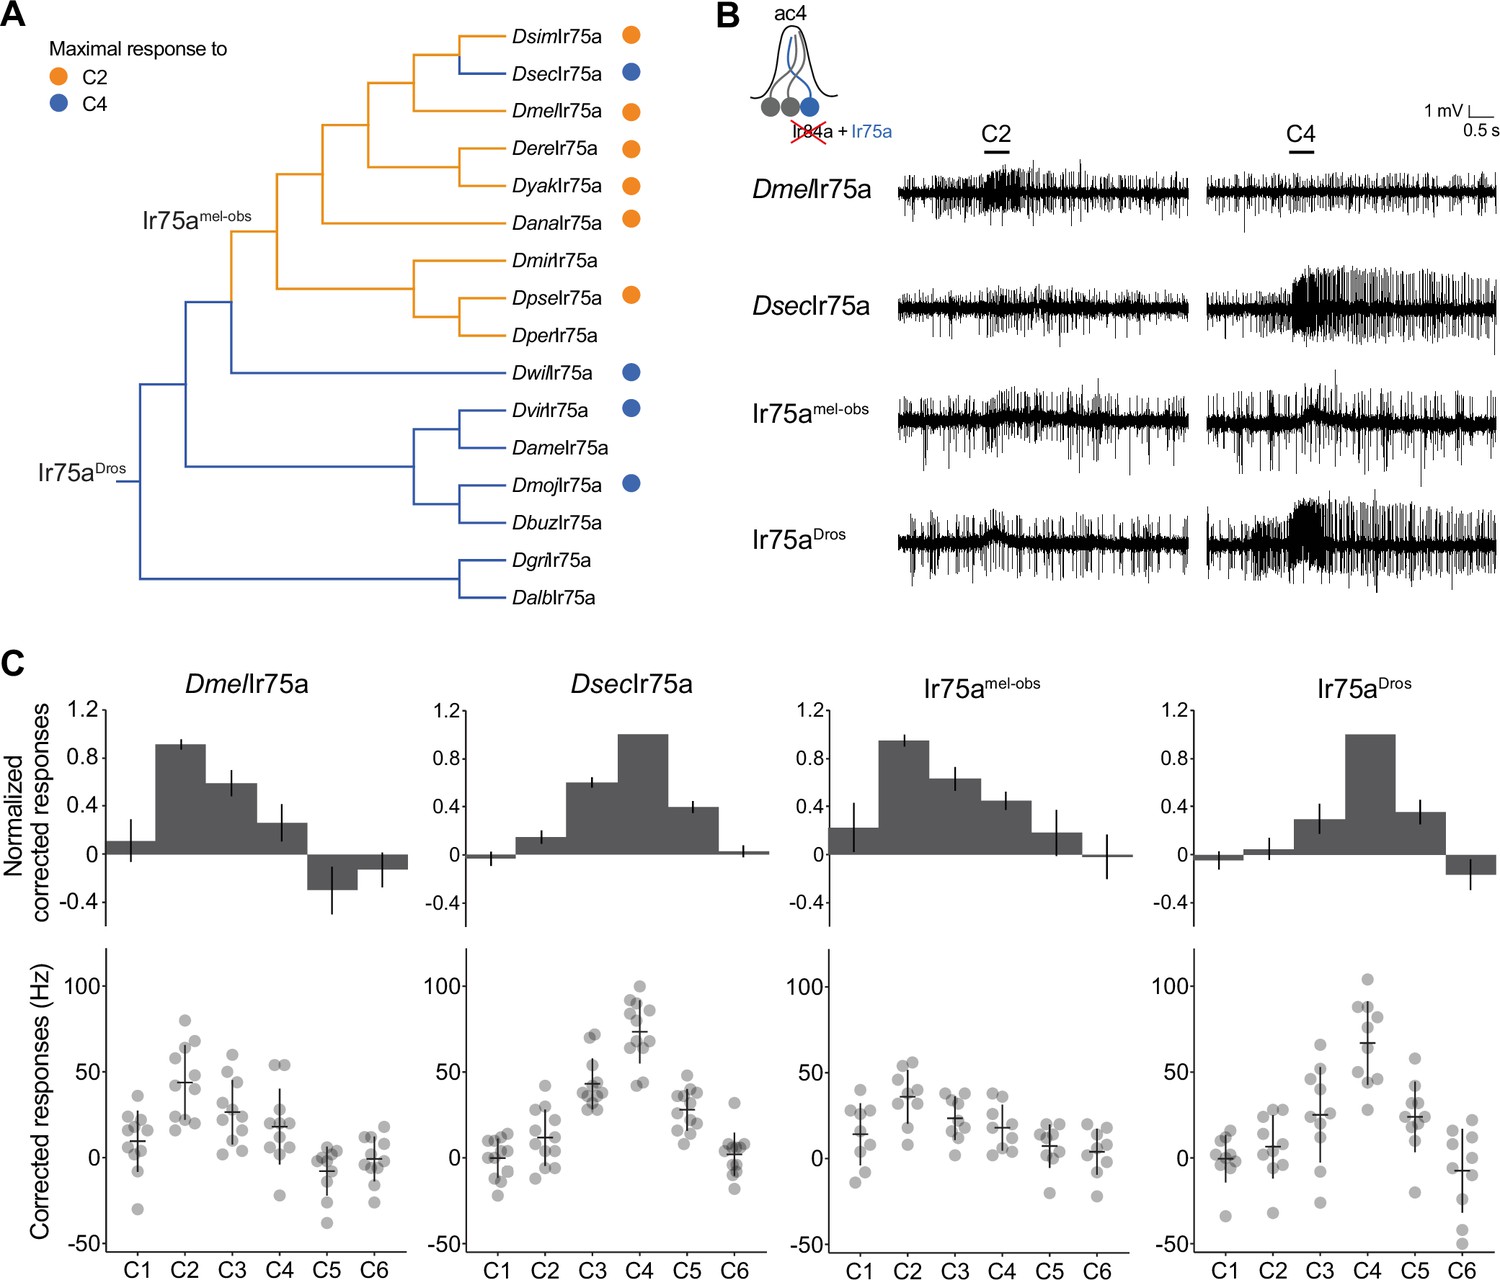
Ancestral sequence reconstruction of Ir75a.
(A) Phylogeny of the protein sequences of drosophilid Ir75a orthologs used for the reconstruction of ancestral nodes (Ir75aDros and Ir75amel-obs) (see Figure 2—figure supplement 1). The orange and blue dots indicate maximal responses of the corresponding neurons to C2 and C4, respectively (Figure 1C). The branches of the tree have been similarly color-coded according to predicted receptor responses based on parsimony. Drosophila species abbreviations (where not presented in Figure 1): Dmir (miranda), Dper (persimilis), Dame (americana), Dbuz (buzzattii), Dgri (grimshawi), and Dalb (albomicans). (B) Representative traces of extracellular recordings of neuronal responses to the indicated odors of receptors expressed in the Ir decoder neuron (see text). Genotypes are of the form: UAS-xxx/UAS-xxx;Ir84aGal4/Ir84aGal4, here and in all subsequent figures. (C) Quantification of responses of the indicated receptors expressed in the Ir decoder neuron. In this and subsequent similar figure panels, the top row shows barplots of responses normalized by maximal response, and the bottom row shows individual datapoints, mean and standard error of mean (SEM) of raw solvent-corrected responses to odor stimuli.
-
Figure 2—source data 1
Data for Figure 2C, responses in spikes/s of antennal coeloconic 2 (ac2) sensilla from each of the genotypes, and normalized with respect to the maximal response of each sensilla.
- https://cdn.elifesciences.org/articles/69732/elife-69732-fig2-data1-v2.xlsx
Figure 2—figure supplement 1
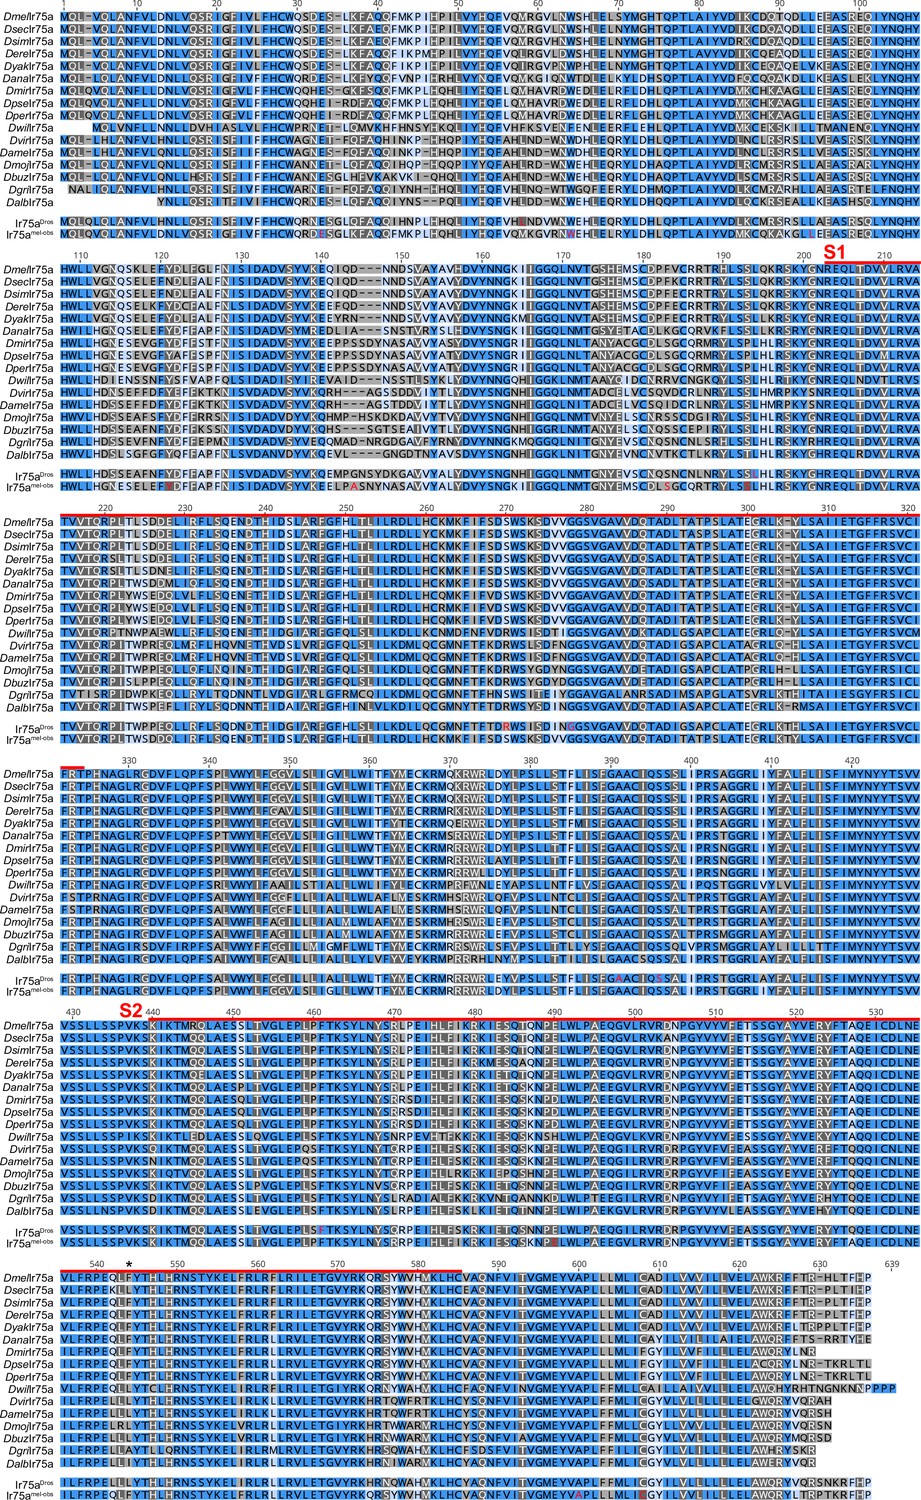
Alignment of Ir75a orthologs.
Multiple sequence alignment of Ir75a orthologs used for the ancestral protein reconstruction. Dark blue shading (100% similar residues across the aligned sequences), dark grey (>80% similar), light blue (>60% similar), light grey (<60% similar). The red lines indicate the spans of S1 and S2 lobes of the ligand-binding domain (LBD); the hotspot is marked with an asterisk. The sequences of the reconstructed ancestral receptors that were functionally tested, Ir75aDros and Ir75aobs-mel, are shown beneath the alignment; in these, the amino acids colored in red are those positions that were estimated by FastML to have a marginal posterior probability <0.7 (see Materials and methods).
Figure 3
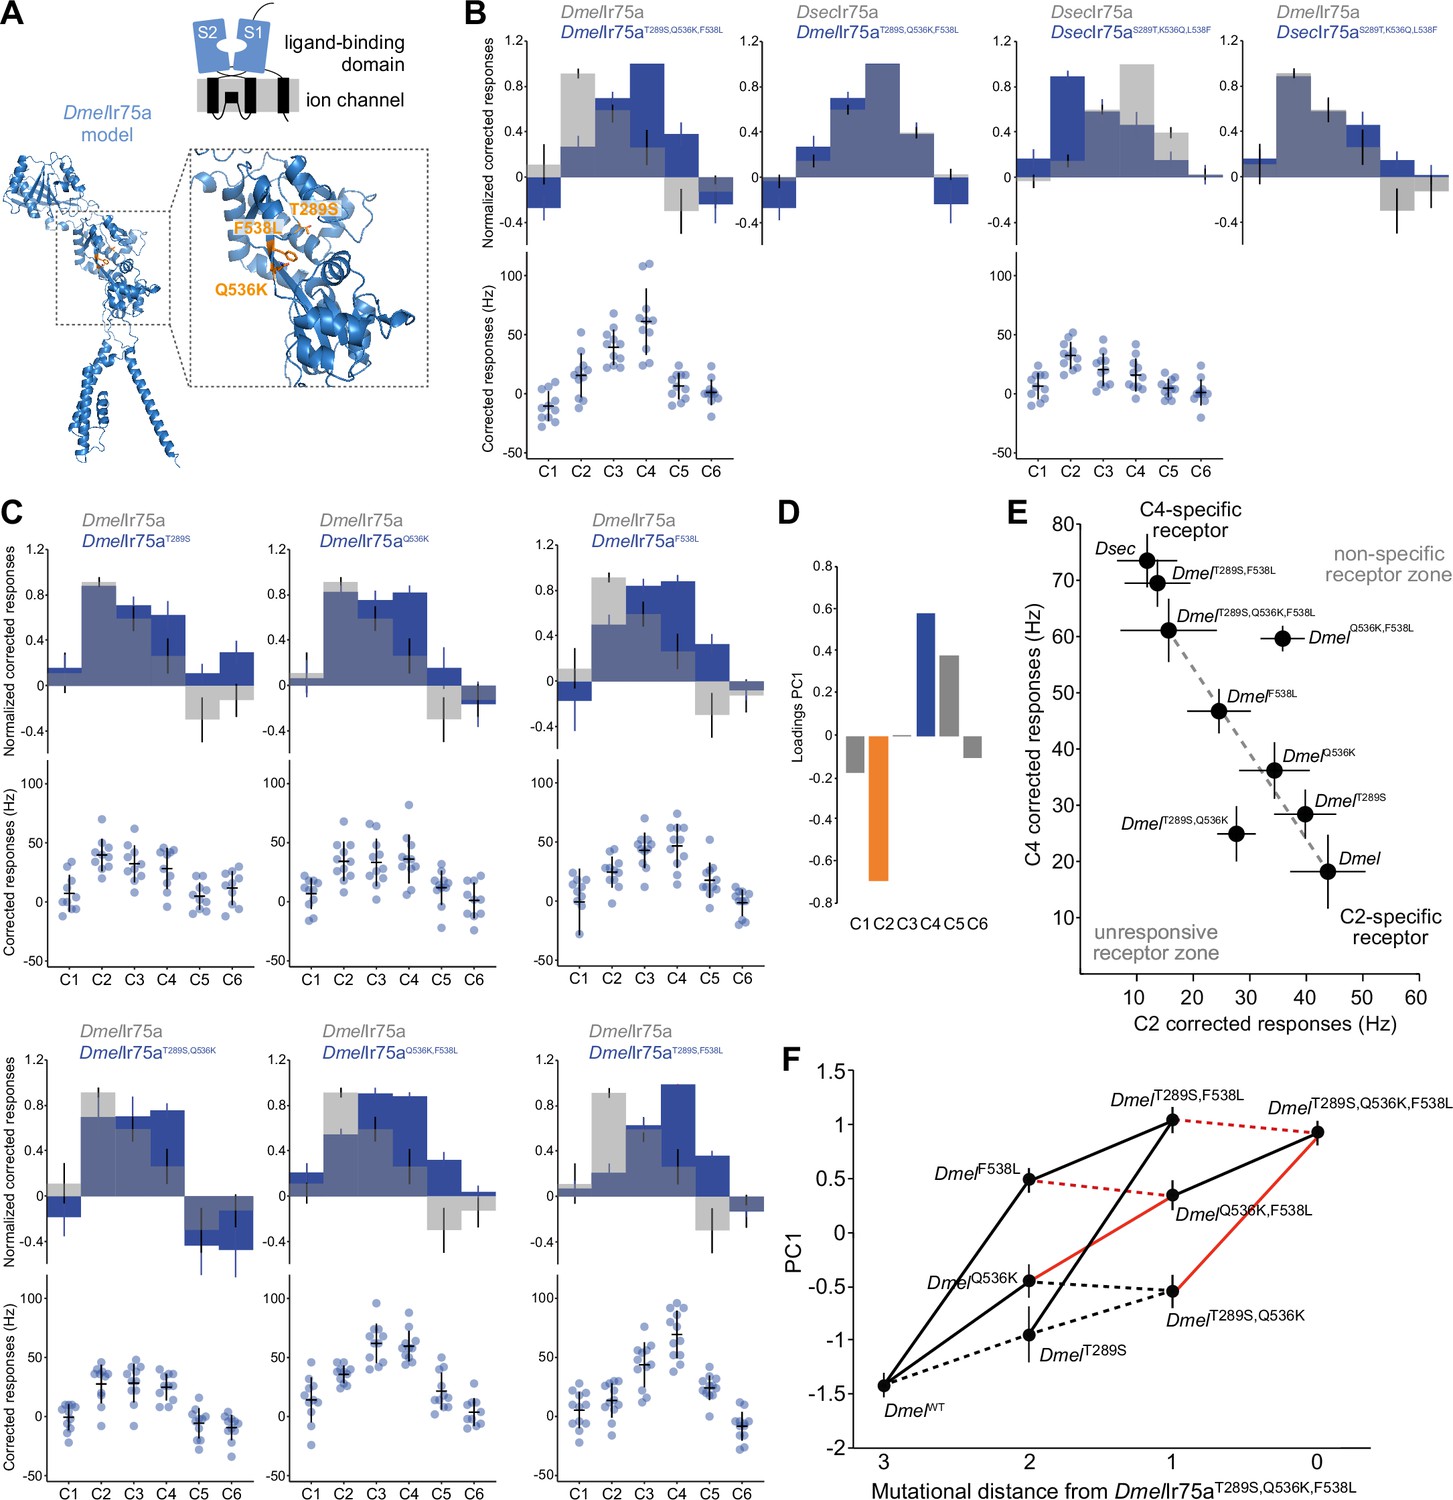
Mapping the evolutionary landscape of Ir75a.
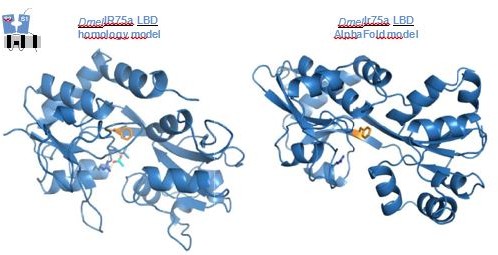
(A) Top: cartoon of the domain organization of Ir75a; bottom: protein model of DmelIr75a, generated by ab initio protein folding by AlphaFold (Jumper et al., 2021). A magnified view of the ligand-binding domain (LBD) is shown on the right, in which the three functionally important amino acid positions that differ between DmelIr75a and DsecIr75a are highlighted in orange. (B, C) Quantification of responses of the indicated receptor versions expressed in the Ir decoder neuron. (D) Loadings of the first principal component of all responses shown in (B, C). (E) Responses of each of the indicated receptor versions plotted in the C2 vs C4 space. (F) Visualization of epistasis and accessible mutational pathways. Each of the individual, double, and triple mutations are plotted in the first principal component (PC1) axis (error bars are standard error of the mean). Possible evolutionary paths join these mutants with lines. Solid lines indicate when the path joins two points that significantly increase PC1 value (i.e., increased responses to C4 and C5 and decreased responses to C2); dashed lines denote paths that, while accessible, do not lead to significantly increased PC1 values (see Source data, for statistical values). Red lines indicate the cases where two mutations interact epistatically when combined, that is, the combination of the two mutations is not equal to the expected response if their effects added linearly (see Materials and methods for details and source data for statistical values).
-
Figure 3—source data 1
Source data for Figure 3B,C,F.
First tab: data for Figure 3B and C, responses in spikes/s of antennal coeloconic 2 (ac2) sensilla from each of the genotypes indicated, and normalized with respect to the maximal response of each sensilla. Second tab: results from the principal component analysis (PCA). Third tab: p values resulting from the statistical analysis in Figure 3F.
- https://cdn.elifesciences.org/articles/69732/elife-69732-fig3-data1-v2.xlsx
Figure 4
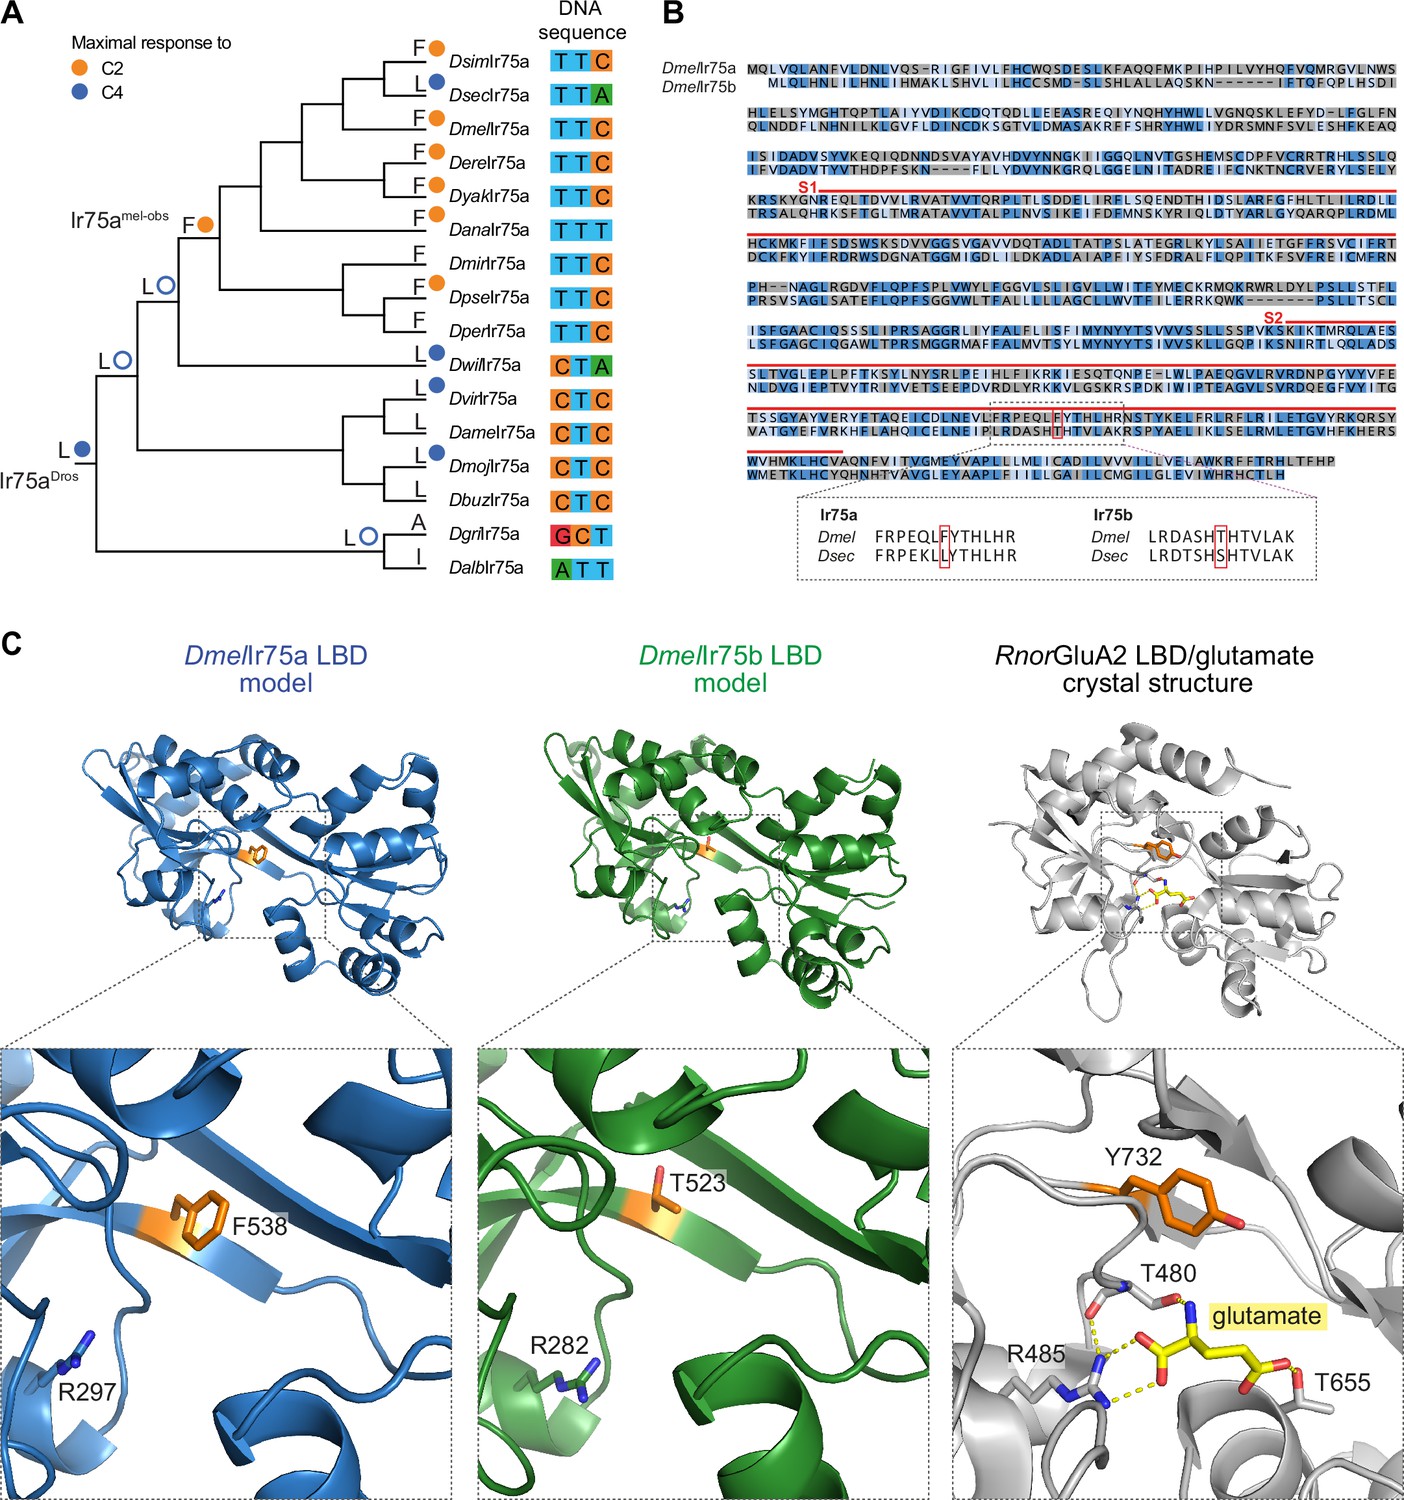
A hotspot for tuning Ionotropic receptor (Ir) sensitivity.
(A) Phylogeny of species’ Ir75a receptors used for the reconstruction of ancestral nodes. The inferred identity of hotspot mutation for key nodes is shown as well as for each of the extant receptors at the end of each leaf, together with the measured (solid circle) or predicted (empty circle) sensitivity. On the right, the nucleotides encoding the hotspot amino acid position in Ir75a across species. (B) Top: protein sequence alignment of DmelIr75a and DmelIr75b. Dark blue indicates identical residues, light blue indicates similar residues, and gray indicates dissimilar residues. The red lines indicate the spans of S1 and S2 lobes of the ligand-binding domain (LBD). The red box indicates the common amino acid position (‘hotspot’). Bottom: separate alignments of the hotspot region in Ir75a and Ir75b for D. melanogaster and D. sechellia proteins showing that while the residue position is conserved, the identity of the amino acids is different for these two receptors. (C) Protein models of the DmelIr75a LBD and DmelIr75b LBD, and X-ray crystal structure of the Rattus norvegicus (Rnor) iGluR GluA2 LBD in complex with glutamate (PDB accession 1FTJ). The hotspot residue in the Irs and the equivalent residue (Y732) in RnorGluA2 are shown in orange. A conserved arginine (R) residue that, in iGluRs, interacts with the glutamate ligand (yellow) is shown (see Discussion). Amino acid numbering corresponds to that of the full-length sequence.
Figure 5
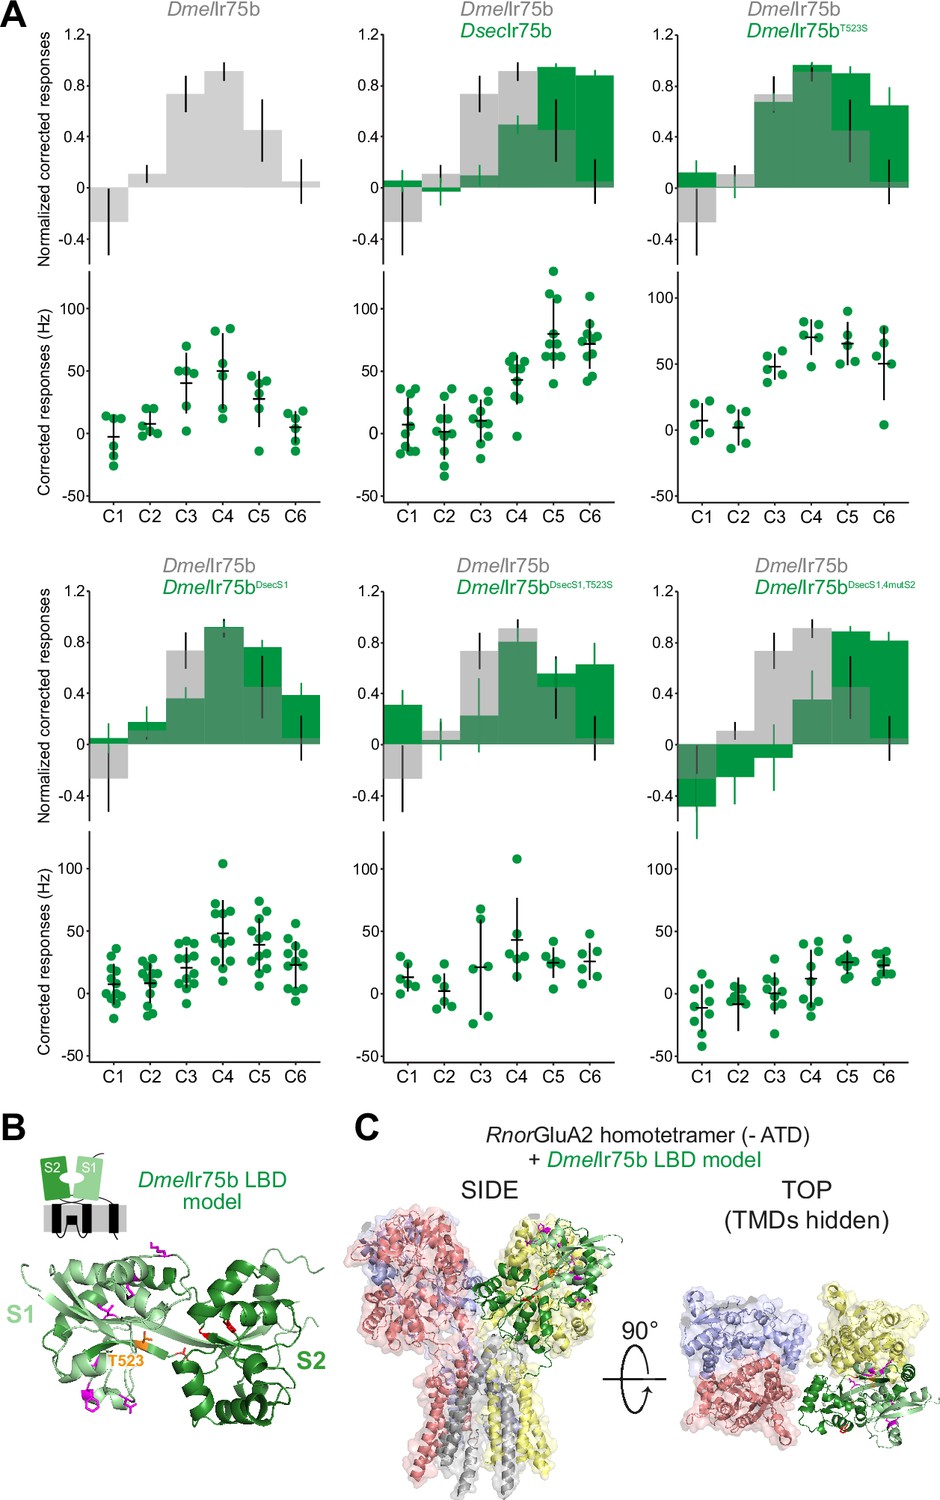
Epistasis in the ligand-binding domain of Ir75b.
(A) Quantification of responses of the indicated wild-type and mutant Ir75b variants expressed in the Ir decoder neuron. The DmelIr75bDsecS1 variant includes the six derived changes between D. sechellia and D. simulans/D. melanogaster as well as a seventh amino acid substitution common to D. sechellia and D. simulans receptors. (B) Protein model of the DmelIr75b ligand-binding domain (LBD) (as in Figure 4C). The S1 and S2 lobes are colored pale and dark green, respectively. Surface-located amino acids that differ between DmelIr75b and DsecIr75b in the S1 domain are depicted in magenta; the hotspot (position 523) is depicted in orange and other residues in the ligand-binding pocket in the S2 domain that are different in DsecIr75b are shown in red. (C) DmelIr75b LBD model (colored as in (B)) aligned to the full-length homotetrameric X-ray crystal structure of RnorGluA2 (PDB accession 3KG2), which is colored by chain in faded gray, red, blue, and yellow (the LBD of the gray chain is hidden to facilitate visualization of the DmelIr75b LBD (green) in this position). The RnorGluA2 amino-terminal domain, which is not present in most Irs (Rytz et al., 2013), has been removed for clarity.
-
Figure 5—source data 1
Source data for Figure 5A.
First tab: data for Figure 5A, responses in spikes/s of antennal coeloconic 2 (ac2) sensilla from each of the genotypes indicated, and normalized with respect to the maximal response of each sensilla. Second tab: p values resulting from the statistical analysis, as discussed in the text.
- https://cdn.elifesciences.org/articles/69732/elife-69732-fig5-data1-v2.xlsx
Author response image 1
Author response image 2
Additional files
-
Supplementary file 1
Nucleotide sequences encoding the reconstructed ancestral Ir75a orthologs.
- https://cdn.elifesciences.org/articles/69732/elife-69732-supp1-v2.txt
-
Transparent reporting form
- https://cdn.elifesciences.org/articles/69732/elife-69732-transrepform1-v2.docx
Download links
A two-part list of links to download the article, or parts of the article, in various formats.
Downloads (link to download the article as PDF)
Open citations (links to open the citations from this article in various online reference manager services)
Cite this article (links to download the citations from this article in formats compatible with various reference manager tools)
Molecular reconstruction of recurrent evolutionary switching in olfactory receptor specificity
eLife 10:e69732.
https://doi.org/10.7554/eLife.69732


