Adult stem cells and niche cells segregate gradually from common precursors that build the adult Drosophila ovary during pupal development
- Department of Biological Sciences, Columbia University, United States
Figures
Figure 1 with 10 supplements
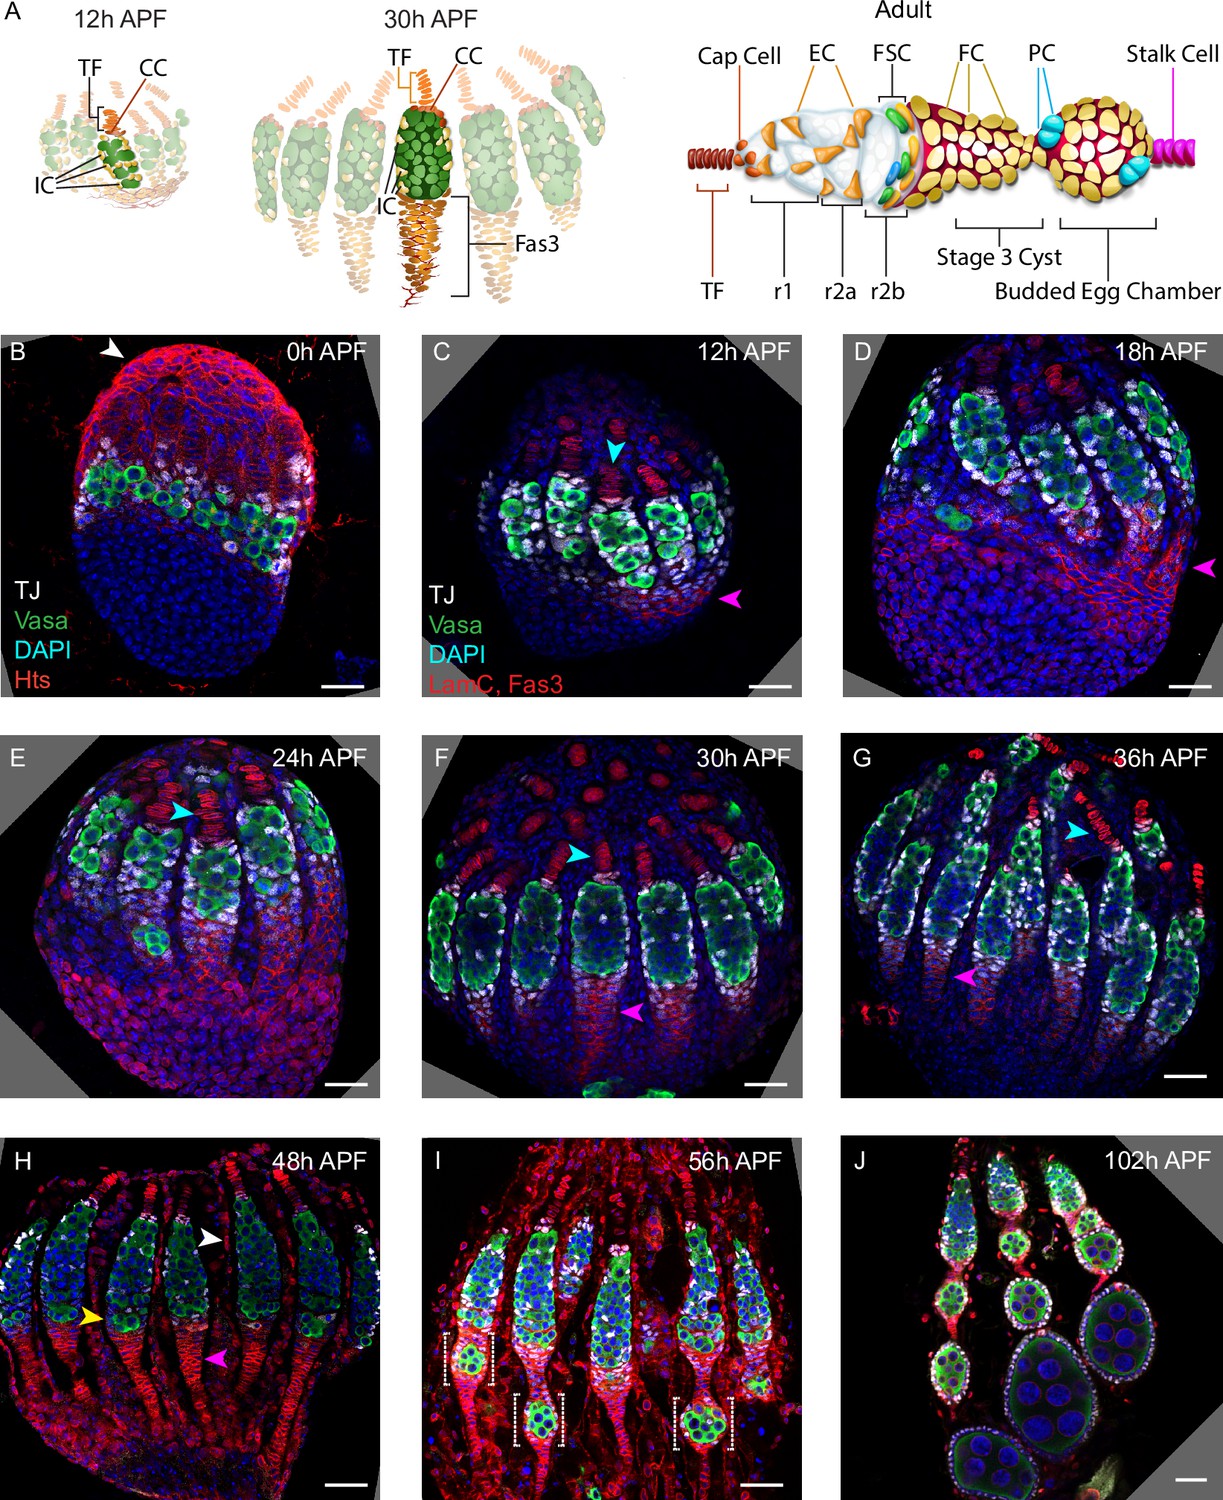
Development of ovarioles during early pupal stages.
(A–J) A time course of pupal ovary development. (A) Cartoons highlight individual germaria from 12 hr after puparium formation (APF), 30 hr APF and adults, showing terminal filament (TF), cap cells (CC), and intermingled cells (IC). In the adult germarium, region 1 (r1) and region 2a (r2a) escort cells (ECs; about 40 in total) surround developing germline cysts (white) and three rings of follicle stem cells (FSCs; about 16 in total) line the germarial circumference. Follicle cells (FCs) all initially express the surface protein Fas3 (red outlines), giving rise to an epithelium of an egg chamber, stalk cells that separate egg chambers, and polar cells (PC), the source of the Upd ligand that activates JAK/STAT signaling to stimulate FSC proliferation and conversion to FCs. (B–J) Vasa (green) marks germline cells, Traffic Jam (TJ, white) marks somatic ICs and DAPI (blue) marks all nuclei. (B) Hts (red) marks apical cells. (C–J) Lamin-C (red) marks TF cells anterior to ICs (cyan arrowheads in C–G), while Fas3 (also red) marks cells posterior to ICs that form a basal stalk (pink arrowheads in C–G). All scale bars, 20 µm. (B) At 0 hr APF, ovaries are not yet organized into distinct germaria. Individual germline cells (green) are intermingled with somatic IC precursor cells (white). The medial side of the ovary (right) has more developed TF. ‘Apical cells,’ the precursors of epithelial sheath cells, are located at the apical (top) side of the ovary (white arrowhead). (C) At 12 hr APF, ovaries are organized into distinct germaria, separated by a layer of migrating apical cells. Lamin-C stains the nuclear envelope of TF cells (cyan arrowhead). Fas3 staining is present on the medial side of the ovariole (pink arrowhead). TJ staining of somatic cells extends slightly beyond the germline. (D) At 18 hr APF, more cells express Fas3 (red; pink arrowhead), and (E) by 24 hr APF, Fas3 is spread more evenly around the circumference of the ovary, and stains a hub into which the posterior ends of nascent basal stalks converge. (F, G) By 30–36 hr APF, individual germaria are farther apart, separated by epithelial sheath cells that express Lamin-C weakly, and basal stalks (pink arrowheads in F–H) begin to narrow. (H) By 48 hr APF, Fas3 begins to be expressed dimly in posterior ICs (yellow arrowhead) and Lamin-C expression (red) is clear in epithelial sheath cells (white arrowhead). (I) At 56 hr APF, germaria begin to bud the first egg chamber and (J) by 102 hr APF, 3–4 egg chambers have budded. See also Figure 1—figure supplements 1–2.
Figure 1—figure supplement 1
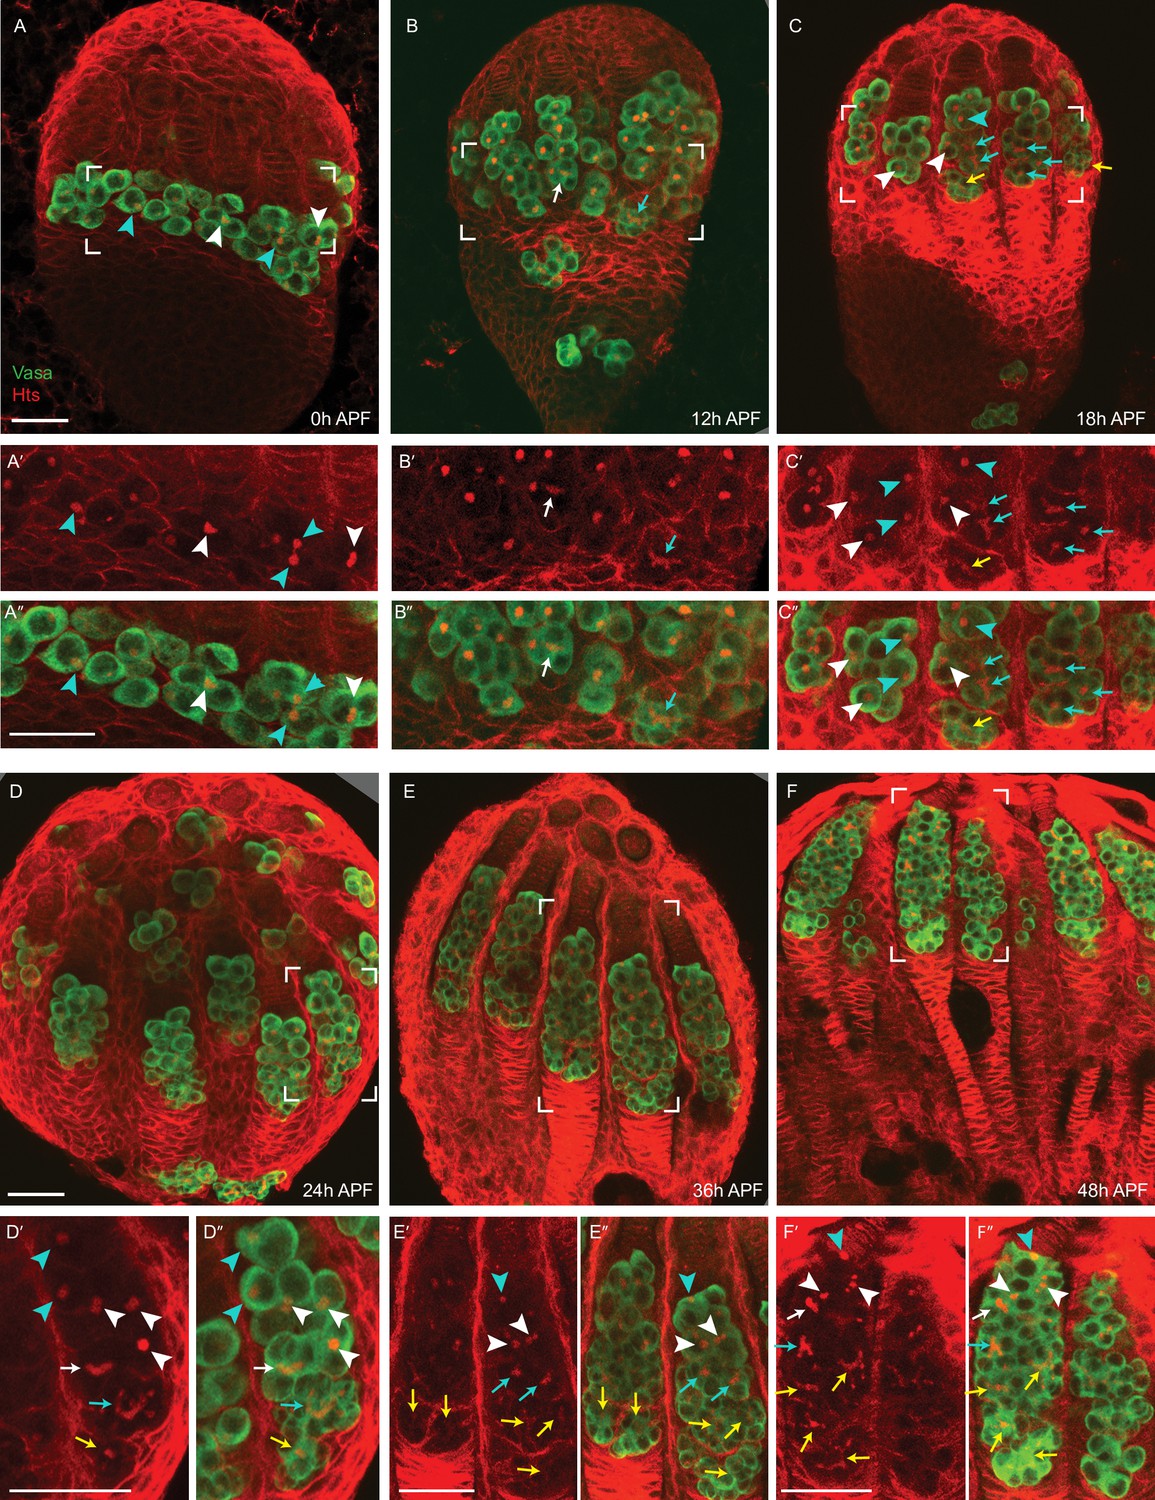
Germline development during early pupal stages.
(A–F) Germline development at the indicated times after puparium formation (APF) was monitored with Hts (red), which stains spherical spectrosomes and branched fusomes in germline cells as well as the surface of many somatic cells, and Vasa (green), which identifies germline cells. The number of germline cells within a cyst was determined by examining the fusome connecting clustered Vasa-positive cells over a range of z-sections (here, single or small numbers of superimposed z-sections are shown). For each sample, a close-up of the region outlined with white brackets is shown (A’–F’) without or (A”–F”) with the Vasa fluorescence channel. (A–F) Germaria progressively lengthen from anterior (apical, top, future anterior) to posterior (basal, bottom, future posterior) as germline cells become more numerous. The number of germline cells in a cyst is indicated as 1 (cyan arrowhead), 2 (white arrowhead), 4 (white arrow), 8 (cyan arrow), or 16 (yellow arrow). (B, D) Some germline cells migrate through the basal cells to become stranded at the posterior of the ovary. (A–A’’) At 0 hr APF, germline cells are single cells (cyan arrowheads) or two cell cysts (white arrowheads). (B–B’’) At 12 hr APF, the majority of germline cells have one or two cells, but posterior cysts may have four (white arrow) or eight cells (cyan arrow). (C–C’’) At 18 hr APF, there is a large range of germarial length and corresponding posterior cyst maturity. Longer germaria have 16 cells in posterior cysts (yellow arrows), whereas short germaria have only 2 cells in posterior cysts (white arrowhead). (D–D’’) At 24 hr APF, the majority of germaria have 16 cells in posterior cysts (yellow arrows) but the most posterior cyst has not yet moved beyond other cysts. (E–E’’) At 36 hr APF, a single cyst resides at the posterior of most germaria but in some cases the most posterior 16-cell cyst has not yet been resolved. (F–F’’) By 48 hr APF, each germarium has a single most posterior 16-cell cyst. Scale bars, 20 μm.
Figure 1—figure supplement 2
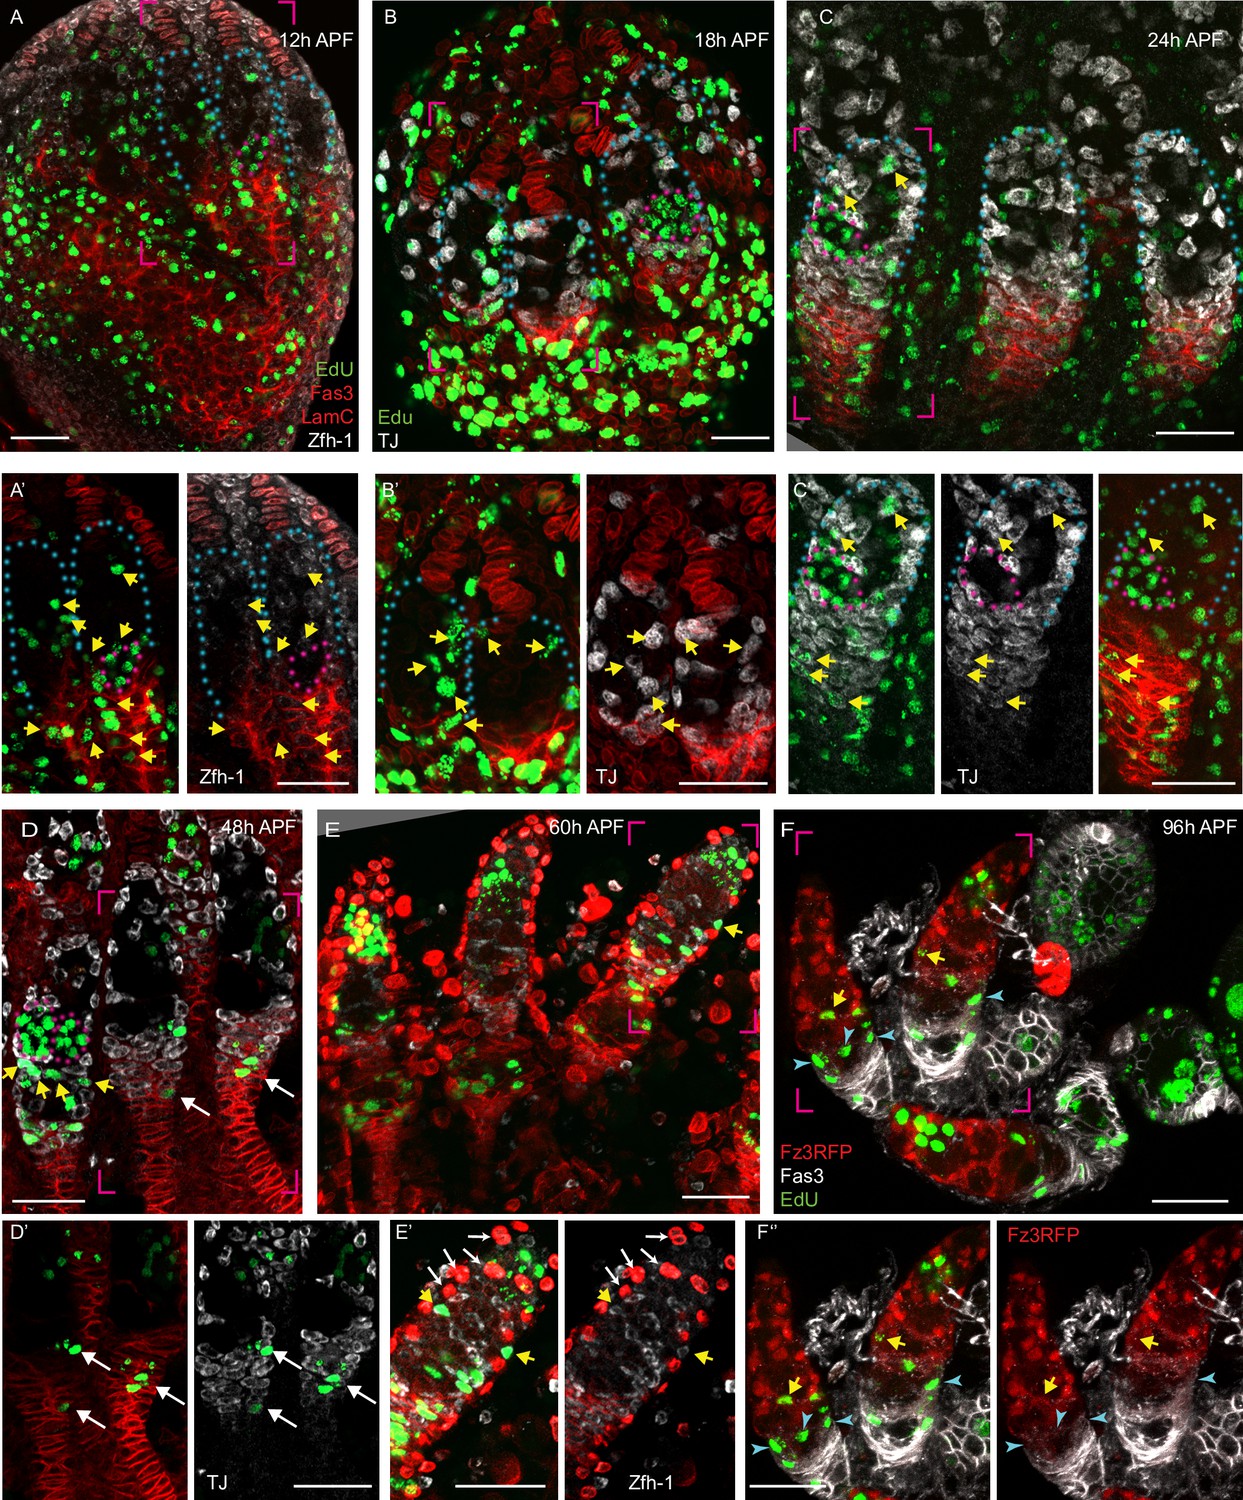
Pattern of division of germline and somatic cells in pupal ovaries.
(A–F) Pupal ovaries from 0 to 96 hr after puparium formation (APF) were incubated with EdU (visualized in green) to label S-phase cells prior to fixation and stained for (A, E) Zfh-1 (white), (B–D) Traffic Jam (TJ) (white) or (F) Fz3-RFP (red) to identify somatic cells, (A–E) Lam-C and Fas3 (both red), to mark terminal filament (TFs) and basal stalks, respectively or (F) Fas3 only (white). Blue dotted lines outline individual germaria, and pink bracketed regions are expanded in panels below each main image. All scale bars are 20 µm. (A–C) EdU (green) in the most posterior germline cyst (pink outlines) was seen at (A’) 12 hr APF, (B) 18 hr APF, and (C’) 24 hr APF. (A–F) Somatic cells with (green) EdU (yellow arrows) were observed (A–C) among all intermingled cells (ICs) and at higher frequency in Fas3-positive cells posterior to the developing germarium from 12 to 24 hr APF. (D–F) ICs in the anterior third of the germarium were rarely labeled at 48 hr APF or later (green signals without yellow arrows are germline cells), but (D, D’) TJ-positive, Fas3-positive extra-germarial crown (EGC) cells were frequently labeled (white arrows) and (E, E’) a few ICs in the anterior half of the germarium (shown in different z-sections in E’) were still labeled at 60 hr APF before (F) EdU labeling was confined to more posterior cells by 96 hr APF. (E, E’) At 60 hr APF, one egg chamber has budded and Lam-C stains epithelial sheath cells (white arrows). (F) At 96 hr APF, three egg chambers have budded. Here, many somatic cells are labeled with EdU close to a stage 2b germline cyst (blue arrowheads).
Figure 1—video 1
Full z-section stacks of a 0h APF ovary.
Figure 1—video 2
Full z-section stacks of a 12h APF ovary.
Figure 1—video 3
Full z-section stacks of a 18h APF ovary.
Figure 1—video 4
Full z-section stacks of a 24h APF ovary.
Figure 1—video 5
Full z-section stacks of a 30h APF ovary.
Figure 1—video 6
Full z-section stacks of a 36h APF ovary.
Figure 1—video 7
Full z-section stacks of a 48h APF ovary.
Figure 1—video 8
Full z-section stacks of a 56h APF ovary.
Figure 2
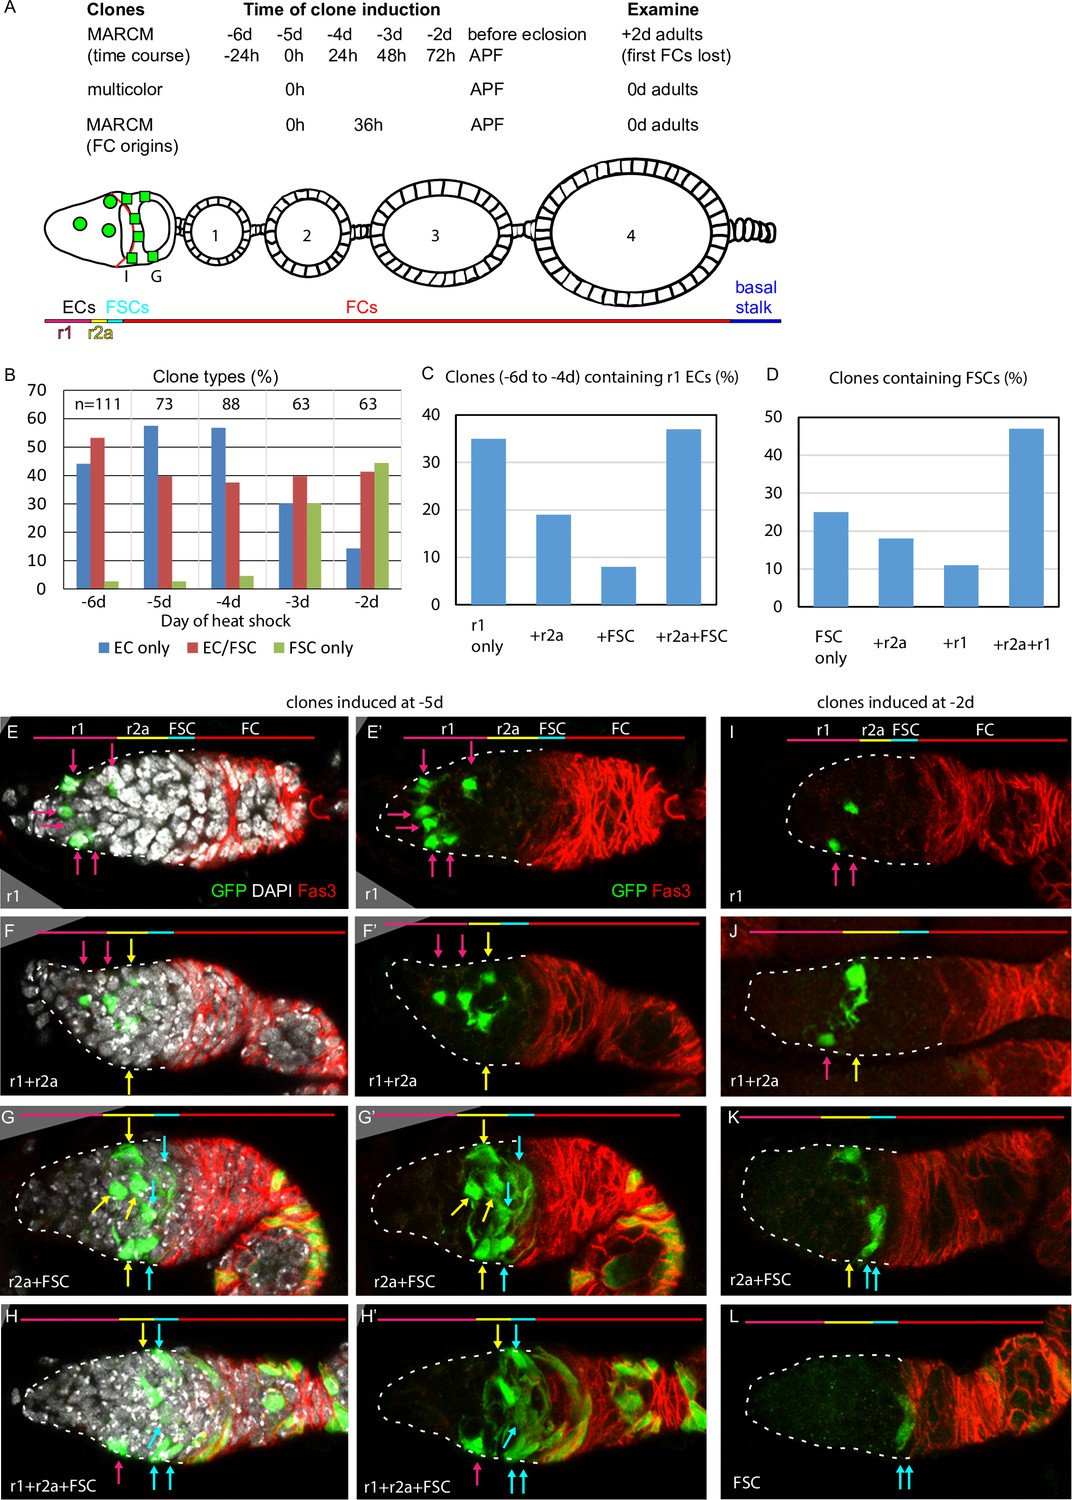
Common precursors for follicle stem cells (FSCs) and escort cells (ECs) with derivatives clustered along the AP axis.
(A) Summary of lineage tracing experiments performed in this study. The ovariole of a newly eclosed adult, which has four egg chambers, is depicted with an example lineage (green cells). In the first set of experiments (‘time course’), we dissected ovarioles from adults 2d after eclosion (‘+2d’), having induced MARCM clones daily (in separate experiments) between 6d and 2d before eclosion (‘–6d’ to ‘–2d’), corresponding to the given times after puparium formation (APF). The second approach used multicolor labeling to reduce the frequency of distinctly marked lineages, so that ovarioles rarely contain more than one lineage of the chosen color. The third approach examined ovarioles from newly eclosed adults to capture all labeled follicle cells (FCs) produced during pupation. Labeled cells were scored as r1 (magenta) or r2a (yellow) ECs, FSCs (blue), or FCs (red); color code depicted at the bottom of (A) and the top of (E–L). Marked FC locations were scored as immediately posterior (I) to the Fas3 border (red) , in the posterior half of the germarium (G) and around each numbered egg chamber (1–4). (B–L) GFP-labeled MARCM clones were induced from 6d to 2d before eclosion and flies were dissected 2d after eclosion. In each germarium, labeled cells were scored as region 1 (r1) ECs, region 2a (r2a) ECs, or FSCs. (B) Most clones initiated 4–6d before eclosion contained only ECs (blue) or FSCs together with ECs (red), indicating a common precursor. Clones containing only ECs declined and clones containing FSCs but no ECs (green) increased in frequency when initiated at later times. (C, D) Data were pooled from clones induced from –4 to –6d. (C) Clones containing r1 ECs (n = 174) were grouped according to the additional cell types they contained; inclusion of other r1 ECs was the most frequent, and r2a ECs were more commonly included than more distant FSCs. (D) Clones containing FSCs (n = 155) contained r2a ECs more frequently than r1 ECs. (E–H) Examples of clones induced 5d before eclosion demonstrate the clustering of marked cells (green) along the anterior (left) to posterior (right) axis. The anterior Fas3 (red) border, viewed in each z-section, allows distinction between FCs and FSCs (in the three layers anterior to Fas3); several z-sections were combined to show all labeled cells in one image. DAPI (white) staining reveals all nuclei but is omitted in (E’–H’) and (I–L) for clarity. GFP-marked clones have (E) a cluster of r1 ECs (magenta arrows), (F) a cluster of r1 and r2a ECs (yellow arrows), (G) a cluster of r2a ECs and FSCs (blue arrows), and (H) r1 and 2a ECs with FSCs. (I–L) Clones induced 2d before eclosion also showed clustering of progeny, with (I) r1 ECs only, (J) r1 and r2a ECS, (K) r2a ECs and FSCs, and (L) FSCs only. Scale bars, 20 µm.
-
Figure 2—source data 1
Numerical data for graphs in Figure 2.
- https://cdn.elifesciences.org/articles/69749/elife-69749-fig2-data1-v3.xlsx
Figure 3
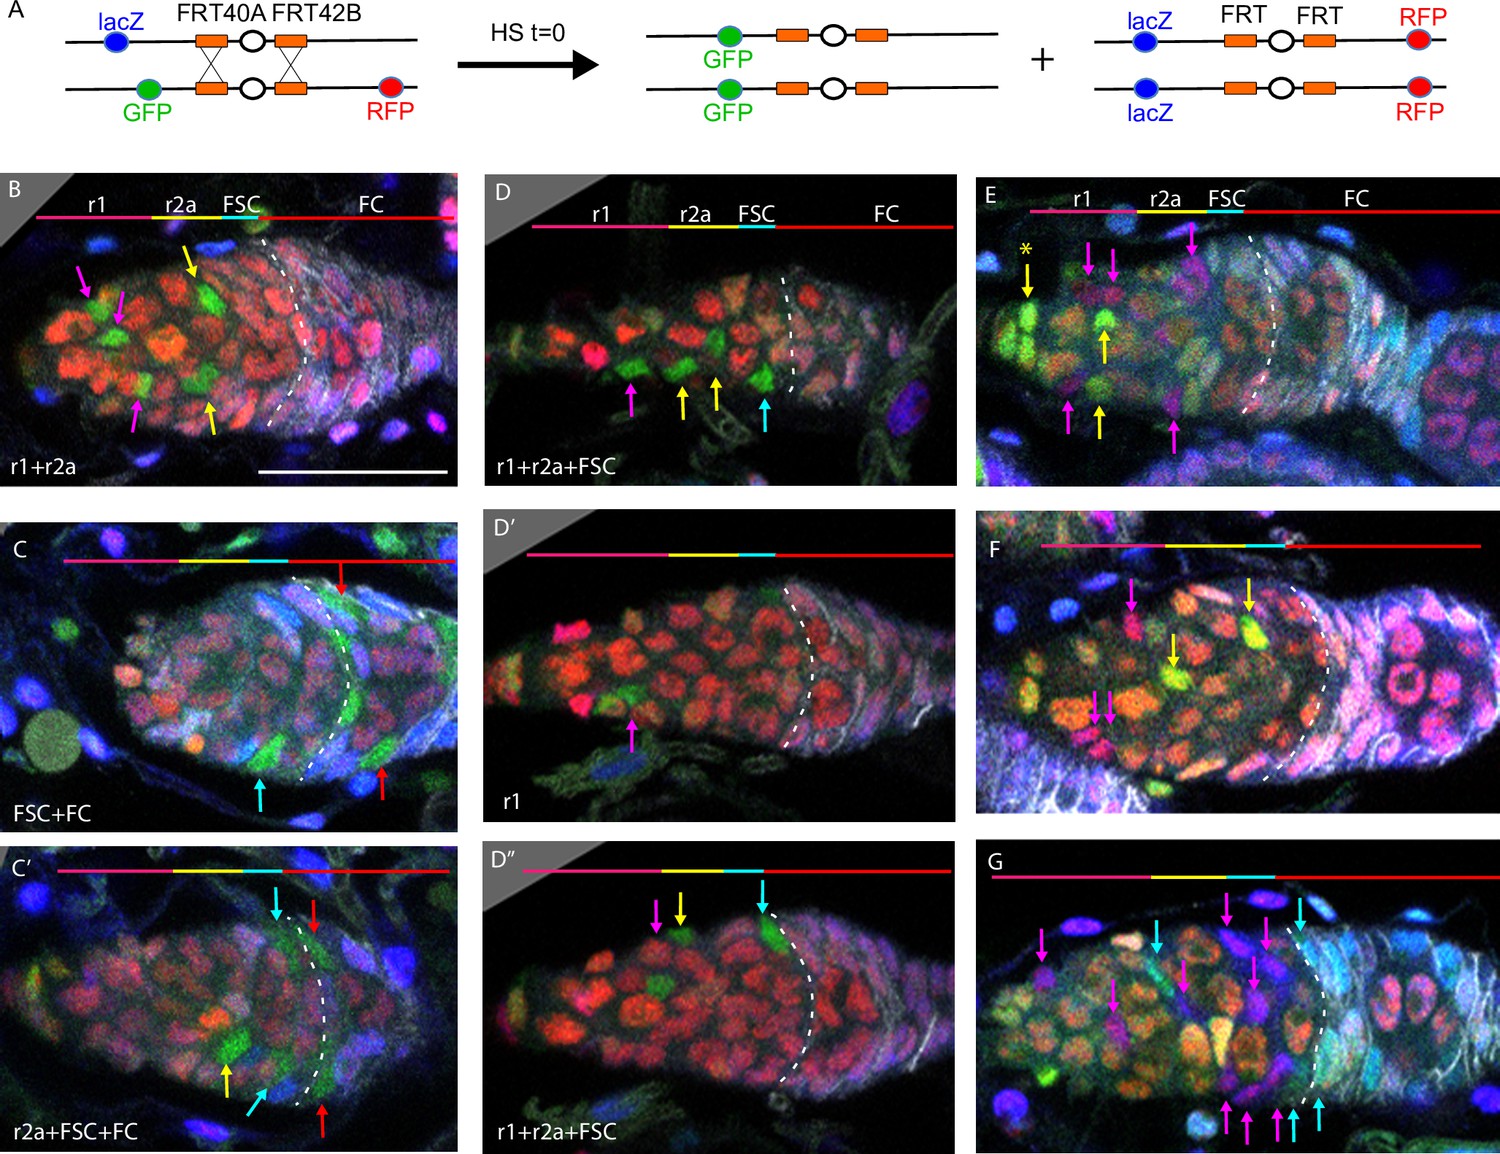
Multicolor labeling of precursors shows clustering of progeny along the AP axis.
(A) Second chromosome genotype of multicolor flies used for multicolor lineage tracing of precursors, showing tub-lacZ (lacZ), ubi-GFP (GFP), and His2Av-RFP (RFP) transgenes and FRT 40A and FRT 42B recombination targets either side of the centromere (white oval). Heat-shock induction of a hs-flp transgene on the X-chromosome can induce recombination independently at either pair of FRTs, making one or both chromosome arms homozygous in daughter cells, thereby eliminating one or more of the marker genes. One possible outcome is shown. One daughter has GFP-only and the other daughter has a complementary genotype (lacZ plus RFP); it is generally possible to identify sister ‘twin-spot’ lineages for other outcomes. (B–G) Multicolor lineage tracing was performed by inducing clones 5d before eclosion and dissecting newly eclosed flies. The anterior limit of Fas3 staining is marked by a white dashed line. Scale bar in (B) applies to all images, 20 µm. Precursors produce r1 (magenta) and r2a (yellow) escort cells (ECs), follicle stem cells (FSCs) (blue), and follicle cells (FCs) (red) in overlapping zones, indicated by the colored zones and in (B–D) corresponding arrow colors. (B–D) show examples of GFP-only clones (green), which are generated by two recombination events and are therefore infrequent. (B) A clone containing r1 and r2a ECs. (C, C’) Different z-planes of a germarium show a clone containing an r2a EC, FSCs, and FCs (only cells present in the z-section shown are listed in white). (D–D’’) Three z-planes of a germarium showing a clone with r1 and r2a ECs and FSCs. (E–G) Examples of two clones of different colors in overlapping or adjacent zones, where arrow color indicates the clone color, not the cell type. (E) A GR (GFP plus RFP) clone (yellow arrows) contains r1 ECs and cap cells (extreme left), and a BR (lacZ plus RFP) clone (magenta arrows) contains r1 and r2a ECs. (F) A BR clone (magenta arrows) contains r1 ECs, and a GR clone (yellow arrows) contains a r2a EC and an FSC. GR and BR clones are potential twin-spot descendants of the two daughters of a parent cell undergoing recombination. (G) A BR clone (magenta arrows) contains ECs and FSCs, and a BG (lacZ GFP) clone (cyan arrows) contains a r2a EC, FSCs, and FCs.
Figure 4
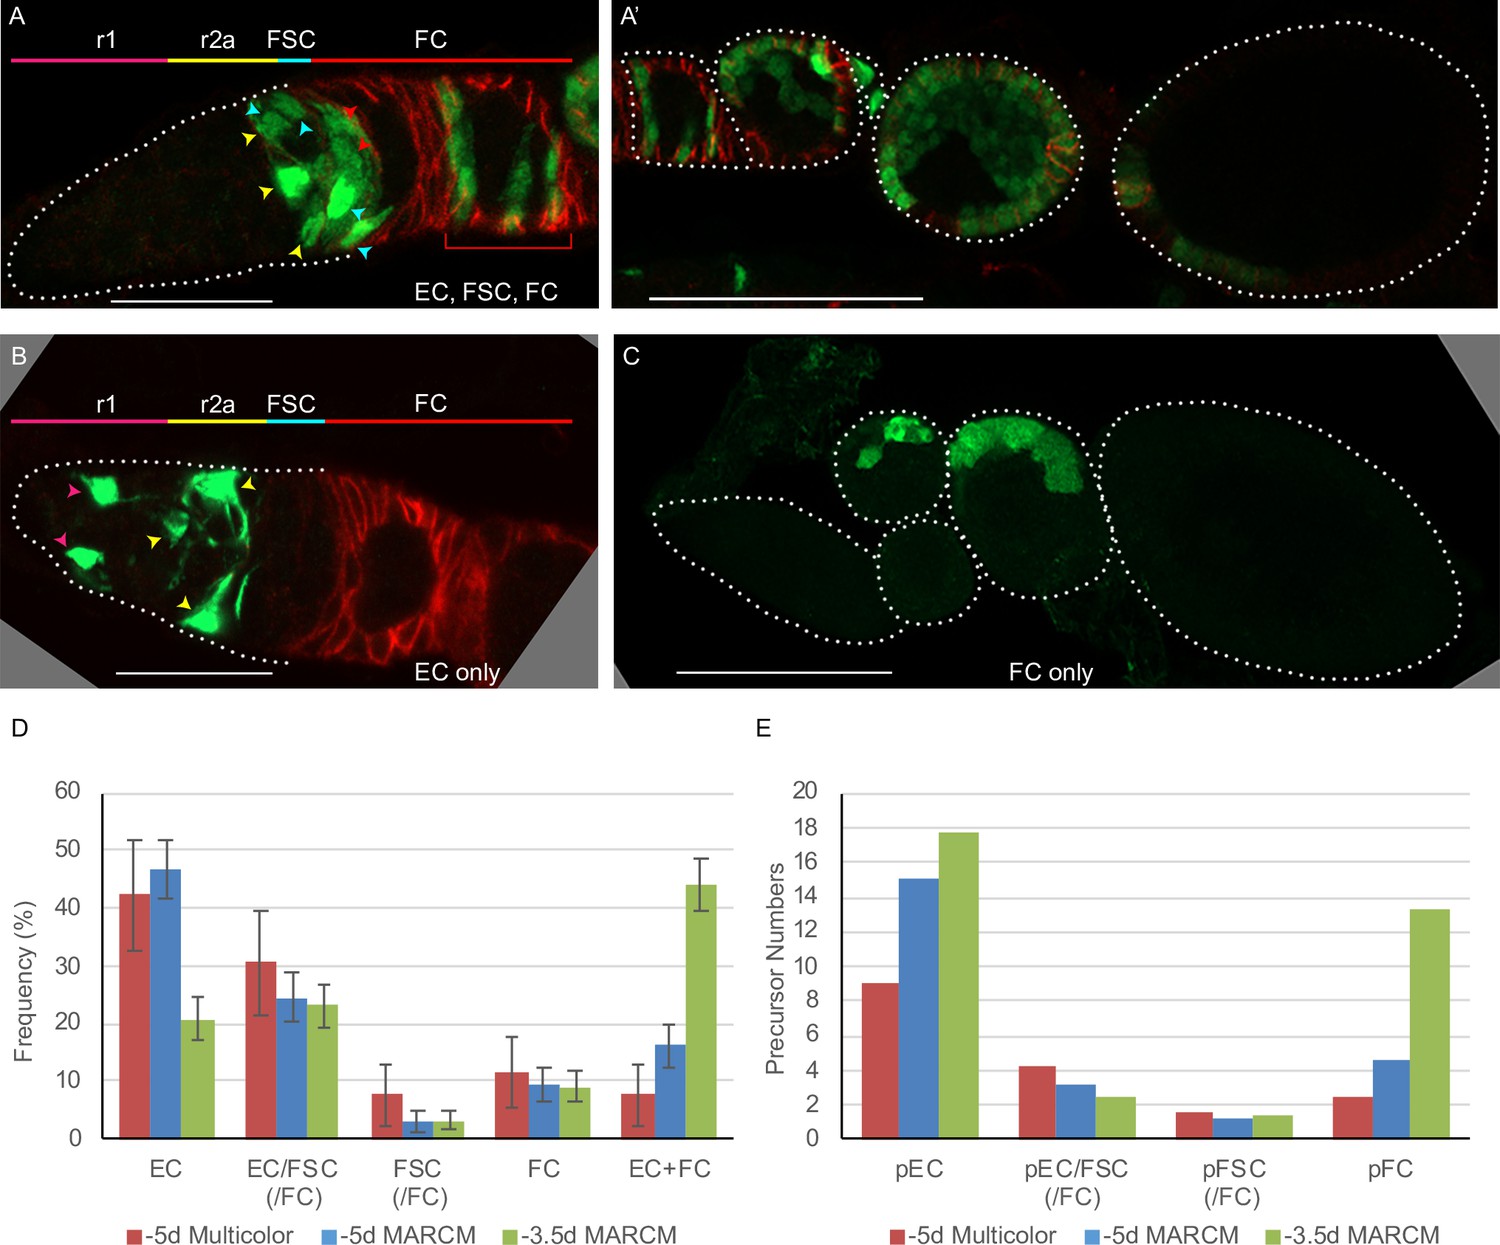
Follicle cell origins and deduced precursor numbers for escort cells (ECs), follicle stem cells (FSCs), and follicle cells (FCs).
(A–C) GFP-labeled MARCM clones (green) were induced 5d before eclosion (0h APF) and ovaries were dissected from newly eclosed adults in order to detect all FCs produced during pupation. Fas3 is stained in red and cell types are indicated with color-coded arrows, matching the labeled AP domains. Scale bar in (A, B), 20 μm; (A’, C), 50 μm. (A) Germarium and (A’) the rest of the ovariole of the same sample (the first egg chamber is in both images), showing a clone with marked ECs, FSCs, and FCs (marked FCs are in the germarium and egg chambers 1–4). (B) A clone containing only ECs (no cells were marked in the rest of the ovariole). (C) A clone containing only FCs in egg chambers 2 and 3. (D) Distribution of clone types in GFP-only clones of multicolor flies and MARCM clones initiated 5d (0h APF) or 3.5d (36h APF) before eclosion, all examined in newly eclosed adults. Clone types are EC (EC-only), EC/FSC (ECs and FSCs, with or without FCs), FSC (with or without FCs), FC (FC-only), and EC+ FC. Ovarioles with only marked ECs and FCs likely harbor two independent lineages. (E) Estimates of numbers of dividing precursor types at the time of clone induction for the same three lineage experiments as in (D), after accounting for double clones (see Materials and methods and Table 3). Precursor types are defined by their adult products: pEC (only ECs), pEC/FSC (ECs and FSCs, with or without FCs), pFSC (FSCs with or without FCs), and pFC (only FCs).
-
Figure 4—source data 1
Numerical data for graphs in Figure 4.
- https://cdn.elifesciences.org/articles/69749/elife-69749-fig4-data1-v3.xlsx
Figure 5
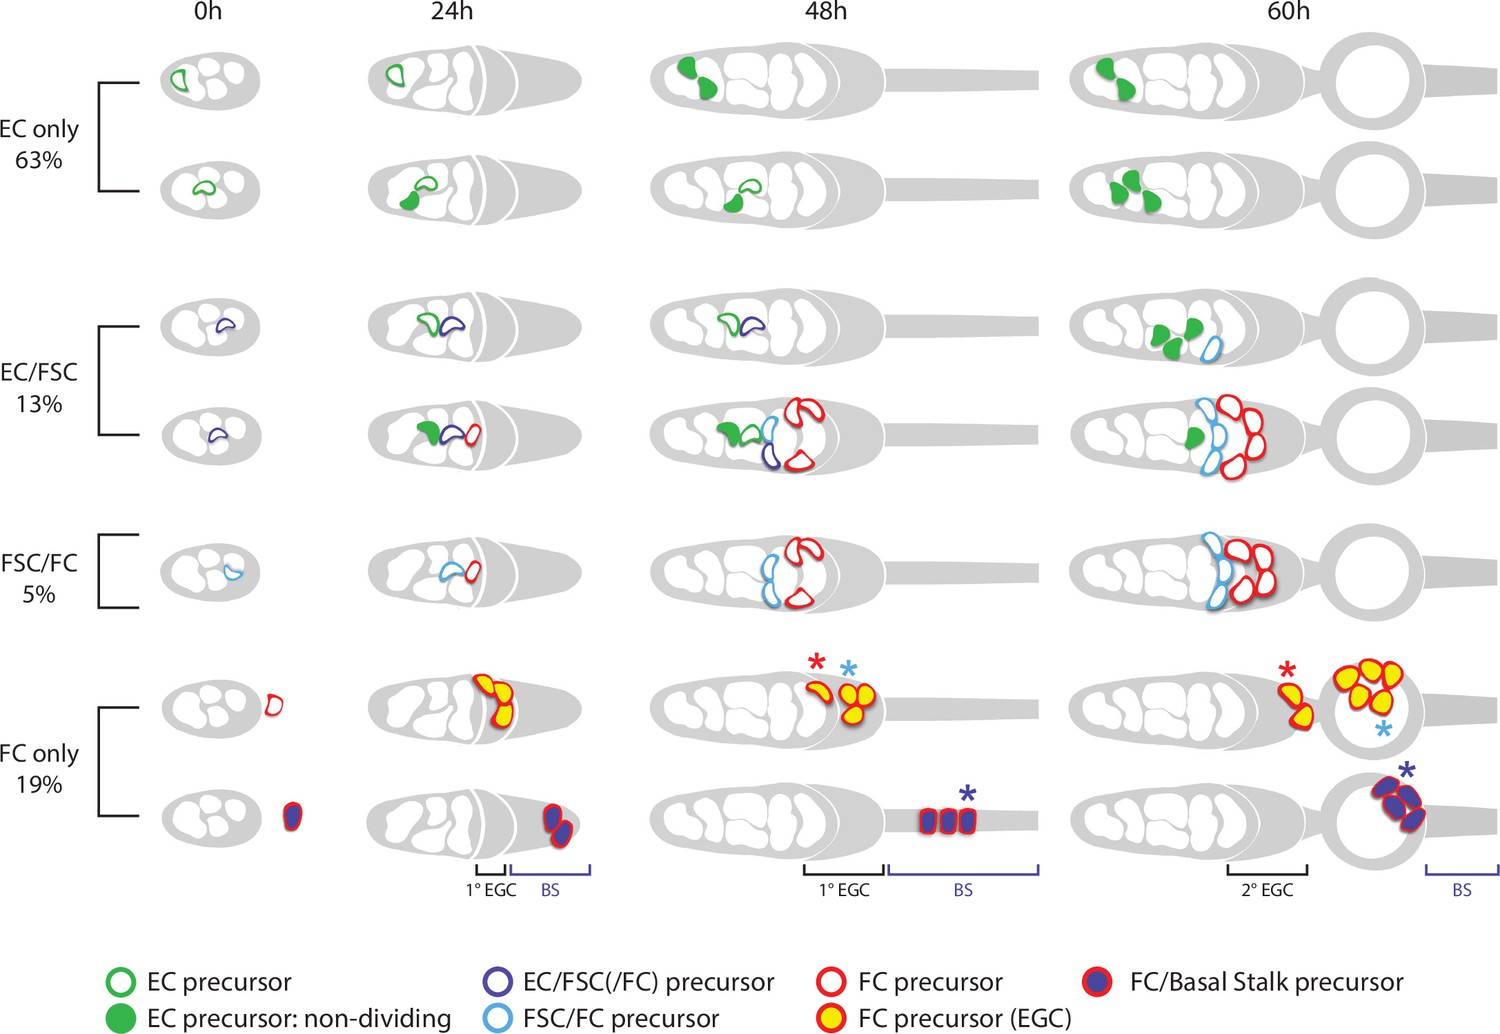
Summary of precursor lineage development.
Summary cartoon of the fate of single precursor types from 0 hr after puparium formation (APF) until 60 hr APF deduced from lineage studies and pupal ovary imaging. The indicated frequency of clone types is drawn from the inference of single-cell lineages for MARCM clones induced at 0 hr APF (Table 3). Most 0 hr APF precursors generate only adult escort cells (ECs), with more anterior (left) precursors producing only r1 ECs (top row) and more posterior precursors also producing r2a ECs and more cells in total (second row). Filled green cells have ceased division. Most 0 hr APF follicle stem cell (FSC)-producing precursors also produce ECs (purple outlines). Some of these, more anterior, precursors (third row) do not produce follicle cells (FCs) but most (fourth row) also produce cells (red outline) that will become FCs (but not in the first-formed egg chamber). Precursors that produce adult FSCs but not ECs (blue outline) also produce FCs (fifth row). The most posterior precursors produce only FCs. A subset of progeny accumulate posterior to the germarium from 24 hr APF onward in the primary (1o) EGC (depicted as a posterior gray crown) and further posterior in the basal stalk (BS). Examples of origination from extra-germarial crown (EGC) cells (yellow fill, row 6) and BS cells (purple fill, row 7) at 24 hr APF are shown, but the most posterior intermingled cells (ICs) (just anterior to EGC cells) can also yield lineages containing only FCs. Most cells in the EGC will become FCs of the first budded egg chamber (sixth row; the cell denoted by the blue asterisk is modeled after the cyan cell in Figure 9). Others, like the cell on the posterior cyst at 48 hr APF, denoted by the red asterisk (modeled on the top red cell in Figure 9), move into the secondary EGC at 60 hr and later become FCs on the second budded egg chamber. Most precursors present in the BS at 48 hr APF (row 7) move onto the first budded cyst (the cell denoted by the blue asterisk is modeled after the white cell in Figure 9). Some of the most posterior BS precursor progeny remain in the BS throughout pupation (not shown). More posterior precursors are shown producing larger numbers of progeny because anterior cells divide more slowly and arrest division prior to eclosion.
Figure 6
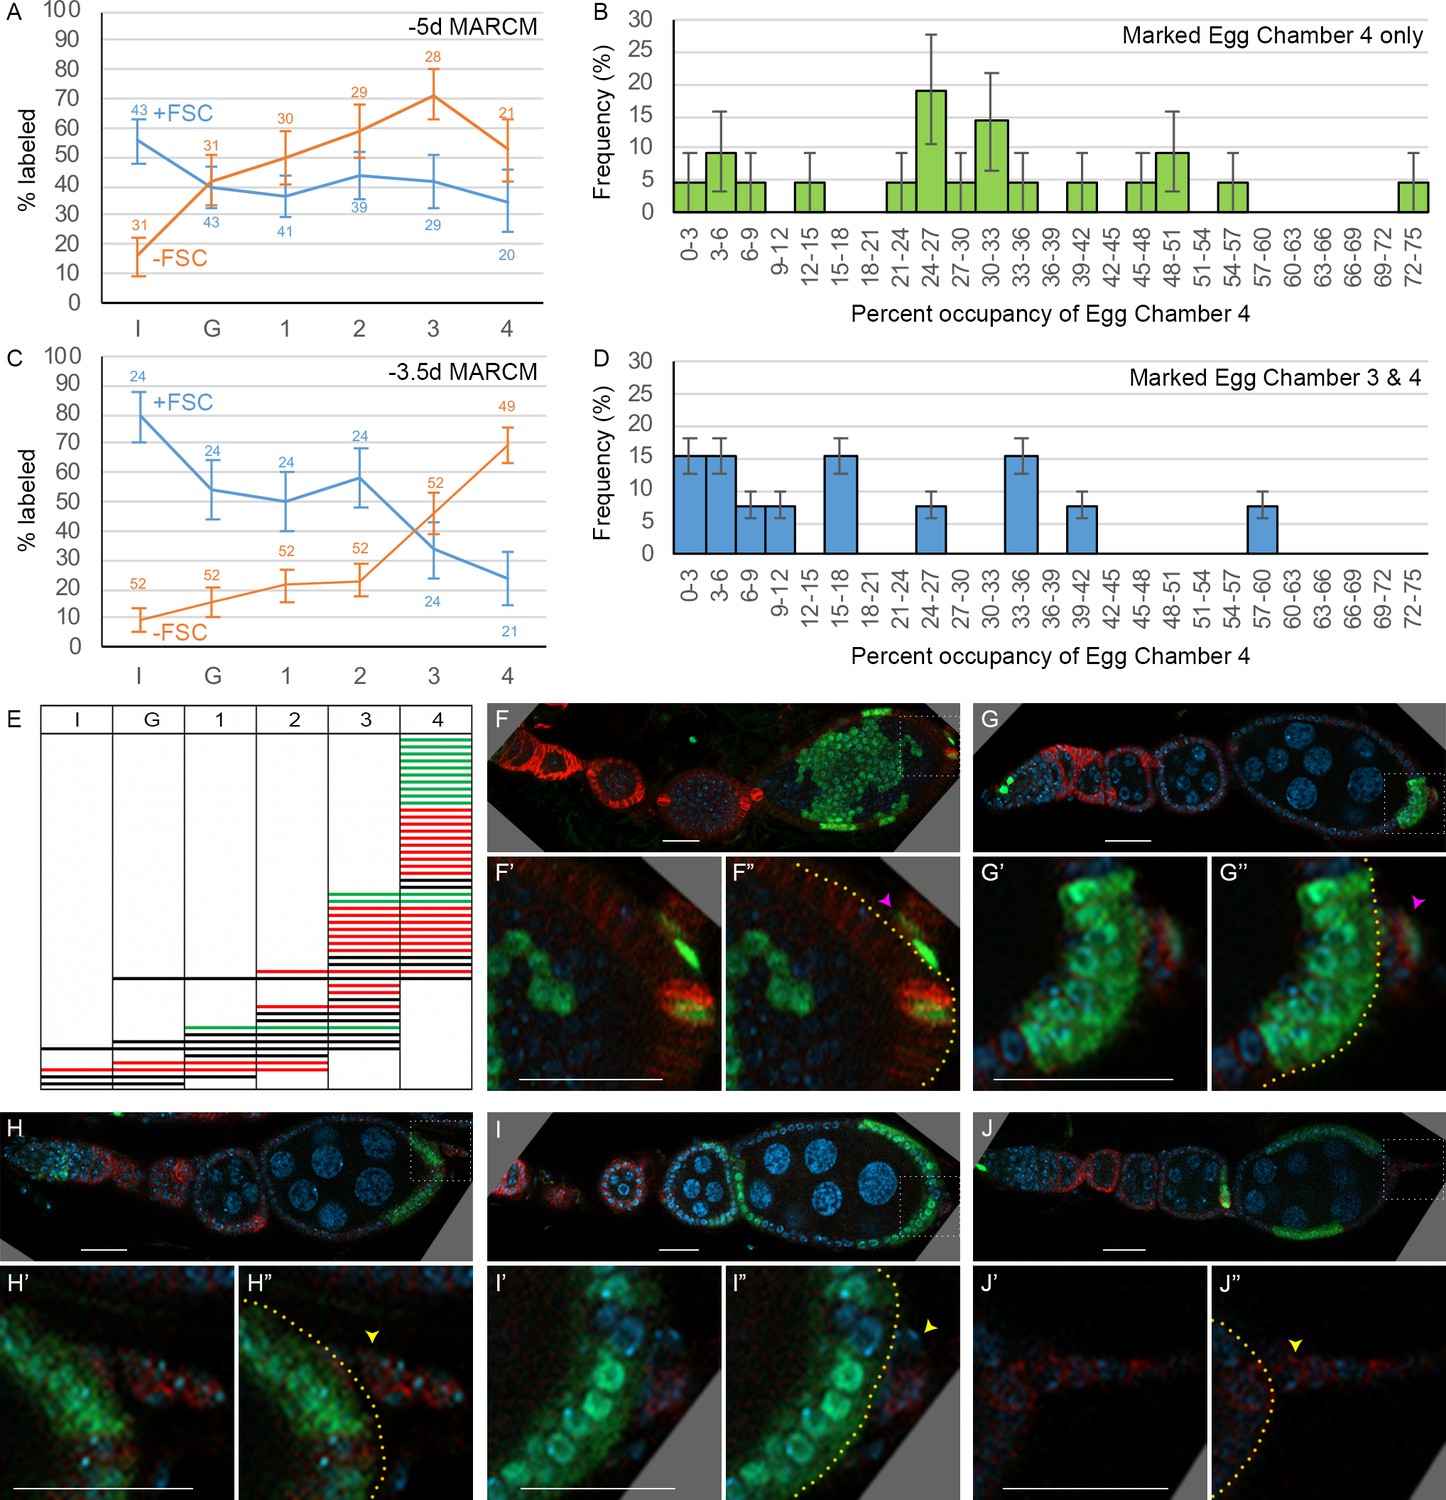
Patterns of follicle cell (FC) contributions indicate distinct pools of precursors along the AP axis.
(A, C) Percentage of ovarioles containing labeled FCs that have marked FCs in germarial region 2b (I), region 3 (G), or egg chambers 1, 2, 3, or 4 (see Figure 2A) in newly eclosed adults for (A) –5d MARCM and (C) –3.5d MARCM clones with follicle stem cells (FSCs) (blue line) or with no FSCs (‘FC-only,’ orange line). The total number of ovarioles scored is indicated either side of the error bars (SEM); some ovarioles had only three egg chambers and some were not fully imaged. (B, D) MARCM clones induced at –3.5d and analyzed in newly eclosed adults. Marked occupancy of egg chambers was scored as a percentage of all FCs in egg chamber 4 that were marked when there were marked FCs (B) only in egg chamber 4 or (D) in egg chambers 3 and 4. The frequency of different occupancy ranges is displayed in bins of 3%. (E) Distribution amongst germarial region 2b (I), region 3 (G), and egg chambers 1–4 of FC-only clones (no marked FSCs) in newly eclosed flies after marking at –3.5d. Each row indicates a single ovariole. The colors indicate if a marked cell is present in the basal stalk (green), absent from the basal stalk (red), or if the basal stalk was not clearly imaged (black). (F–J) Ovarioles of newly eclosed flies with MARCM recombination induced at –3.5d containing FC-only clones (GFP: green; Fas3: red; DAPI: blue). Marked FCs can be seen in (F, G) the basal stalk (pink arrowheads) and egg chamber 4, (H) egg chamber 4 only, or (I, J) in egg chambers 4 and 3 only (yellow arrowheads indicate Fas3-positive basal stalk with no GFP-positive FCs). Insets show enlargements of boxed regions; yellow borders outline the posterior edge of egg chamber 4, with cells further posterior located in the basal stalk. Scale bars, 20 µm.
-
Figure 6—source data 1
Numerical data for graphs in Figure 6A.
- https://cdn.elifesciences.org/articles/69749/elife-69749-fig6-data1-v3.xlsx
-
Figure 6—source data 2
Numerical data for graphs in Figure 6C.
- https://cdn.elifesciences.org/articles/69749/elife-69749-fig6-data2-v3.xlsx
-
Figure 6—source data 3
Numerical data for graphs in Figure 6B and D.
- https://cdn.elifesciences.org/articles/69749/elife-69749-fig6-data3-v3.xlsx
Figure 7 with 1 supplement
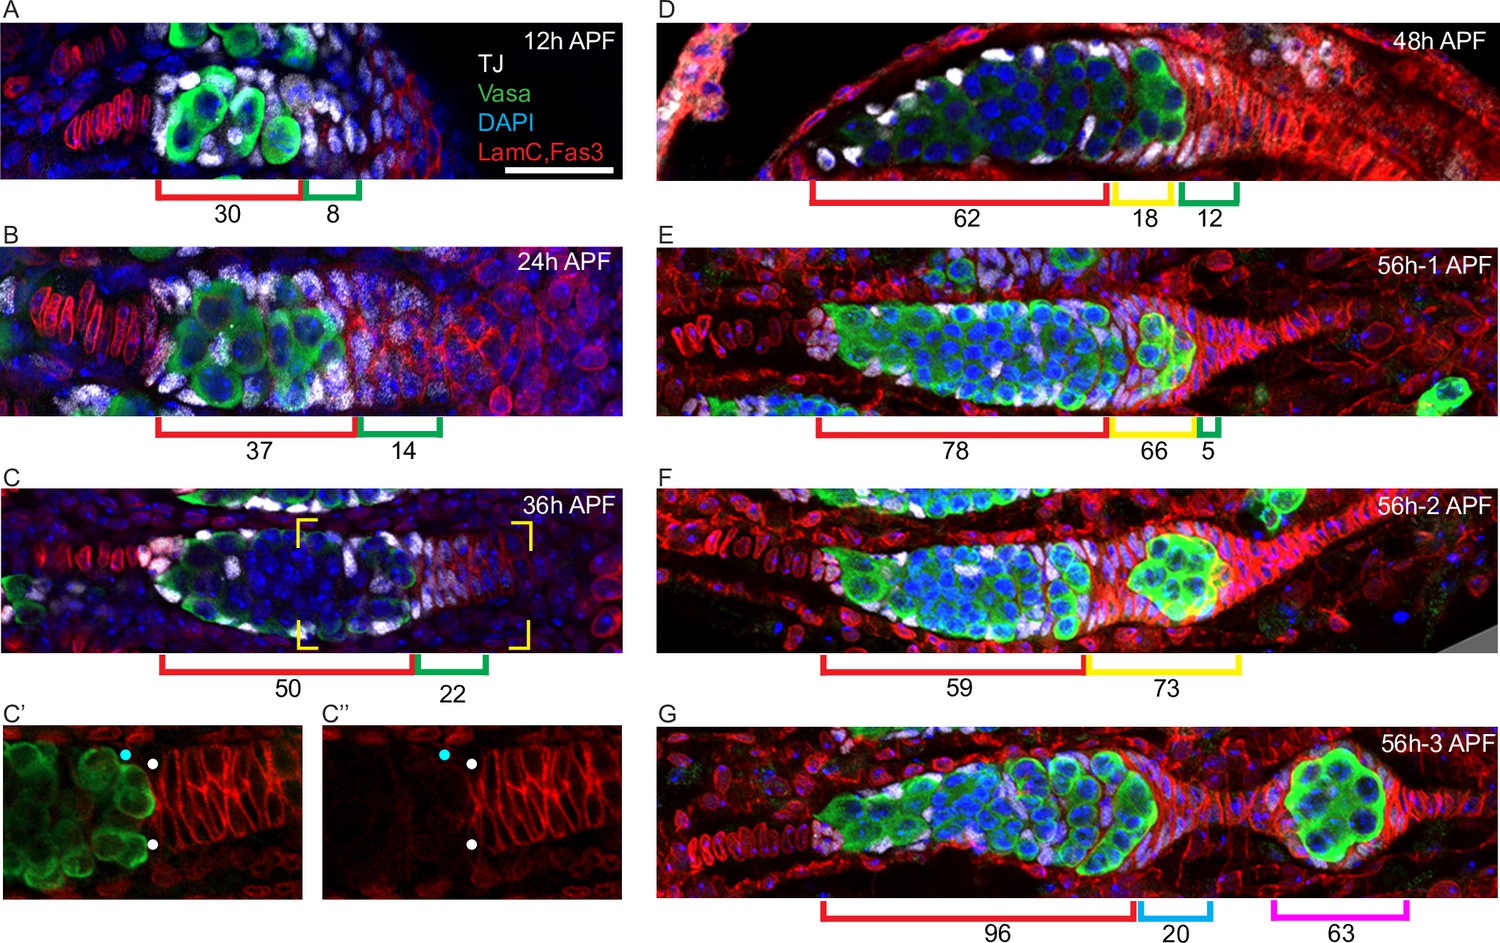
Extra-germarial crown cells (EGCs); a potential source of early follicle cells (FCs).
(A–G) Traffic Jam (TJ)-positive cells (white) were counted in ovaries stained also for Vasa (green), Lamin-C and Fas3 (both in red), and DAPI (blue). Bar, 20 μm applies to all images. (A–C) Up to 36 hr after puparium formation (APF), prior to budding of the first egg chamber, intermingled cells (ICs) (red brackets), defined as intermingled with germline cells (green) in the developing germarium, expressed TJ (white) but little or no detectable Fas3 (red). Cells posterior to the developing germaria expressed Fas3 and were previously all termed basal cells and expected to intercalate to form the basal stalk. However, a subset of Fas3-positive cells immediately posterior to the germarium also expressed TJ. Those cells formed an EGC of increasing cell numbers, indicated by green brackets. (C’, C”) At 36 hr APF, some somatic cells contacting the posterior of the most advanced cyst expressed Fas3 strongly (white dots) and some did not (blue dots). Fas3-positive cells were counted as EGC cells and Fas3-negative cells as ICs. (D) At 48 hr APF, the most posterior germline cyst is about to leave the germarium in most samples. Here, the cyst (green) appears to have just started to leave, invading Fas3-positive cells in EGC territory. The Fas3-positive cells surrounding the cyst are indicated by a yellow bracket, while Fas3-positive and TJ-positive cells posterior to the cyst are indicated by green brackets. Average IC (red brackets) and EGC (green and yellow brackets) cell numbers are written underneath the brackets and were derived from counting (A) 5, (B) 5, (C) 10, and (D) 5 samples. (E–G) Three developing ovarioles from the same 56 hr APF ovary, representing progressively later stages of development from top to bottom, show the most posterior cyst leaving the germarium and surrounded by Fas3-positive, TJ-positive cells. (E, F) Fas3-positive, TJ-positive cells posterior to the germline (green bracket), and around the most posterior cyst (yellow bracket) were counted for these single samples and then (G) counted as on the budded cyst (magenta bracket) or anterior to the budded cyst and forming a secondary EGC posterior to the germarium (blue bracket). Those two populations are separated by stalk cells that do not stain for TJ. The Fas3 patterns in 48 hr, 56 hr, and 60 hr APF and adult ovaries are compared in Figure 7—figure supplement 1. See also Figure 1—figure supplement 1.
Figure 7—figure supplement 1
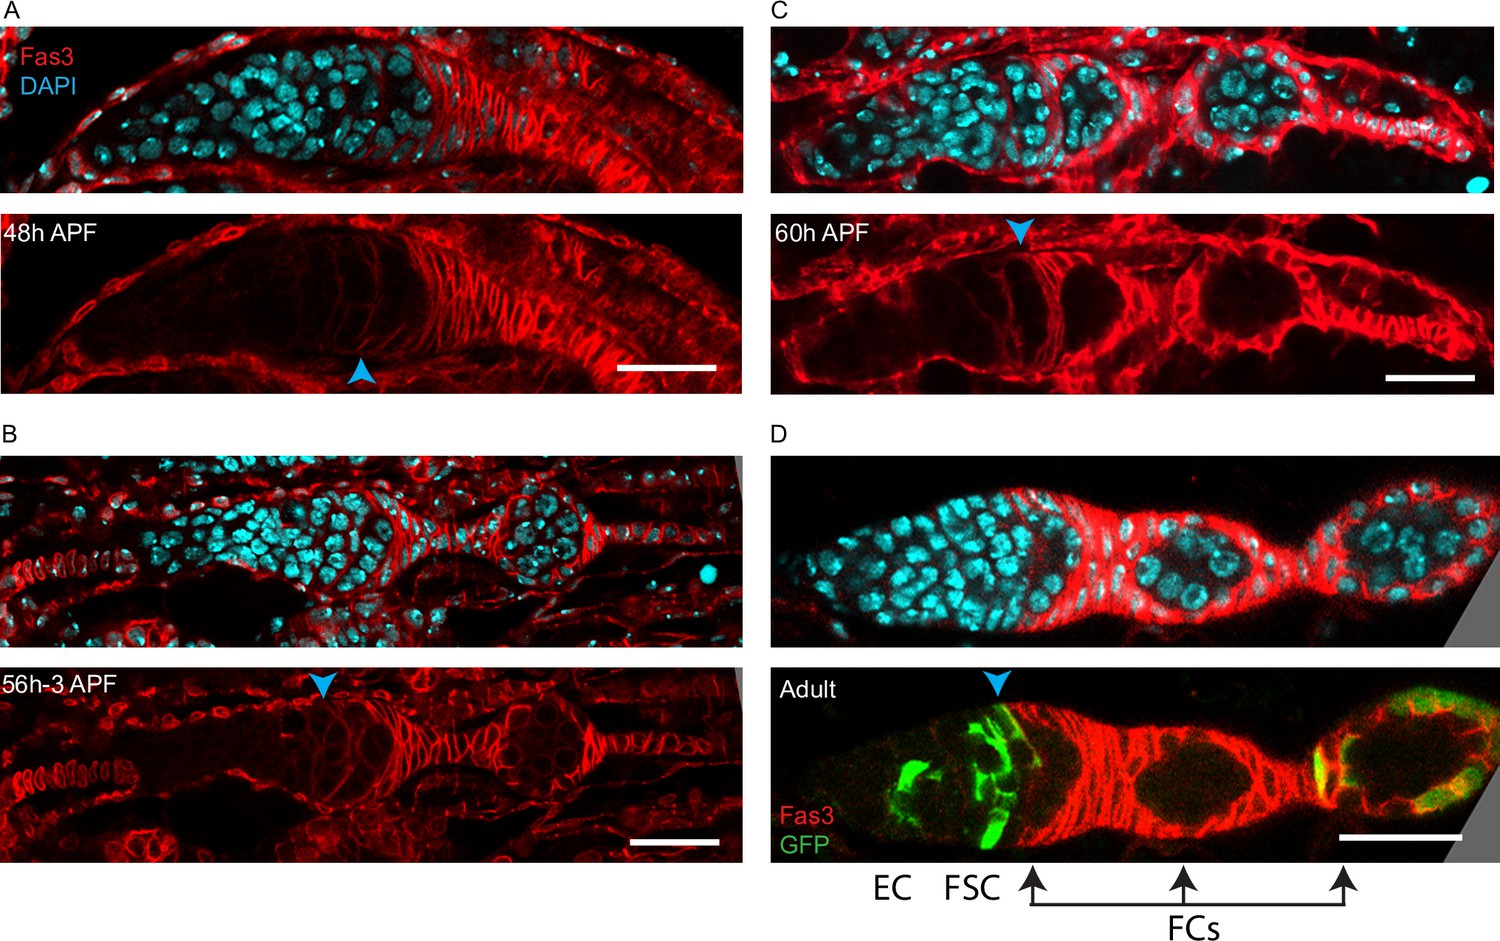
Somatic cells surrounding the most posterior germarial cyst do not show strong Fas3 expression prior to budding.
(A–D) Fas3 (red) is shown together with DAPI-stained nuclei (blue; top) or alone (bottom) in pupal ovaries at (A) 48 hr after puparium formation (APF), (B) 56 hr APF (same samples as in Figure 7D and G), (C) 60 hr APF, and (D) adults. The anterior border of Fas3 expression (indicated by a blue arrowhead), which was posterior to all germline cysts at 36 hr APF (Figure 7C), aligns (A) with the anterior of the departing cyst at 48 hr APF, (B) with the anterior surface of the most posterior germarial cyst just after one egg chamber has budded, and (C) by 60 hr APF and (D) in adults, the anterior edge of strong Fas3 expression is along the posterior edge of the penultimate cyst in the germarium. (D) Cells in a MARCM lineage (green) derived from an adult follicle stem cell (FSC) (bottom panel) include an escort cell (EC), FSCs, and follicle cells (FCs) (outlined by strong Fas3) in the budded egg chamber. Arrows indicate the normal progression every 12 hr of a recently produced strongly Fas3-positive FC associated with the penultimate germarial (stage 2b) cyst (first arrow) to an FC on a stage 3 germline cyst at the posterior of the germarium (second arrow) and then to an FC on a budded egg chamber (third arrow); 24 hr in total.
Figure 8 with 2 supplements
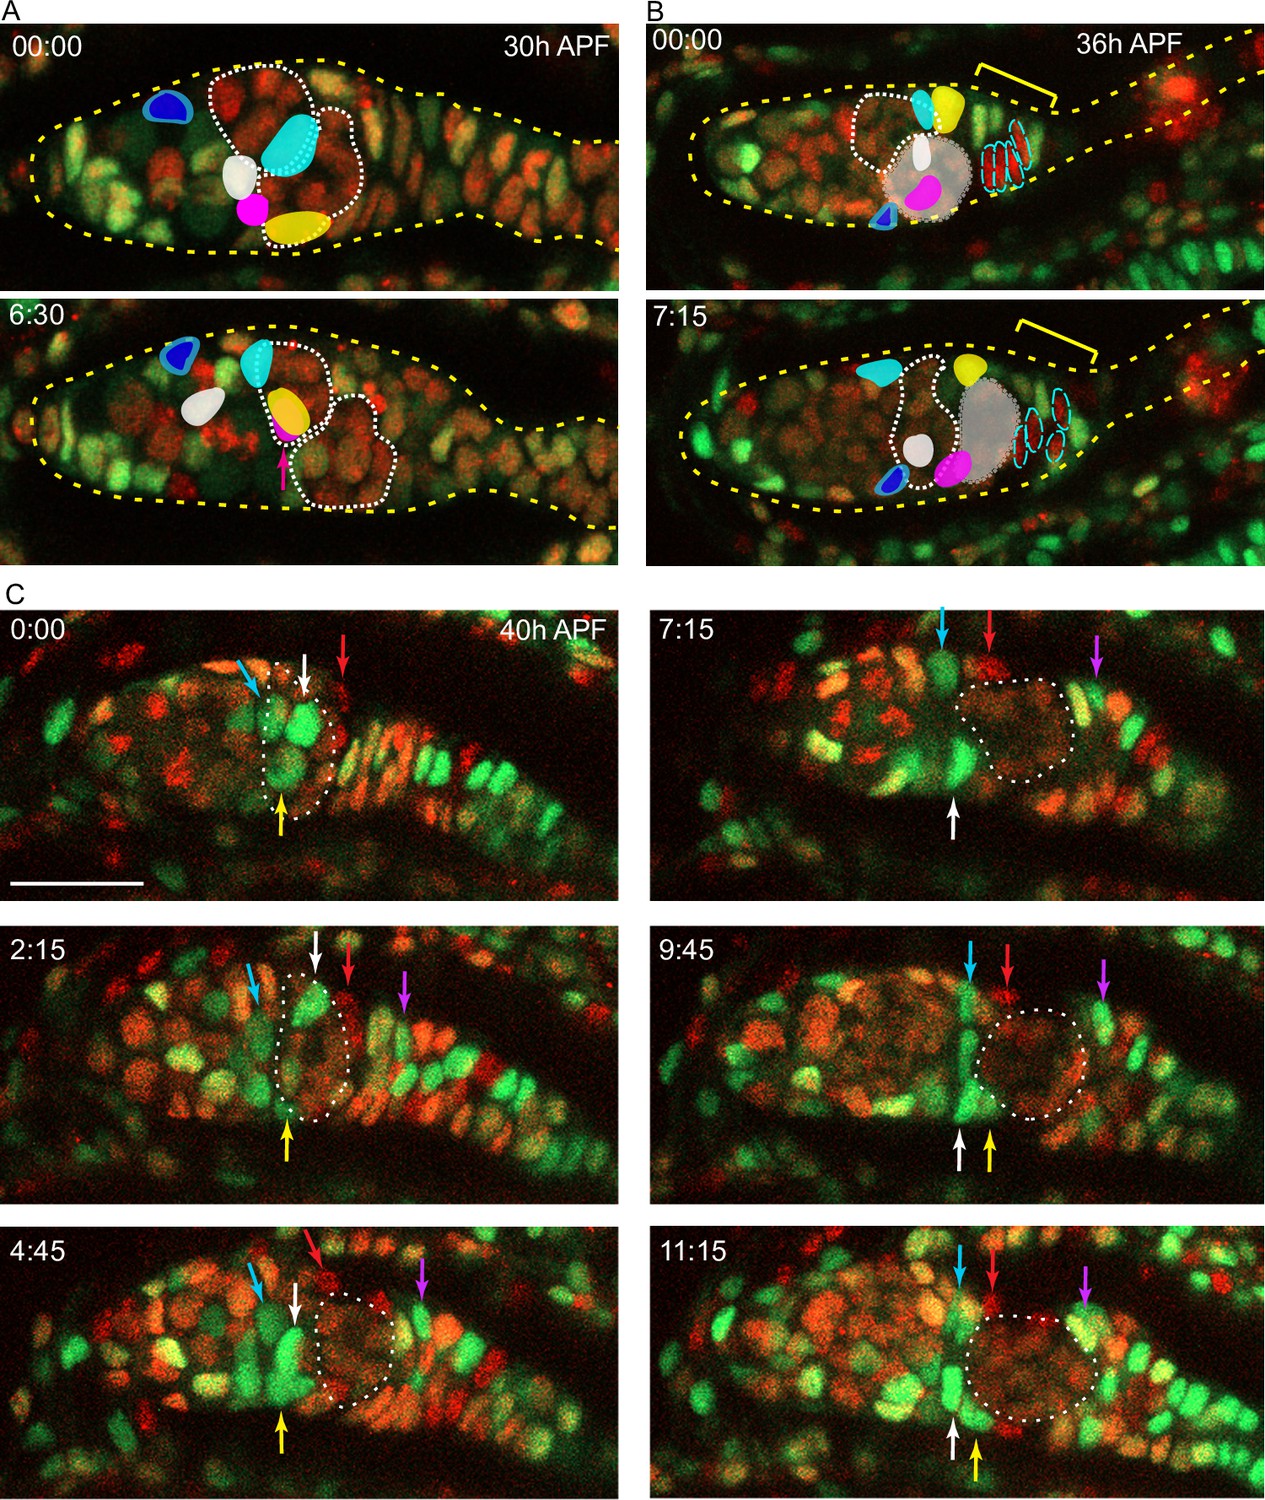
Intermingled cells (ICs) move independently of germline cysts and do not mix with extra-germarial crowns (EGCs).
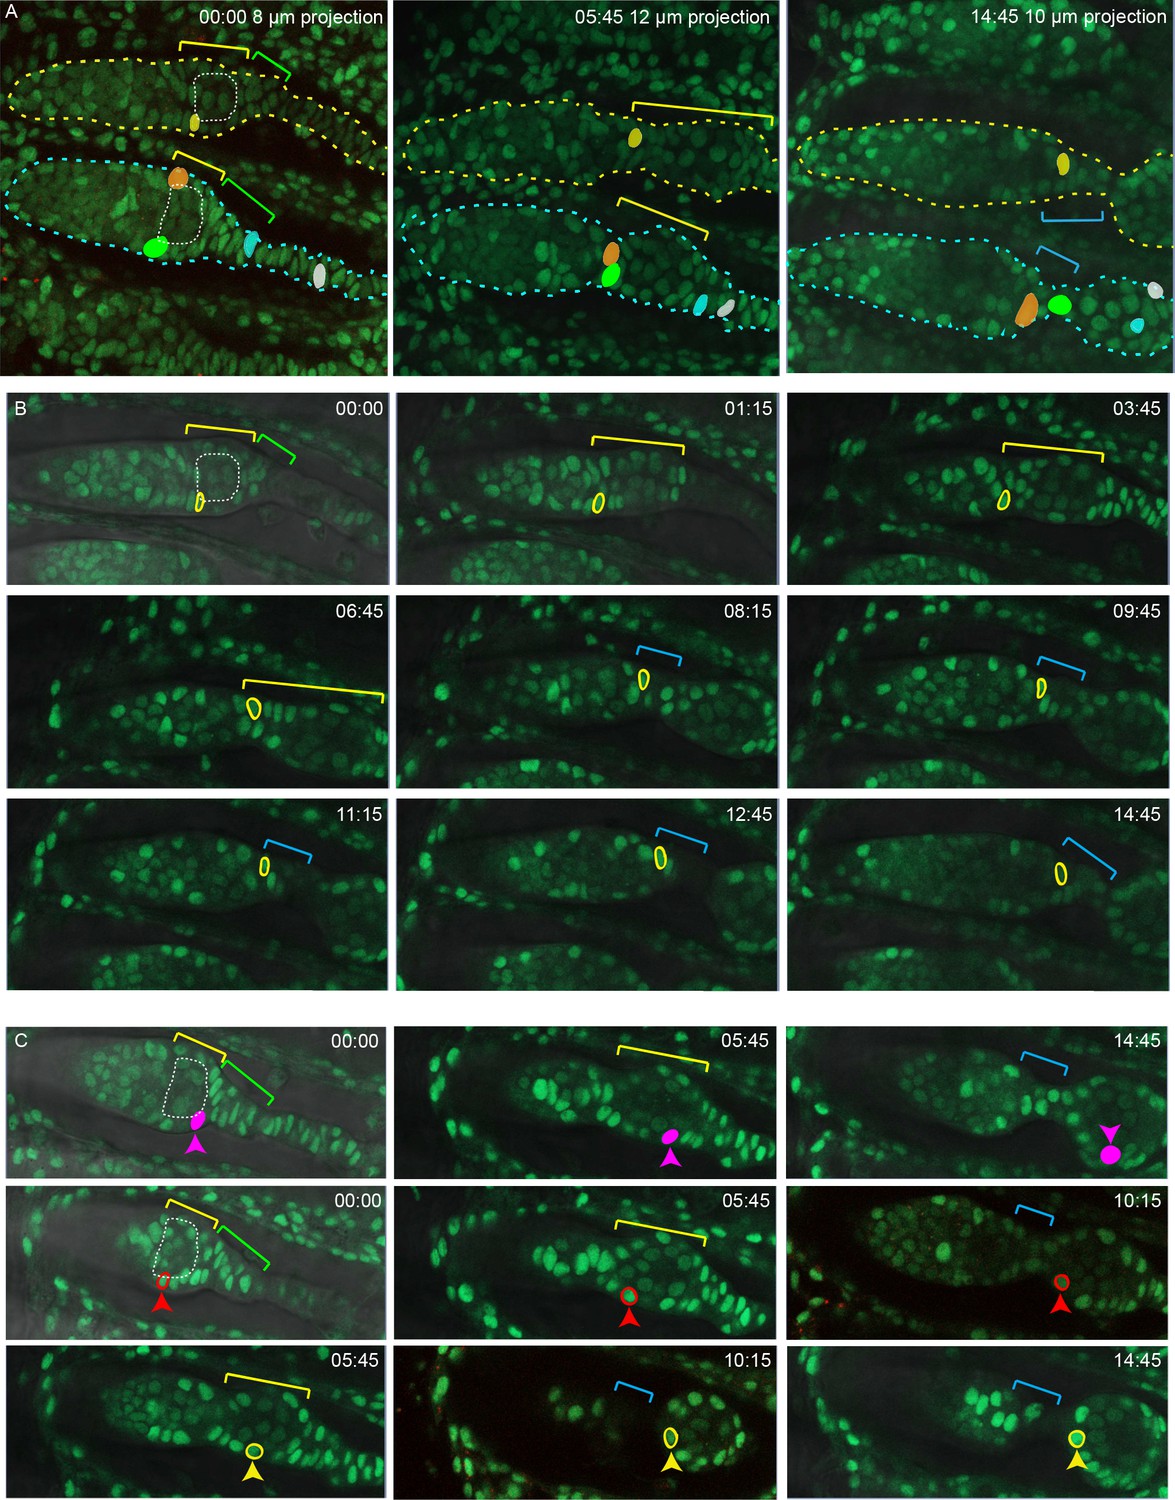
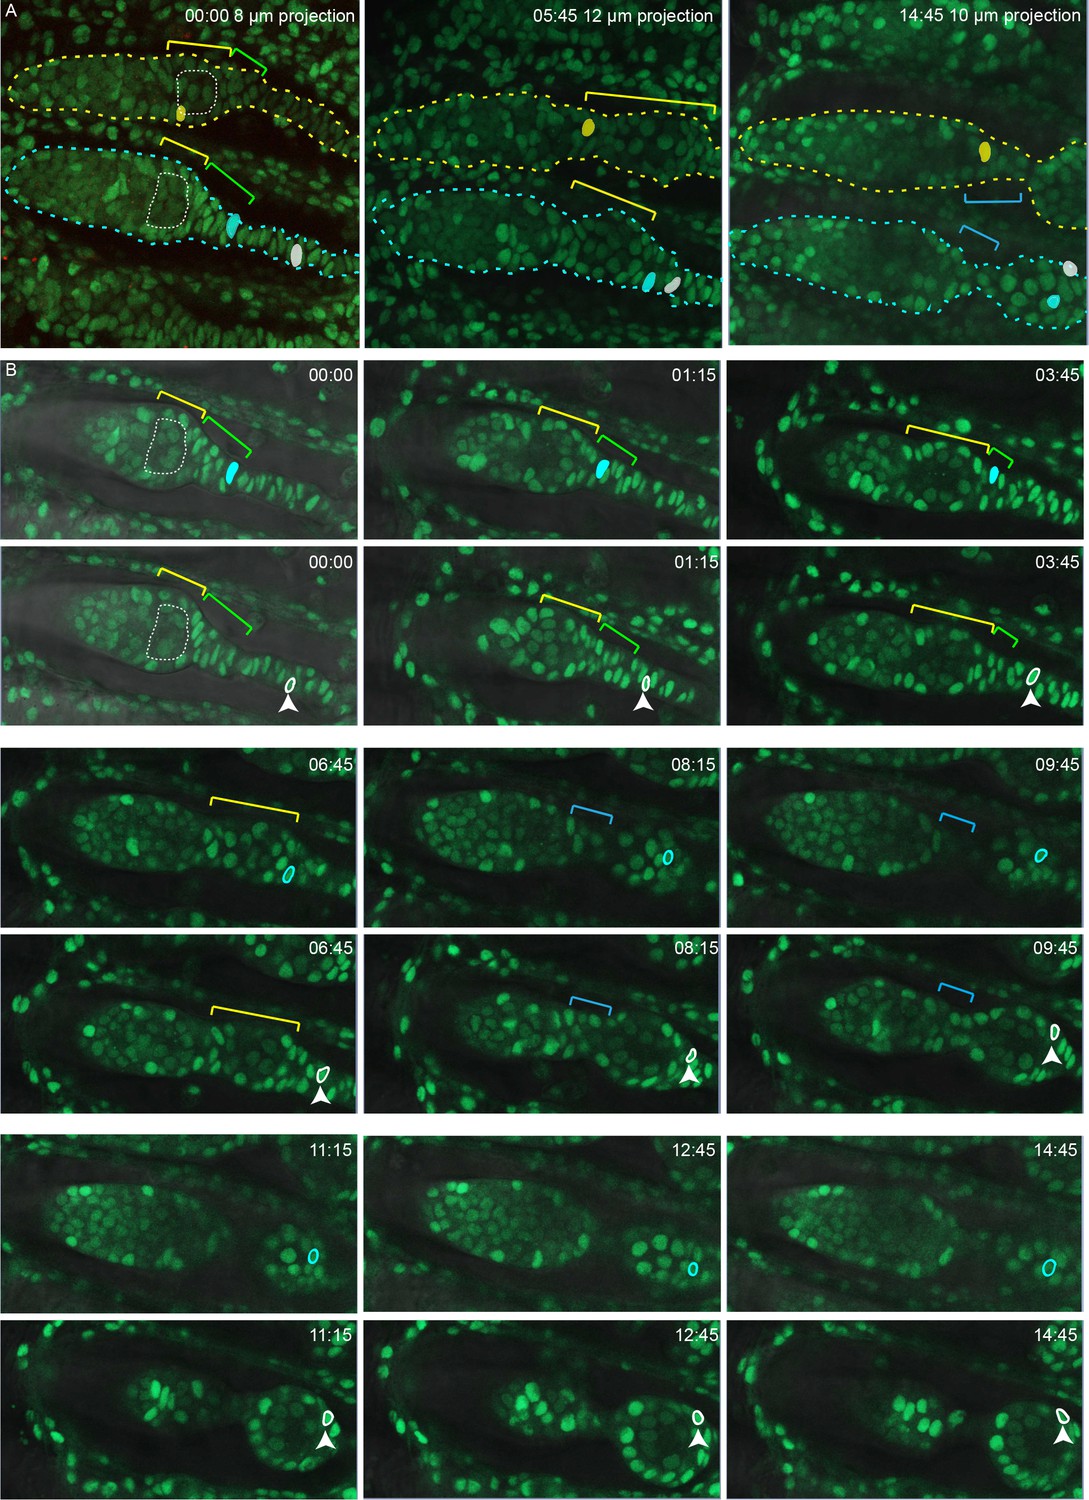
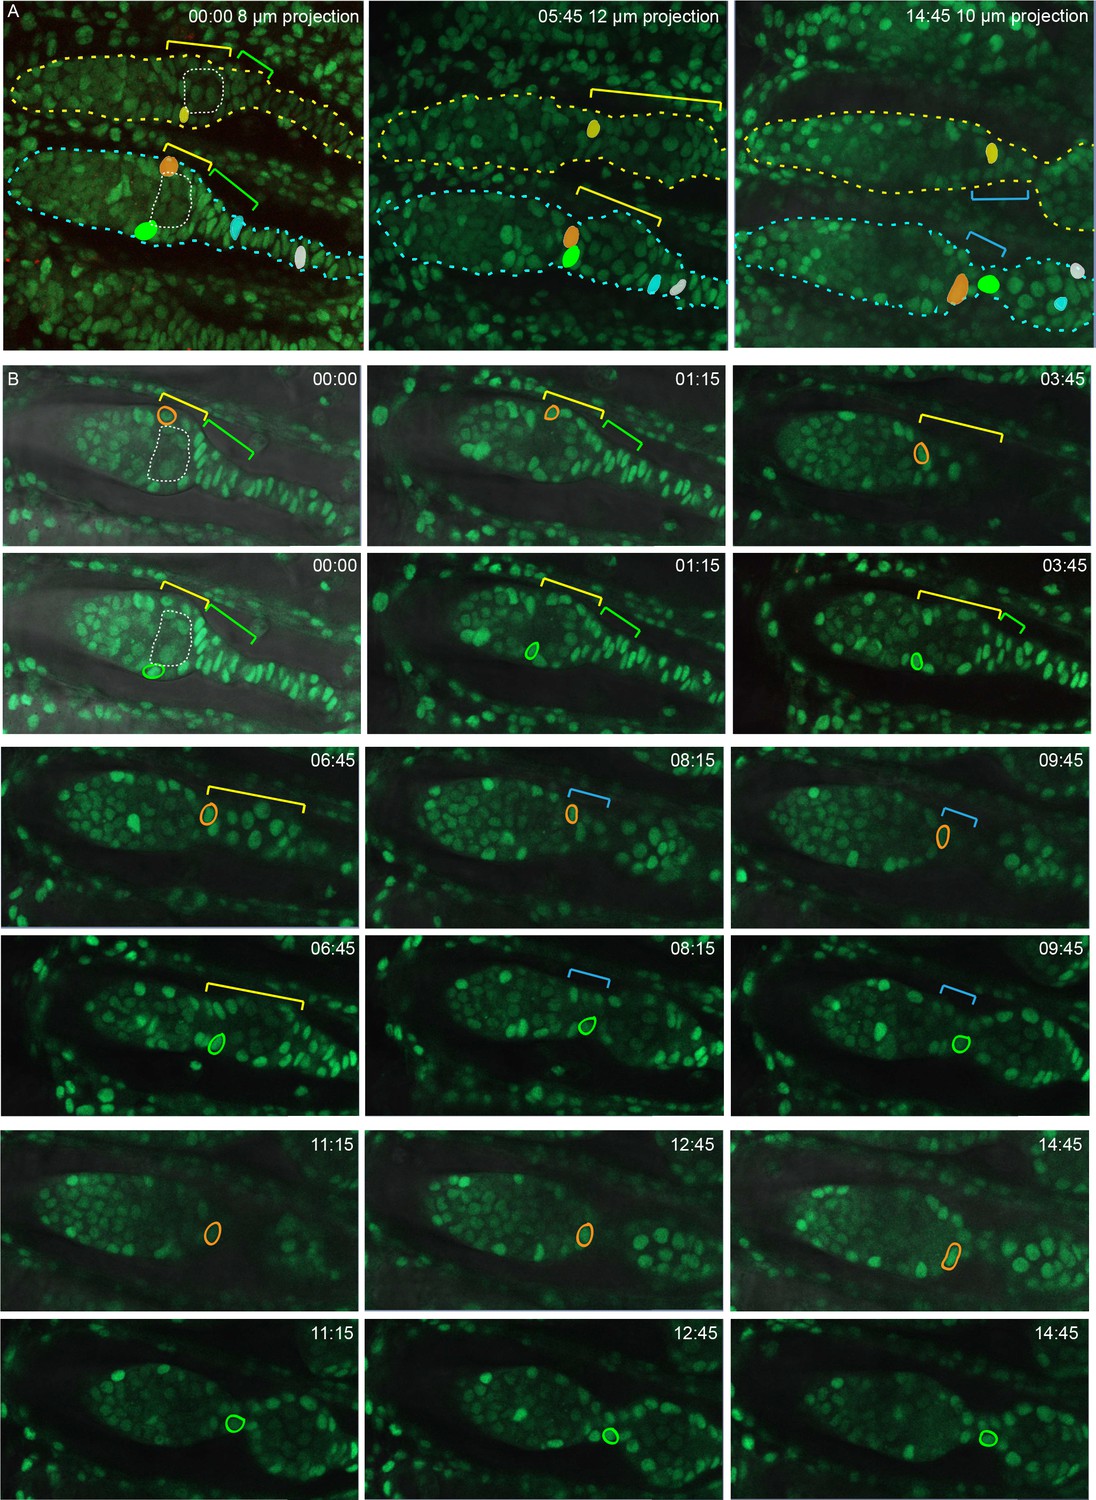
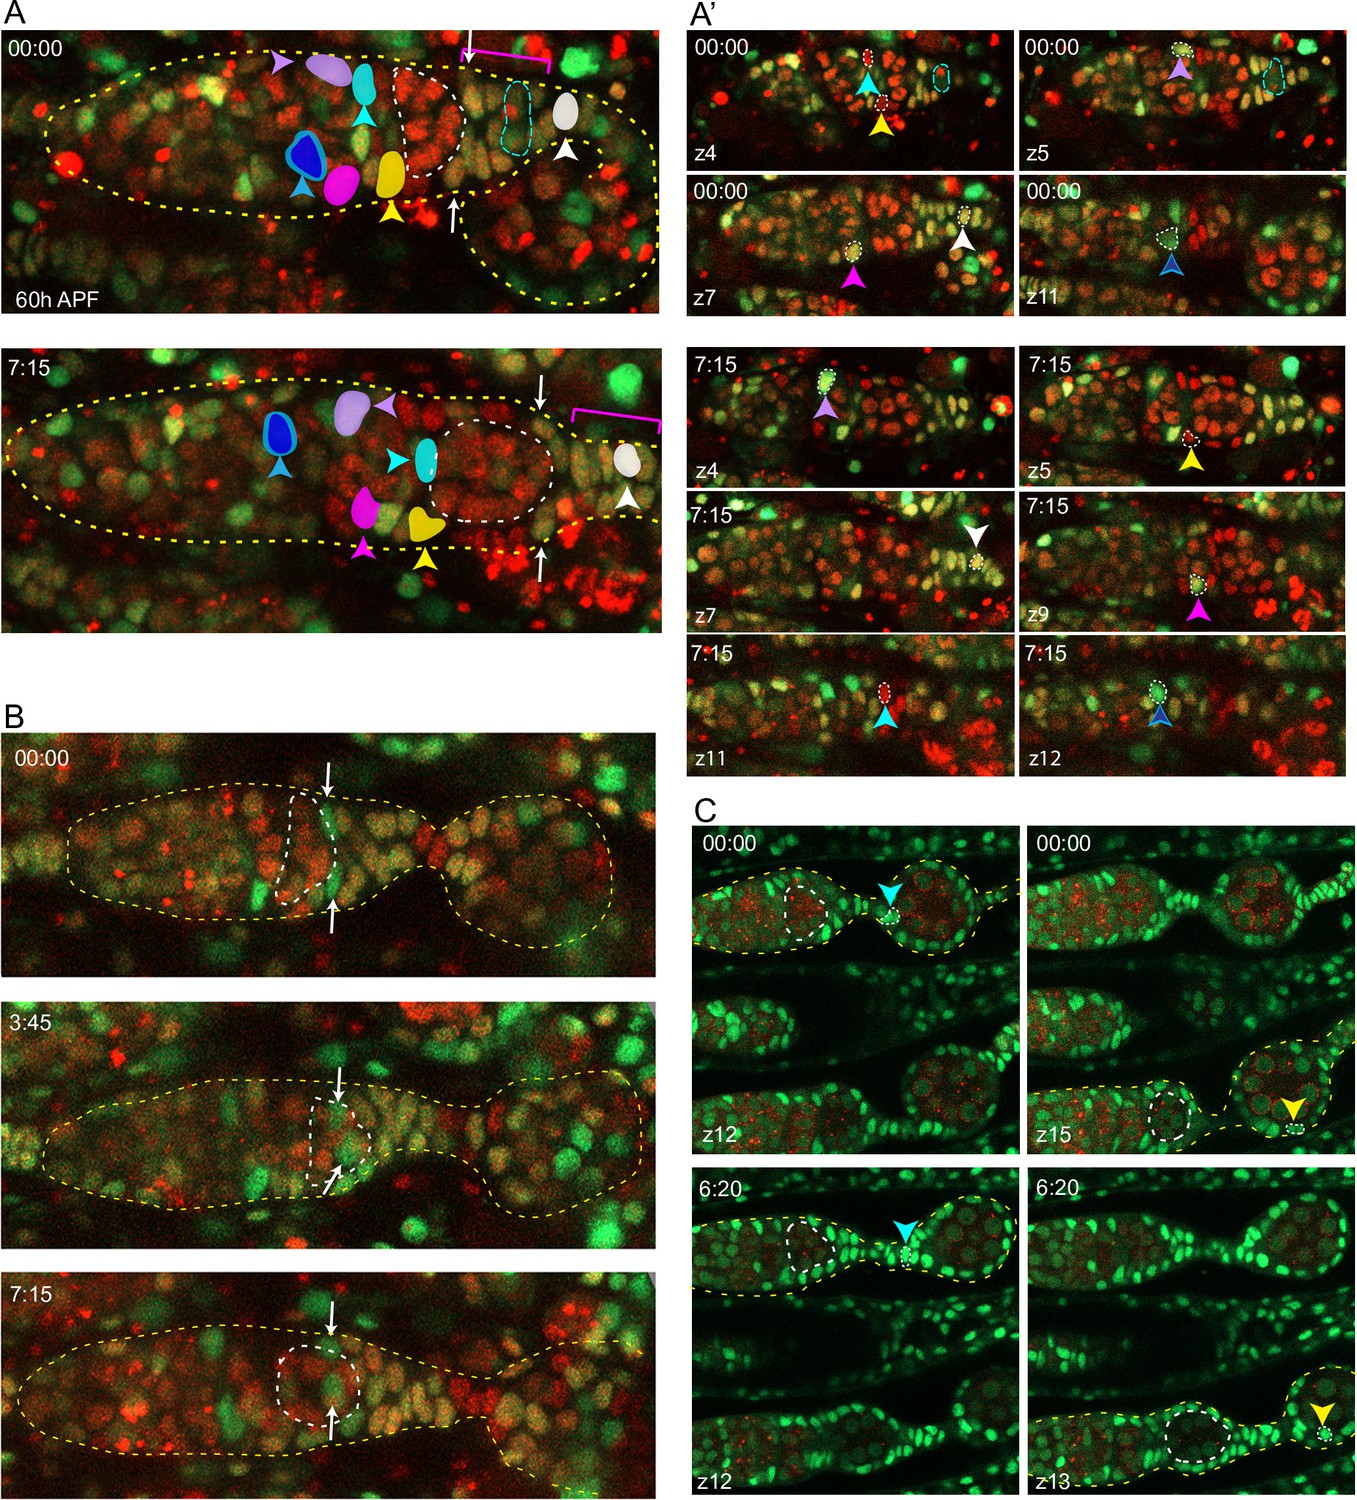
Live imaging was performed on multicolor pupal ovaries with clones induced by heat-shock such that cells could lose RFP, GFP, or both. (A) Z-projections of 0 hr and 6 hr 30 min timepoints of a 30 hr after puparium formation (APF) germarium showing five tracked ICs (colored). ICs were located at the outer surface of the germarium and moved independently of one another in posterior, anterior, and lateral directions (around the circumference). The most posterior germline cyst (outlined by a white dotted line) moved posteriorly past the cyan and yellow IC cells. The relative disposition of ICs and cysts changed considerably, suggesting that they are not strongly associated. Only z-planes containing tracked cells were included in the projection (z4, 5, 6, 7, and 8 at 00:00 and z5, 6, 9, and 10 at 6:30). (B) Z-projections of 0 hr and 7 hr 15 min timepoints of a 36 hr APF germarium showing five tracked ICs. ICs moved independently of one another and remained in their domain as the most posterior germline cyst (highlighted by shading) moved past. Four cells in the EGC (outlined red cells) remained in the EGC (indicated by the yellow bracket). Projected sections are z5–9 at 00:00 and z4, 7, 8, and 9 at 7:15. Individual z-sections of the germaria in (A) and (B) are shown in Figure 8—figure supplement 1. (C) Z-projections of selected timepoints of a 40 hr APF germarium imaged for 11 hr 15 min, showing three tracked green ICs (white, yellow, and blue arrows); ICs remained in their domain as the posterior germline cyst (outlined by a white dotted line) moved past them. Four red cells (one is shown by the red arrow) started on the posterior of the posterior cyst and moved anterior along the cyst; cells in a neighboring no-color clone moved similarly. A green cell that began in the EGC (magenta arrow) moved onto the posterior edge of the cyst. The accompanying Figure 8—video 1 of this germarium shows mitotic cells in the EGC and the stalk. Bar, 20 µm. See also Figure 8—figure supplement 1.
Figure 8—figure supplement 1
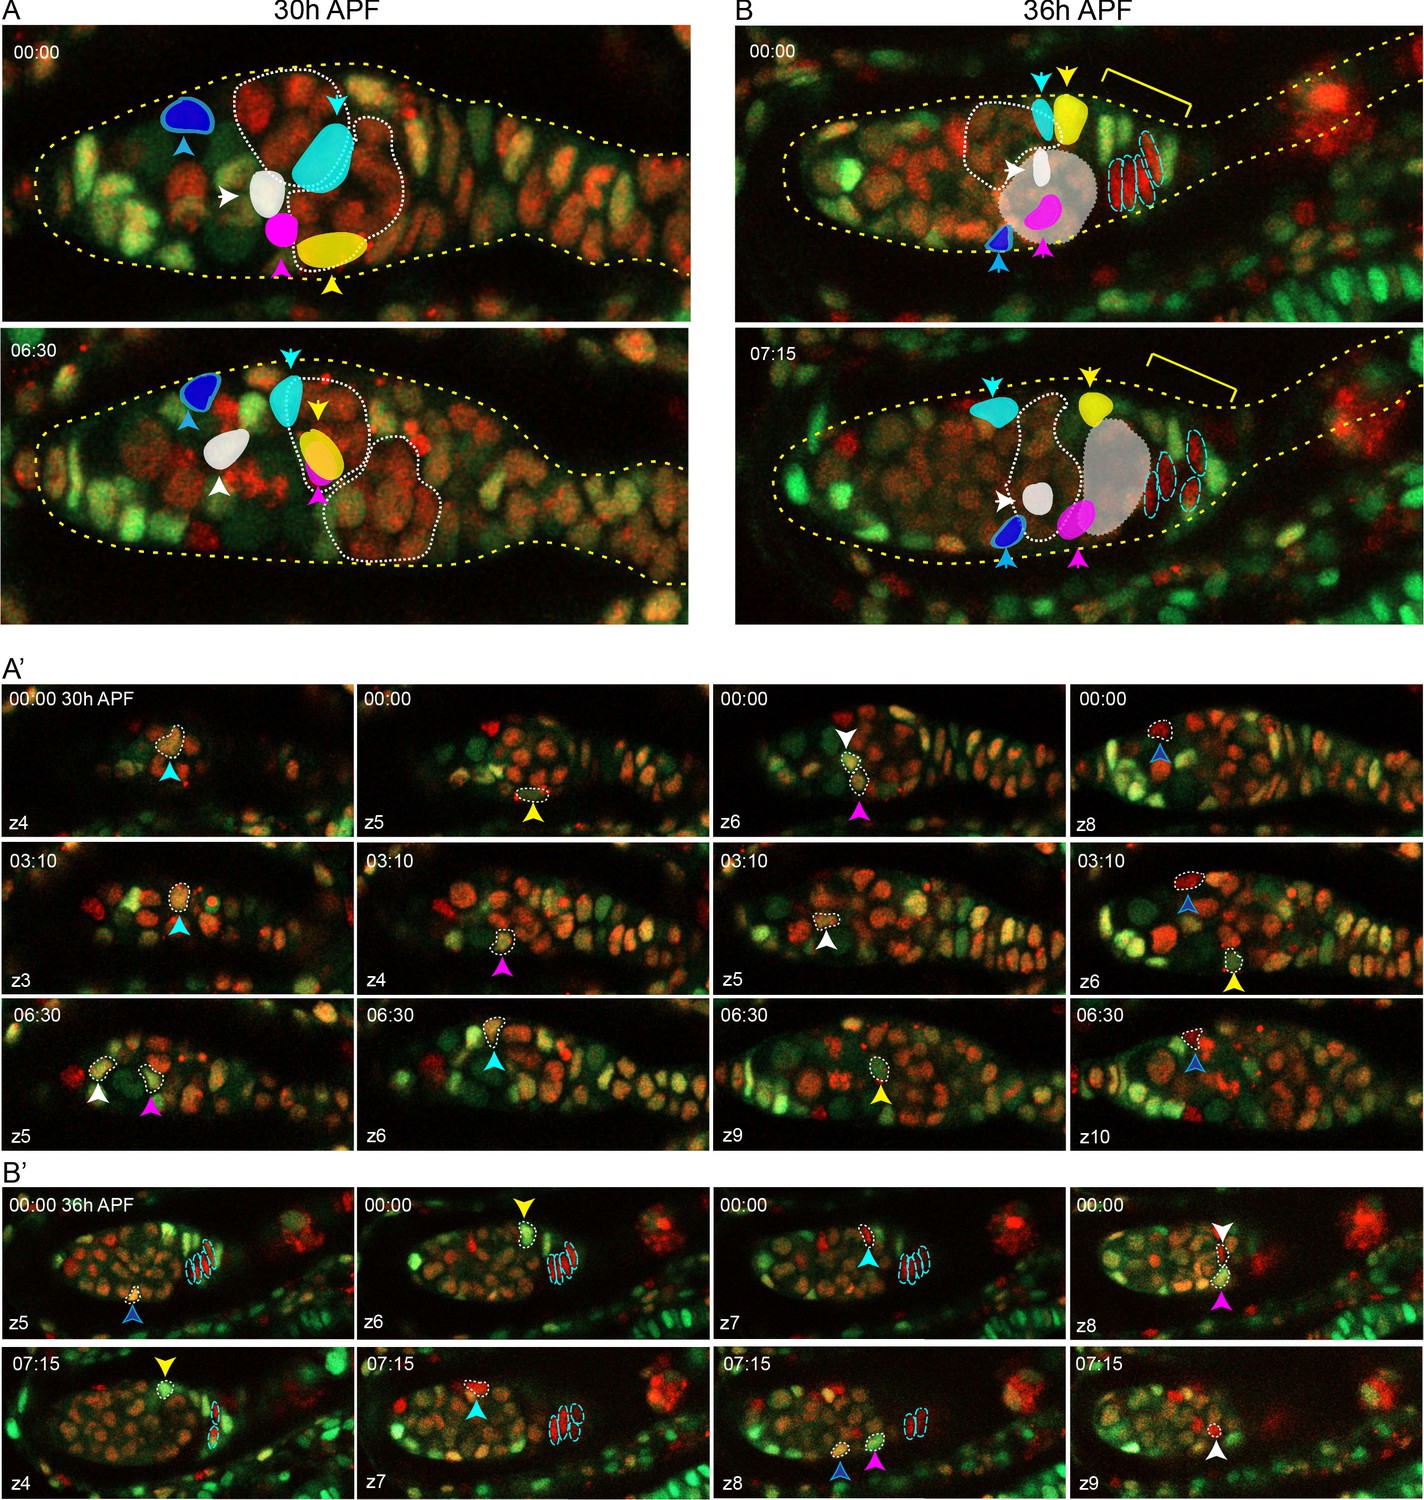
Intermingled cells (ICs) move independently of one another and do not mix with extra-germarial crowns (EGCs).
(A) Z-projection of selected timepoints from live imaging of a 30 hr after puparium formation (APF) ovary for 6 hr 30 min, showing five tracked ICs. ICs were located at the outer surface of the germarium and moved independently of one another in posterior, anterior, and lateral directions (around the circumference). The most posterior germline cyst (outlined by a white dotted line) moved posteriorly past the cyan and yellow IC cells. The relative disposition of ICs and cysts changed considerably, suggesting that they are not strongly associated. Only z-planes containing tracked cells were included in the projection (z4, 5, 6, 7, and 8 at 00:00 and z5, 6, 9, and 10 at 06:30). (A’) Individual z-sections of the 30 hr APF ovary (arranged horizontally for each time point) show that ICs move around the circumference of the germarium. The cyan and yellow cells began on the bottom of the germarium and moved towards the mid-section, whereas the pink and white cells started in a mid-section and moved to the bottom. (B) Z-projection of selected timepoints from live imaging of a 36 hr APF ovary for 7 hr 15 min, showing five tracked ICs. ICs moved independently of one another and remained in their domain as the most posterior germline cyst (highlighted in white) moved past. Four cells in the EGC (outlined red cells) remained in the EGC (indicated by the yellow bracket). Projected sections are z5–9 at 00:00 and z4, 7, 8, and 9 at 07:15. (B’) Individual z-sections of the 36 hr APF ovary show that IC cells move independently in all directions, and EGC cells did not move relative to one another, suggesting greater cohesion.
Figure 8—video 1
A 40 hr after puparium formation (APF) multicolor germarium imaged for 11 hr 15 min.
Clones were induced by heat-shock such that cells could lose RFP, GFP, or both, to yield green, red, or cells with no color, respectively. A green intermingled cell (IC) (white arrow) moved back and forth around the circumference of the germarium and stayed in its domain as the posterior cyst moved past. A red cell (red arrowhead) from a clone that began at the posterior of the posterior cyst moved along the cyst to its anterior. A green extra-germarial crown (EGC) cell (magenta arrow) appears in the z-projections at 30 min and moved onto the posterior edge of the cyst. Two mitotic cells that divided at 2:30 hr (one in EGC and one in stalk) are indicated by white arrowheads.
Figure 9 with 9 supplements
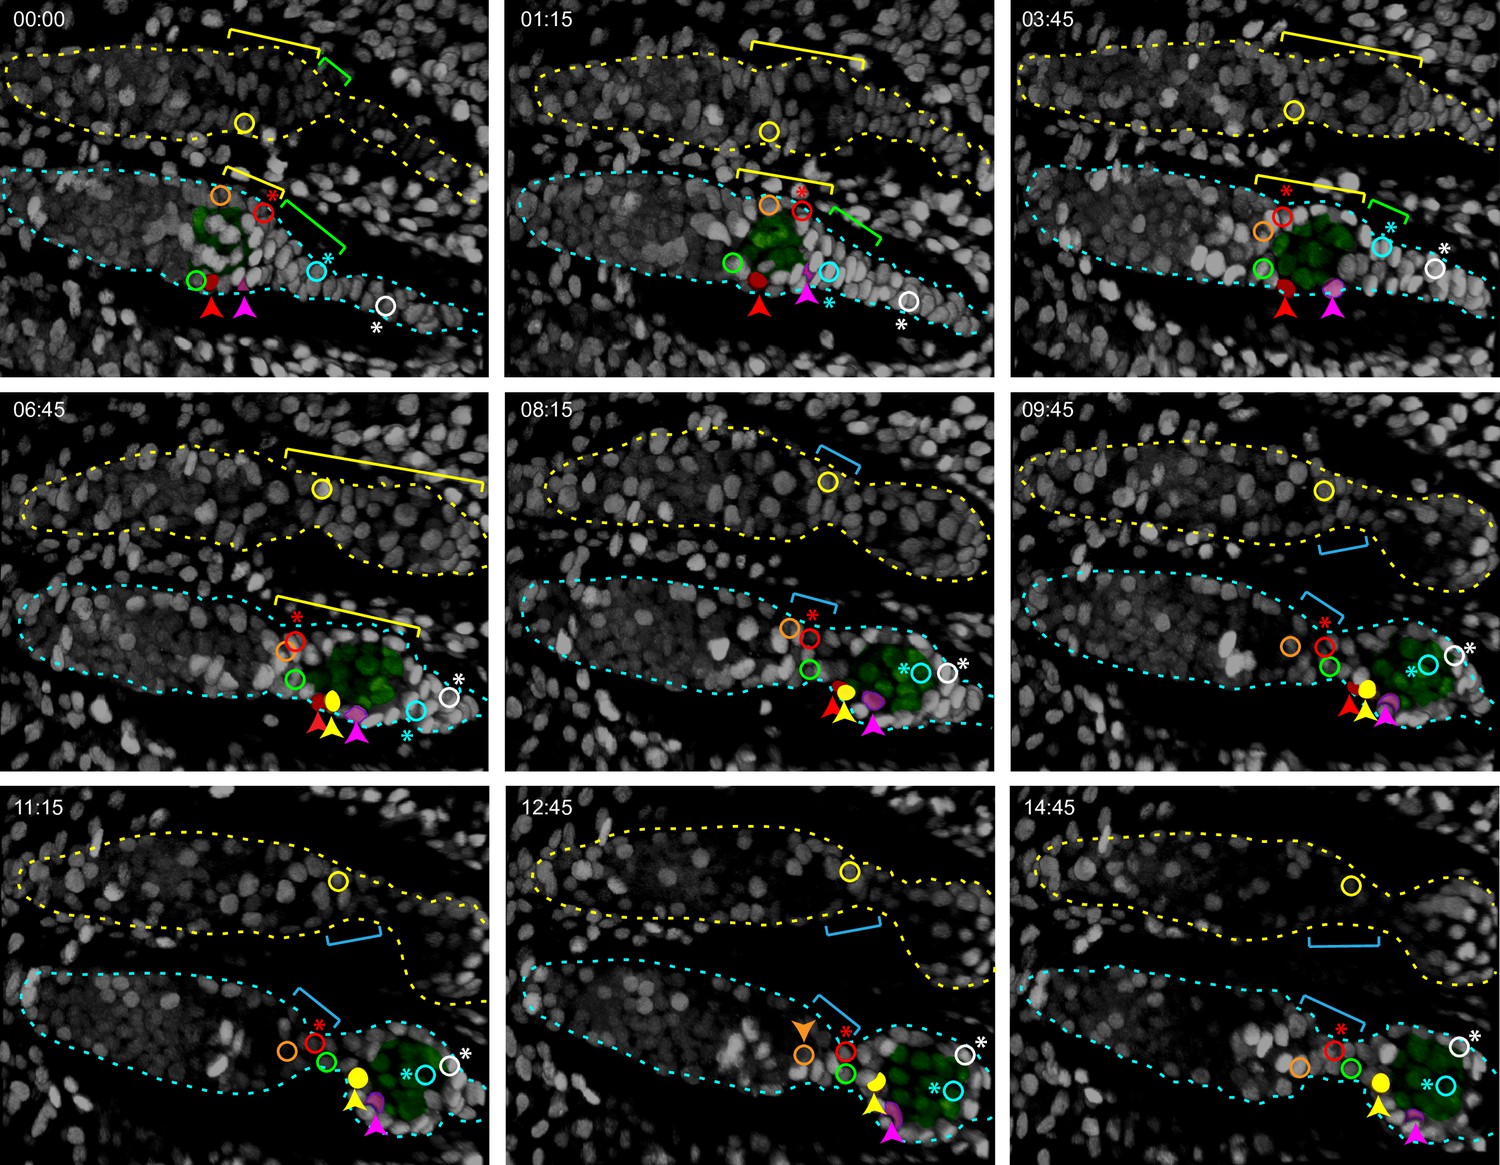
Budding of the first egg chamber: extra-germarial crown (EGC) and basal stalk cells become follicle cells (FCs).
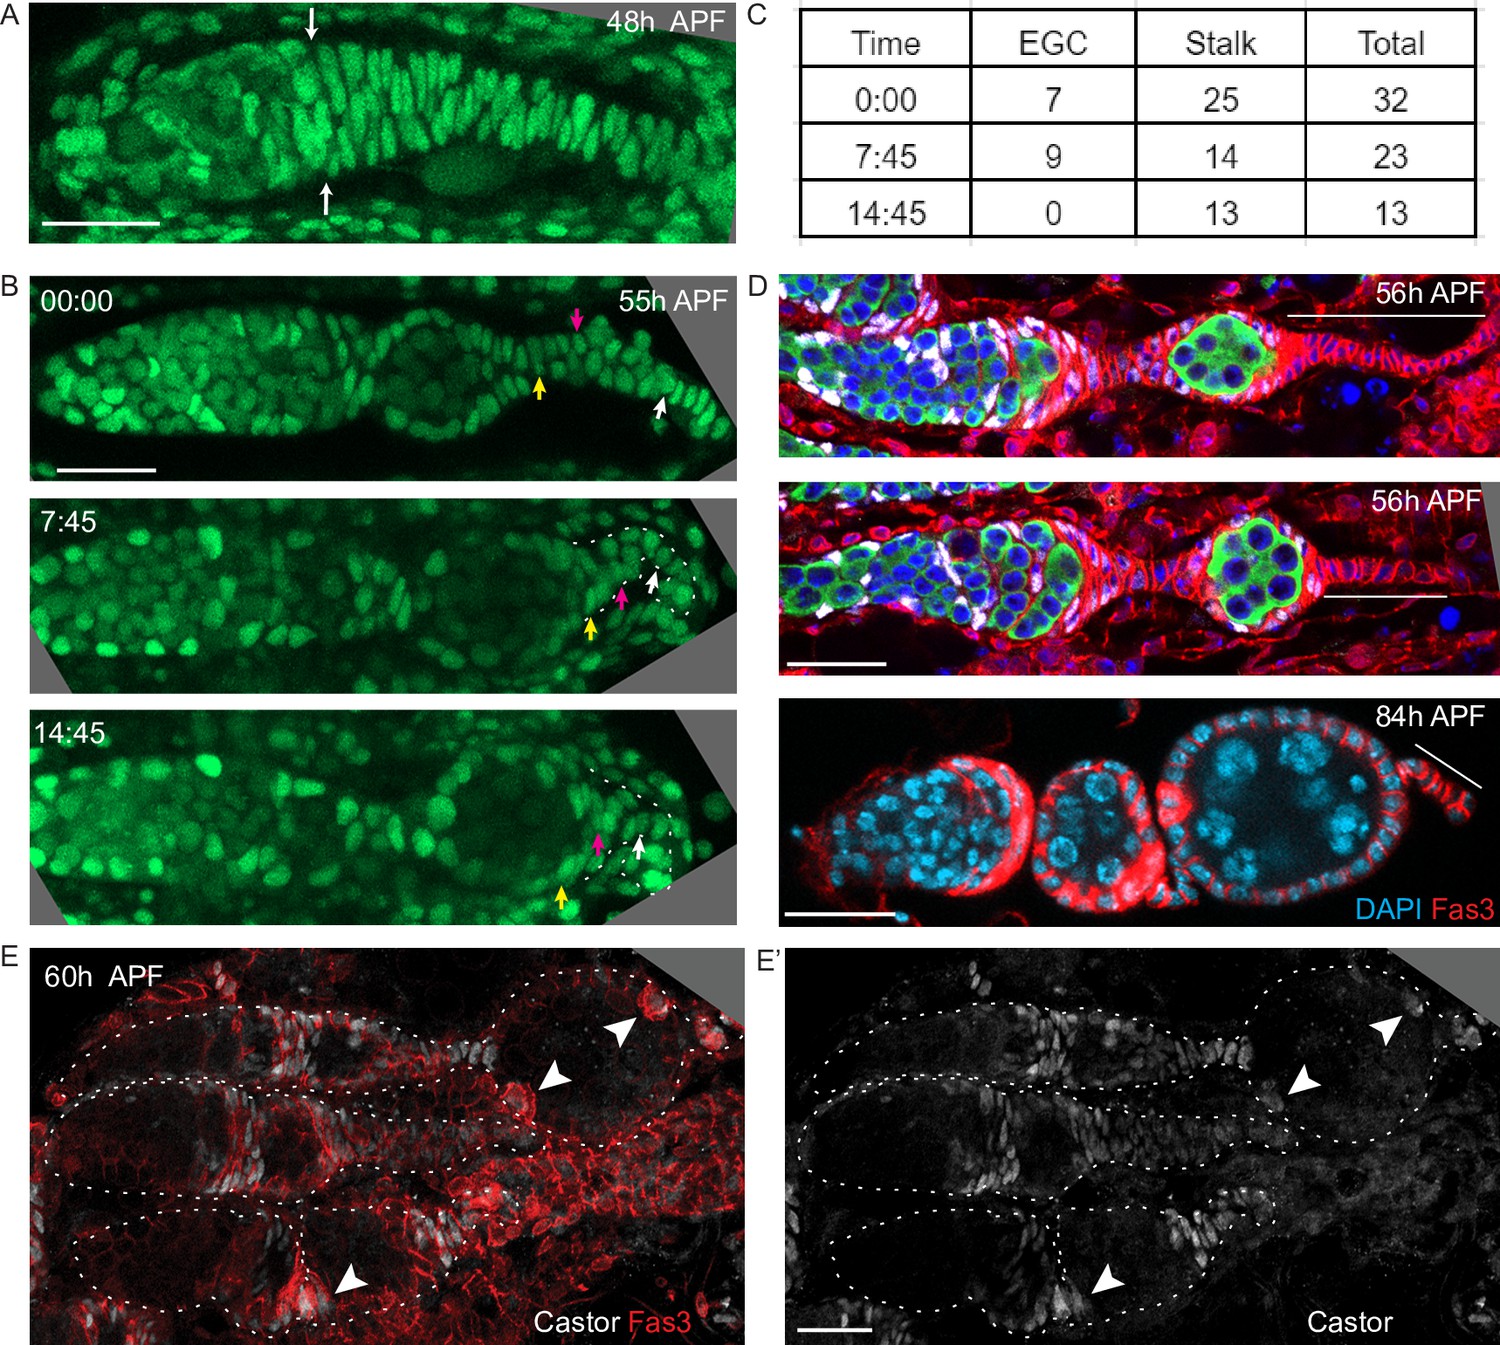
Time-stamped frames from a 3D reconstruction of a movie of 14 hr 45 min starting at 48 hr after puparium formation (APF) and showing budding of an egg chamber. All cells are labeled white from a ubi-GFP transgene. Three cells that were visible near the surface of a 3D reconstruction are colored in solid red, pink, and yellow in the lower germarium, together with five other cells (open circles) that were in interior z slices. All marked cells were tracked using Zeiss Zen software for 60 timepoints over 14 hr 45 min, except for the red cell that could not be reliably tracked after 10 hr and the yellow cell in the lower germarium, which was not tracked before 5 hr 45 min. The posterior germline cyst in the lower germarium is highlighted in green. Cyst cells were distinguishable from somatic cells because the nuclei were larger and paler green. The yellow brackets indicate Fas3+ TJ+ cells, inferred from comparison to fixed images at the same stages. The cyst slid past cells located at the anterior edge of the cyst which were inferred from comparison to fixed 48 hr APF images to be Fas3-positive and to be the most anterior EGC cells when the cyst first started to move out of the germarium (just prior to 48 hr APF, see Figure 8). These cells were later either at the posterior edge of the germarium (orange-outlined cell and yellow-outlined cell in the upper germarium) or between the germarium and the budded cyst (green-outlined cell) in the nascent secondary EGC (blue brackets), as seen more clearly in Figure 9—figure supplement 1A,B (yellow-outlined cell) and Figure 9—figure supplement 3A,B (orange and green-outlined cells). The cell marked with the open red circle (asterisk; modeled in Figure 5). Figure 8 began on the posterior cyst and ended in the secondary EGC (Figure 9—video 2). The cyan cell (asterisk; modeled in Figure 5) initially towards the posterior of the primary EGC (indicated by green brackets) adopted progressively more anterior positions on the germline cyst after the cyst moved into EGC territory. The white cell (asterisk; modeled in Figure 5) was originally in a location posterior to the EGC (it is expected, from comparison to fixed images, not to express Traffic Jam [TJ]) but then moved into EGC territory by 3 hr 45 min and ended up close to the cyan cell on the budded germline cyst (Figure 9—video 3). The locations of the cyan and white cells covering the posterior of the cyst can be seen clearly in Figure 9—figure supplement 2. Individual z-sections showing the locations of the red, pink, and yellow cells in the lower germarium at the beginning, middle, and end of their imaging times are shown in Figure 9—figure supplement 1 and Figure 9—video 1. Time is in hours:minutes. See also Figure 9—figure supplements 1–5.
Figure 9—figure supplement 1
Detail from live imaging (Figure 9—video 1) summarized in Figure 9.
Selected timepoints from a movie of a 48 hr after puparium formation (APF) ovary labeled with ubi-GFP, in which individual cells were tracked using Zeiss Zen through 60 timepoints over 14 hr 45 min. Posterior cysts at the beginning of the movie are highlighted by a dotted white line. (A) Z-projections from the beginning, middle, and end of imaging. (B) Selected individual z slices from the movie show that the yellow cell in the upper germarium started just anterior to the posterior cyst and ended in the second extra-germarial crown (EGC) (blue brackets). (C) Individual z slices from the lower germarium showing progress of the red, pink, and yellow cells. The pink cell started close to the posterior face of the most mature germline cyst and ended near the middle of that budded cyst. The red cell started near the middle of the cyst and was near the anterior of the budded at cyst by 10 hr 15 min, after which it could not be tracked. The yellow cell was first tracked from 5 hr 45 min when it was near the middle of the budded cyst. 9 hr later, it was at the anterior edge of the budded cyst.
Figure 9—figure supplement 2
Further detail from live imaging (Figure 9—videos 1; 3) summarized in Figure 9.
Timepoints from a movie of a ubi-GFP-labeled 48 hr after puparium formation (APF) ovary in which individual cells were tracked using Zeiss Zen. (A) Z-projections from the beginning, middle, and end of imaging. (B) Individual z slices show that the cyan cell started in the extra-germarial crown (EGC) (green bracket) and ended on the posterior half of the budded cyst. The white cell started posterior to the EGC in basal stalk territory, became part of the EGC by 3 hr 45 min and ended on the posterior half of the budded cyst.
Figure 9—figure supplement 3
Further detail from live imaging (Video S2) summarized in Figure 9.
Timepoints from a movie of a ubi-GFP-labeled 48 hr after puparium formation (APF) ovary in which selected cells were tracked using Zeiss Zen. (A) Z-projections from the beginning, middle, and end of imaging. (B) Individual z slices show that the green and orange cells started at the far anterior of the most posterior cyst. The green cell ended between the germarium and the budded cyst, while the orange cell ended at the posterior edge of the germarium.
Figure 9—figure supplement 4
Basal stalk and extra-germarial crown (EGC) cells are the source of the first follicle cells (FCs) and polar cells.
(A) Z-projection of a Ubi-GFP-labeled germarium at 48 hr after puparium formation (APF) from live imaging to show the cells posterior to the germarium. White arrows indicate the posterior edge of the germline. (B) Stills from a movie of a 55 hr APF germarium (Figure 9—video 4) show that the stalk, outlined by the white dotted line in the lower panels, progressively shortens as the first cyst moves posterior. Three cells were tracked: the white cell began in the stalk 13 cells away from the cyst and ended 4 cells away; the magenta cell was initially 7 cells away from the cyst and ended on the posterior of the cyst; and the yellow cell began as the first cell in the stalk and ended on the posterior third of the cyst. (C) Cell counts posterior to the germline for the germarium shown in (B). (D) Fixed images showing that the basal stalk becomes shorter over time. Thin white lines extend the length of the stalk. The top two images are stained for Traffic Jam (TJ) (white), Vasa (green), DAPI (blue), and Fas3 (red). The lower image is stained for DAPI (blue) and Fas3 (red). After two egg chambers have budded, there are an average of nine cells in the stalk (n = 12 stalks; the example in D has nine cells). (E, F) Castor antibody staining (white) together with Fas3 (red) or (E’) alone of 60 hr APF ovaries. As in adults, cells at each end of a budded egg chamber maintain strong Fas3 staining and Castor expression (arrowheads), indicating polar cell identity, while other FCs lose Fas3 and Castor expression. Scale bars, 20 µm.
Figure 9—figure supplement 5
Continued anterior movement of follicle cells (FCs) after budding of the first egg chamber.
Live imaging of 60 hr after puparium formation (APF) germaria with one budded egg chamber, highlighted by yellow dotted lines, showed that FCs continue to move short distances anterior in relation to germline cysts. Germaria in (A) and (B) are from the same multicolor ovary. (A) Z-projections of two timepoints show that tracked intermingled cells (ICs) (colored cells) remained anterior to the budding cyst as the germarium lengthened. Cells in the secondary extra-germarial crown (EGC) (indicated with a magenta bracket) moved a short distance anteriorly around the budding cyst (white arrows) and within the EGC (white colored cell) as the budding cyst moved posterior. Several cells in the secondary EGC and stalk divided. A mitotic cell is circled by the cyan dotted line at time 00:00. At 00:00, four z-planes (4, 5, 7, 11) are projected, and at 07:15, six z-planes (4, 5, 7, 9, 11, 12) are projected. (A’) Individual z slices show the movement of the cells along the z-axis. Time 00:00 is shown in the four z slices on top, with the cyan dotted line circling a dividing cell. ICs moved independently in all directions including around the circumference of the germarium. (B) A 60 hr APF multicolor germarium with two green cells (white arrows) that started posterior on the budding cyst and moved anterior along it as the cyst moved posteriorly. Many cells in the secondary EGC and stalk were dividing during this movie and the stalk can be seen to lengthen. (C) Cells were tracked in a movie of a 60 hr APF ovary labeled with ubi-GFP. Left panels: in the upper germarium, a cell indicated by the cyan arrowhead moved anteriorly from a location on the budded cyst to the stalk, which can be seen to lengthen. Right panels: in the lower germarium, an FC indicated by the yellow arrowhead moved further anterior on the surface of the budded cyst.
Figure 9—video 1
A 48 hr after puparium formation (APF) germarium imaged for 14 hr 45 min.
3D reconstruction of a movie of 48 hr APF ubi-GFP-labeled ovaries imaged every 15 min for 14 hr 45 min. The red, yellow, and pink cells described in Figure 9 and Figure 9—figure supplement 1 were tracked in Zeiss Zen software and then located in the 3D movie and colored using Procreate software.
Figure 9—video 2
A 48 hr after puparium formation (APF) germarium imaged for 14 hr 45 min.
The cell marked by the red asterisk in Figure 9 is shown here in a movie of individual z-planes. The cell is tracked with a red arrow, and a white asterisk is present when this cell is undergoing mitosis. This cell started on the posterior of the posterior cyst and ended in the secondary extra-germarial crown (EGC).
Figure 9—video 3
A 48 hr after puparium formation (APF) germarium imaged for 14 h 45 min.
A movie of the individual z-planes containing the cell marked by the white circle and asterisk in Figure 9 and Figure 9—figure supplement 2. This cell began in the basal stalk and ended on the budded cyst.
Figure 9—video 4
To accompany Figure 9—figure supplement 4B.
A 55 hr after puparium formation (APF) germarium imaged for 14 hr 45 min. A germarium at 55 hr APF with three tracked cells that began in the stalk and moved closer to the posterior cyst as cells from the extra-germarial crown (EGC) and stalk moved onto the cyst: the white cell began in the stalk 13 cells away from the cyst and ended in the stalk four cells from the cyst; the magenta cell began in the stalk seven cells from the cyst and ended on the posterior of the cyst; and the yellow cell started as the most anterior cell in the stalk and ended on the posterior third of the cyst. At 3:00, the cell indicated by the blue arrow in the stalk went through mitosis.
Figure 10

FUCCI labeling shows progressive accumulation of anterior intermingled cells (ICs) in G1 or a G0 arrest.
(A–G) C587-GAL4 was used to drive UAS-FUCCI expression and ovaries were stained for Fas3 (white) and Traffic Jam (TJ) (not shown) to identify all somatic cells. Somatic cells were either green (G1 or G0), red (late S phase), red/green (G2), or without any color (early S-phase for cells with adequate C587-GAL4 expression). Germaria are outlined with dotted lines. All bars, 20 µm. (A–F) Many red or red/green cells are present in anterior locations close to cap cells at (A) 12 hr after puparium formation (APF) and (B) 18 hr APF (arrows) but (C) by 24 hr APF and (D) 36 hr APF fewer such cells are evident and are further from the anterior (arrows). (E) At 48 hr APF, ICs in the anterior third of the germarium are uniformly green (G1 or G0). The bracketed region is magnified with enhanced colors to reveal (E’) that many cells in the EGC are red (S-phase), while one or two more posterior, basal stalk cells are faintly green. (F) At 96 hr APF, after three egg chambers have budded (two are outlined with blue dotted lines), red/green ICs can still occasionally be seen in the anterior half of the germarium (pink arrows) but (G) in adults this territory, occupied by r1 escort cells (ECs), is entirely green, followed by a mix of green and red/green more posterior r2a ECs, and follicle stem cells (FSCs), which are predominantly red/green (G2), red or colorless (S-phase) and with only a few green (G1) cells. In adults, C587-GAL4 expression extends through all ECs and FSCs but ends near the FSC/FC border.
Figure 11
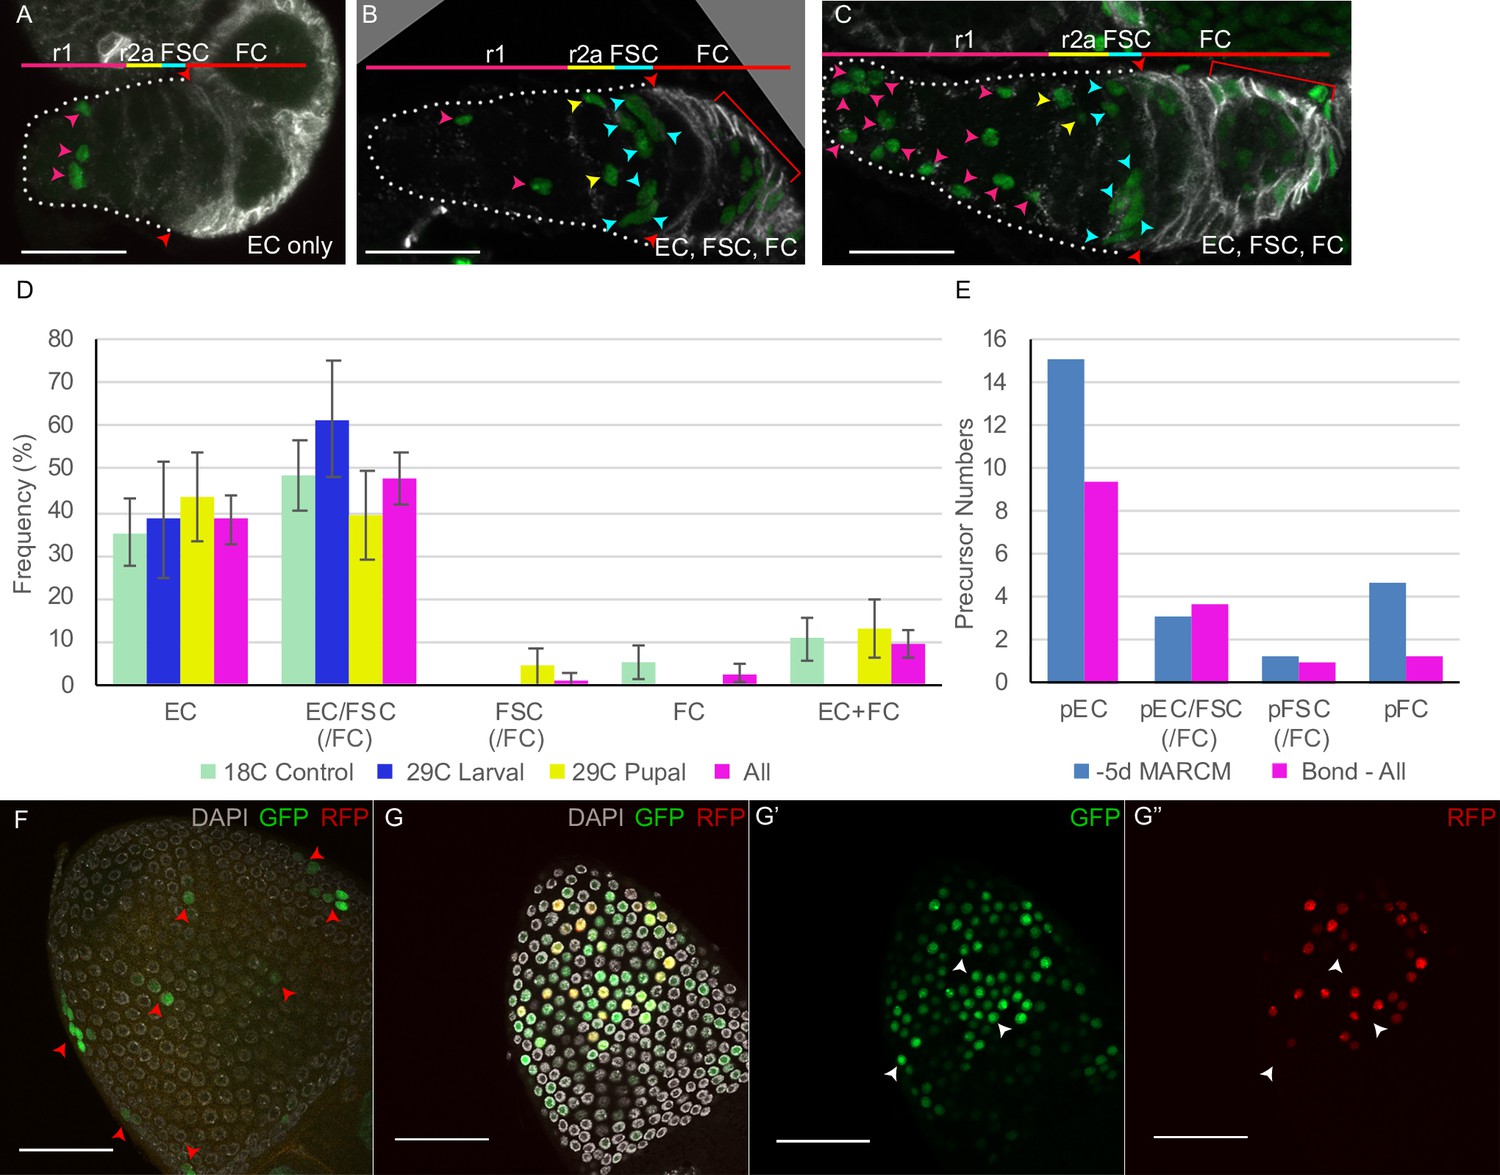
Lineages induced by bond-GAL4 reveal typical intermingled cell (IC) precursor patterns and a later extra-germarial crown (EGC) contribution.
(A–G) bond-GAL4/G-TRACE clones (green) were examined in 0–12 hr adult ovaries, stained with antibodies to Fas3 (white in A–C) and DAPI (white in F, G). (A–C) For animals maintained at 18°C throughout development, we observed mainly (A) marked escort cells (ECs) only or (B, C) marked ECs, follicle stem cells (FSCs), and follicle cells (FCs); scale bars, 20 μm. (D) Distribution of clone types observed for animals kept at 18°C throughout (green), raised at 29°C and moved to 18°C 2d after pupariation (‘29C larval,’ blue), raised at 18°C and moved to 29°C for the last 3–4d of pupation (‘29°C pupal,’ yellow), or the aggregate of all results (pink). EC/FSC and FSC categories almost always included FCs also. (E) Estimates of precursor numbers for MARCM clones induced 5d before eclosion (blue) and for the aggregate of all bond-Gal4 lineages (pink) after disaggregating raw data into single lineages (see Materials and methods). (F) Posterior egg chamber (29°C larval) with small GFP clones (arrowheads). Multiple z-sections are projected to show all clones. (G) Posterior egg chamber (29C pupal) with patches of (G’) GFP-positive cells, some of which also express (G”) RFP, indicating relatively recent expression of bond-GAL4. (F, G) Scale bars, 50 μm.
-
Figure 11—source data 1
Numerical data for graphs in Figure 11D.
- https://cdn.elifesciences.org/articles/69749/elife-69749-fig11-data1-v3.xlsx
-
Figure 11—source data 2
Numerical data for graphs in Figure 11E.
- https://cdn.elifesciences.org/articles/69749/elife-69749-fig11-data2-v3.xlsx
Tables
Table 1
Frequency of clones originating from different precursors and cellular yields per clone.
| Heat-shock to eclosion (days) | precursors of r1 ECs | precursors of r1/2a ECs | precursors of EC/FSCs | precursors of FSCs | |||||||
|---|---|---|---|---|---|---|---|---|---|---|---|
| Freq. | Yield | Freq. | Yield | Freq. | Yield | Freq. | Yield | ||||
| % | r1 | % | r1 | r2a | % | r1 | r2a | FSC | % | FSC | |
| 2 | 7.9 | 1.2 | 6.3 | 0.3 | 1.8 | 41 | 0.5 | 1.2 | 1.3 | 44 | 1.2 |
| 3 | 14 | 1.2 | 16 | 0.8 | 2.2 | 40 | 0.9 | 1 | 2.6 | 30 | 1.4 |
| 4 | 34 | 2.1 | 23 | 2 | 1.6 | 38 | 1.6 | 1.5 | 3.7 | 4.6 | 3 |
| 5 | 33 | 2.2 | 25 | 2.8 | 2.3 | 40 | 3.1 | 3.4 | 5.5 | 2.7 | 2.5 |
| 6 | 31 | 3.5 | 14 | 3.3 | 3.6 | 53 | 3.2 | 3.4 | 4.8 | 2.7 | 3 |
-
EC: escort cell; FSC: follicle stem cell.
Table 2
Number of adult cells of each type made from dividing precursors at different developmental times calculated from the total yield of marked cells of each type.
| Heat-shock to eclosion (days) | Total number of marked cells in clones | Cells made per germarium from dividing precursors | ||||||
|---|---|---|---|---|---|---|---|---|
| r1 | r2a | EC | FSC | r1 | r2a | EC | FSC | |
| x | y | x + y | z | 16x/z | 16y/z | 16(x + y)/z | ||
| 2 | 20 | 37 | 57 | 69 | 4.6 | 8.6 | 13.2 | 16 |
| 3 | 41 | 46 | 87 | 93 | 7.1 | 7.9 | 15 | 16 |
| 4 | 156 | 80 | 236 | 134 | 18.6 | 9.6 | 28.2 | 16 |
| 5 | 191 | 140 | 331 | 164 | 18.6 | 13.7 | 32.3 | 16 |
| 6 | 356 | 253 | 609 | 295 | 19.3 | 13.7 | 33 | 16 |
-
EC: escort cell; FSC: follicle stem cell.
Table 3
Clone frequencies and cellular yields from different lineage experiments together with deduced single-lineage parameters including the number of precursors of different types.
| N | EC | Ec/FSC | FSC | FC | EC + FC | Number of dividing precursors per germarium | ||||||||||
|---|---|---|---|---|---|---|---|---|---|---|---|---|---|---|---|---|
| Freq. | Yield | Freq. | Yield | Freq. | Yield | Freq. | Freq. | Yield | Total (n) | pEC | pEC/FSC | pFSC | pFC | |||
| % | EC | % | EC | FSC | % | FSC | % | % | EC | |||||||
| 100 p | 100q | x | 100 r | y | 100 s | 16/(qx + ry) | pn | qn | rn | sn | ||||||
| 0 h APF MARCM raw data | 98 | 46.9 | 2.4 | 24.5 | 4 | 4 | 3 | 4.3 | 9.2 | 16.3 | 2.9 | |||||
| 0 h APF MARCM assuming 70 % double clones | 63 | 1.8 | 13 | 3.2 | 3.5 | 5 | 4.3 | 19 | 24 | 15.1 | 3.1 | 1.2 | 4.6 | |||
| 0 h APF Mulicolor raw data | 26 | 42.3 | 3 | 30.7 | 3.5 | 2.6 | 7.7 | 4 | 11.5 | 7.7 | 2.5 | |||||
| 0 h APF Multicolor assuming 30 % double clones | 52 | 2.4 | 24.5 | 2.1 | 2.3 | 9.5 | 3.9 | 14 | 17.3 | 9 | 4.2 | 1.6 | 2.4 | |||
| 36 h APF MARCM raw data | 121 | 20.7 | 2.5 | 23.1 | 2.8 | 3.5 | 3.3 | 3.3 | 9.1 | 43.8 | 2.6 | |||||
| 36 h APF MARCM assuming all double clones | 51 | 1.8 | 7 | 3 | 4.7 | 4.1 | 3.1 | 38 | 34.9 | 17.8 | 2.4 | 1.4 | 13.3 | |||
| bond-GAL4 raw data | 73 | 38.4 | 5.1 | 48 | 8.3 | 5.4 | 1.4 | 7 | 2.7 | 9.6 | 9 | |||||
| bond-GAL4 assuming all double clones | 61.9 | 3.3 | 24 | 5.6 | 4 | 6.3 | 5.3 | 7.8 | 15.1 | 9.4 | 3.6 | 1 | 1.2 | |||
-
APF: after puparium formation; EC: escort cell; FC: follicle cell; FSC: follicle stem cell.
Key resources table
| Reagent type (species) or resource | Designation | Source or reference | Identifiers | Additional information |
|---|---|---|---|---|
| Gene (Drosophila melanogaster) | sha | FlyBase | FlyBase ID:FBgn0003382 | |
| Gene (Drosophila melanogaster) | bond | FlyBase | FlyBase ID: FBgn0260942 | |
| Genetic reagent (Drosophila melanogaster) | NM FRT40A | BDSC BL-1835 | RRID:BDSC_1835 | Control for MARCM clones |
| Genetic reagent (Drosophila melanogaster) | FRT82B NM | PMID:23079600 | Control for MARCM clones | |
| Genetic reagent (Drosophila melanogaster) | FRT42D tub-GAL80 | PMID:28414313 | For 2R MARCM clones | |
| Genetic reagent (Drosophila melanogaster) | FRT82B tub-GAL80 | BDSC BL-5135 | RRID:BDSC_5135 | For 3R MARCM clones |
| Genetic reagent (Drosophila melanogaster) | FRT42D act-GAL80 tub-GAL80 | PMID:33135631 | For 2R MARCM clones at 29C | |
| Genetic reagent (Drosophila melanogaster) | yw hs-Flp, UAS-nGFP, tub-GAL4 | PMID:33135631 | For MARCM clones | |
| Genetic reagent (Drosophila melanogaster) | ubi-GFP FRT40A | BDSC BL-5189 | ||
| Genetic reagent (Drosophila melanogaster) | ubi-GFP FRT40A FRT42B His2Av-RFP/tub-lacZ FRT40A FRT42B | PMID:28414313 | For multicolor clones | |
| Genetic reagent (Drosophila melanogaster) | C587-GAL4 | BDSC BL-67747 | RRID:BDSC_67747 | GAL4 expressed in ECs and FSCs |
| Genetic reagent (Drosophila melanogaster) | UAS-FUCCIOn second chromosome | BDSC BL-55121 | Nuclear GFP and RFP FUCCI | |
| Genetic reagent (Drosophila melanogaster) | UAS-FUCCIOn third chromosome | BDSC BL-55122 | Nuclear GFP and RFP FUCCI | |
| Genetic reagent (Drosophila melanogaster) | bond-GAL4/G-TRACE | PMID:31919193 | Dr. Ruth Lehmann (MIT) | |
| Antibody | Anti-GFP (rabbit polyclonal) | Molecular Probes | A6455 | (1:1000) |
| Antibody | Anti-Fas3 (mouse monoclonal) | Developmental Studies Hybridoma Bank(DSHB) | 7G10 | (1:250) |
| Antibody | Anti-Lamin-C (mouse monoclonal) | DSHB | LC28.26 | (1:50) |
| Antibody | Anti-Hts (mouse monoclonal) | DSHB | 1B1 | (1:20) |
| Antibody | Anti-Traffic Jam (guinea pig polyclonal) | PMID:23720044 | RRID:AB_2567862 | Dr. Dorothea Godt (University of Toronto)(1:5000) |
| Antibody | Anti-Zfh-1 (rabbit polyclonal) | Ruth Lehmann | Dr. Ruth Lehmann (MIT)(1:5000) | |
| Antibody | Anti-Castor (rabbit polyclonal) | PMID:9436984 | Dr. Ward Odenwald (National Institutes of Health) (1:1000) | |
| Antibody | Anti-Vasa (rabbit polyclonal) | Ruth Lehmann | Dr. Ruth Lehmann (MIT)(1:1000) | |
| Antibody | Alexa Fluor 488 goat anti-rabbit(polyclonal) | Thermo FisherScientific | Cat# A11034; RRID:AB_2576271 | (1:1000) |
| Antibody | Alexa Fluor 647 goat anti-rabbit(polyclonal) | Thermo Fisher Scientific | Cat# A21245; RRID:AB_2535813 | (1:1000) |
| Antibody | Alexa Fluor594 goat-anti mouse (polyclonal) | Thermo Fisher Scientific | Cat# A11032; RRID:AB_2534091 | (1:1000) |
| Antibody | Alexa Fluor 546 goat-anti mouse (polyclonal) | Thermo Fisher Scientific | Cat# A11030; RRID:AB_2534089 | (1:1000) |
| Antibody | Alexa Fluor 647 goat-anti mouse (polyclonal) | Thermo Fisher Scientific | Cat# 21236; RRID:AB_2535805 | (1:1000) |
| Antibody | Alexa Fluor 647 goat anti-rat (polyclonal) | Thermo Fisher Scientific | Cat# 21247; RRID:AB_141778 | (1:1000) |
| Antibody | Alexa Fluor 488 goat anti-guinea pig (polyclonal) | Thermo Fisher Scientific | Cat# A11073; RRID:AB_2534117 | (1:1000) |
| Antibody | Alexa Fluor 594 goat anti-guinea pig (polyclonal) | Thermo Fisher Scientific | Cat# A11076; RRID:AB_2534120 | (1:1000) |
| Antibody | Alexa Fluor 647 goat anti-guinea pig (polyclonal) | Thermo Fisher Scientific | Cat# A21450; RRID:AB_2735091 | (1:1000) |
| Chemical compound, drug | DAPI Fluoromount-G | Southern Biotech | 0100-20 | Mount samples and stain for DAPI |
| Commercial assay or kit | Click-iT EdU Cell Proliferation Kit | Thermo Fisher Scientific | C10086 | |
| Software, algorithm | ZEN Blue, ZEN Black, and ZEN Lite | Zeiss | For viewing z-stack images and quantifying fluorescence |
Additional files
Download links
A two-part list of links to download the article, or parts of the article, in various formats.
Downloads (link to download the article as PDF)
Open citations (links to open the citations from this article in various online reference manager services)
Cite this article (links to download the citations from this article in formats compatible with various reference manager tools)
Adult stem cells and niche cells segregate gradually from common precursors that build the adult Drosophila ovary during pupal development
eLife 10:e69749.
https://doi.org/10.7554/eLife.69749


