A WDR35-dependent coat protein complex transports ciliary membrane cargo vesicles to cilia
- MRC Human Genetics Unit, Institute of Genetics and Cancer, University of Edinburgh, United Kingdom
- Department of Molecular Biology and Genetics, Aarhus University, Denmark
- Max Planck Institute of Molecular Cell Biology and Genetics, Germany
- Human Technopole, Italy
Figures
Figure 1 with 2 supplements
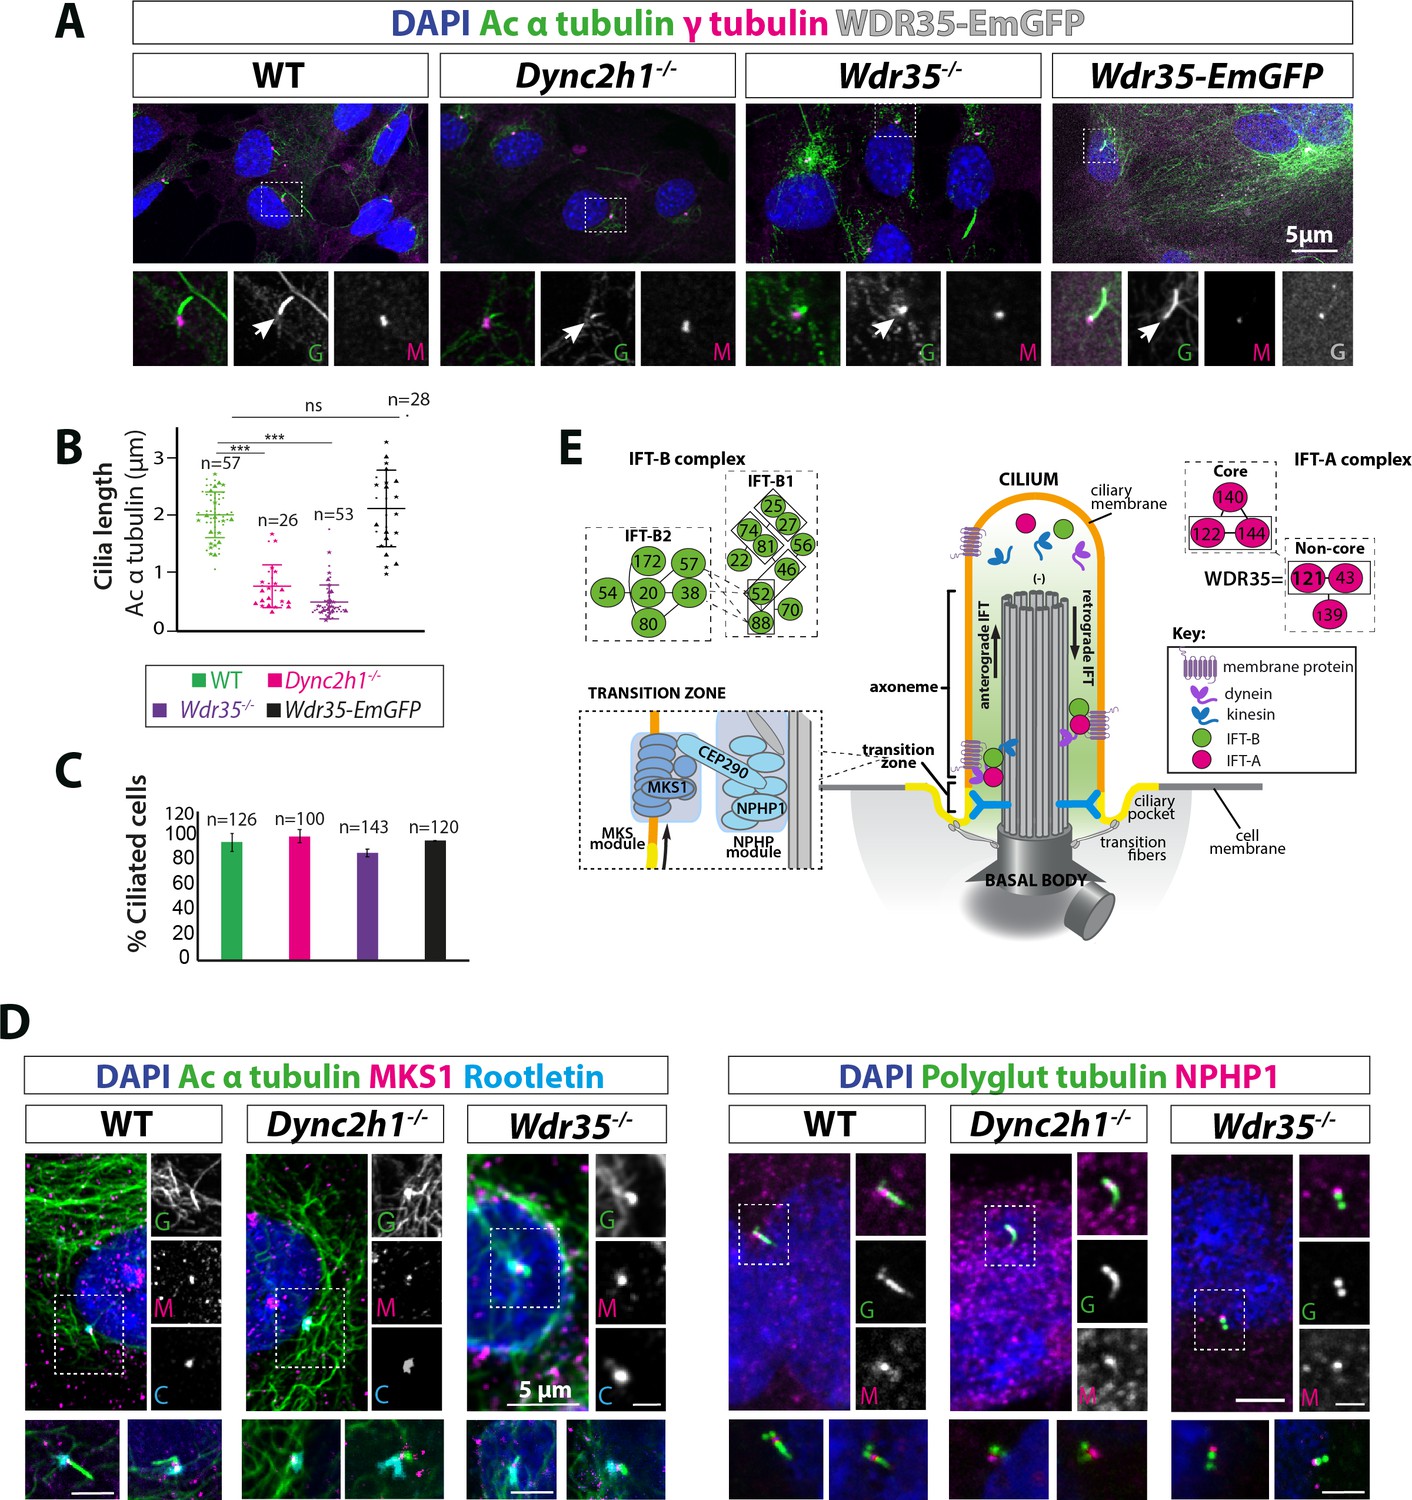
Wdr35-/- and Dync2h1-/- mutant cells have a drastic reduction in cilia length but have no difference in the number of cilia.
(A) Wild type (WT) and mutant mouse embryonic fibroblasts (MEFs) and those rescued by transiently expressing WDR35-EmGFP serum-starved for 24 hr, fixed and stained with acetylated α-tubulin (green) and γ-tubulin (magenta), nuclei (blue). Boxed regions are enlarged below, and arrows point at ciliary axoneme stained for acetylated α-tubulin. (B) Quantification of cilia length for acetylated α-tubulin. n = total number of cells from three different biological replicates (represented by different shapes). Asterisk denotes significant p-value from t-test: *p<0.05, **p<0.01, ***p<0.001. (C) Percentage of acetylated α-tubulin-positive ciliated cells. (D) 24 hr serum-starved WT and mutant MEFs stained for nuclei (blue), acetylated α-tubulin/polyglutamylated tubulin (green), rootletin (cyan), and transition zone proteins MKS1/NPHP-1 (magenta) show no difference in the localization of transition zone proteins MKS1 and NPHP-1. Gray scale enlarged regions are labeled green (G), magenta (M), and cyan (C). (E) Schematic of intraflagellar transport (IFT) pathway in cilia.
-
Figure 1—source data 1
Full data points and stats test of cilia length for Figure 1B.
- https://cdn.elifesciences.org/articles/69786/elife-69786-fig1-data1-v3.zip
Figure 1—figure supplement 1
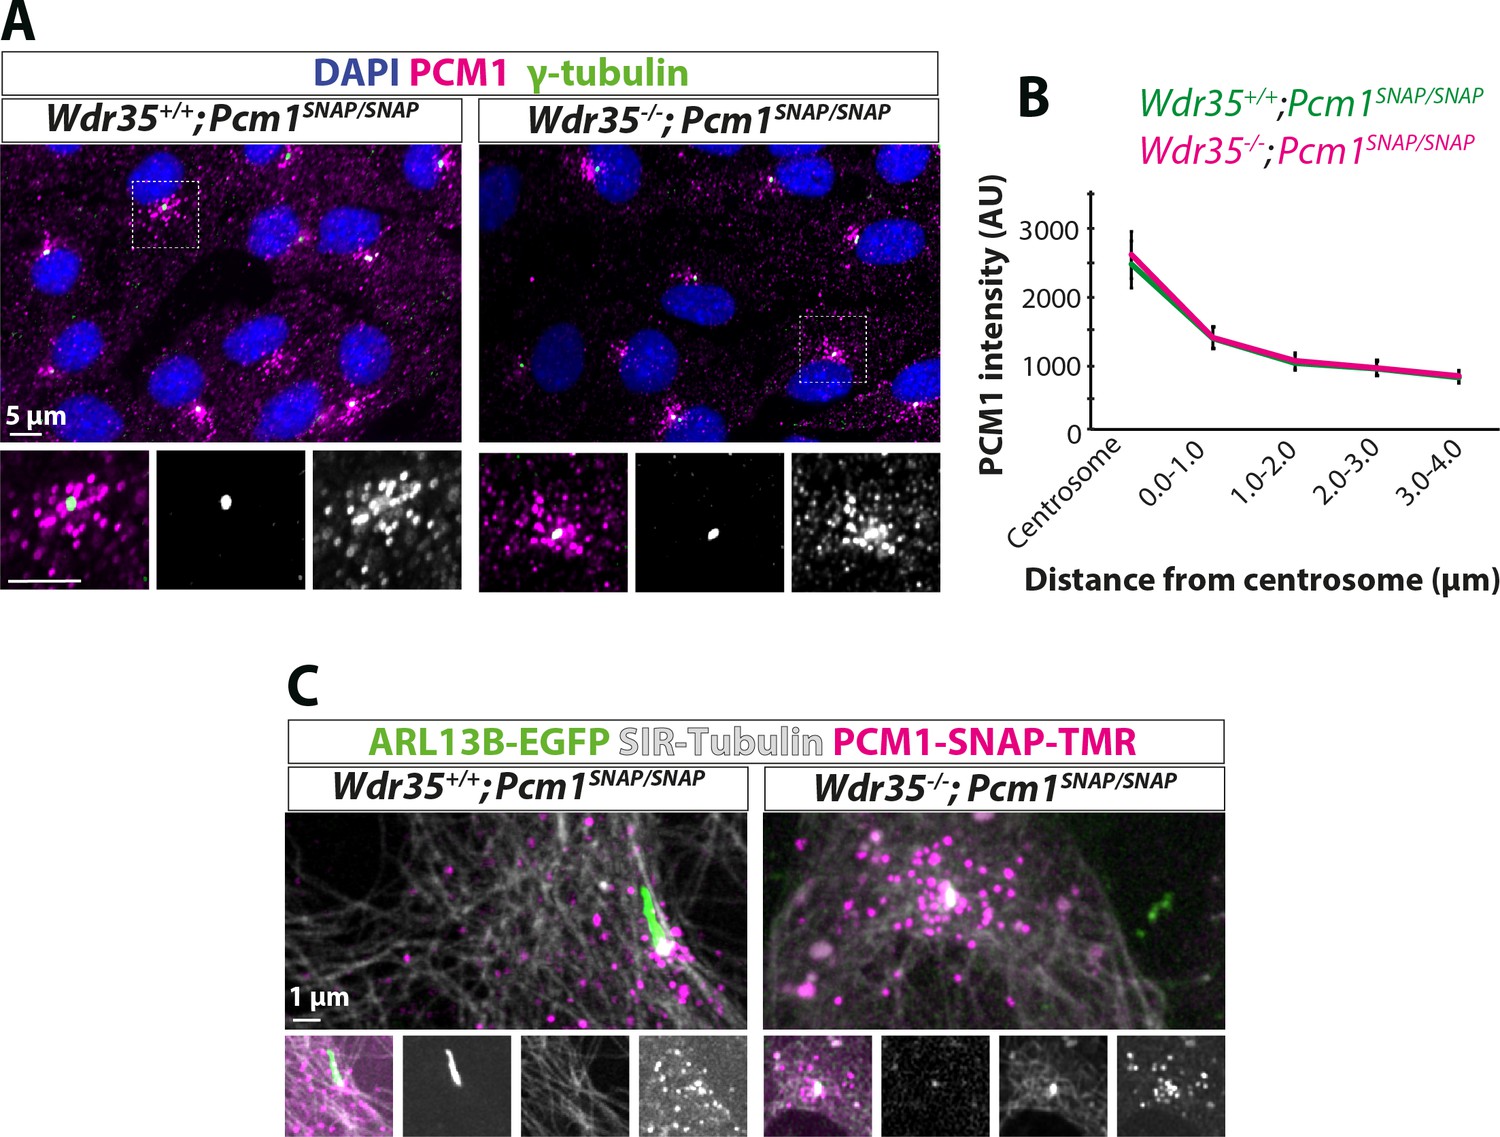
The organization of centriolar satellites (CS) around Wdr35-/- cilia is not changed.
CS marker PCM1 intensity and localization are unchanged in Wdr35 +/+ and Wdr35-/- mouse embryonic fibroblasts (MEFs) serum-starved for 24 hr to induce ciliogenesis and imaged (A) fixed after staining with antibodies; PCM1 (magenta) and γ-tubulin (green). Nuclei are in blue. (B) Quantification of PCM1 intensity around the centrosome in concentric rings of 1 µm around the basal body (γ-tubulin). n = 50 cells (three biological replicates each). (C) Imaged live after staining with SNAP-TMR dye for endogenous SNAP tagged PCM1 (magenta) and microtubule marker SiR-tubulin (gray). These cells are also expressing ARL13B-EGFP (green) (Figure 1—video 1).
Figure 1—video 1
The organization of centriolar satellites is not disrupted in Wdr35 -/- mutants.
Wdr35+/+; Pcm1 SNAP/SNAP and Wdr35-/-; Pcm1 SNAP/SNAP mouse embryonic fibroblasts (MEFs) electroporated with ARL13B-EGFP (green), serum-starved for 24 hr and stained for SiR-tubulin (gray) and SNAP-TMR (magenta) and imaged live on Leica SP5 microscope using a 63×, 1.4 oil immersion objective. The video is compiled as 5 fps. PCM-1 density around cilia is not altered in the absence of WDR35. (Related to Figure 1—figure supplement 1C.)
Figure 2
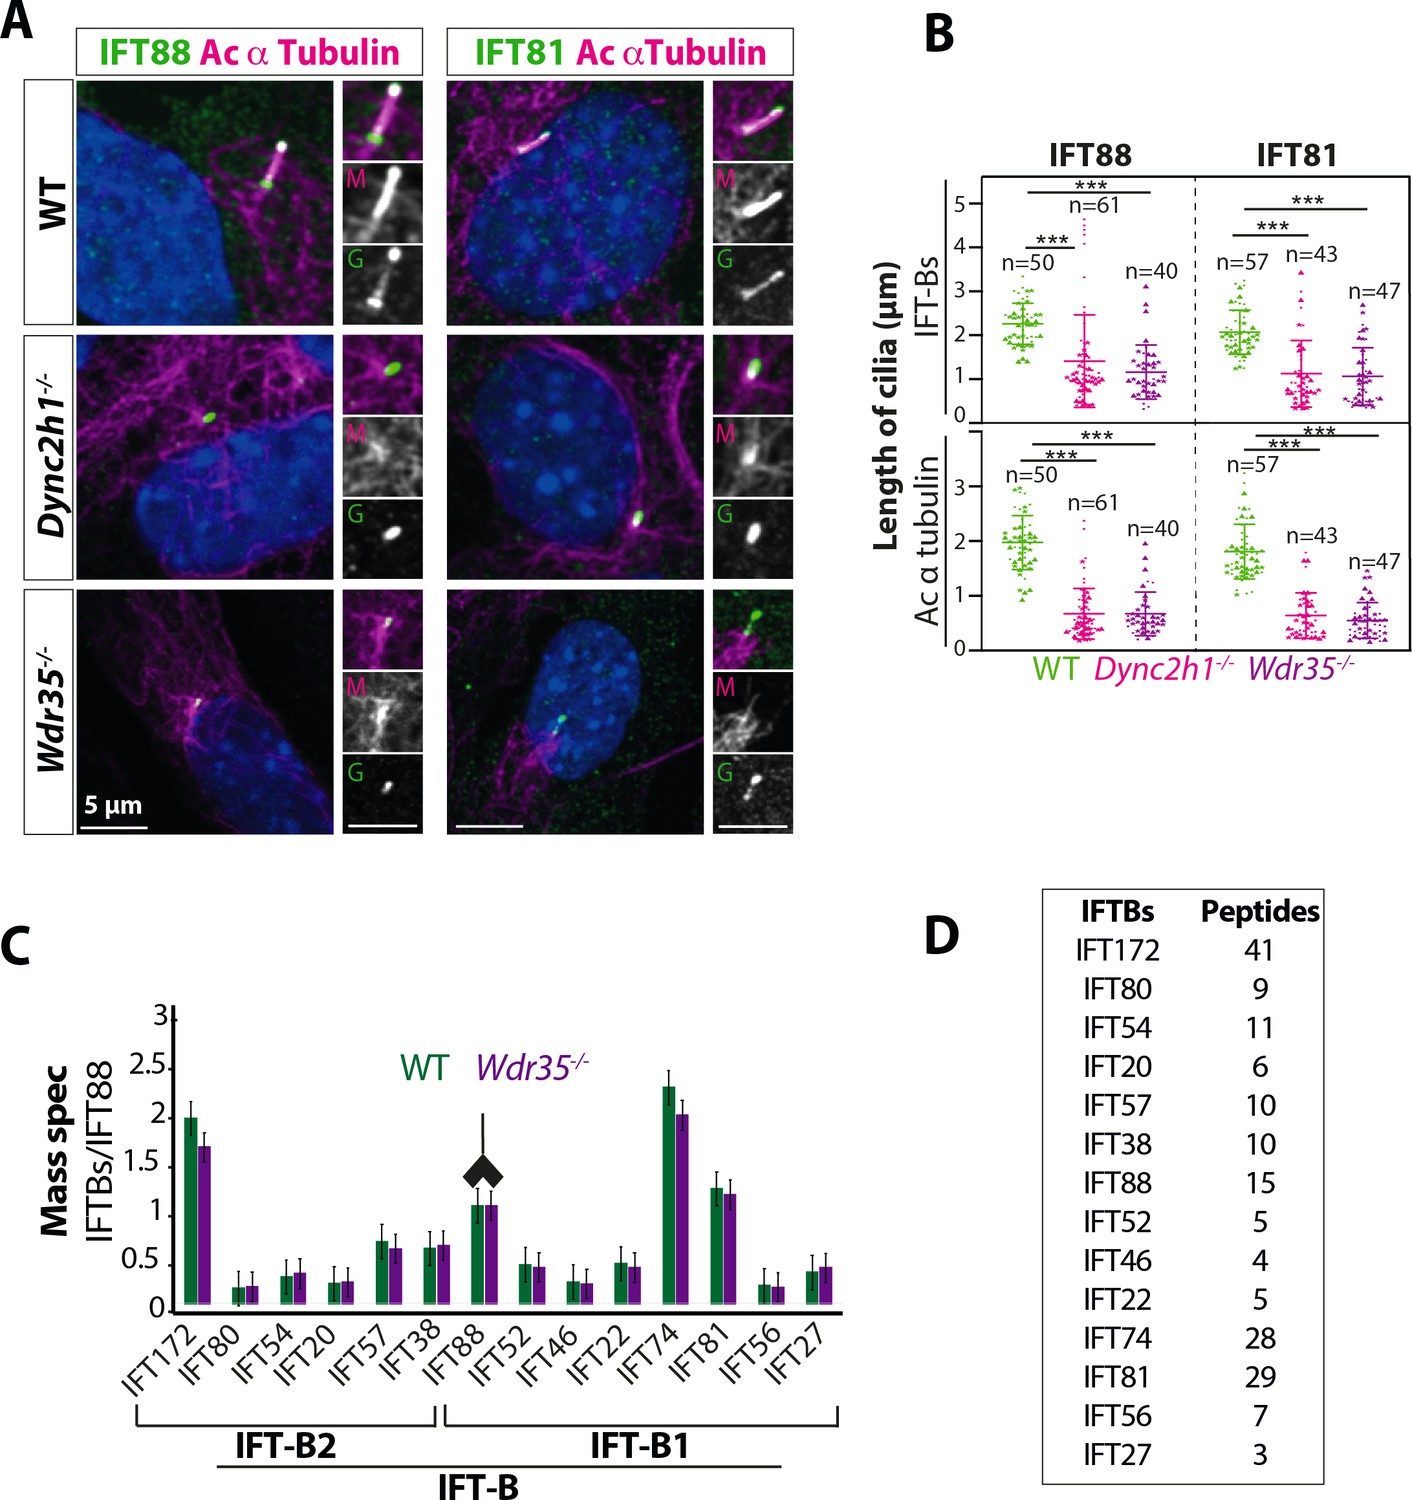
Wdr35-/- cilia exhibit retrograde transport defects of IFT-B, similar to Dync2h1-/-, although IFT-B complex assembly is unaffected.
(A) IFT-B (green) accumulates beyond the axoneme (Ac-α-tubulin, magenta) in Wdr35 and Dync2h1 mutant cilia from 24 hr serum-starved and fixed mouse embryonic fibroblasts (MEFs). (B) Length quantification shows IFT-B accumulates beyond acetylated α-tubulin in significantly shorter mutant cilia. n = total number of cells from three different biological replicates represented by different shapes. Asterisk denotes significant p-value from t-test: *p<0.05, **p<0.01, ***p<0.001. Scale bars = 5 µm. (C, D) Despite differences in localization, IFT88 immunoprecipitation/mass spectrometry (IP/MS) analysis of E11.5 wild type (WT) and Wdr35-/- littermate embryos reveals no difference in the composition of the IFT-B complex. Antibody highlights bait (IFT88) for IP. (C) Normalized label-free quantification intensities (LFQs) to IFT88 intensity reveal no difference between WT and Wdr35-/- IFT-B complex composition. N = 4 embryos/genotype. (D) The number of unique peptides identified in IP/MS.
-
Figure 2—source data 1
Full data points and stats test of IFT-B and cilia length (Figure 2B).
- https://cdn.elifesciences.org/articles/69786/elife-69786-fig2-data1-v3.zip
Figure 3 with 1 supplement
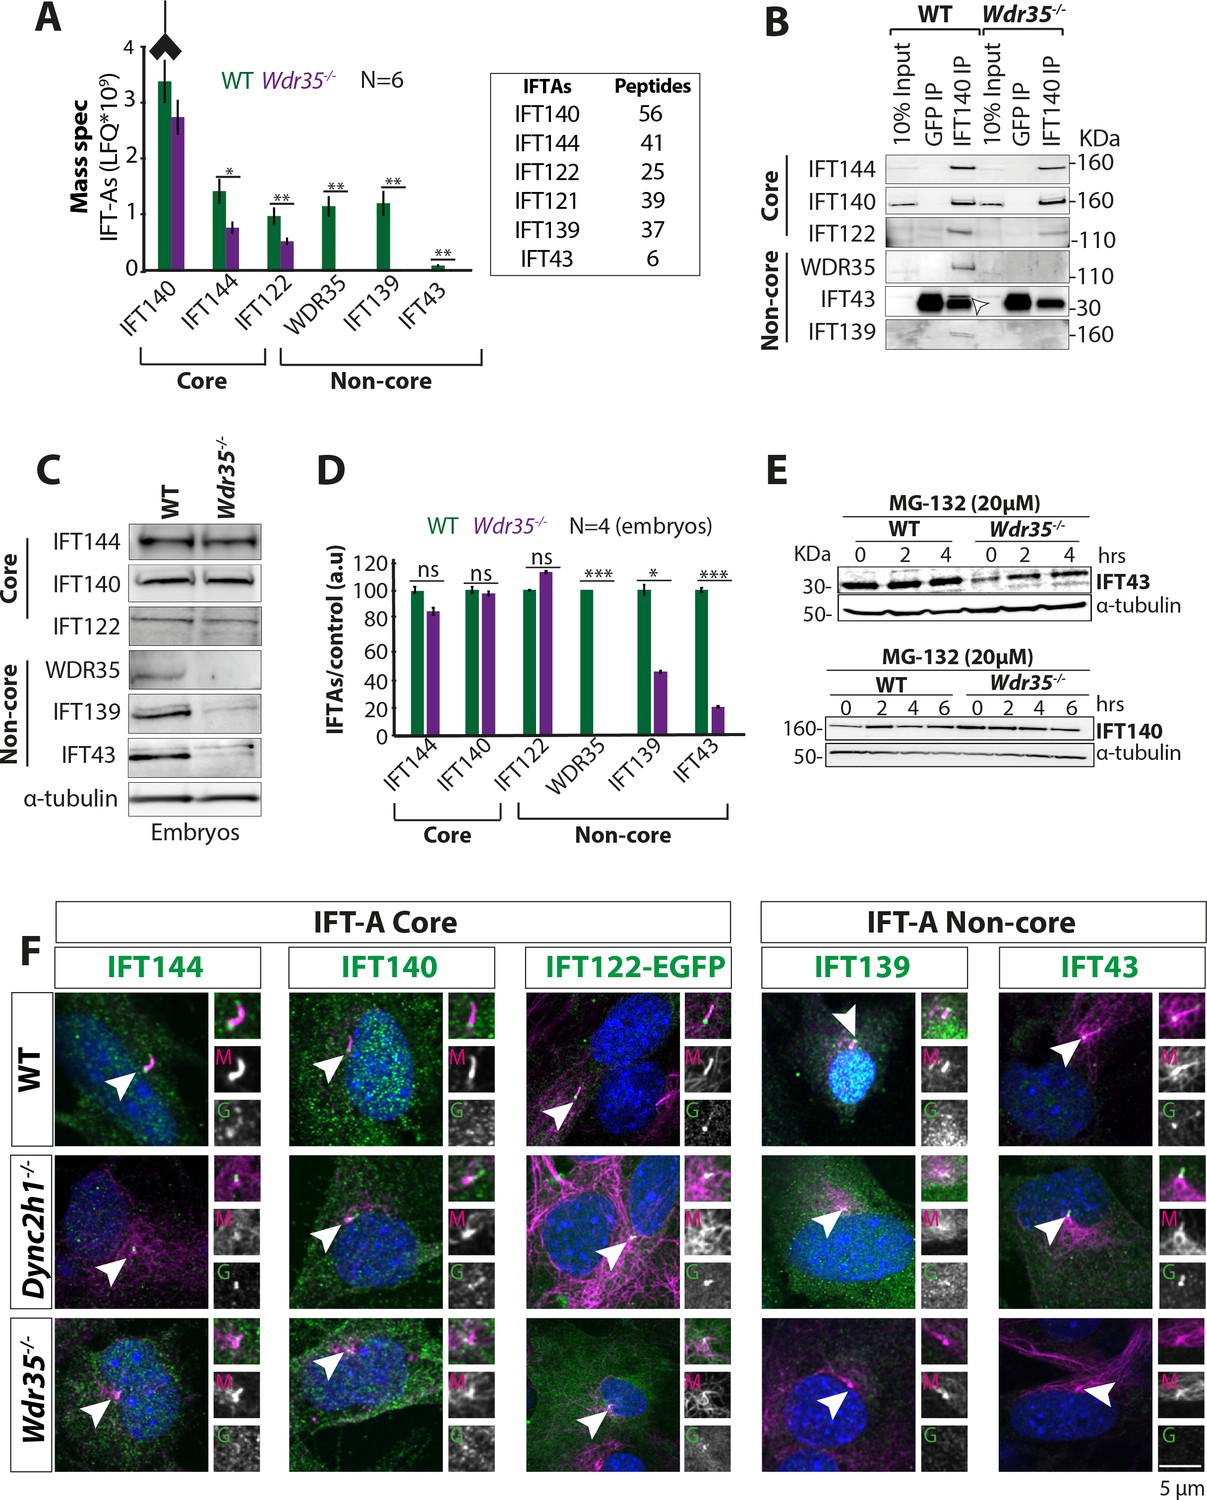
WDR35 is essential for the stability and recruitment of the IFT-A complex into cilia.
(A) Immunoprecipitation/mass spectrometry (IP/MS) data show the stability of the IFT-A complex is disrupted in Wdr35-/- lysates. N = 6 embryos/genotype. Antibody highlights bait (IFT140) for IP. (B) Immunoblots confirm the non-core IFT-A complex is unstable in Wdr35 mutants. IFT43 runs close to the molecular weight of IgG and is shown by an arrow as IFT43 band over the IgG band from IFT140 IP in wild type (WT). The corresponding band is absent in Wdr35 null samples. (C, D) Immunoblots for the total level of IFT-A subunits in E11.5 embryo lysates show non-core components IFT139 and IFT43 to be missing in Wdr35 mutants (C), quantified by densitometry (D). N = biological replicates. Asterisk denotes significant p-value from t-test: *p<0.05, **p<0.01, ***p<0.001. (E) Inhibition of the proteasome by treatment with MG-132 rescues IFT43 stability in Wdr35-/- mouse embryonic fibroblasts (MEFs). (F) MEFs serum-starved for 24 hr reveal a retrograde transport defect in Dync2h1-/- versus a failed recruitment of IFT-A proteins into Wdr35-/- cilia. Cells are fixed and stained for respective IFT-A (green) and γ- and acetylated α-tubulin (magenta). Arrowheads point at cilia. Scale bars = 5 µm. Due to a lack of specific immunoreagents, IFT122 signal is from transiently expressed Ift122-GFP. All other panels represent endogenous signal detected by IF.
-
Figure 3—source data 1
Full immunoblots labeled and unlabeled for Figure 3B, C and E.
- https://cdn.elifesciences.org/articles/69786/elife-69786-fig3-data1-v3.zip
Figure 3—figure supplement 1

WDR35 is essential for the stability and recruitment of the IFT-A complex into cilia.
(A, B) Immunoblots for the total level of IFT-A subunits in mouse embryonic fibroblast (MEF) lysates show non-core components IFT139 and IFT43 to be missing in Wdr35 mutant cells (A), quantified by densitometry (B). N = biological replicates. Asterisk denotes significant p-value from t-test: *p<0.05, **p<0.01, ***p<0.001. (C) Quantification of cilia length for acetylated α-tubulin and IFT-As. n = total number of cells from three different biological replicates (represented by different shapes). Asterisk denotes significant p-value from t-test: *p<0.05, **p<0.01, ***p<0.001.
-
Figure 3—figure supplement 1—source data 1
Full immunoblots labeled and unlabeled for Figure 3—figure supplement 1A as well as full data points and stats test of IFT-A and cilia length for Figure 3—figure supplement 1C.
- https://cdn.elifesciences.org/articles/69786/elife-69786-fig3-figsupp1-data1-v3.zip
Figure 4 with 1 supplement
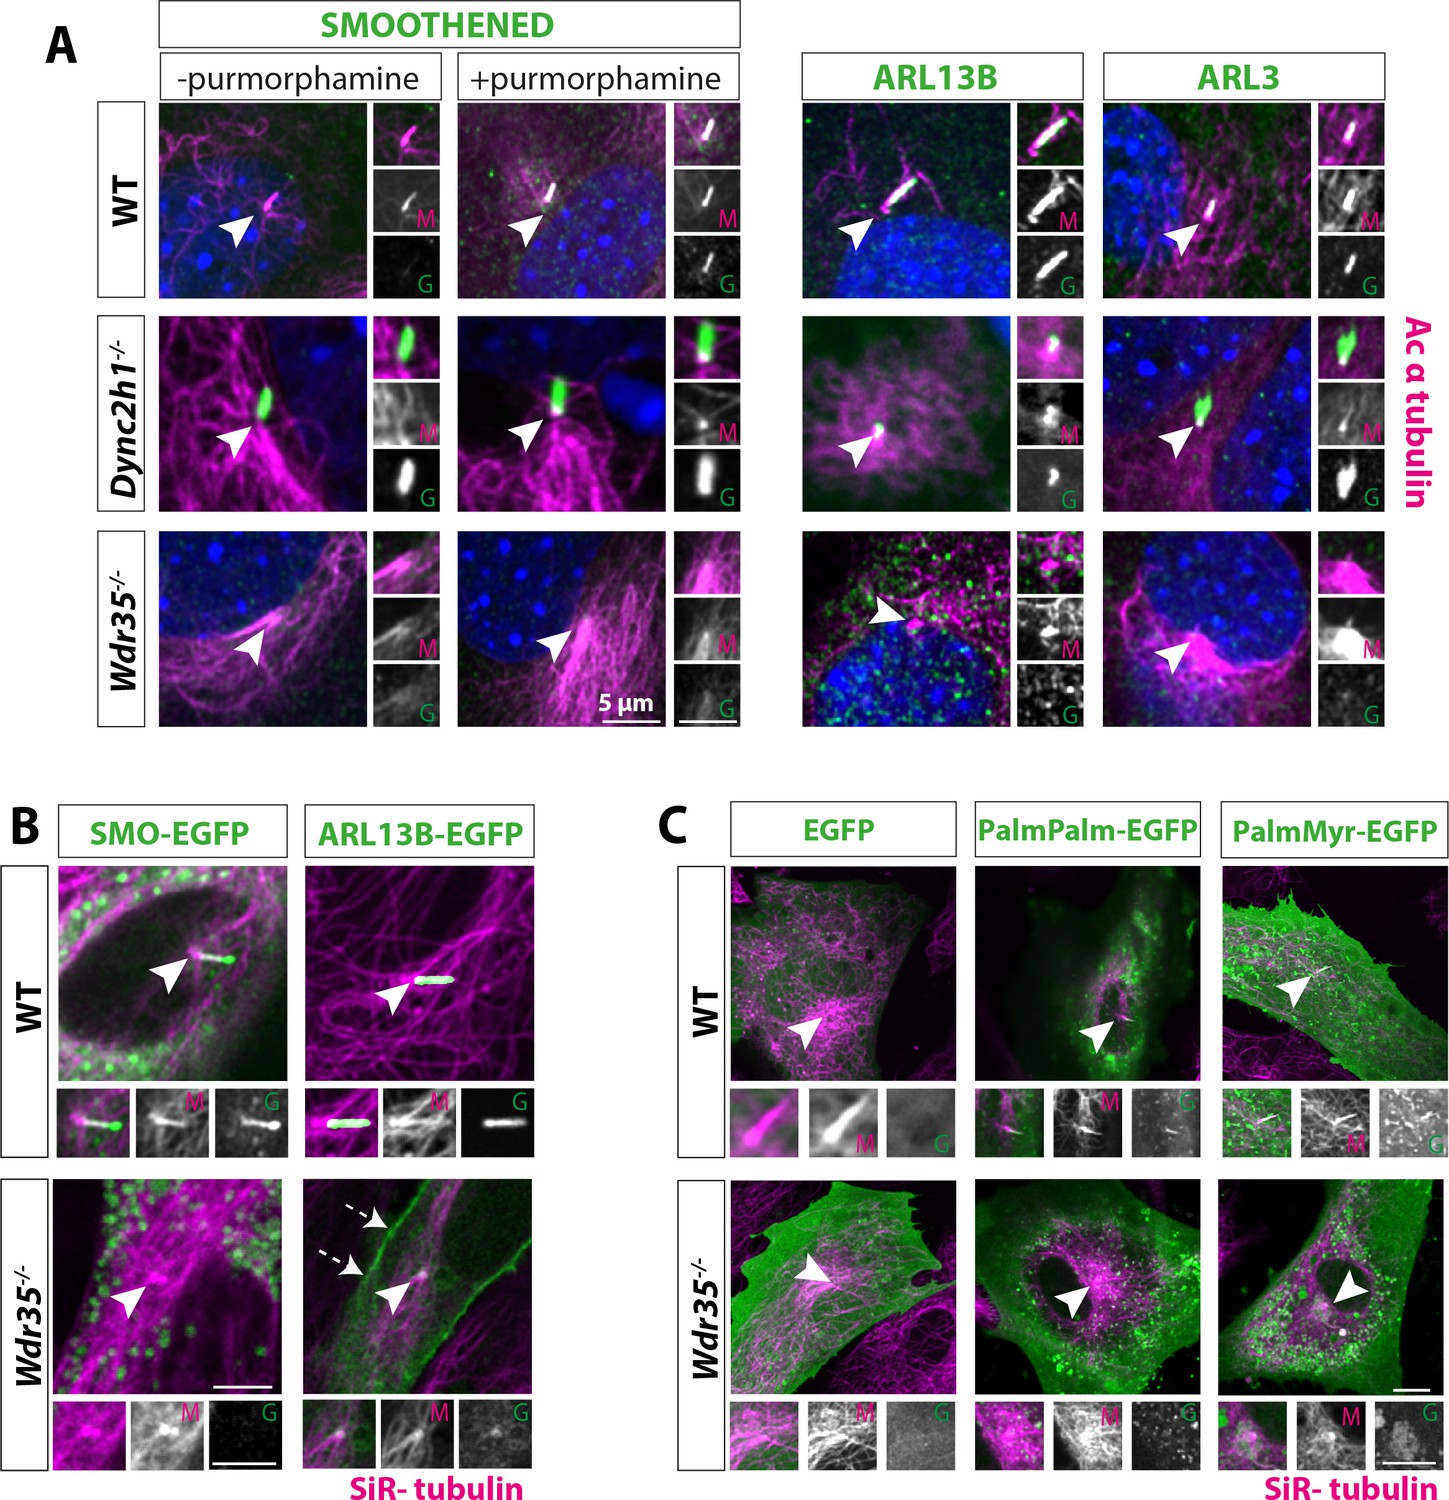
Membrane proteins fail to localize to Wdr35-/- cilia.
(A) 24 hr serum-starved wild type (WT), Wdr35-/-, and Dync2h1-/- mouse embryonic fibroblasts (MEFs) stained for Smoothened (SMO), ARL13B and ARL3 (green), and acetylated α-tubulin (magenta) show failed localization of membrane proteins in Wdr35-/- and retrograde transport defect in Dync2h1-/-. (B) Smoothened-EGFP and ARL13B-EGFP (green) expressing ciliated cells stained with SiR-tubulin (magenta) show failed localization of exogenously expressed membrane proteins inside mutant cilia (Figure 4—video 1). Dashed arrows point at the enrichment of ARL13B on the membrane in the mutant. (C) 24 hr serum-starved cells expressing respective general lipidated GFP cargos (green) and stained for SiR-tubulin show enrichment of lipidated GFP in WT cilia and failed localization in the mutant. Arrowheads point at cilia in all the images. Scale bars = 5 µm.
Figure 4—video 1
Cilia-specific membrane-associated cargo (A) ARL13B and membrane-integrated cargo (B) Smoothened (SMO) fail to localize in Wdr35-/- cilia.
Wild type (WT) and Wdr35-/- mouse embryonic fibroblasts (MEFs) expressing ARL13B-EGFP (green) and SMO-EGFP (green), serum-starved for 24 hr, stained with SiR-tubulin and imaged live on Leica SP5 microscope using a 63×, 1.4 oil immersion objective. The video is compiled as 5 fps. (Related to Figure 4.)
Figure 5 with 1 supplement
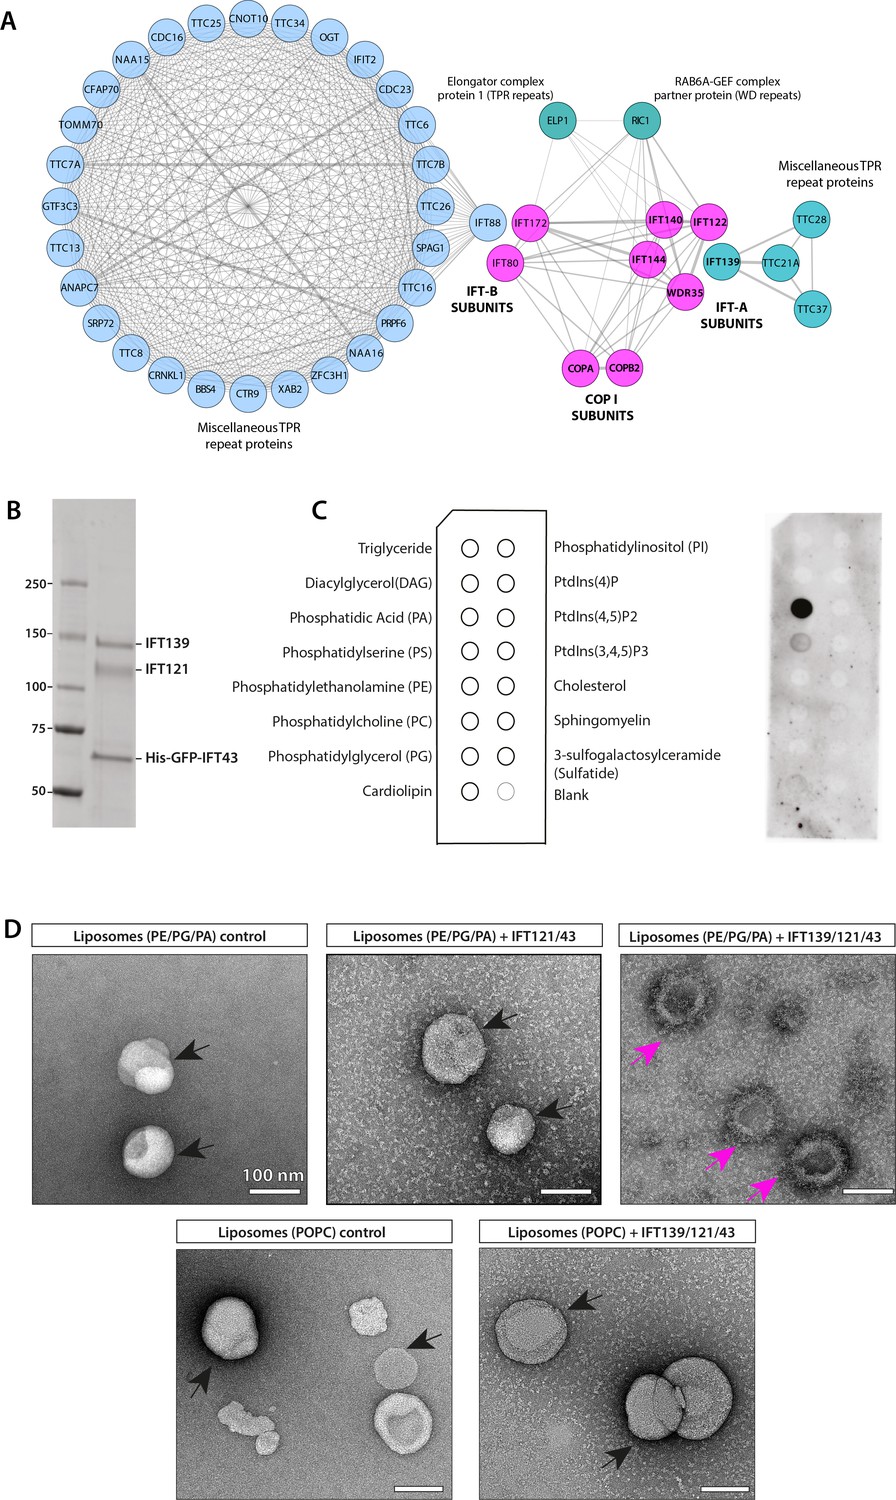
IFT-A subunits have close sequence and structural similarity to α and β′ COPI subunits and can directly bind to phosphatidic acid (PA) in vitro.
(A) Clusters of IFT and COPI subunits generated from the results of reciprocal sequence similarity searches with HHBlits using IFT144, IF140, IF122, and WDR35 as initial search queries suggest a very close similarity between a subset of IFT proteins and the COPI α (COPA) and β′ (COPB2) subunits. Clusters are color-coded according to protein structural motifs with tetratricopeptide repeat (TPR) proteins (blue) and dual WD40 repeat and TPR-containing proteins (magenta). Lines between clusters indicate sequence-based proximity. (B) The SDS-PAGE analysis of the purified IFT139/121/His-GFP-43 after purification by size-exclusion chromatography (SEC). (C) Lipid-strip overlay assay to detect binding between the IFT-A trimer shown in panel (A) and various lipids as indicated in the schematics on the left-hand side of panel (C). The IFT-A trimer displays strong binding to PA and weaker binding to phosphatidylserine (PS) in the protein-lipid overlay assay. Both are negatively charged (anionic) phosphoglycerates, whereas the trimer shows no binding to neutral or inositol-based lipids. (D) Negative stain micrographs show that the IFT-A trimer (IFT139/121/43) complex associates with liposomes (PE/PG/PA) but not with POPC-liposomes lacking PA. The IFT121/43 dimer associates weakly with liposomes (PE/PG/PA). The particles of liposomes with smooth surfaces are highlighted in black arrows, and liposomes with rough surface displaying protein binding are highlighted in magenta arrows. Scale bar: 100 nm.
-
Figure 5—source data 1
Full immunoblots labeled and unlabeled for Figure 5B and C' and Figure 5—figure supplement 1A.
- https://cdn.elifesciences.org/articles/69786/elife-69786-fig5-data1-v3.zip
Figure 5—figure supplement 1
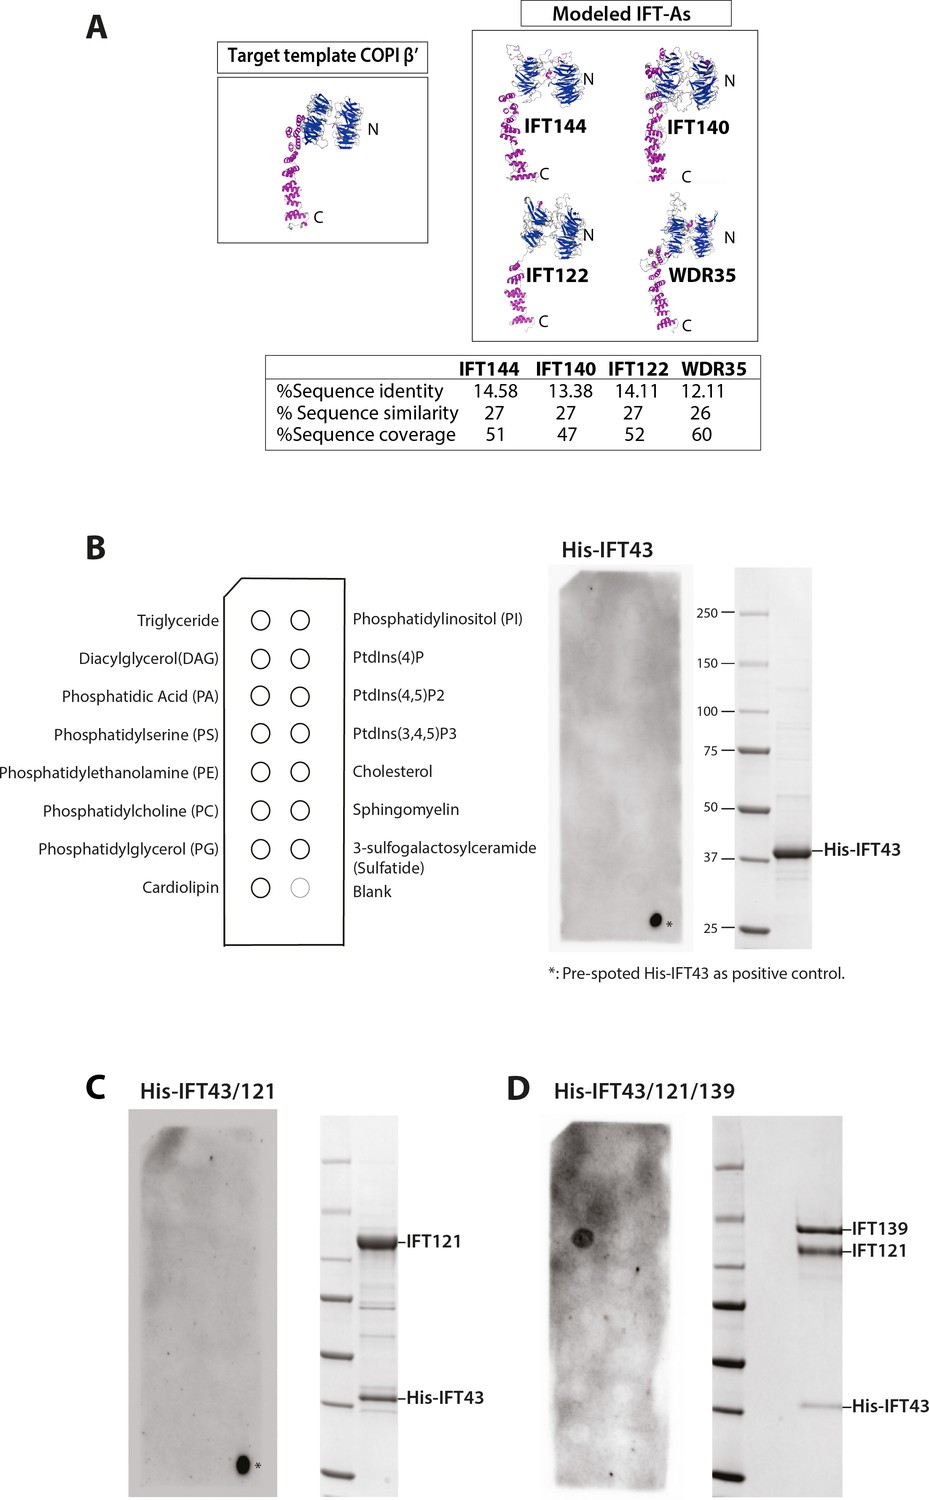
IFT-A subunits have close sequence and structural similarity to α and β′ COPI subunits and can directly bind to phosphatidic acid (PA) in vitro.
(A) Structure prediction showed IFT144, IFT140, IFT122, and WDR35 to have close structural similarity to COPI complex proteins α and β′. 2.5 Å X-ray structure of β′ (PDB:3mkq) and IFT-A proteins is shown with N-terminal WD40 repeat (blue) and C-terminal tetratricopeptide repeats (TPRs) (magenta). Sequence identity, similarity, and coverage between COPI -β′ and respective IFT-A proteins are shown in the table below. (B, C) Purified His-IFT43 or hetero-dimeric His-IFT43/121 (right-hand side) show no binding to any of the lipids spotted on the strips (left-hand side). Schematic (left panel, B) outlines distribution of different lipids as indicated. As a positive control, 1 μl of His-IFT43 was spotted directly on the dry membranes presented in panels (B) and (C) before blocking in 3% BSA solution. (D) IFT-A trimer (His-IFT43/121/139) display binding to PA demonstrating the requirement of IFT139 for lipid binding. IFT139 on its own is unstable in vitro.
-
Figure 5—figure supplement 1—source data 1
Full immunoblots labelled and unlabelled for Figure 5—figure supplement 1B-D.
- https://cdn.elifesciences.org/articles/69786/elife-69786-fig5-figsupp1-data1-v3.zip
Figure 6 with 10 supplements
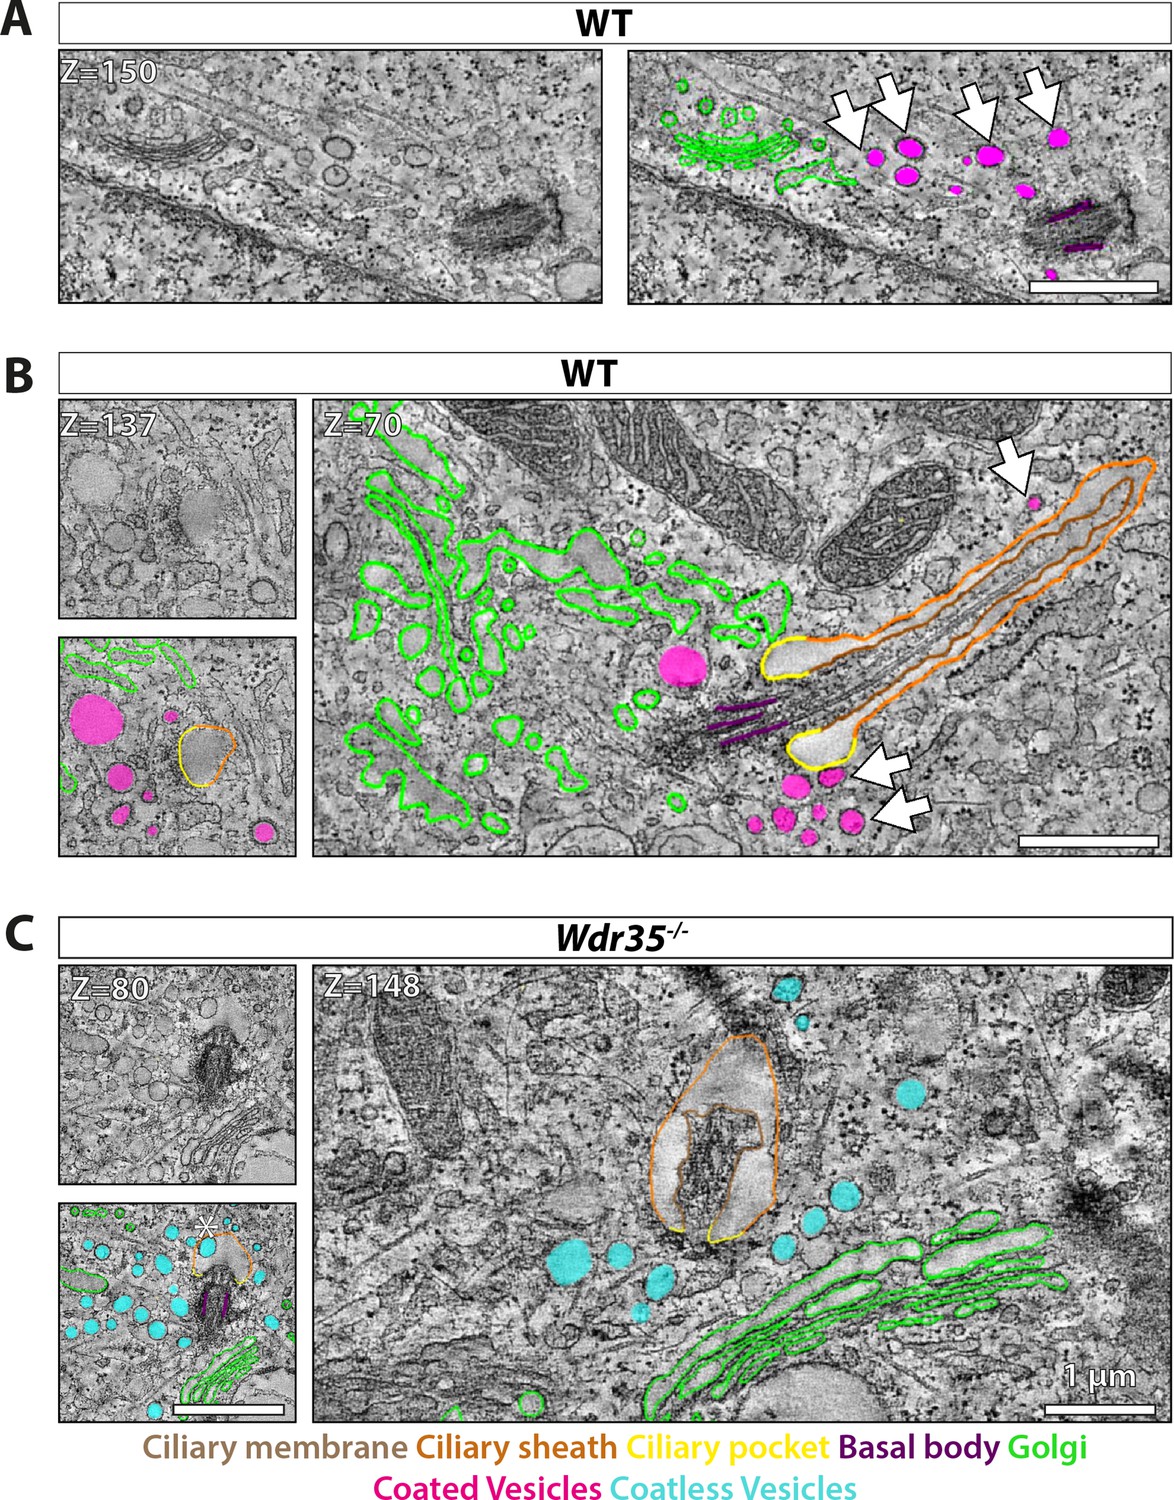
Electron-dense vesicles are observed tracking between the Golgi and cilia base in wild type (WT) fibroblasts, whereas ‘coat-less’ vesicles accumulate around Wdr35 mutant cilia.
The tilt series of transmission electron microscopy (TEM) samples were made from 24 hr serum-starved mouse embryonic fibroblasts (MEFs). Reconstructed tomograms are color-coded to highlight the ciliary membrane (brown), ciliary sheath (orange), ciliary pocket (yellow), basal body (purple), Golgi (green), electron-dense-coated vesicles (magenta), and vesicles lacking electron cloud (cyan). (A) Z-projections from 600 nm TEM serial tomograms of WT MEFs show a track of electron-dense vesicles between the Golgi and cilia (Figure 6—video 1). Arrows point at the path of vesicles between the Golgi and cilia. The image in the left panel is segmented in the right panel. (B) Z-projections from 300 nm tomograms from WT MEFs show electron-dense-coated vesicles close to the cilia base and along the length of the cilium (Figure 6—video 2). Arrows point at coated vesicles near the cilium. (C) Z-projections from 600 nm serial tomogram from Wdr35-/- MEFs have a massive accumulation of vesicles in a 2 µm radius of the cilia base (cyan), and these vesicles lack a visible coat, or electron-dense cloud on them (Figure 6—video 3). The length of cilia is drastically reduced, the ciliary membrane is wavy, and axoneme microtubules are broken in the mutant. (B, C) On left is the same Z-projection in the upper panel segmented in the lower panel, and on the right is another Z-projection from the same tomogram. Asterisk shows a coatless vesicle that fails to fuse with the ciliary sheath (see lower-left panel, C). Scale bars = 1 µm.
Figure 6—figure supplement 1
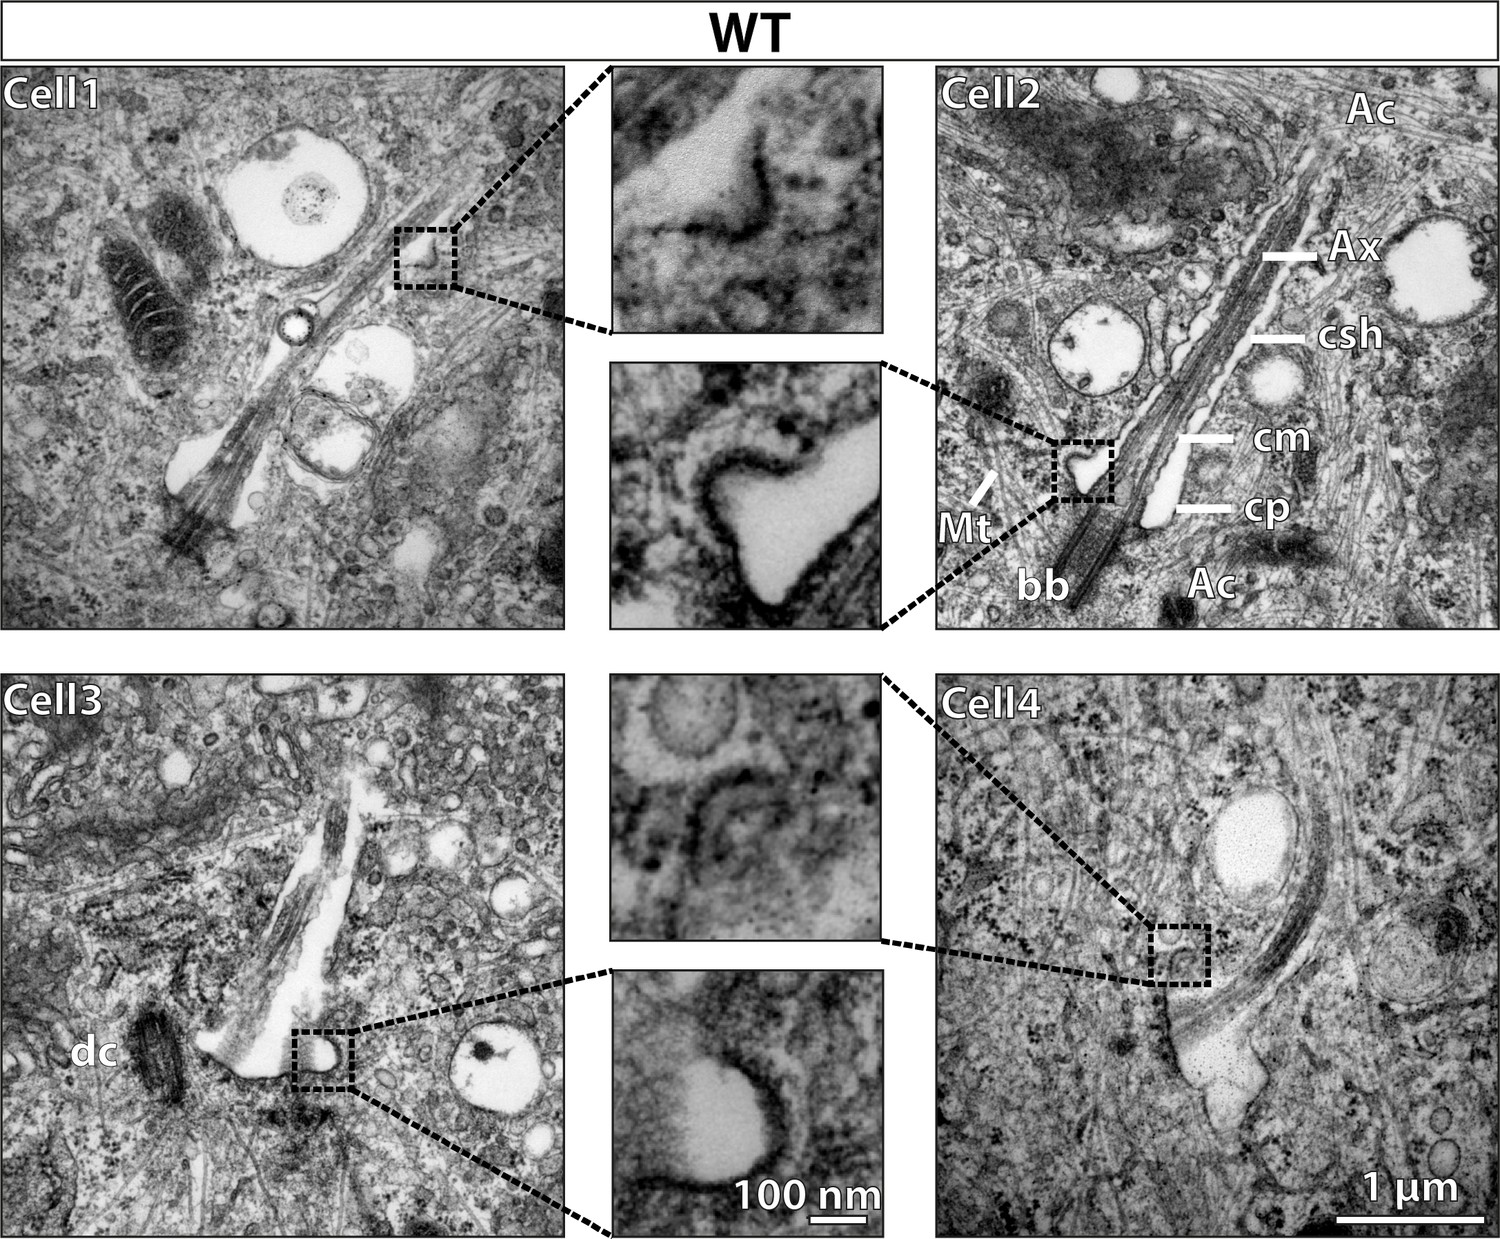
Vesicles with electron-dense coats are observed protruding/fusing with the ciliary sheath in wild type (WT) mouse embryonic fibroblasts (MEFs).
24 hr serum-starved WT MEFs are processed for transmission electron microscopy (TEM) imaging. TEM micrographs of 70 nm sections show vesicles fusing with or protruding from the ciliary sheath, mostly at the ciliary pocket and less along the length. Vesicles are enlarged in the middle panel. Other structures pointed by straight lines are actin filaments (Ac), microtubules (Mt), axoneme (Ax), ciliary sheath (csh), ciliary membrane (cm), ciliary pocket (cp), basal body (bb), and daughter centriole (dc). Scale bars = 1 µm in the side panels and 100 nm in the middle panel.
Figure 6—figure supplement 2
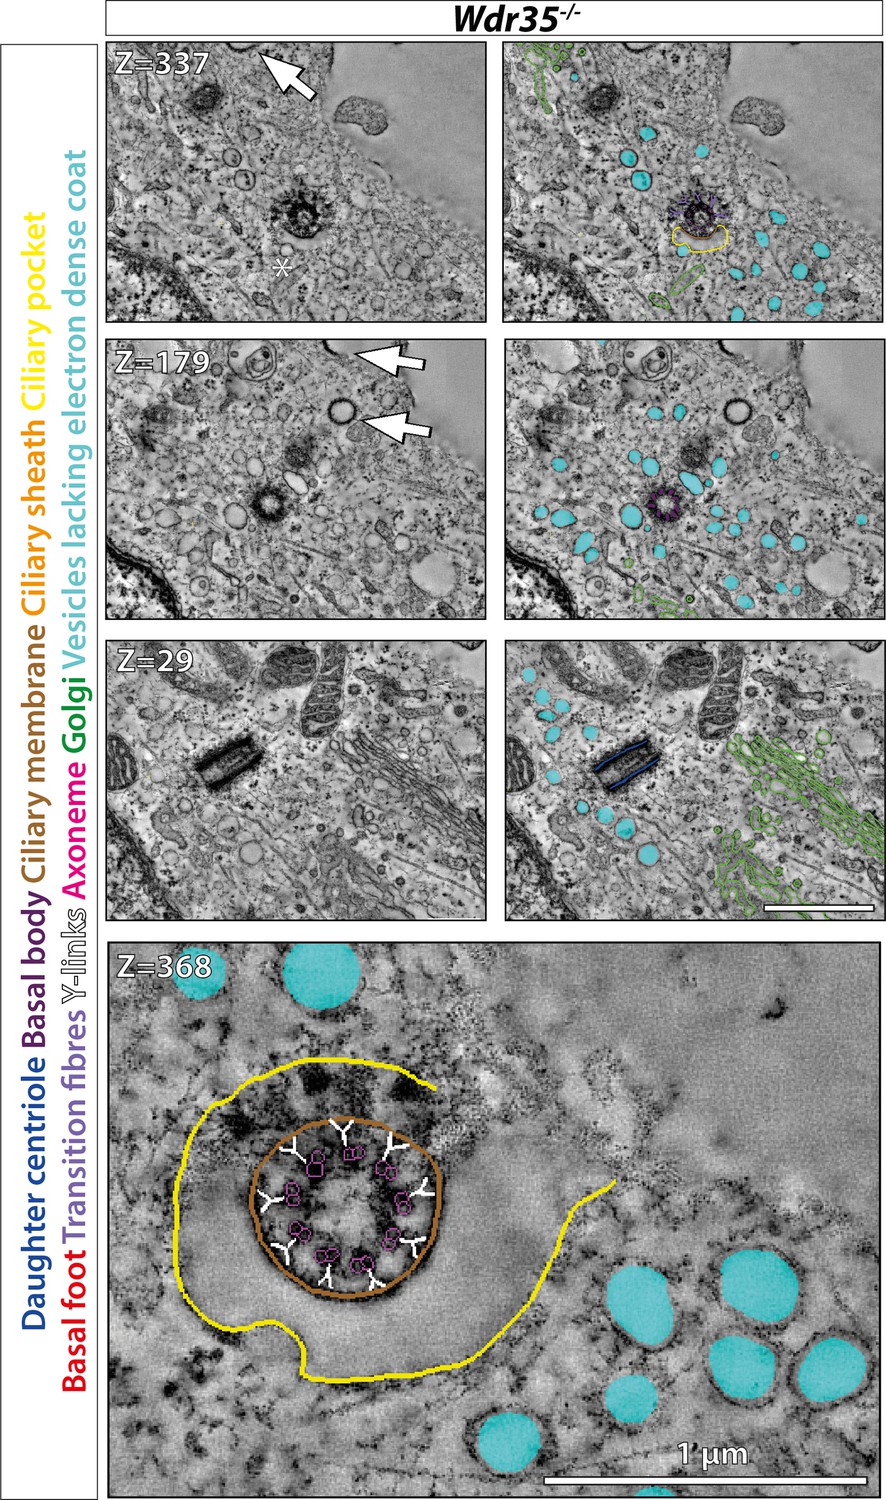
Vesicles around cilia in Wdr35-/- mouse embryonic fibroblasts (MEFs) fail to fuse with ciliary pocket or ciliary sheath.
After 24 hr of serum starvation, the tilt series was made for 300 nm Wdr35-/- transmission electron microscopy (TEM) samples. Z-projection from 900 nm serial tomograms is color-coded, highlighting the daughter centriole (dark blue), basal body (purple), ciliary membrane (brown), ciliary sheath (orange), ciliary pocket (yellow), basal foot (red), transition fibers (periwinkle), Y-links (white), axonemal microtubules (magenta), Golgi (green), and vesicles around the cilia (cyan) (Figure 6—video 4). Images in the left panel are segmented in the right panel. Coatless vesicles (cyan) accumulate around mutant cilia but fail to fuse with it. Transition zone (TZ) appeared intact in Wdr35 mutants. Enlarged TZ in the last panel shows no disturbance in (9 + 0) microtubule doublet arrangement and Y-links connecting axoneme to cilia membrane. The clathrin-coated vesicles that can be seen invaginating from the plasma membrane are shown by arrows in the upper two left panels. Asterisk shows coatless vesicle that fails to fuse with ciliary sheath. Scale bars = 1 µm.
Figure 6—figure supplement 3
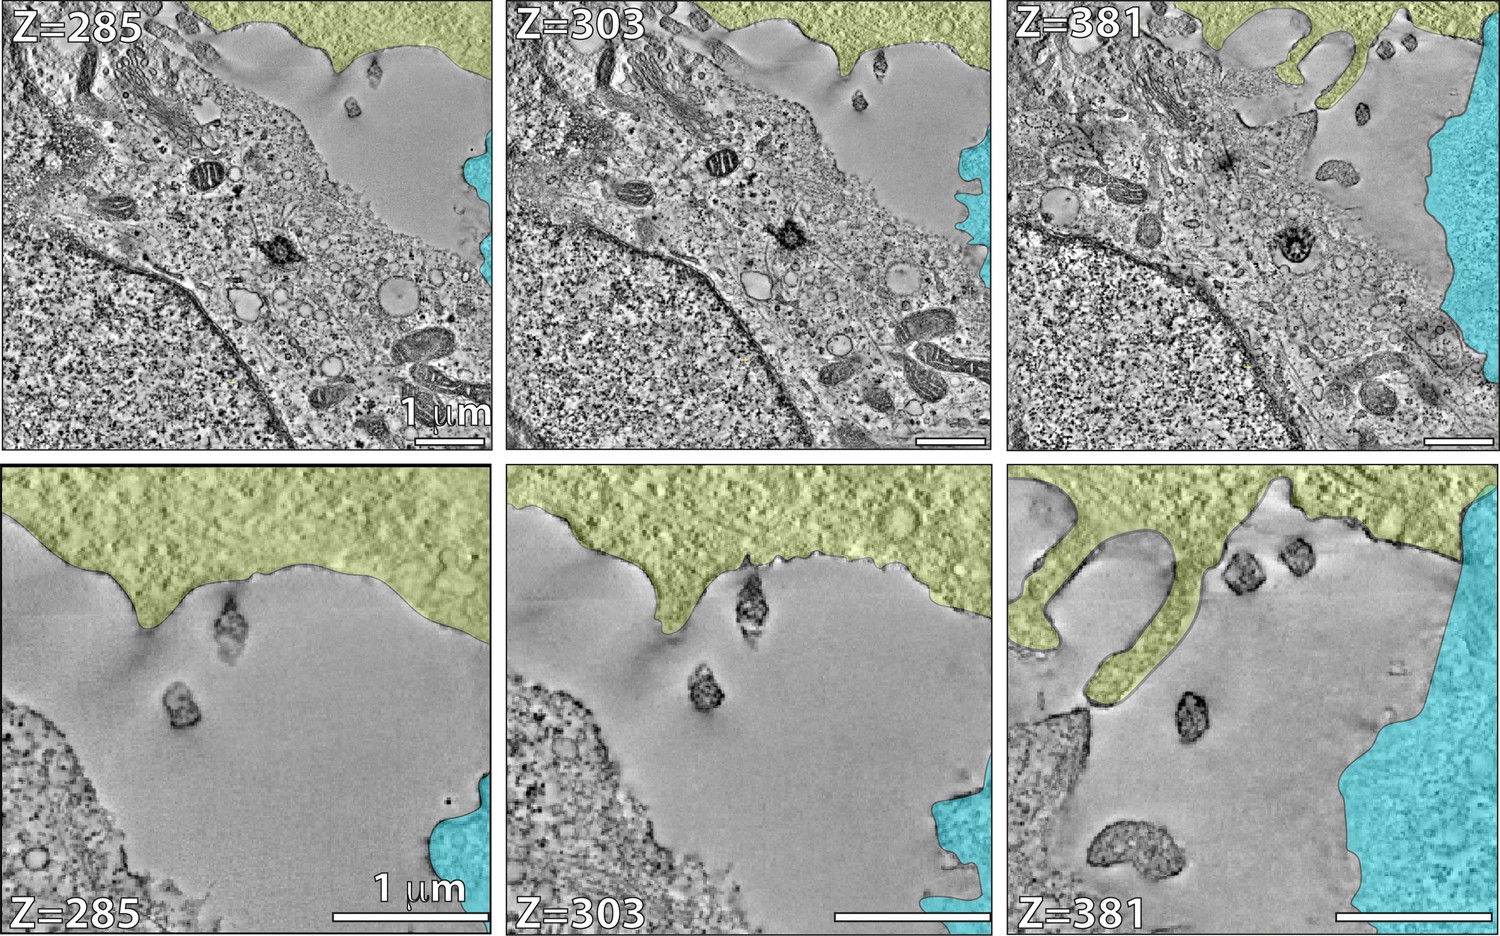
Vesicle accumulation/fusion defect around cilia in Wdr35-/- mouse embryonic fibroblasts (MEFs) is observed focally, suggesting that it is not a global membrane traffic defect.
Zoomed-out field of view (9.3 μm × 9.3 μm × 900 nm XYZ – Figure 6—video 5) centered on the ciliated cell in the Wdr35-/- transmission electron microscopy (TEM) sample shown in Figure 6—figure supplement 2, Figure 6—video 4, which also captures two adjacent Wdr35-/- MEFs (yellow and cyan). In all three cells, clathrin-like densely coated vesicles can be seen invaginating from the plasma membrane shown by arrows in Figure 6—video 5 (white arrows [central cell], black arrows [yellow cell], cyan arrows [cyan cell]). In contrast, vesicles accumulating around mutant cilia are largely coatless. Importantly, accumulation of coatless vesicles is not observed at a distance beyond 2 μm from mutant cilia or close to or budding from cell membranes, suggesting that this is not a defect in global membrane traffic. Scale bars = 1 µm.
Figure 6—figure supplement 4
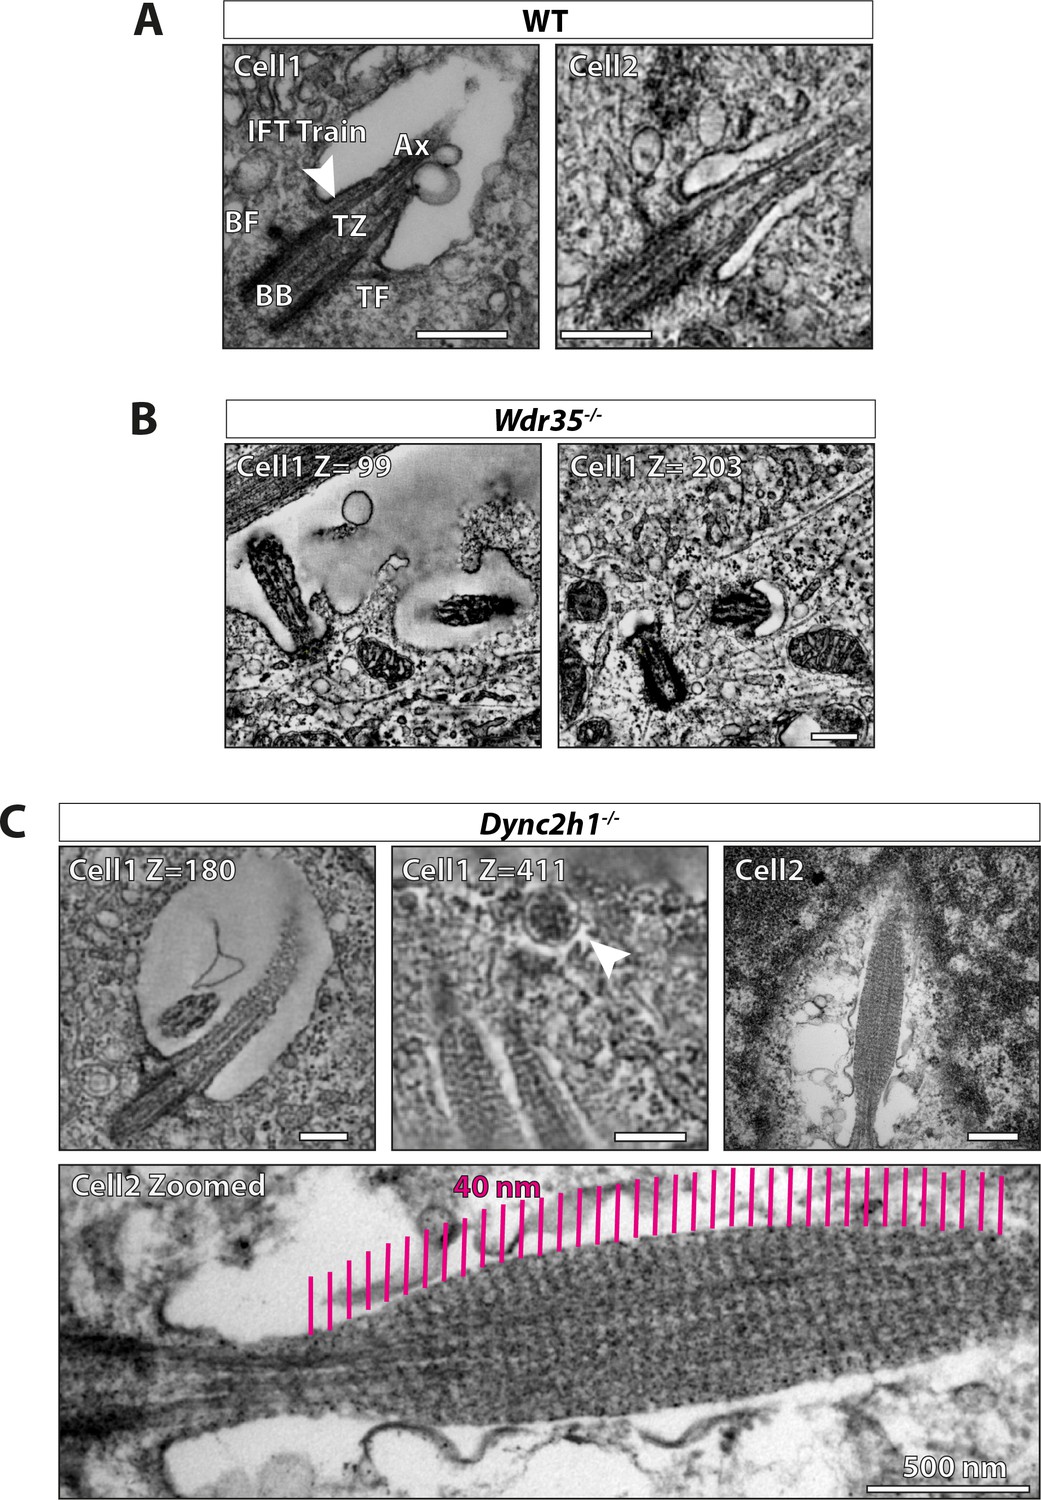
Retrograde dynein motor mutant has a different ciliary structure defect than Wdr35 mutants.
(A) 70 nm (cell 1) transmission electron microscopy (TEM) micrograph and a Z-projection from a tomogram of 300 nm wild type (WT) mouse embryonic fibroblast (MEF) showing cilia ultrastructure; basal body (BB), transition zone (TZ), axoneme (Ax), transition fibers (TF), and basal foot (BF). The arrowhead points at the IFT train entering cilia at the ciliary pocket stacked between the axoneme and the ciliary membrane. (B) Z-projection from a serial tomogram reconstructed from 600-nm-thick section of Wdr35-/- MEFs, the ciliary membrane is less well-defined, microtubules in the axoneme are disrupted, and periciliary vesicles accumulate around cilia. (C) Z-projection from a serial tomogram of a 900-nm-thick section (cell 1 – Figure 6—video 6) and TEM micrograph of 70 nm section (cell 2) of Dync2h1-/- MEFs has a striped pattern with a periodicity of 40 nm apparent throughout the length of the cilium. Cell 2 is enlarged to show the same striped pattern (magenta lines). The arrowhead points at the exosome budding from the tip of Dync2h1-/- cilium in cell 1 (Figure 6—video 6). Scale bars = 250 nm, except the bottom panel, which is 500 nm.
Figure 6—video 1
Track of electron-dense vesicles is present between Golgi and cilia in control mouse fibroblast.
24 hr serum-starved cells are prepared for electron microscopy (EM) analysis by plastic embedding and making 300-nm-thick sections. Tomogram reconstructed from two 300 nm sections stitched together shows the presence of electron-dense vesicles between the Golgi and cilia. The 3D volume shown in the upper half is segmented in the lower half of the video. Daughter centriole (blue), basal body (purple), ciliary membrane (brown), ciliary sheath (orange), ciliary pocket (yellow), Golgi (green), and vesicles with dense electron clouds are shown in magenta. Arrows are pointing at the track of vesicles between the Golgi and cilia. (Related to Figure 6A.)
Figure 6—video 2
Electron-dense vesicles are observed around the base of cilia in control mouse fibroblasts.
24 hr serum-starved cells are prepared for electron microscopy (EM) analysis by plastic embedding and making 300-nm-thick sections. Tomogram reconstructed from the 300-nm-thick cell section shows electron-dense vesicles clustering at the base of cilia. The 3D volume shown in the upper half is segmented in the lower half of the video. The basal body (purple), ciliary membrane (brown), ciliary sheath (orange), ciliary pocket (yellow), Golgi (green), and vesicles with dense electron clouds are shown in magenta. (Related to Figure 6B.)
Figure 6—video 3
In Wdr35-/- fibroblasts, an accumulation of small coatless vesicles is present around short cilia.
24 hr serum-starved cells are prepared for electron microscopy (EM) analysis by plastic embedding and making 300-nm-thick sections. Tomogram reconstructed from tilt series of two 300-nm-thick cell sections and stitched together shows 10 times more vesicles randomly clustering around cilia in the mutant. The 3D volume shown in the upper half is segmented in the lower half of the video. The basal body (purple), ciliary membrane (brown), ciliary sheath (orange), ciliary pocket (yellow), Golgi (green), and coatless vesicles around the cilia are shown in cyan. The ciliary membrane is slack compared to wild type (WT) mouse embryonic fibroblasts (MEFs) and axonemal microtubules are poorly polymerized. (Related to Figure 6C.)
Figure 6—video 4
In Wdr35-/- fibroblasts, periciliary vesicles fail to fuse with ciliary pocket or ciliary sheath.
24 hr serum-starved cells are prepared for electron microscopy (EM) analysis by plastic embedding and making 300-nm-thick sections. Tomogram reconstructed from tilt series of three 300-nm-thick cell sections and stitched together shows the transition zone is unaltered in the mutant. Vesicles lacking any electron-dense cloud cluster around mutant cilia, but fail to fuse with ciliary sheath or ciliary pocket. The 3D volume shown in the upper half is segmented in the lower half of the video. Daughter centriole (dark blue), basal body (purple), ciliary membrane (brown), ciliary sheath (orange), ciliary pocket (yellow), basal foot/subdistal appendage (red), transition fibers/distal appendage (orchid), Y-links (white), Golgi (green), and vesicles lacking any electron-dense cloud present around cilia (cyan). Arrows are pointing at the clathrin-coated vesicles budding from the cell plasma membrane. (Related to Figure 6—figure supplement 2.)
Figure 6—video 5
In Wdr35-/- fibroblasts, preciliary vesicles fail to fuse with ciliary pocket or ciliary sheath.
Zoomed-out view of tomograms from field of view in Figure 6—video 4 of 24 hr serum-starved cells prepared for electron microscopy (EM) analysis by plastic embedding and making 300-nm-thick sections, without segmentation. (Related to Figure 6—figure supplement 3.). Zoomed-out view shows two more mutant neighboring cells with clathrin-coated vesicles endocytosing from the cell membrane pointed by arrows. Three such vesicles are present in central cell pointed by white arrow, four in the cell at the top pointed by black arrows, and one in the cell at the right pointed by cyan arrow. This shows that other types of vesicles away from cilia retain their coats. Wdr35 mutant cilia have coatless vesicles accumulated close to the rudimentary cilia and not elsewhere in the cell, showing the defect is not in the global membrane protein transport from the cell membrane.
Figure 6—video 6
Dync2h1-/- cilia lack both coated as well as coatless vesicles at the cilia base, whilst ectosomes are seen budding from the tip.
24 hr serum-starved Dync2h1-/- mouse embryonic fibroblasts (MEFs) are prepared for electron microscopy (EM) analysis by plastic embedding and making 300-nm-thick sections. Tomogram reconstructed from the tilt series of three 300 nm sections and stitched together shows a sturdy ciliary membrane, well-polymerized microtubules in the axoneme, almost no coated or coatless vesicles at the cilia base, and ectosome vesicles could be seen budding from the tip of cilia. A 40 nm striped pattern could be seen present throughout the length of cilia. Arrows point at the basal body (purple), cilia (magenta), and ectosome (green). This is also an example of the rare event of having two cilia in the same ciliary sheath. (Related to Figure 6—figure supplement 4C – cell 1).
Figure 7 with 1 supplement
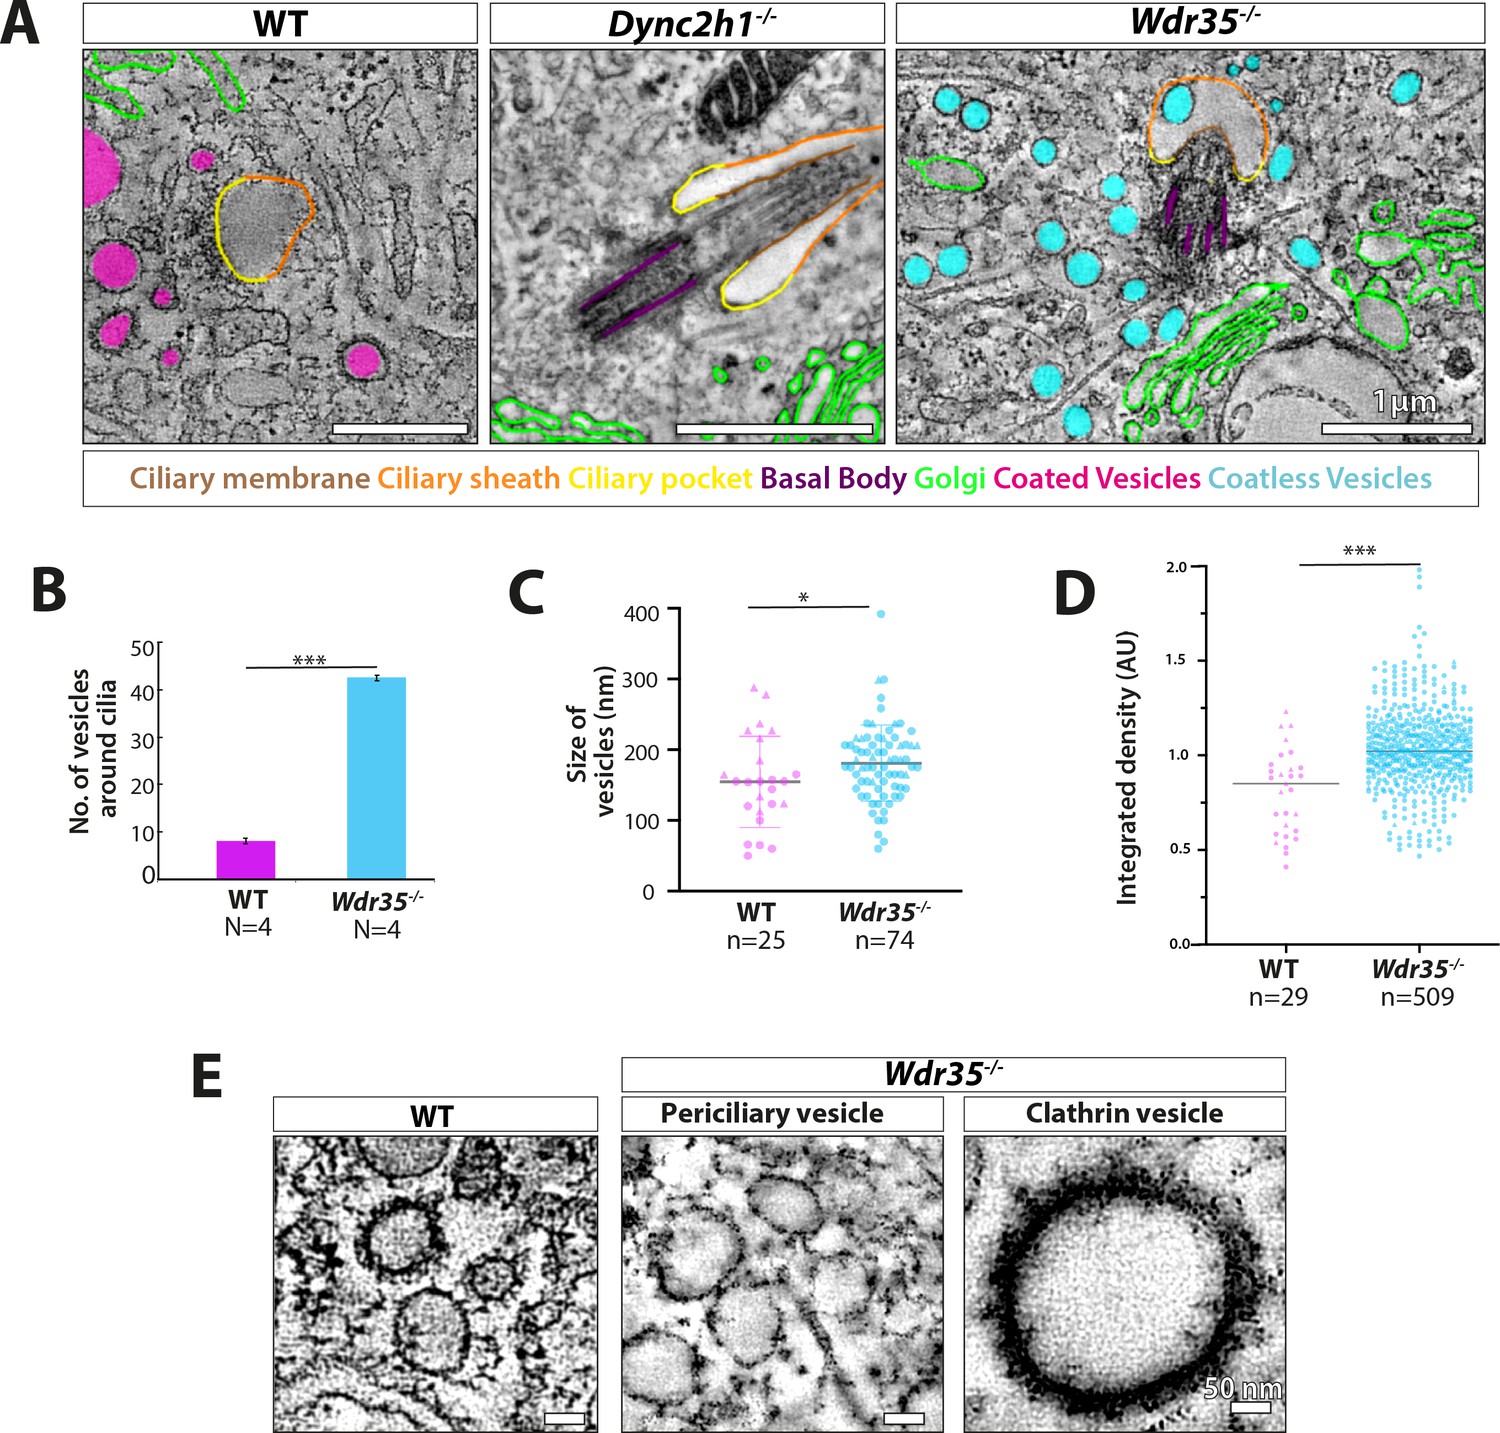
Vesicles clustering around Wdr35-/- cilia lack electron-dense decorations although electron-dense clathrin-coated vesicles are still observed budding from the mutant plasma membrane.
(A) Zoomed-in views of periciliary vesicles observed in wild type (WT) (zoomed – B, , Figure 6—video 2), Wdr35-/- (zoomed – C, , Figure 6—video 4), Dync2h1-/- mouse embryonic fibroblasts (MEFs) 24 hr post-serum starvation show vesicles around WT cilia are coated (magenta) and around Wdr35-/- are coatless (blue). Very rare vesicles are observed surrounding Dync2h1-/- mutant cilia. (B) The average number of vesicles around cilia in control and Wdr35-/- cells, counted in a volume of 2 µm radius around cilia in transmission electron microscopy (TEM) tomograms, shows 10 times more vesicles in Wdr35-/- cells. N = number of whole-cell volume tomograms per genotype. (C) The diameter of the periciliary vesicles shows a small but significant increase in size between control and Wdr35-/-. n = number of vesicles. The paucity of vesicles around Dync2h1-/- cilia prohibited quantification. (D) 2D quantification of electron density around vesicles shows signal for control vesicles is lower (darker) than mutant median (lighter) as determined by 20 nm ring outside all annotated objects. (E) Zoomed-in images to highlight the difference in the electron-dense cloud surrounding periciliary vesicles in WT (Figure 6—video 2), which are largely missing in Wdr35-/- (Figure 6—video 4, Figure 6—video 5) MEFs. Clathrin vesicles from the same mutant (Figure 6—video 4) maintain their coat, confirming missing electron density on Wdr35-/- periciliary vesicles is not a fixation artifact. Scale bars, (A) = 1 µm and (E) = 50 nm. N = number of cells examined. n = number of vesicles scored. Asterisk denotes significant p-value from t-test: *p<0.05, **p<0.001, ***p<0.0001.
Figure 7—figure supplement 1
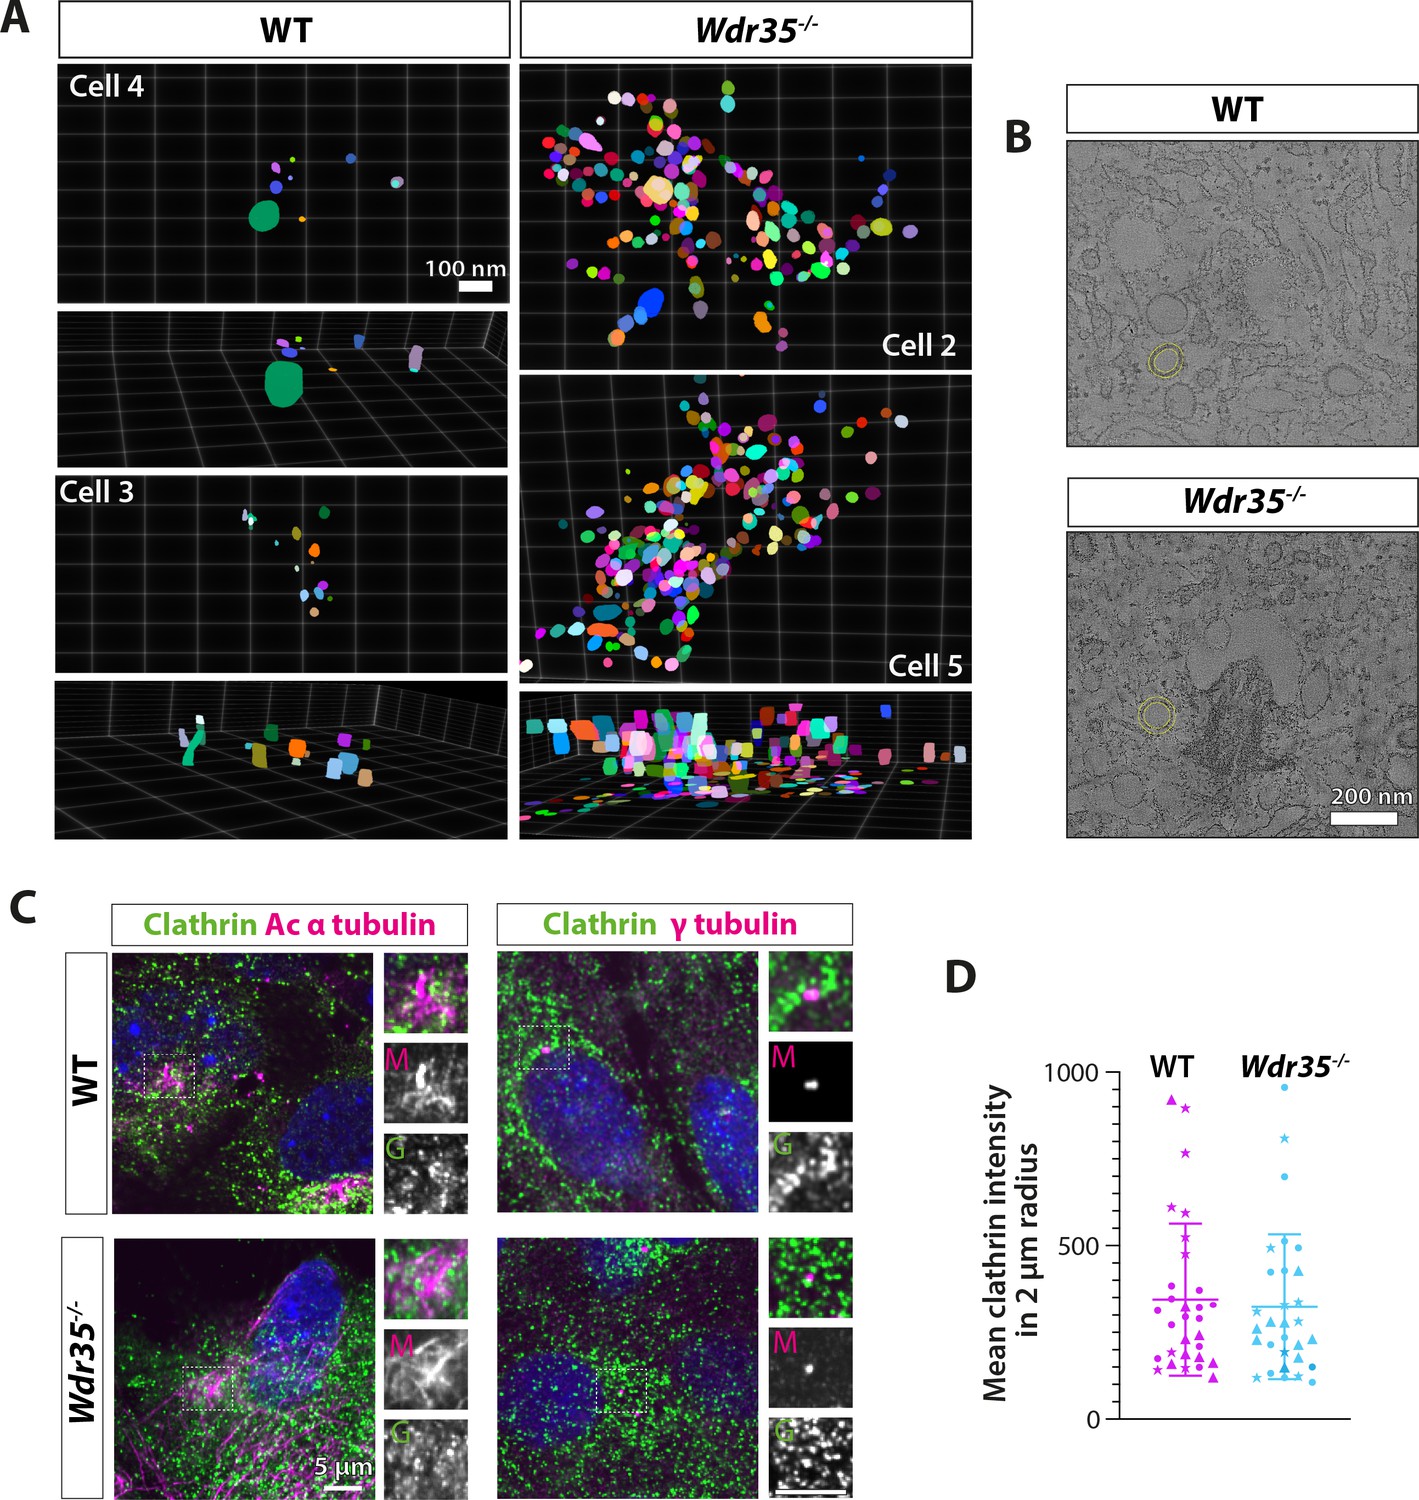
Increased periciliary vesicles in Wdr35 mutant cells are unlikely to be clathrin-based as number and distribution of clathrin-positive foci remain unchanged.
(A) 3D projections of segmented vesicles from tomograms (top and side views) highlight the accumulation of vesicles in mutants. (B) Examples of automated 20 nm band around segmented objects for quantification in Figure 7D. (C) 24 hr serum-starved cells stained for clathrin antibody (green) and acetylated α-tubulin (left panel) and γ-tubulin (right panel) antibodies (magenta) do not show any difference in the distribution of clathrin around cilia. Scale bars = 5 μm. (D) No difference in the mean intensity of clathrin foci quantified in a volume of 2 µm radius around the base of cilia. n = 30 cells (three biological replicates shown by different shapes each). Asterisk denotes significant p-value from t-test: *p<0.05, **p<0.001, ***p<0.0001.
Figure 8 with 4 supplements
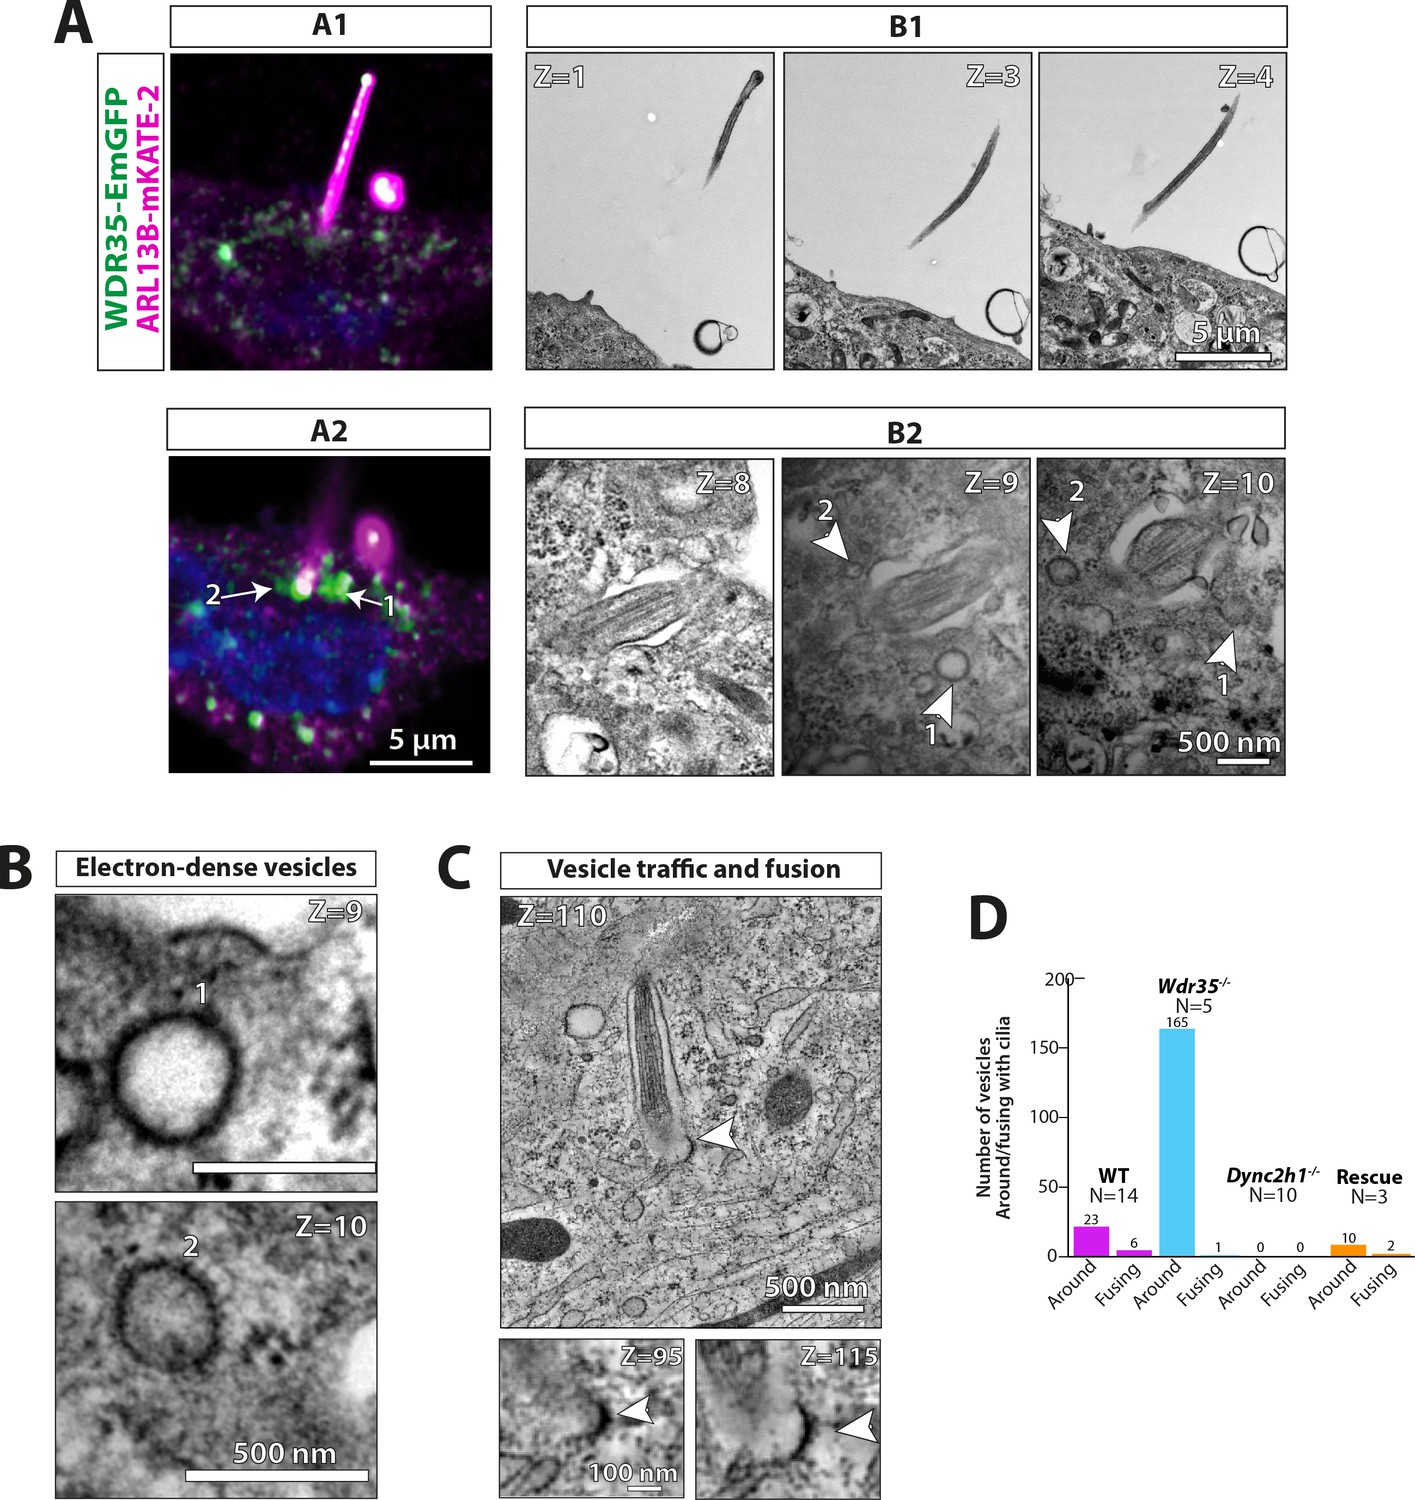
WDR35 is sufficient to rescue cilia elongation and restore traffic of coated vesicles, which are GFP-positive by correlative light and electron microscopy.
4 hr serum-starved Wdr35-/- cells rescued for ciliogenesis by expressing WDR35-EmGFP (green) and imaged first with Airyscan confocal imaging followed by transmission electron microscopy (TEM) imaging. ARL13B-mKATE (magenta) is used as a cilia marker. (A1) and (A2) represent two sequential Z-stacks from Airyscan confocal imaging. (B1) and (B2) represent TEM sequential images of 70 nm sections of the same cell. Arrows point at WDR35 localizing close to the cilia base, as shown by LM imaging, whilst arrowheads correspond to electron-dense vesicles shown in Z = 9 and Z = 10 TEM images. (B) The same two sections Z = 9 and Z = 10 enlarged in the last panel show two rescued coated vesicles close to cilia. (C) Zoomed-out Z-section from 1200-nm-thick TEM tomogram of a different cell expressing Wdr35-EmGFP showing coated vesicle fusing with ciliary pocket (arrowhead) left. Bottom: zoomed-in view of two sections showing electron density on the fusing vesicle (full series shown in Figure 8—figure supplement 1, Figure 8—video 1). (D) Quantification of fusion figures observed between genotypes. N = number of cells. See Figure 8—figure supplement 1, Figure 8—video 1. Scale bars: (A2) and (B1) are 5 µm, (B2) and (B) are 500 nm, and (C) is 500 nm (upper panel) and 100 nm (lower panel).
Figure 8—figure supplement 1
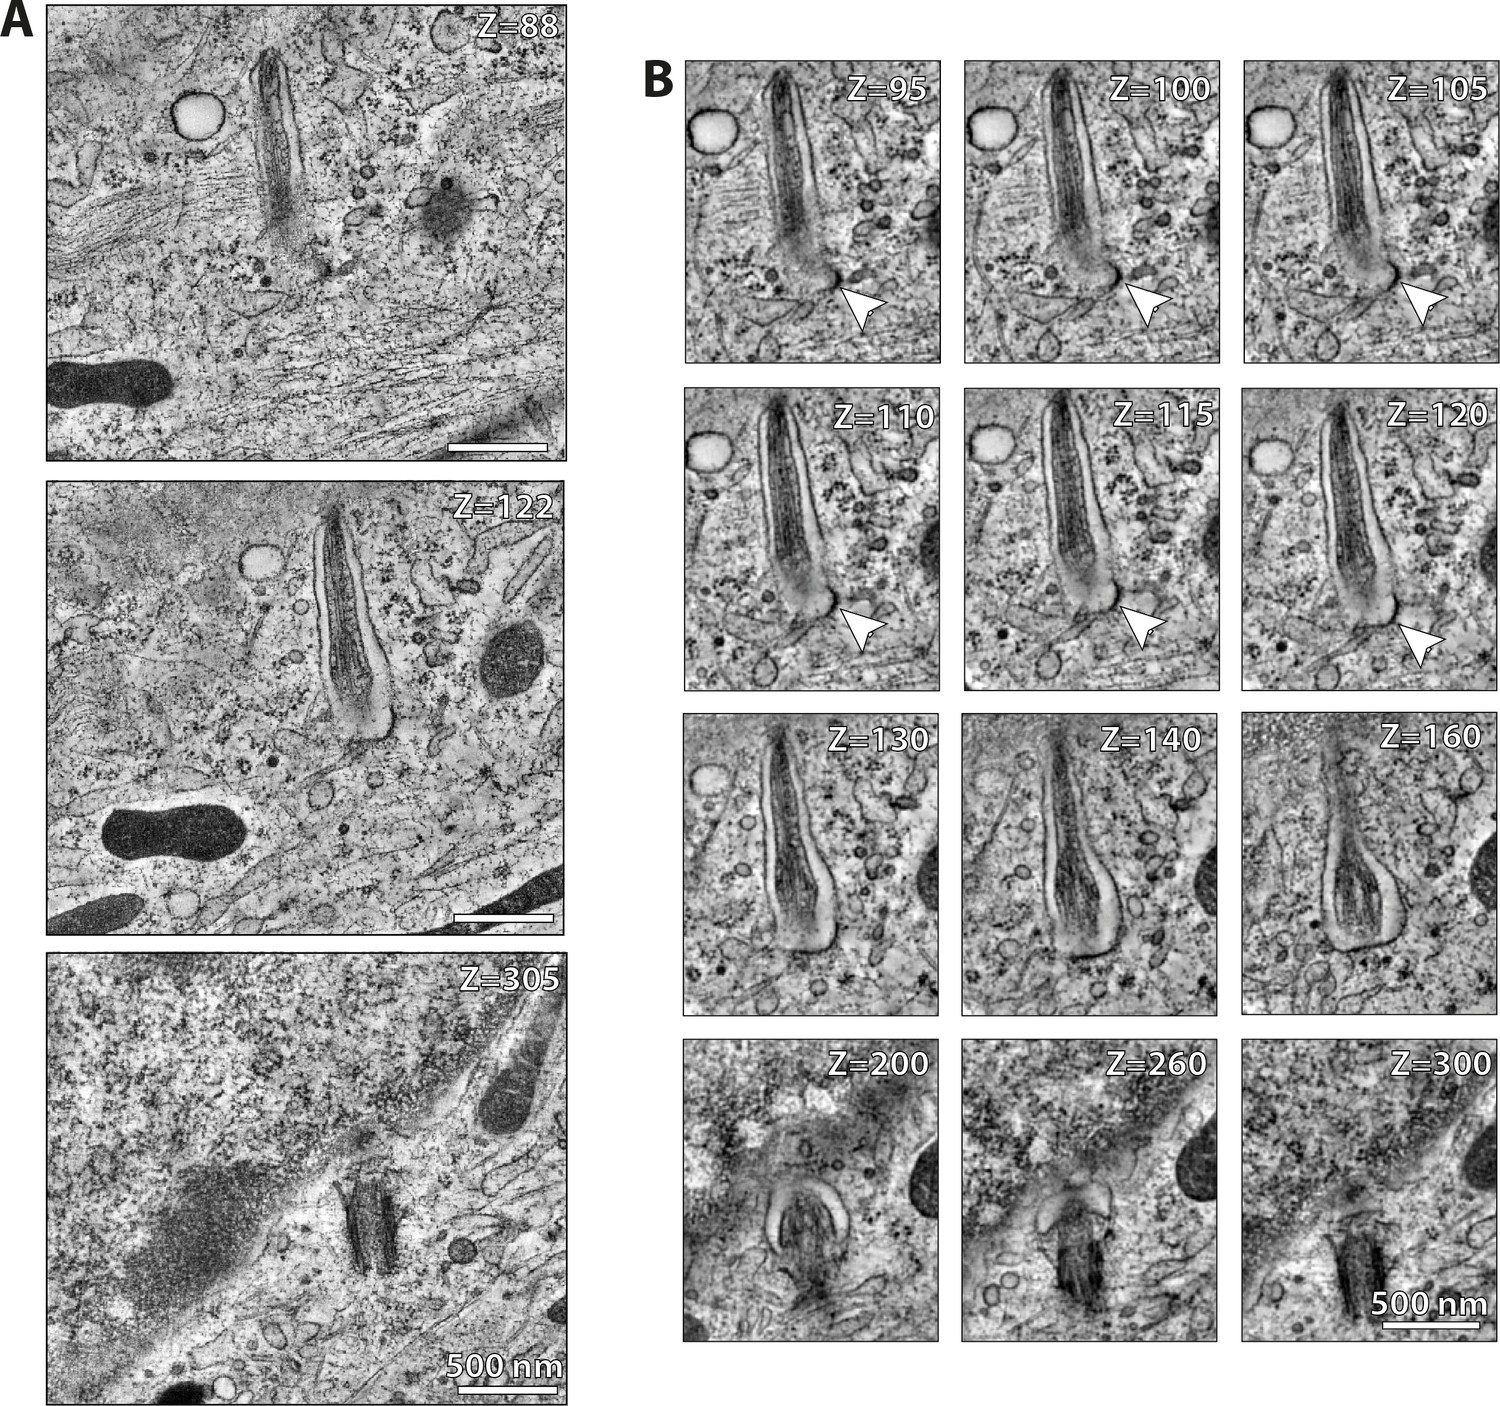
WDR35 is sufficient to rescue cilia elongation and restore coated vesicles fusion with the ciliary pocket.
(A) Zoomed-out and (B) zoomed-in select sections from 4 hr serum-starved Wdr35-/- cell rescued for ciliogenesis by expressing WDR35-EmGFP and ARL13B-mKATE, and processed for transmission electron microscopy (TEM). Arrowheads correspond to electron-dense vesicle fusing with the ciliary pocket. Sections from 1200-nm-thick TEM tomogram created from stitching together 300 nm serial sections. Restoring WDR35 to mutant cells rescues ciliogenesis and the electron density on vesicles in the periciliary region, and restores the fusion of these coated vesicles to the ciliary pocket (arrowhead). See Figure 8C, which illustrates sections, and Figure 8—video 1, showing the tomogram through the entire cilia, quantified in Figure 8D. Scale bars: (A, B) = 500 nm.
Figure 8—figure supplement 2

WDR35 localizes on vesicles around the cilia and concentrates at the ciliary pocket before entering the cilia by immunogold electron microscopy (EM) labeling.
(A, B) Wdr35-/- cells transfected with WDR35-EmGFP and ARL13B-mKate2, then serum-starved for 4 hr and processed for transmission electron microscopy (TEM). 70 nm serial sections were subsequently stained with immunogold-tagged antibodies against GFP (anti-GFP). Snapshots from 70 nm serial sections show WDR35 accumulating at the ciliary pocket (A"', B""'). Staining is also seen along the axoneme (A", B""), at the vesicles at the ciliary base (B') and what looks like fusing or in close proximity to the ciliary sheath (A', B'', B"'). WDR35 epitopes were exposed to antibodies directly on the surface of 70-nm-thick sections, which results in sparse but specific labeling of GFP. Arrows point to GFP-gold particles. Magenta outline regions of interest (ROIs) highlight putative vesicles. ImmunoEM control shown in Figure 8—figure supplement 3. Scale bars = 500 nm.
Figure 8—figure supplement 3

WDR35 localization to vesicles around the cilia and ciliary pocket by immunogold electron microscopy (EM) labeling is specific.
ImmunoEM control for Figure 8—figure supplement 2 using two controls. (A) Internal control for adjacent non-transfected control Wdr35 mutant cell from the same field of view as Figure 8—figure supplement 2B. In the absence of WDR35-EmGFP, Wd35 mutant cells have rudimentary cilia (white arrowhead), coatless vesicles around cilia (magenta outlines), and no anti-GFP immunogold labeling (black arrow). (B) Negative secondary-only control. WDR35-EmGFP transfected mutant cells were grown under identical conditions and processed in parallel for immunoEM as cells in Figure 8—figure supplement 2 without addition of primary anti-GFP antibodies demonstrating lack of immunogold labeling on any ciliary structures. Scale bars are 500 nm.
Figure 8—video 1
WDR35 is sufficient to rescue cilia elongation and restore fusion of coated vesicles.
Zoomed-in and stitched sections from 1200-nm-thick transmission electron microscopy (TEM) tomogram from 300 nm serial sections. 4 hr serum-starved Wdr35-/- cell rescued for ciliogenesis by expressing WDR35-EmGFP and processed for TEM. The cells also express ARL13B-mKATE as a cilia marker to aid identification. Arrowheads correspond to electron-dense vesicle fusing with the ciliary pocket. Restoring WDR35 to mutant cells rescues vesicle fusion, electron density on some vesicles in the periciliary region, and rescues ciliogenesis. See Figure 8C and Figure 8—figure supplement 1, which illustrate these features, quantified in Figure 8D. Scale bars: 500 nm.
Figure 9
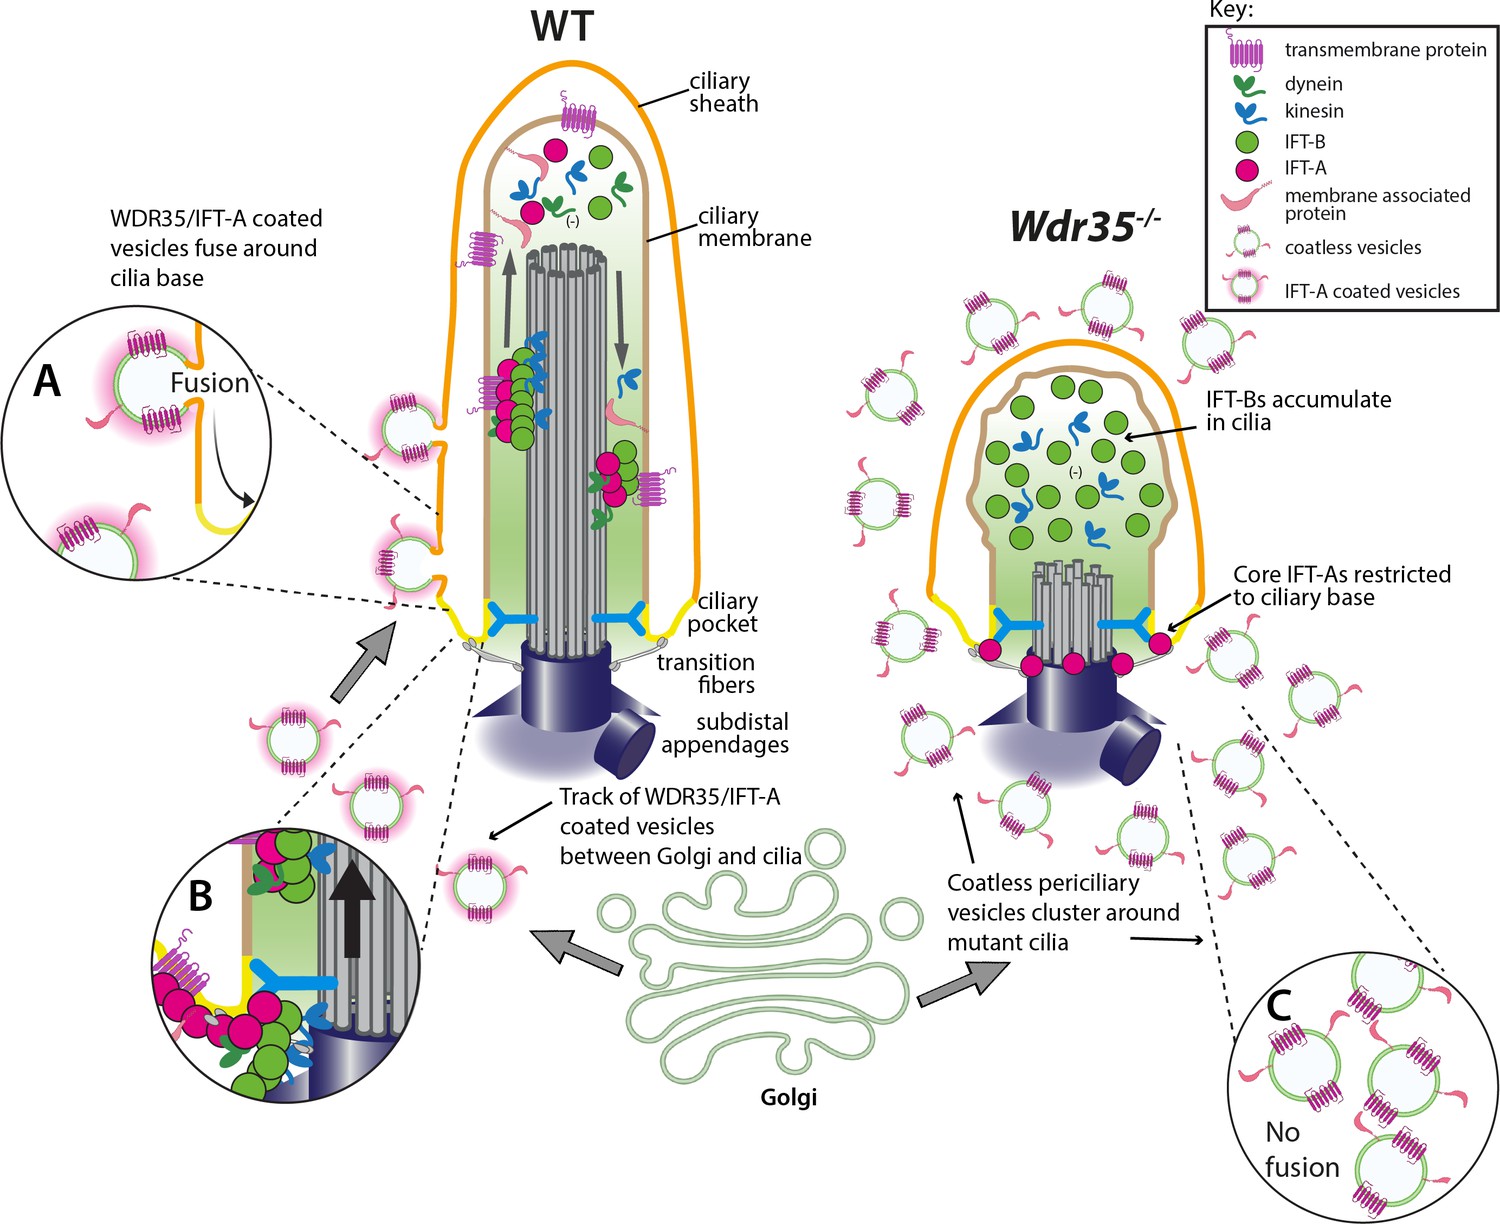
WDR35 and likely other IFT-As assist cargo transport of vesicles between the Golgi into cilia at the stage of cilia elongation.
Diagrammatic representation of the transmission electron microscopy (TEM) data showing vesicles (green) with the WDR35-dependent coat (magenta halo) fusing and localizing around cilia in wild type (WT) cells (inset A) and coatless vesicles clustering around cilia in Wdr35-/- mouse embryonic fibroblasts (MEFs) (inset C). Vesicles follow a track between the Golgi and ciliary base in the WT cells but accumulate without fusing around cilia in Wdr35-/- cells. Upon fusion, any remnant IFT-A-dependent coat would become a linear ‘train,’ which could assemble with cytosolic motors and IFT-B particles for ciliary import across the transition zone (inset B). Without non-core IFT-As, IFT-A core components are restricted at the base of Wdr35-/- cilia whilst IFT-B proteins accumulate in short mutant cilia, without any enrichment of ciliary membrane proteins indicating an arrest at the later stages of ciliogenesis during cilia elongation.
Tables
Table 1
List of primary antibodies.
| Antibody | Species | Source | Dilution | Fixation |
|---|---|---|---|---|
| ARL3 | Rabbit | Proteintech 10961-1-AP | 1:100 IF | PFA |
| ARL13B | Rabbit | Proteintech 17711-1-AP | 1:100 IF | PFA |
| Ac α-tubulin | Mouse | Sigma T6793 | 1:1000 IF | PFA/GA |
| Ac α-tubulin | Rabbit | Abcam ab179484 | 1:1000 IF | PFA/GA |
| γ-Tubulin | Mouse | Sigma T6557 | 1:100 IF | PFA |
| γ-Tubulin | Rabbit | Abcam ab11317 | 1:100 IF | PFA |
| GFP | Mouse | Roche 11814460001 | 1:1000 IF1:1000 WB | PFA |
| GFP | Rabbit | Abcam ab6556 | 1:1000 IF1:1000 WB1:20 ImEM | PFA |
| GFP | Rabbit | Santa Cruz sc-8334Stock 0.2 µg/µl | 1:5000 WB3 µg IP | - |
| His-tag | Mouse | GenScript A00186 | 1:2500 WB | - |
| IFT43 | Rabbit | From Victor L. Ruiz-Perez, University of Madrid, Spain | 1:200 IF1:2000 WB | PFA |
| IFT81 | Rabbit | Proteintech 11744-1-AP | 1:200 IF1:1000 WB | PFA |
| IFT88 | Rabbit | Proteintech 13967-1AP Stock 0.23 µg/µl | 1:200 IF1:1000 WB3 µg IP | PFA |
| IFT121 | Rabbit | Custom made from Proteintech | 1:50 WBNot for IF | - |
| IFT122 | Rabbit | Proteintech 19304-1-AP | 1:200 IF1:1000 WB | PFA |
| IFT122 | Rabbit | Aviva ARP 53817_P050 | Not for IF 1:1000 WB | - |
| IFT139 | Rabbit | Novus-NBP1-90416 | 1:1000 WB1:200 IF | PFA |
| IFT140 | Rabbit | Proteintech 17460-1-AP | 1:200 IF1:1000 WB3 µg IP | PFA |
| IFT144 | Rabbit | Proteintech 13647-1-AP | 1:200 IF1:1000 WB | PFA |
| MKS1 | Rabbit | Proteintech 16206-1-AP | 1:100 IF | MeOH |
| NPHP1 | Mouse | 640 from Greg Pazour, University of Massachusetts | 1:100 IF | MeOH |
| PCM1 | Rabbit | Proteintech 19856-1-AP | 1:100 IF | MeOH |
| Rootletin | Goat | Santa Cruz sc-67828 | 1:100 | MeOH |
| SNAP | Rabbit | New England Biolabs P9310S | 1:300 IF | MeOH |
| α tubulin | Rabbit | Abcam ab4074 | 1:5000WB | |
| Other reagents | ||||
| SiR-tubulin | - | Spirochrome (SC002) | 200 nM | Live-cell imaging |
| SNAP-TMR | - | New England Biolabs SNAP-Cell TMR-STAR (S9105S) | 1 µM | Live-cell imaging |
-
PFA, paraformaldehyde; GA, glutaraldehyde; ImEM, immuno electron microscopy; IF, immunofluorescence; WB, western blot; IP, immunoprecipitation; MeOH, methanol.
Table 2
List of secondary antibodies.
| Antibody | Host | Source | Dilution | Application |
|---|---|---|---|---|
| ECL α-mouse IgG, HRP-conjugated | Sheep | GE Healthcare NA931-1ML | 1:10,000 | WB |
| ECL α-mouse IgG, HRP-conjugated | Rabbit | Dako P0260 | 1:1000 | SO |
| ECL α-rabbit IgG, HRP-conjugated | Goat | GE Healthcare RPN4301 | 1:10,000 | WB |
| α-rabbit light-chain-specific HRP-conjugated | Mouse | Millipore MAB201P | 1:10,000 | WB |
| α-rabbit IgG light-chain-specific mAb | Mouse | Cell Signaling Technology L57A3 | 1:10,000 | WB |
| Alexa 488, 594, 647 conjugated-α-mouse | Donkey | Molecular Probes | 1:500 | IF |
| Alexa 488, 594, 647 conjugated-α-rabbit | Donkey | Molecular Probes | 1:500 | IF |
| Alexa 488, 594, 647 conjugated-α-goat10 nm gold conjugated-α-rabbit (batch 008721) | DonkeyGoat | Molecular ProbesBBI SolutionsEM GAR10/0.25 | 1:5001:30 | IFImEM |
-
WB, western blot; IF, immunofluorescence; ImEM, immuno electron microscopy.
Table 3
List of plasmids.
| Plasmid | Source |
|---|---|
| Arl13b-mKate2 | Diggle et al., 2014 |
| ARL13B-EGFP | Hori et al., 2008 |
| pEGFP-N1 | Clontech 6085-1 |
| Ift122-EGFP | Qin et al., 2011 |
| PalmPalm-EGFP | Williams et al., 2014 |
| MyrPalm-EGFP | Williams et al., 2014 |
| pEGFP-mSmo | Chen et al., 2002 |
| Wdr35-EmGFP | Mill et al., 2011 |
Additional files
Download links
A two-part list of links to download the article, or parts of the article, in various formats.
Downloads (link to download the article as PDF)
Open citations (links to open the citations from this article in various online reference manager services)
Cite this article (links to download the citations from this article in formats compatible with various reference manager tools)
A WDR35-dependent coat protein complex transports ciliary membrane cargo vesicles to cilia
eLife 10:e69786.
https://doi.org/10.7554/eLife.69786


