MicroRNA 3′-compensatory pairing occurs through two binding modes, with affinity shaped by nucleotide identity and position
- Howard Hughes Medical Institute, United States
- Whitehead Institute for Biomedical Research, United States
- Department of Biology, Massachusetts Institute of Technology, United States
Figures
Figure 1
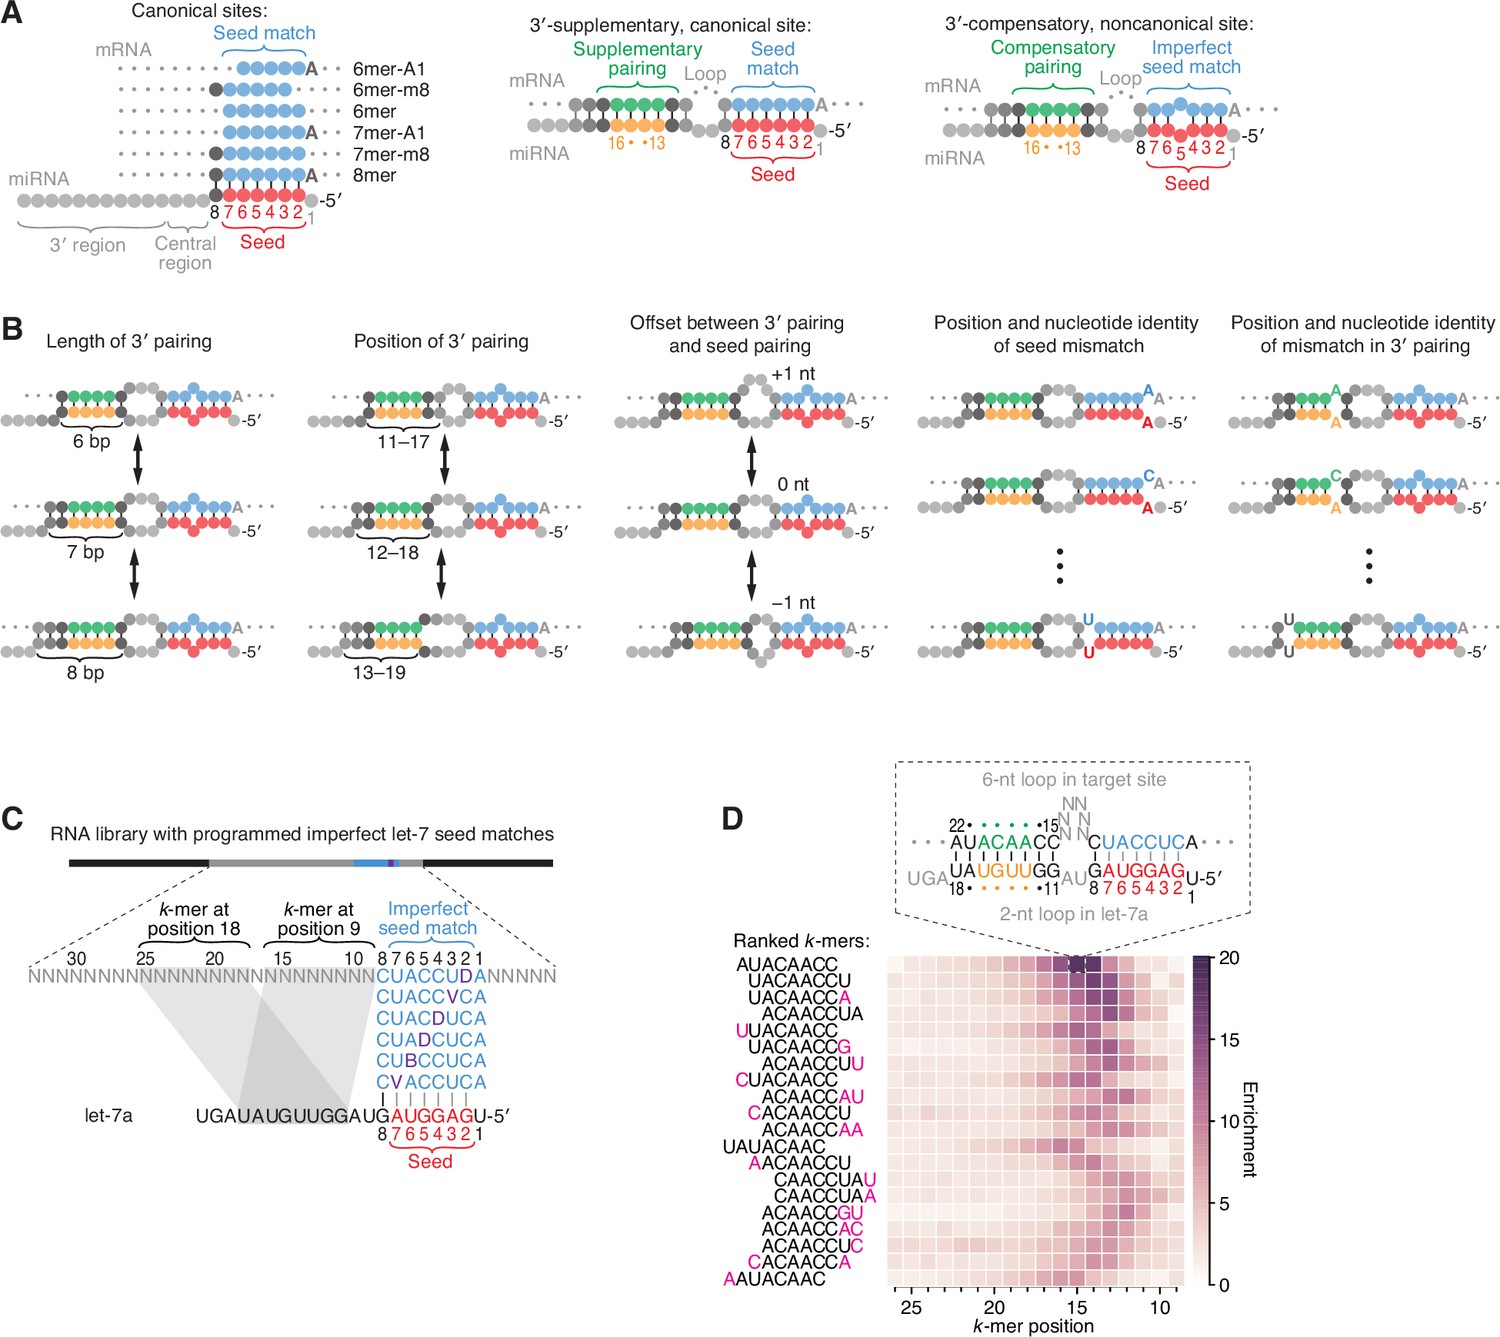
Features of miRNA 3′-compensatory sites characterized using AGO-RBNS.
(A) Pairing of typical canonical sites (left), 3′-supplementary, canonical sites (middle), and 3′-compensatory, noncanonical sites (right). Canonical sites contain contiguous complementarity (blue) to the seed (red). Sites with shifted complementarity (i.e., the 6mer-A1 and 6mer-m8 sites) are sometimes also classified as canonical sites. 3′-supplementary sites have pairing to the miRNA 3′ region, which supplements canonical seed pairing and is reported to be most effective if it centers on miRNA nucleotides 13–16 (green and orange). This 3′ pairing can supplement 8mer sites (as shown) as well as other canonical sites (not shown). 3′-compensatory sites resemble 3′-supplementary sites, except they lack perfect pairing to the seed and thus pairing to the 3′ region helps to compensate for this imperfect seed pairing. Vertical lines represent Watson–Crick pairing. (B) The architectures of 3′ sites. Three independent features define each architecture: (1) the length of 3′ pairing (left), measured as the number of contiguous base pairs to the miRNA 3′ region; (2) the position of 3′ pairing (middle-left), defined as the 5′-most miRNA nucleotide engaged in 3′ pairing; and (3) the offset between the seed pairing and 3′ pairing (middle), which specifies the number of unpaired nucleotides separating the seed- and 3′-paired segments in the target RNA relative to that in the miRNA. Mismatches to the seed pairing (middle-right) or within the 3′ pairing (right) can elaborate on these architectures, as can bulged nucleotides (not shown). (C) A programmed RNA library for using AGO-RBNS to examine 3′ pairing of let-7a. The library contains an 8-nt region with all 18 possible single-nucleotide mismatches (purple) to the let-7a seed (red), with 25 nt of random-sequence RNA upstream of this region and 5 nt of random-sequence RNA downstream. k-mer positions are numbered with respect to the programmed 8-nt mismatched site. B represents C, G, or U; D represents A, G, or U; V represents A, C, or G; N represents A, C, G, or U. The black vertical line depicts perfect pairing at position 8, and gray vertical lines indicate Watson–Crick matches at only five of the six seed positions. (D) The top 20 8-nt k-mers identified by AGO-RBNS performed with the highest concentration of AGO2–let-7a (840 pM) and the programmed library (100 nM). k-mers were ranked by the sum of their enrichments at the five positions of the library at which they were most enriched. Left, alignment of k-mers, indicating in pink nucleotides that were not Watson–Crick matches to the miRNA. Right, heat map showing k-mer enrichment at each position of the library, with pairing shown for the top 8-nt k-mer at the position of its greatest enrichment. Black vertical lines depict perfect Watson–Crick pairing, and gray vertical lines indicate Watson–Crick matches at only five of the six seed positions.
Figure 2 with 2 supplements

Pairing to nucleotide 11 and a positive offset promote high-affinity binding to let-7a.in P.
(A) Correspondence of enrichment and relative KD value of sites with the AUACAACC k-mer (the perfect match to miRNA positions 11–18) measured at each position in the programmed library. Each of these positions (upper x-axis) corresponds to the indicated offset (lower x-axis). For example, because this k-mer paired to miRNA positions 11–18, pairing beginning at k-mer position 11 had a 0-nt offset. The k-mer enrichments and their associated colors (top) correspond to those of the top row of Figure 1D. For details on how relative KD values were calculated for each site possibility, see McGeary et al., 2019, Figure 1C–E and Materials and methods section 11. (B) Relative KD values of let-7a 3′-compensatory sites that had optimally positioned 3′ pairing of 4 (orange) to 11 (dark blue) bp. For each length of 3′ pairing, the optimal position is shown in terms of its complementarity to let-7a (right). For each of the 3′-compensatory sites, the relative KD value is plotted as a function of its offset (left), as done for sites with 8 bp of optimally positioned 3′ pairing in (A). Vertical lines indicate 95% confidence intervals. The dashed horizontal line indicates the geometric mean of the 18 relative KD values of the seed mismatch sites, each calculated from reads with <4 nt of contiguous complementarity to the miRNA 3′ region. The horizontal blue and purple lines indicate the relative KD values of the canonical 6mer and 8mer sites, respectively. The arrows at +2 and +4 nt mark a shift in the optimal offset observed with increasing 3′-pairing length. The asterisk denotes the anomalously low binding affinity measured for 3′ sites that pair contiguously with seed pairing (i.e., sites with pairing at position 9 with an offset of 0 nt). (C) The dependency of let-7a 3′-pairing affinity on pairing length, position, and offset. Each panel shows the relative KD values of 3′-compensatory sites with 3′ pairing of a specified length over a range of positions and offsets. Each trend line is colored according to pairing position, spanning positions 9 (light violet) to 18 (red) when possible. The arrows between 0 and 1 nt and at +3 nt mark a shift in the optimal offset as the position of 3′ pairing shifted to include nucleotide 11 of let-7a. Otherwise, these panels are as in (B, left). (D) Schematics of the two 3′-binding modes. In the zero-offset binding mode (top), miRNA nucleotide 11 is inaccessible due to occlusion by the central region of the AGO protein. In the positive-offset binding mode (bottom), the longer stretch of bridging target nucleotides enables a conformation in which nucleotide 11 is available for pairing to the target RNA. Although not intended to accurately reflect the conformation of either binding mode, these schematics illustrate how a larger offset might enable pairing to a more centrally located miRNA nucleotide. (E) Affinity profile of the let-7a 3′ region. Each cell indicates the fold change in relative KD attributed to a 3′ site with indicated length, position, and offset of pairing. Each row within a heat map corresponds to a different miRNA nucleotide at the start of the 3′ pairing, and each column corresponds to a different miRNA nucleotide at the end of the 3′ pairing. Each heat map shows the results for a different offset. The three diagrams indicate the fold-change values and architectures for 3′ sites pairing to miRNA nucleotides 13–16 with an offset of 0 nt (left), pairing to miRNA nucleotides 13–21 with an offset of 0 nt (middle), and pairing to miRNA nucleotides 10–20 with an offset of +4 nt (right). Gray boxes indicate pairing ranges that were either too short (<4 bp) or too long (>11 bp) for relative KD values to be reliably calculated. Black vertical lines depict perfect Watson–Crick pairing, and gray vertical lines indicate Watson–Crick matches at only five of the six seed positions.
Figure 2—figure supplement 1
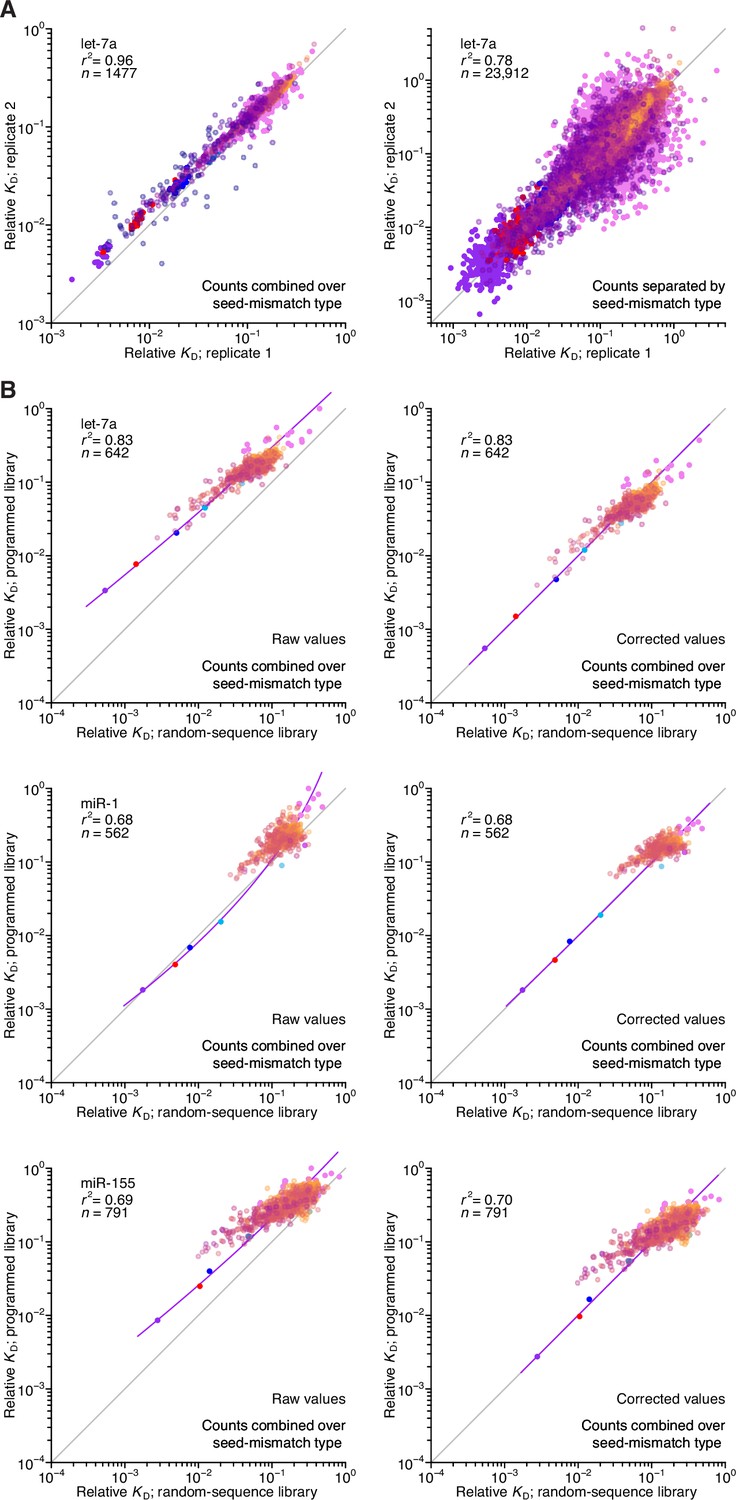
Reproducibility of AGO-RBNS with programmed libraries and correspondence with random-sequence libraries.
(A) Pairwise comparison of replicate relative KD values measured using the let-7-programmed library and AGO2–let-7a when combining (left) or separating (right) reads based on the identity of the seed-mismatch site at the programmed region of the library. Each of the two replicate experiments was performed with independent preparations of both the library and the purified AGO–miRNA complex. The relative KD values correspond to both seed sites and 3′-compensatory sites spanning 4 (orange) to 11 (dark blue) contiguous base pairs in length. The r2 value reports on the coefficient of determination between the log-transformed relative KD values of each replicate. (B) Pairwise comparison of the relative KD values measured for let-7a (top), miR-1 (middle), and miR-155 (bottom) in the programmed-library experiments to those of the random-library experiments, prior to (left) and after (right) correction of each of the programmed library–derived measurements according to those of the random-library experiments using LOESS. Otherwise, this panel is as in (A).
Figure 2—figure supplement 2
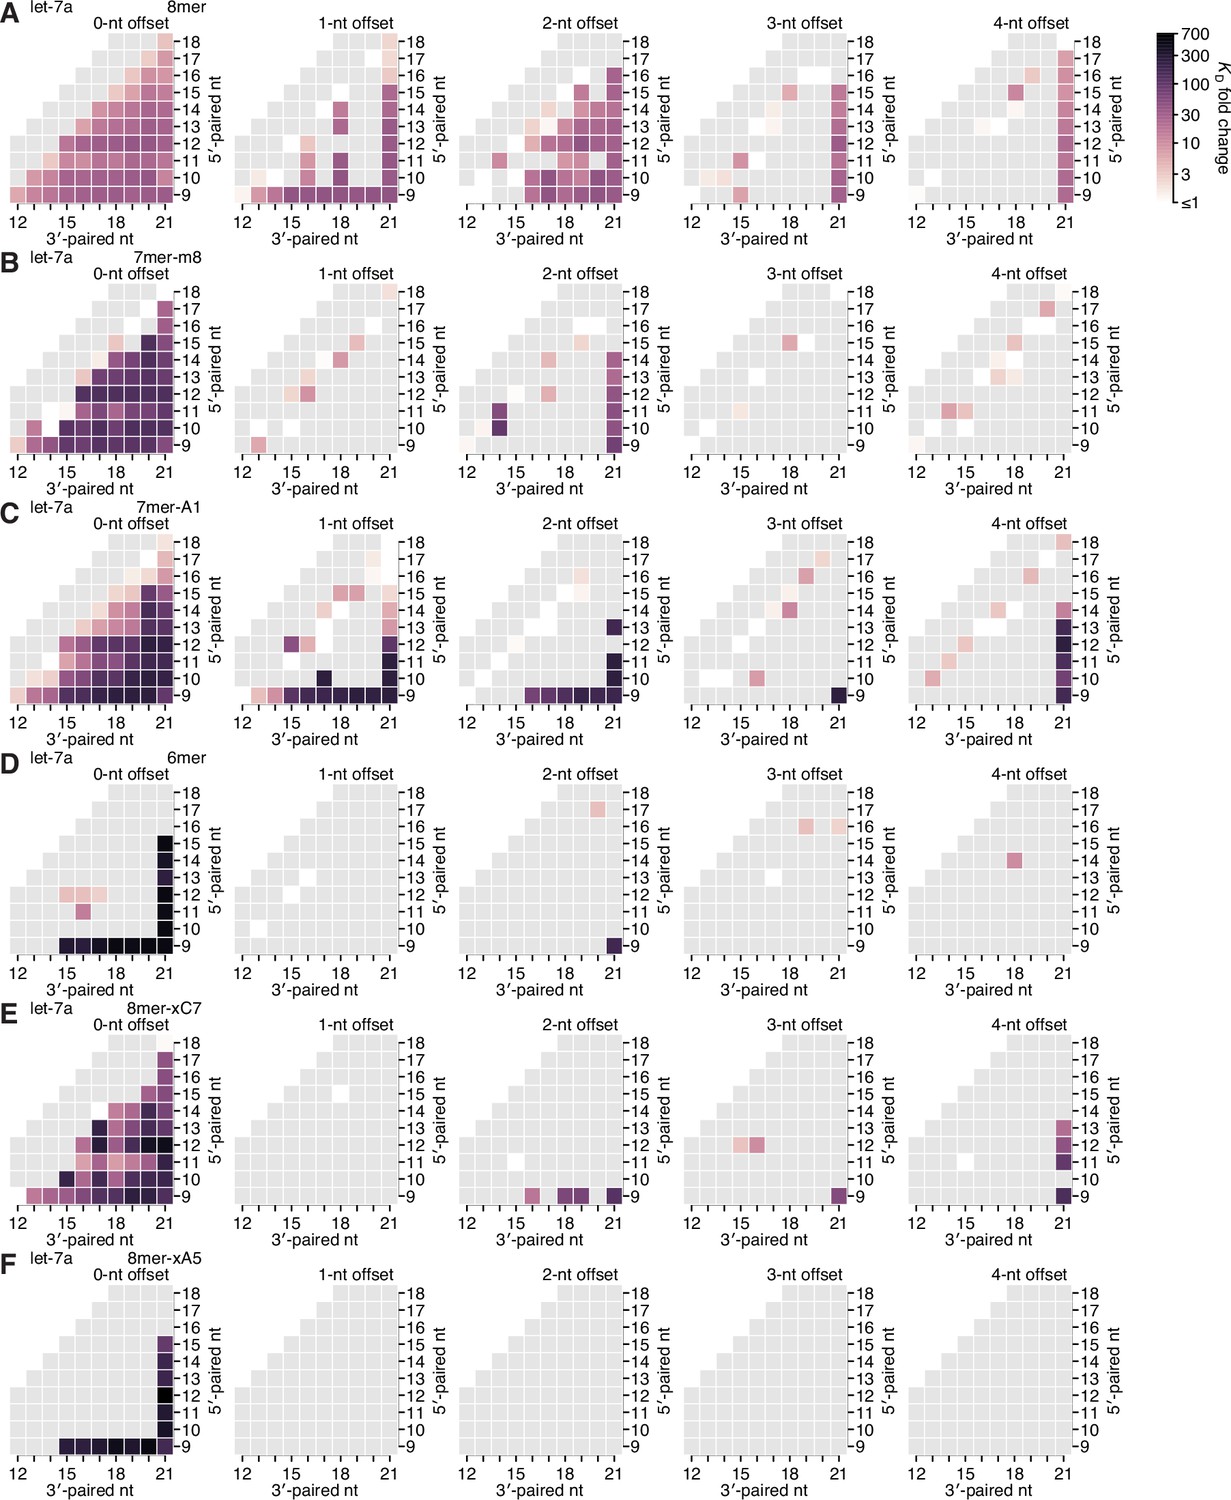
Re-analysis of binding experiments performed in Becker et al., 2019.
(A–F) Partial affinity profiles of the let-7a 3′ region in the context of the 8mer (A), 7mer-m8 (B), 7mer-A1 (C), 6mer (D), 8mer-xC7 (E), and 8mer-xA5 (F) seed sites, using binding affinity measurements derived from imaging-based, high-throughput single-molecule experiments (Becker et al., 2019). Each cell indicates the fold change in KD attributed to a 3′ site with indicated length, position, and offset of pairing. In (A–E), the fold change is with respect to the geometric mean of the measured KD values for all target RNAs with the corresponding seed site and <4 bp of 3′ pairing, and in (F), the fold change is with respect to 10 nM, because there were no target RNAs with an 8mer-xA5 site that lacked 3′ pairing. Gray boxes indicate pairing possibilities for which there were no data. Otherwise, this panel is as in Figure 2E.
Figure 3 with 2 supplements
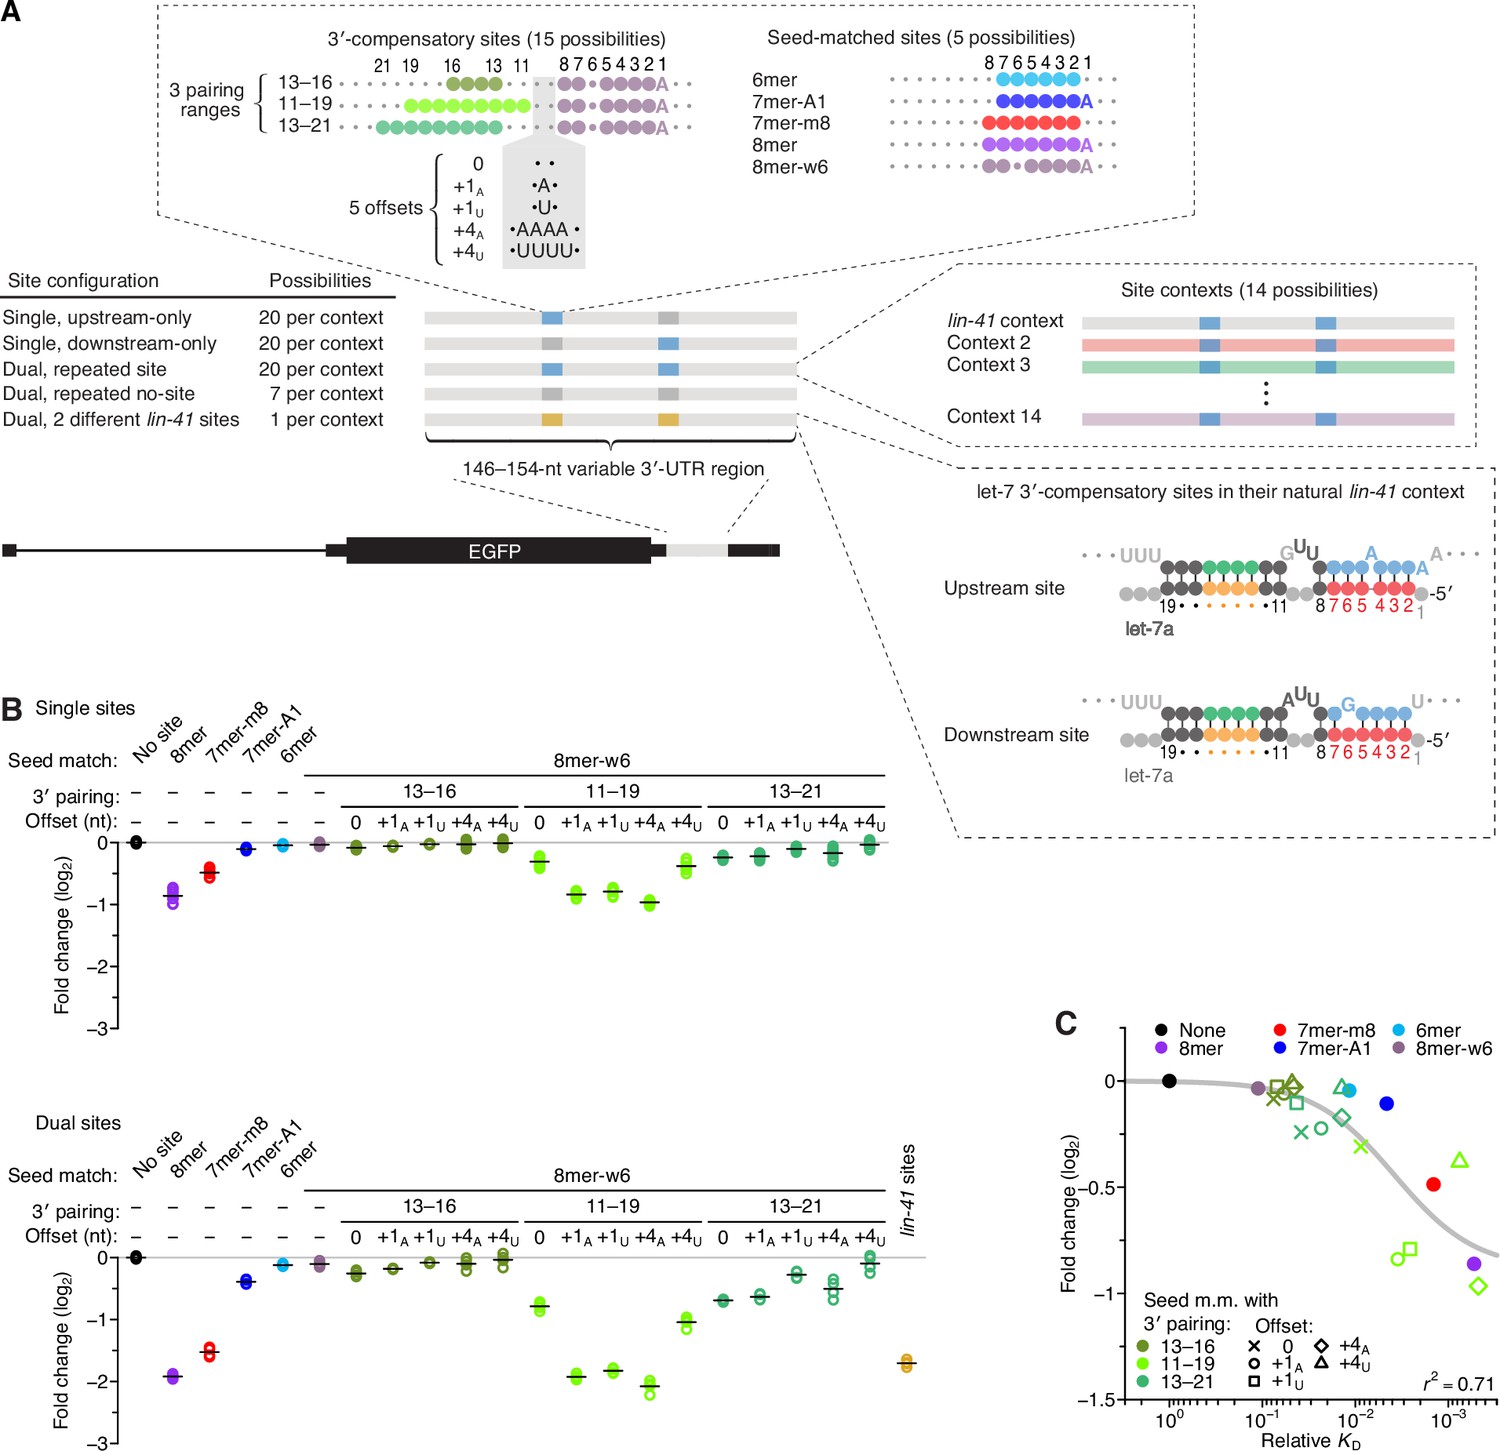
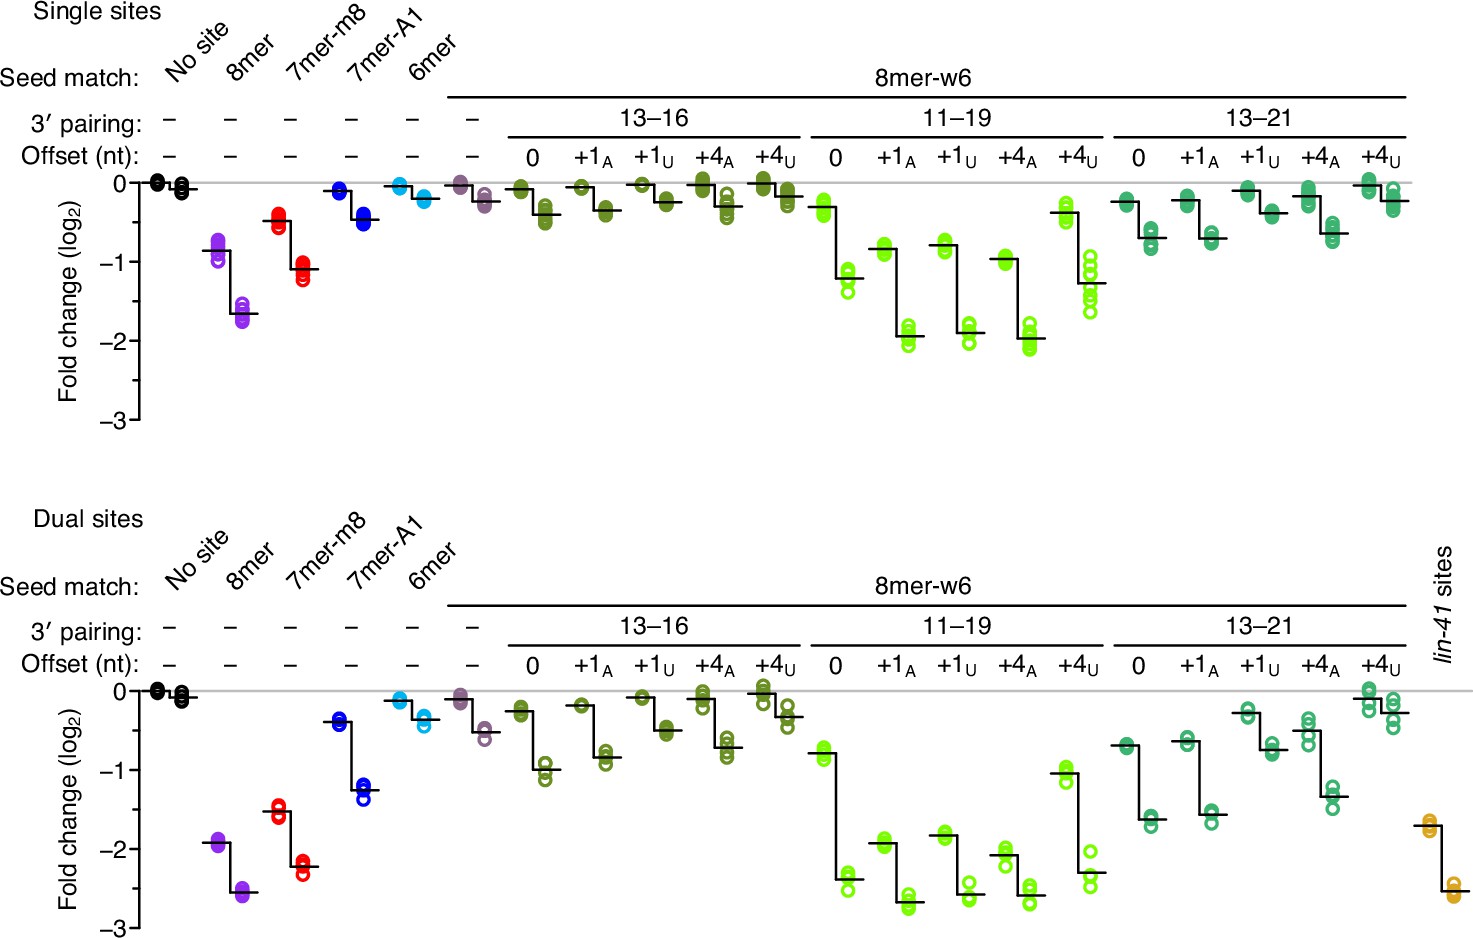
Interplay between the effects of length, position, and offset of 3′ pairing, as measured for let-7a by comparing efficacy of repression in cells.
(A) Design of reporter mRNAs. For the diagrams of 3′-compensatory sites and seed-matched sites, a large colored circle indicates a Watson–Crick match to let-7a, a smaller plum circle indicates a G wobble across from U at position 6 of let-7a, and a small gray circle indicates lack of complementarity. The diagram for the lin-41 sites is as in Figure 1A. Gray nucleotides and small gray circles indicate positions allowed to vary in the 14 different contexts. Each of the nonzero offset possibilities (i.e. the +1A, +1U, +4A, and +4U) was formed by inserting the indicated nucleotides between the two nucleotides opposite those of let-7a positions 9 and 10. (B) Repression attributed to each site type after co-transfecting let-7a into F9 cells. F9 cells were chosen for this experiment because they endogenously express very little let-7 (Mayr et al., 2007). Changes observed upon let-7a co-transfection are plotted for reporters with the single-site configurations (top) and for those with the dual-site configuration (bottom). Mean values are represented by horizontal black lines. For the single-site analysis, changes associated with upstream-only and downstream-only site configurations were plotted separately to yield eight values spanning the four replicate experiments. Changes were normalized to the mean no-site value. (C) The relationship between repression observed in cells and relative KD values derived from AGO-RBNS. The line represents a fitted model relating binding affinity to predicted repression (r2, coefficient of determination of the model fit).
Figure 3—figure supplement 1
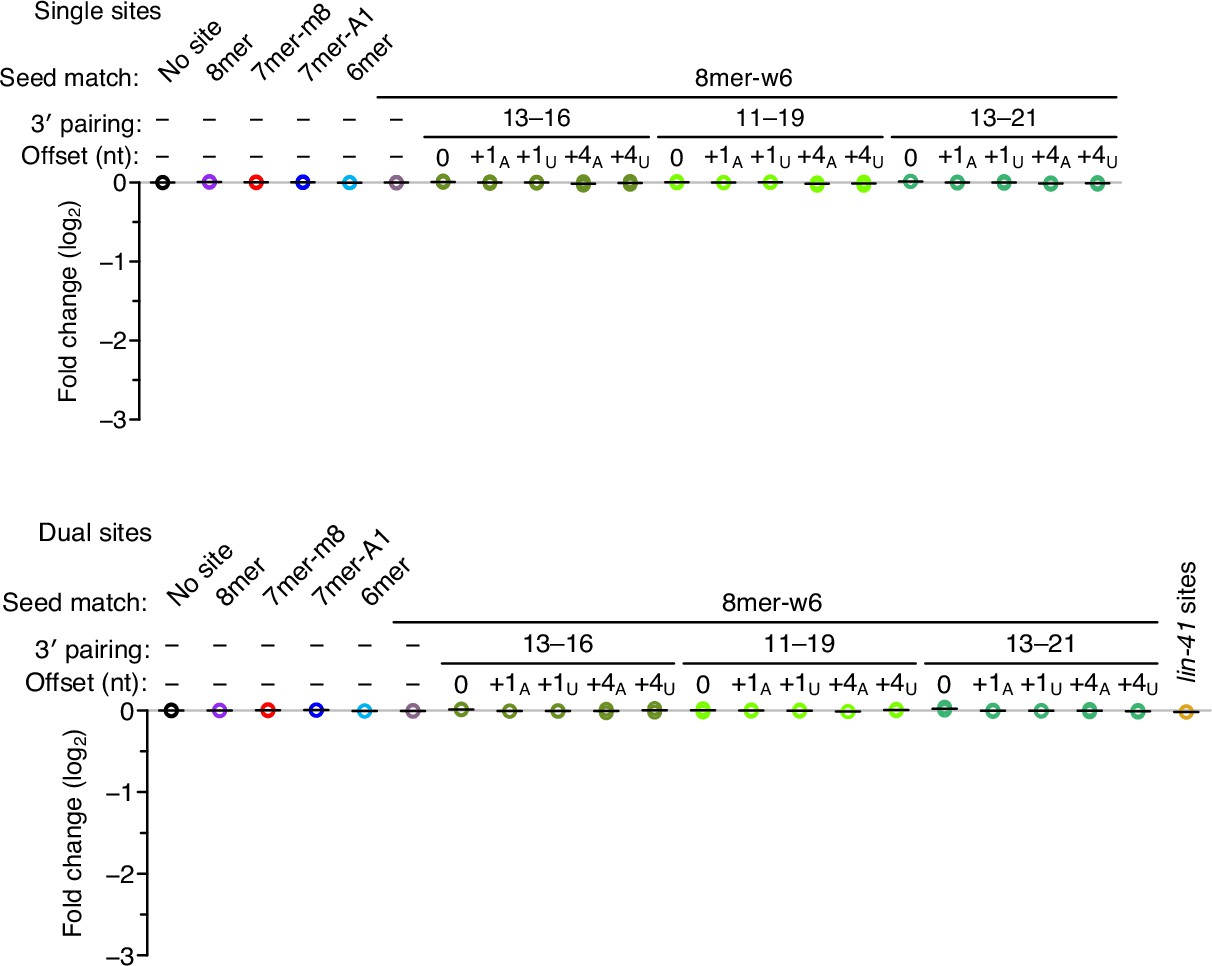
Negligible repression observed when co-transfecting a control miRNA, miR-1.
Otherwise, this figure is as in Figure 3.
Figure 3—figure supplement 2
Enhanced repression observed for each site architecture when presented within the native lin-41 3′-UTR context.
For each site architecture, the left set of points indicates the changes observed when summing the read counts over all 14 3′-UTR contexts, and the right set indicates the changes observed when considering only the reads from the native lin-41 3′-UTR context. Each vertical line represents the difference in the average repression observed between these two sets of values, which was statistically significant for each site architecture, except the dual site pairing to nucleotides 13–21 and +4U-nt offset (P < 0.05, unpaired two-tailed t-tests, corrected for multiple comparisons with the Benjamini–Hochberg procedure). Otherwise, this figure is as in Figure 3.
Figure 4 with 1 supplement
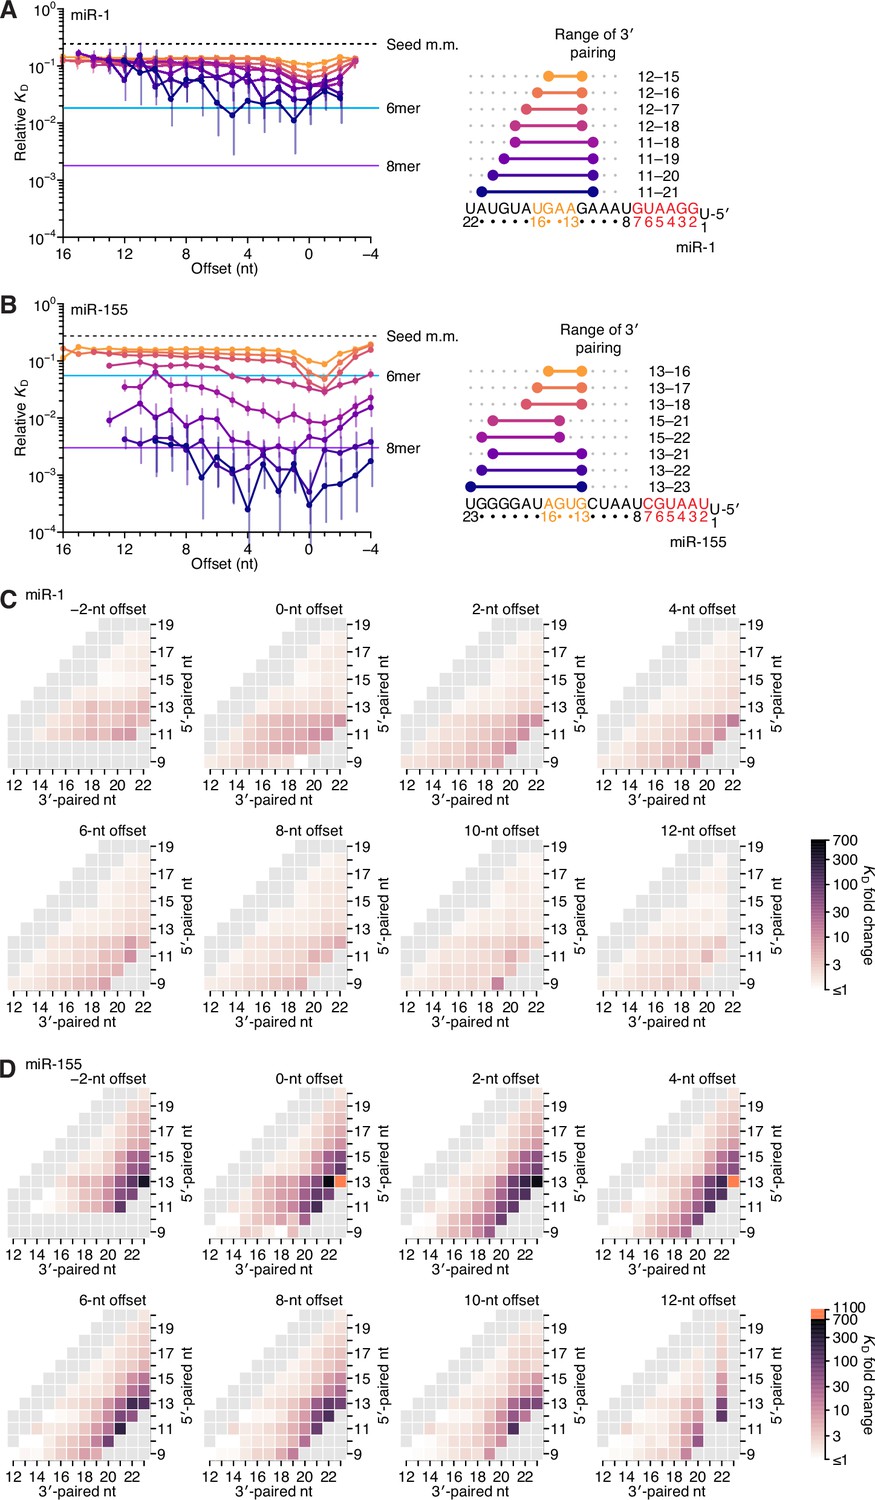
Relative affinity measurements of 3′-compensatory sites of miR-1 and miR-155.
(A) Relative KD values of miR-1 3′-compensatory sites that had optimally positioned 3′ pairing of 4–11 bp. Otherwise, this panel is as in Figure 2B. (B) Relative KD values of miR-155 3′-compensatory sites that had optimally positioned 3′ pairing of 4–11 bp. Otherwise, this panel is as in Figure 2B. (C and D) Affinity profiles of the 3′ regions of miR-1 (C) and miR-155 (D). Otherwise, these panels are as in Figure 2E.
Figure 4—figure supplement 1
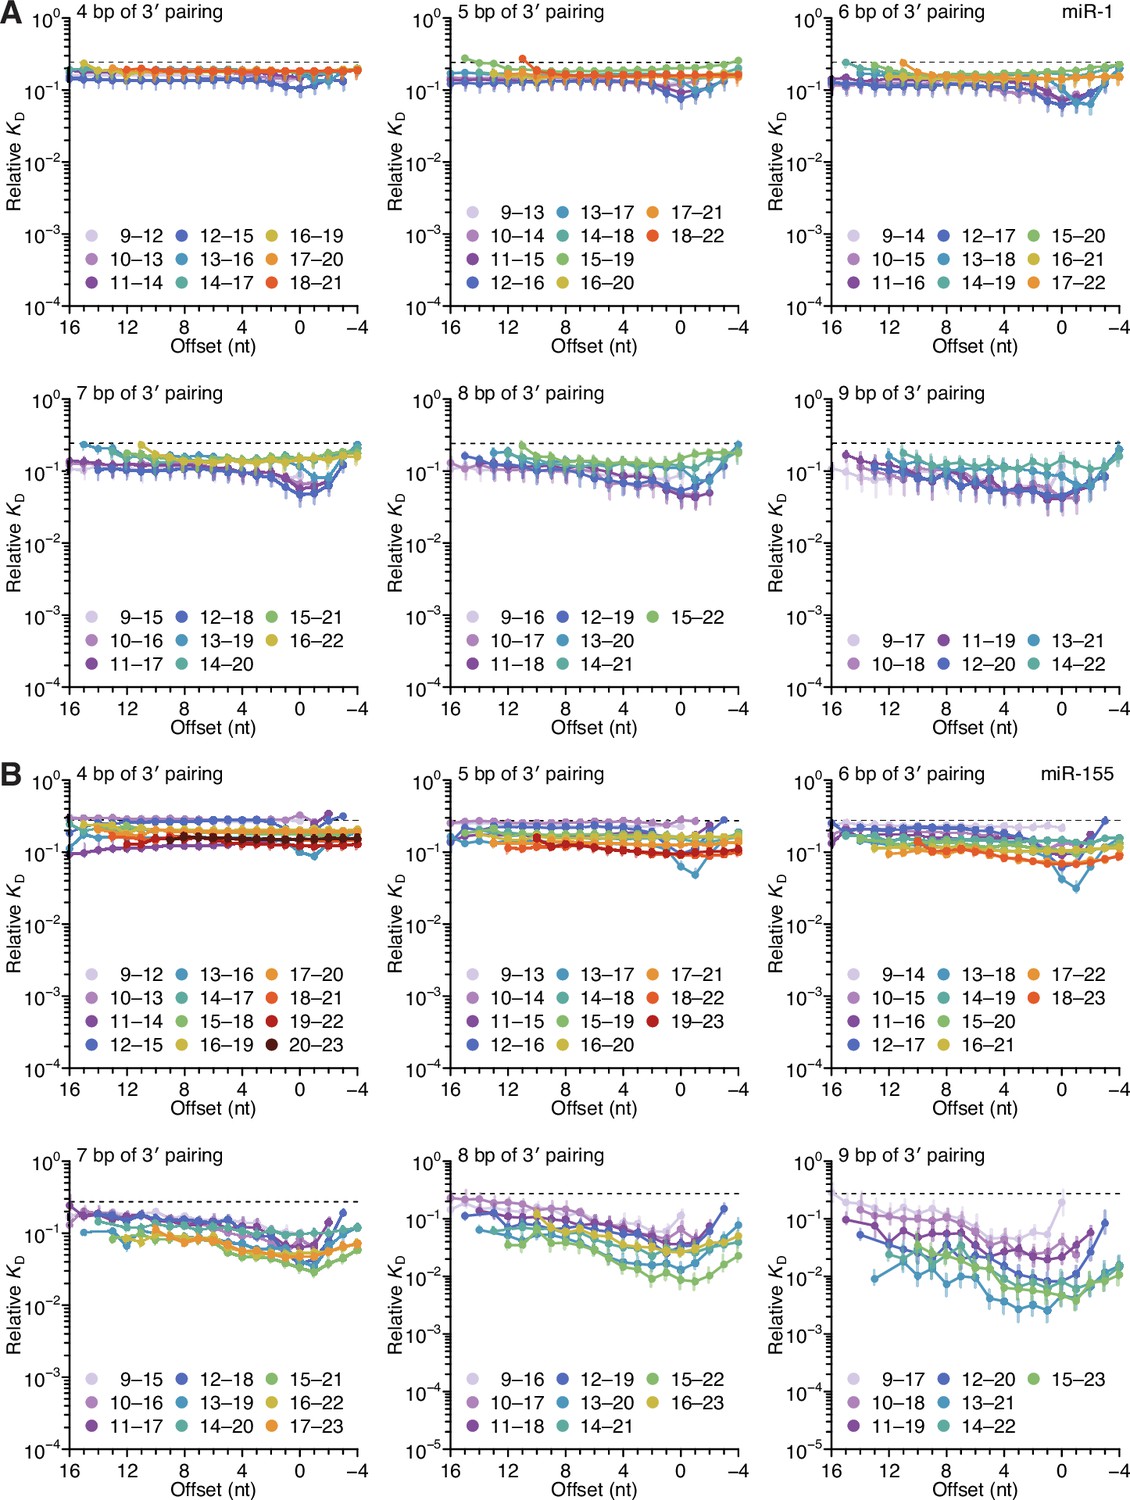
Length, position, and offset trends of miR-1 and miR-155 indicate one binding mode.
(A and B) The dependency of miR-1 (A) and miR-155 (B) 3′ pairing on pairing length, position, and offset. Each panel shows the relative KD values for 3′ pairing of a specified length over a range of positions and offsets, spanning positions 9 (light violet) to 18 (red) wherever possible. Otherwise, these panels are as in Figure 2C.
Figure 5 with 8 supplements
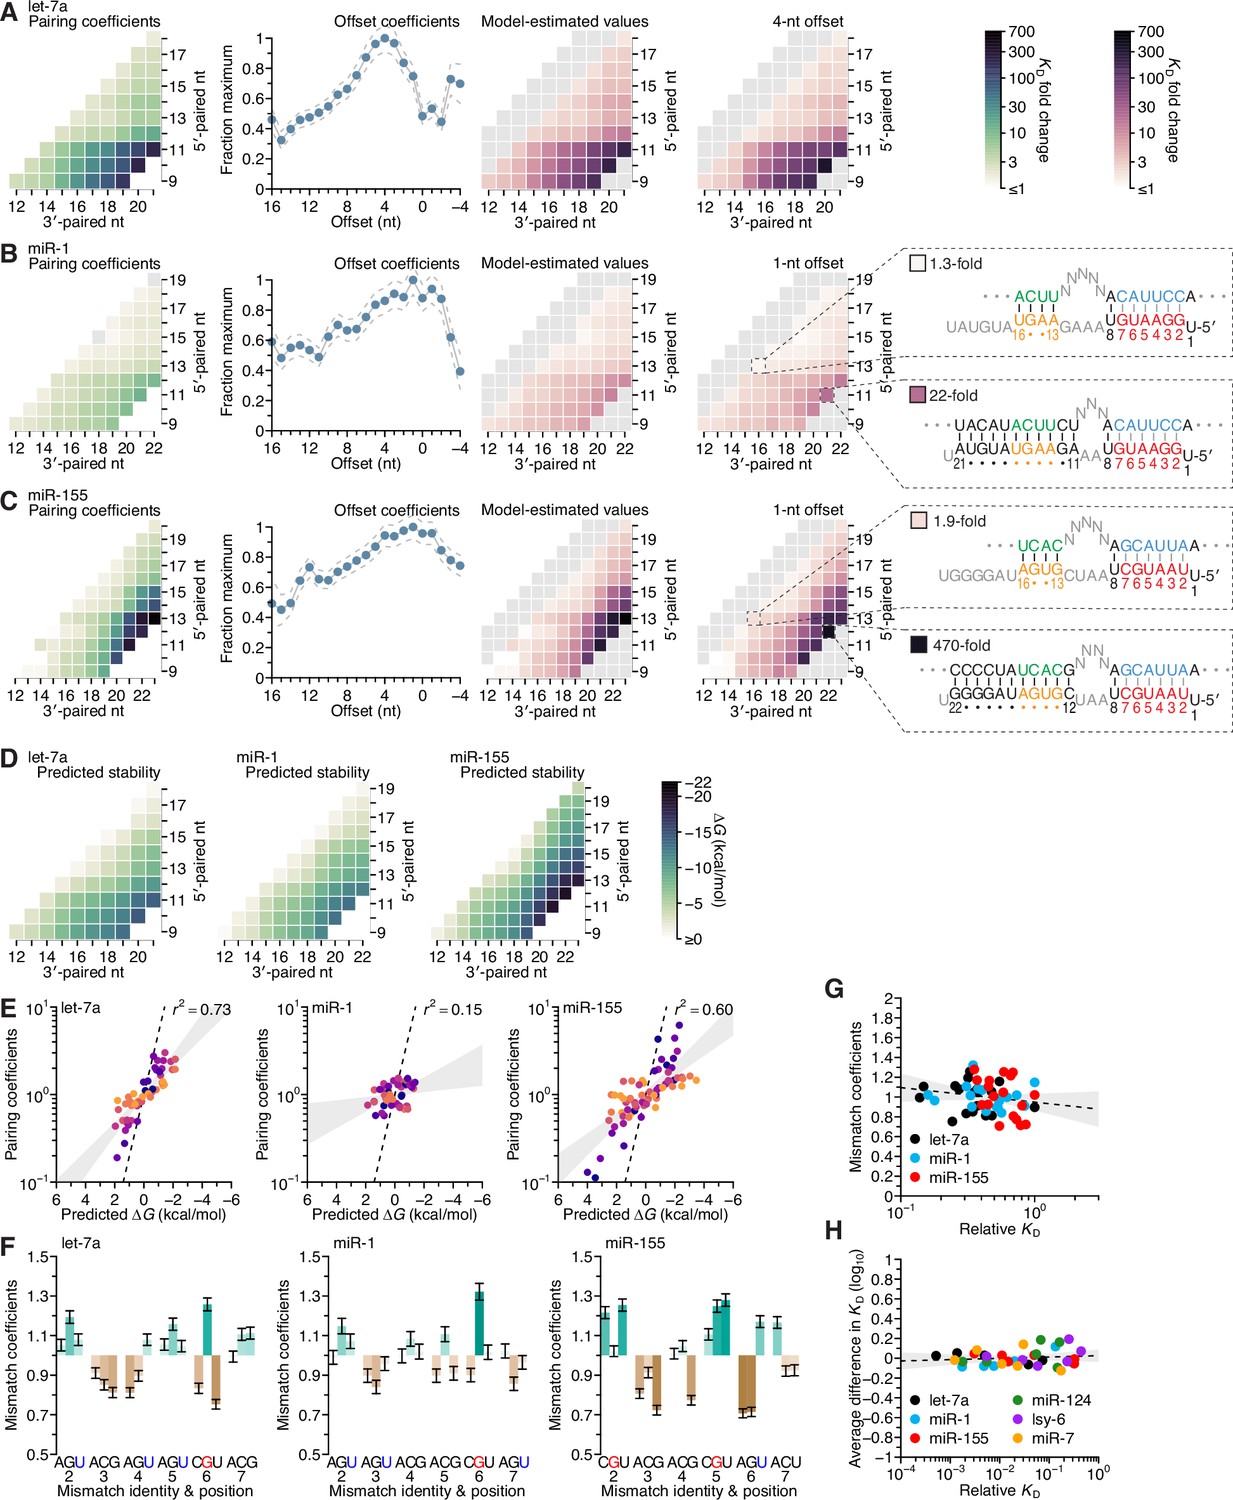
Distinct pairing-range, offset, and seed-mismatch preferences of different miRNAs.
(A–C) Model-based analyses of 3′-pairing preferences of let-7a (A), miR-1 (B), and miR-155 (C). For each miRNA, 3′-pairing affinities are described by a set of pairing coefficients (left) and offset coefficients (middle-left; dashed lines, 95% confidence interval), which when multiplied together (middle-right) approximated measured KD fold-change values (right; let-7a values replotted from Figure 2E). The parameters were obtained by maximum-likelihood estimation with a nonlinear energy model. For both miR-1 (B) and miR-155 (C), the two pairing diagrams indicate the fold-change value and architecture for a 3′ site pairing to miRNA nucleotides 13–16 (top) in comparison to the fold-change value and architecture of the 3′ site with the greatest measured affinity (bottom) at their shared optimal offset of +1 nt. Pairing coefficients, model predictions, and KD fold-change values of miR-1 were not calculated for pairing to miRNA positions 15–18 and 19–22 because these two segments were identical (gray boxes). (D) Predicted ∆G values of the 3′ sites with pairing ranges in (A–C). (E) The relationship between the model-derived pairing coefficients (A–C) and the predicted ∆G values (D). Points are colored according to pairing length, as in Figure 2B. To control for the trivial effect of increasing pairing length, pairing coefficients were divided by the geometric mean of all coefficients with the same length, and ∆G values of each length were normalized to the mean ∆G value of pairings with the same length. The gray region represents the 95% confidence interval of the relationship when fitting a linear model to the data (r2, coefficient of determination), and the dashed line represents the predicted thermodynamic relationship given by K = e−∆G/RT. (F) Distinct effects of seed mismatches on 3′-pairing affinities of let-7a, miR-1, and miR-155. For each miRNA, seed-mismatch coefficients were derived by maximum-likelihood estimation, fitting a nonlinear model to the KD fold-change values observed when examining 3′-site enrichment separately for each of the 18 seed mismatches. The error bars indicate 95% confidence intervals. Wobble pairing in which the G was in either the miRNA or the target is indicated in blue and red, respectively. (G) Relationship between affinity of 3′-compensatory pairing and that of seed-site binding. For each seed mismatch, the coefficient from (F) is plotted as a function of the relative KD value of that mismatch, as measured using results from the programmed libraries for let-7a (black), miR-1 (blue), and miR-155 (red). The dashed line shows the linear least-squares fit to the data, with the gray interval indicating the 95% confidence interval. (H) Relationship between affinity of 3′-supplementary pairing and that of seed-site binding. For each of the six seed-matched site types (Figure 1A, left) and for each of the six miRNAs (key), the relative affinity of the top quartile of all 4- and 5-nt 3′ sites with their preferred offsets is plotted as a function of the relative affinity of the seed-matched site. Relative affinities were measured from analysis of previous AGO-RBNS that used a random-sequence library (McGeary et al., 2019; Figure 5—figure supplement 8).
Figure 5—figure supplement 1
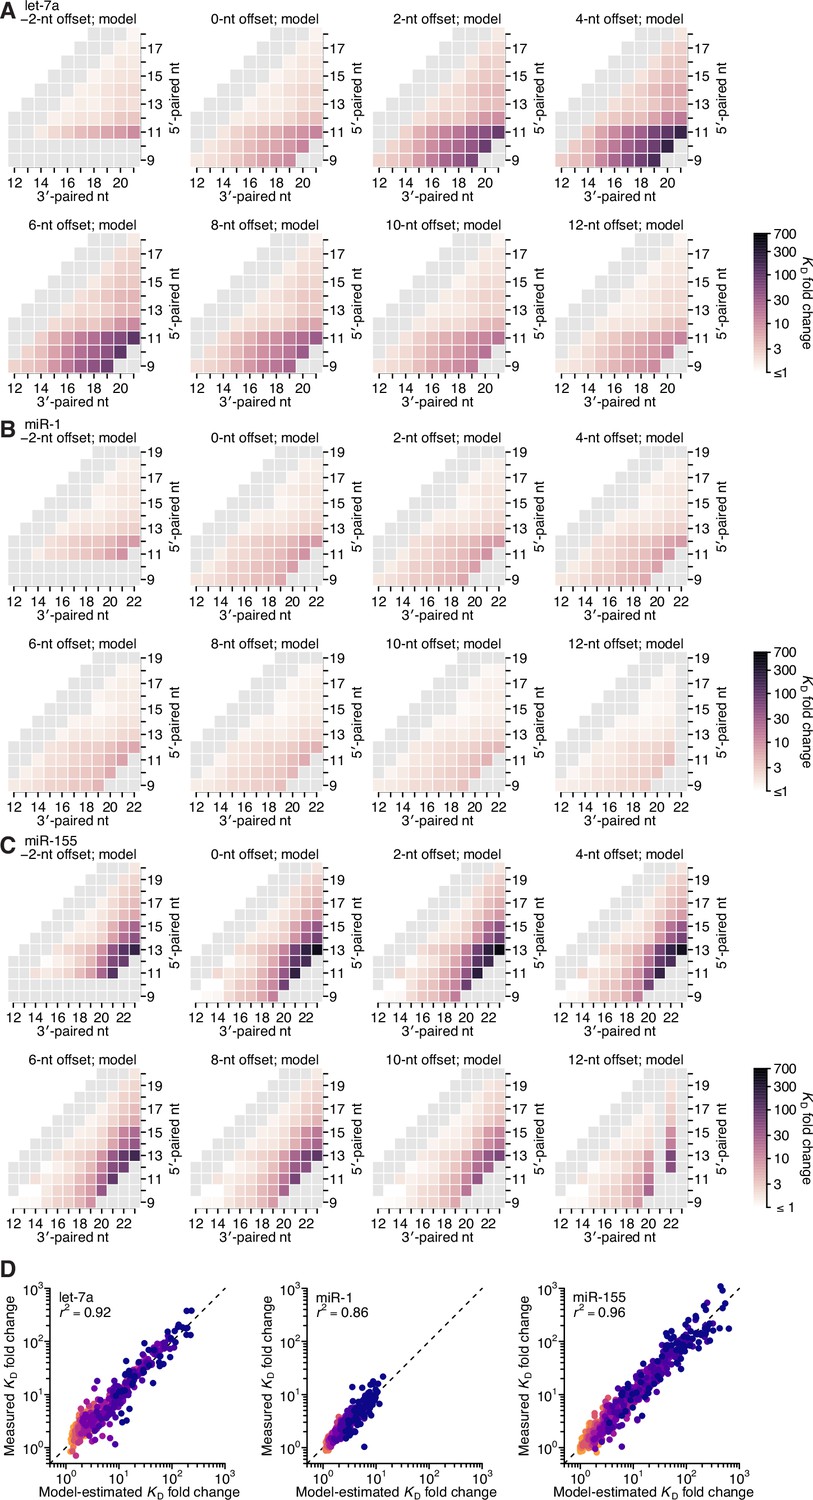
Model prediction of 3′-compensatory pairing.
(A–C) Model-predicted affinity profiles of the let-7a (A), miR-1 (B), and miR-155 (C) 3′ regions. Gray cells correspond either to pairing lengths <4 bp or >11 bp, or to pairing ranges for which there were no measured KD fold-change values for comparison. Otherwise, these panels are as in Figure 2E. (D) Pairwise comparison of the model-predicted and measured KD fold-change values for let-7a (left), miR-1 (middle), and miR-155 (right), with sites that have 4 (orange) to 11 (dark blue) contiguous bp of 3′ pairing. The r2 reports on the coefficient of determination between the log-transformed predicted and measured values.
Figure 5—figure supplement 2

Analysis of the correspondence of pairing coefficients with predicted ∆G, and performance of seed mismatch–effect model.
(A) The relationship between the model-derived pairing coefficients (Figure 5A–C, left) and the predicted ∆G values (Figure 5D), when not controlling for length. Otherwise, this panel is as in Figure 5E. (B and C) The relationship between the model-derived pairing coefficients (Figure 5A–C, left) and the predicted ∆G values (Figure 5D), when separating the pairing based on whether it includes (B) or excludes (C) pairing to nucleotide 11 for let-7a (left), 12 for miR-1 (middle), and 20 for miR-155 (right). Otherwise, these panels are as in (A). (D) The relationship between KD fold-change values measured at the optimal offset for each miRNA and their corresponding predicted ∆G values (Figure 5D), when controlling for length. Otherwise, this panel is as in Figure 5E. (E) The relationship between KD fold-change values measured at the optimal offset for each miRNA and their corresponding predicted ∆G values (Figure 5D), when not controlling for length. Otherwise, this panel is as in (A). (F) Pairwise comparison of the model-predicted and measured KD fold-change values for let-7a (left), miR-1 (middle), and miR-155 (right), when using an expanded model with pairing, offset, and seed-mismatch coefficients. Points are colored according to the length of their 3′ pairing, which ranged from 4 (orange) to 11 (dark blue) contiguous bp. The r2 reports on the coefficient of determination between the log-transformed predicted and measured values.
Figure 5—figure supplement 3
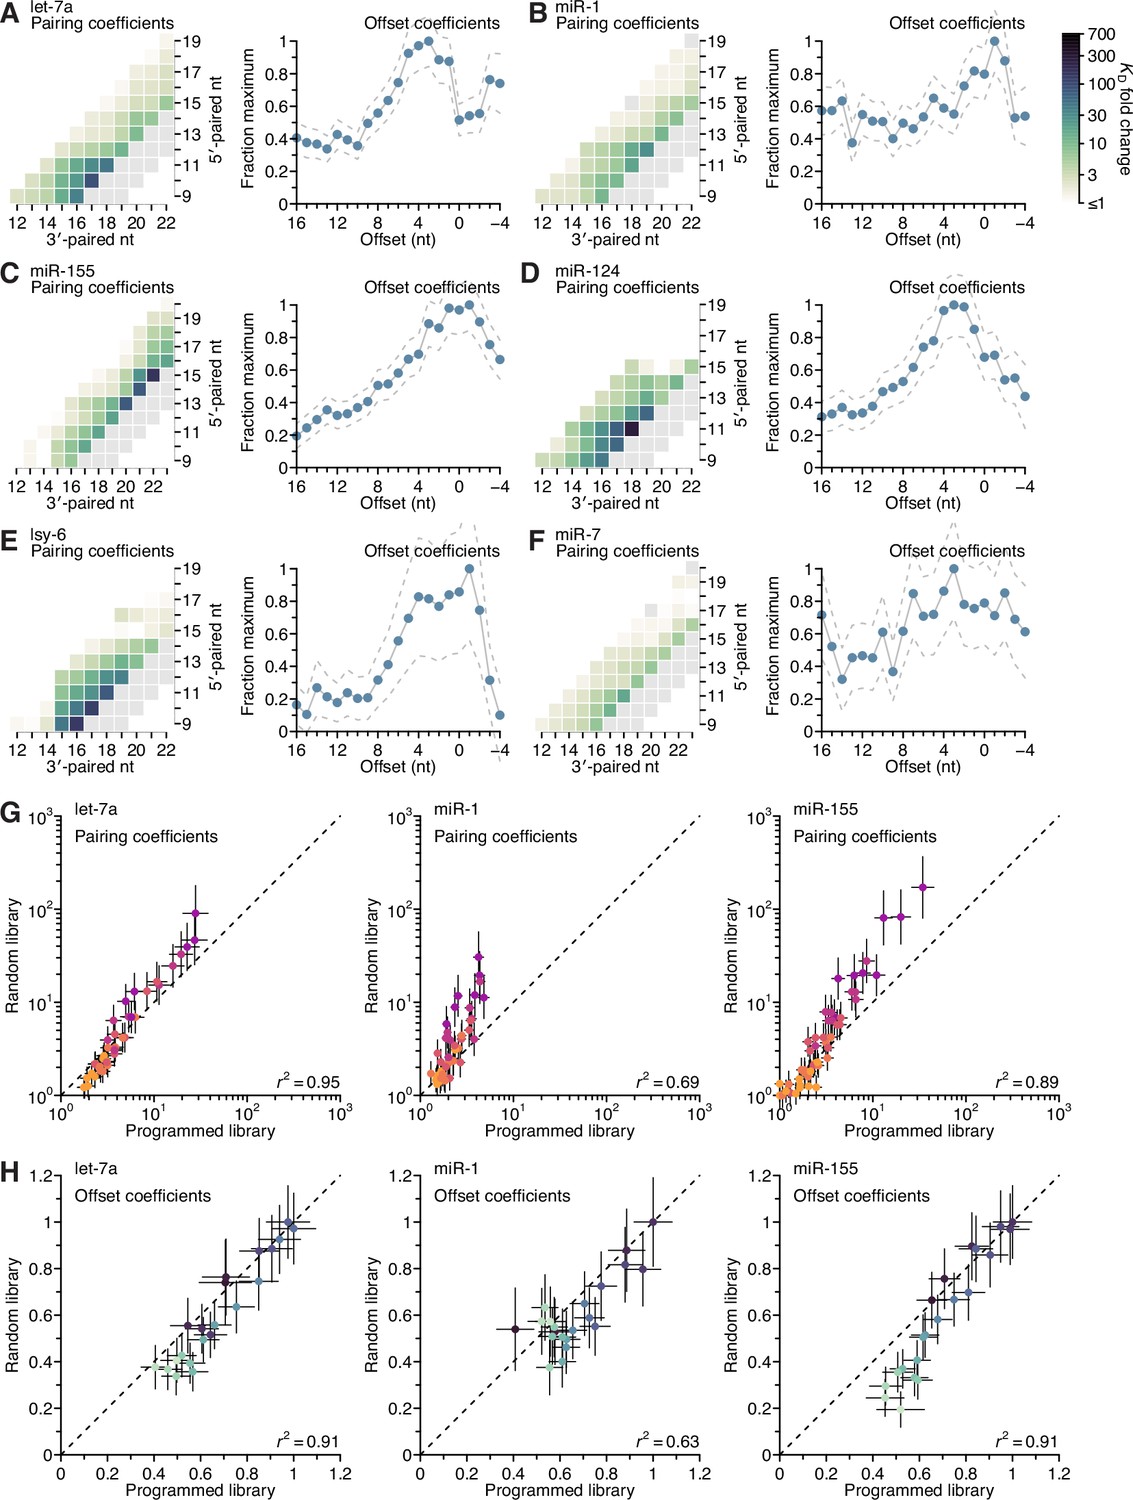
Distinct pairing and offset preferences of different miRNAs in random-sequence AGO-RBNS experiments.
(A–F) Model-based analyses of 3′-pairing preferences of let-7a (A), miR-1 (B), miR-155 (C), miR-124 (D), lsy-6 (E), and miR-7 (F), for sites 4–8 nt in length, using data from previously reported, random-sequence AGO-RBNS experiments. Otherwise, these panels are as in Figure 5A, left and middle-left. (G and H) Pairwise comparison of the pairing (G) and offset (H) coefficients derived from the programmed and random-sequence libraries for let-7a (left), miR-1 (middle), and miR-155 (right), for 3′ pairing of lengths 4–11 bp. The r2 reports on the coefficient of determination between the log-transformed values for each comparison.
Inspection of pairing preferences of let-7a, miR-1, and miR-155, as indicated by their pairing and offset coefficients derived from the random sequence–library data, revealed distinguishing features consistent with those derived from the programmed-library data, including: the importance of pairing to position 11 of let-7a and position 12 of miR-1, the increased optimal offset of let-7a, and the relative ordering of the maximal benefit of 3′ pairing, with that of miR-155 exceeding that of let-7a, which exceeded that of miR-1 (A–C).
Figure 5—figure supplement 4
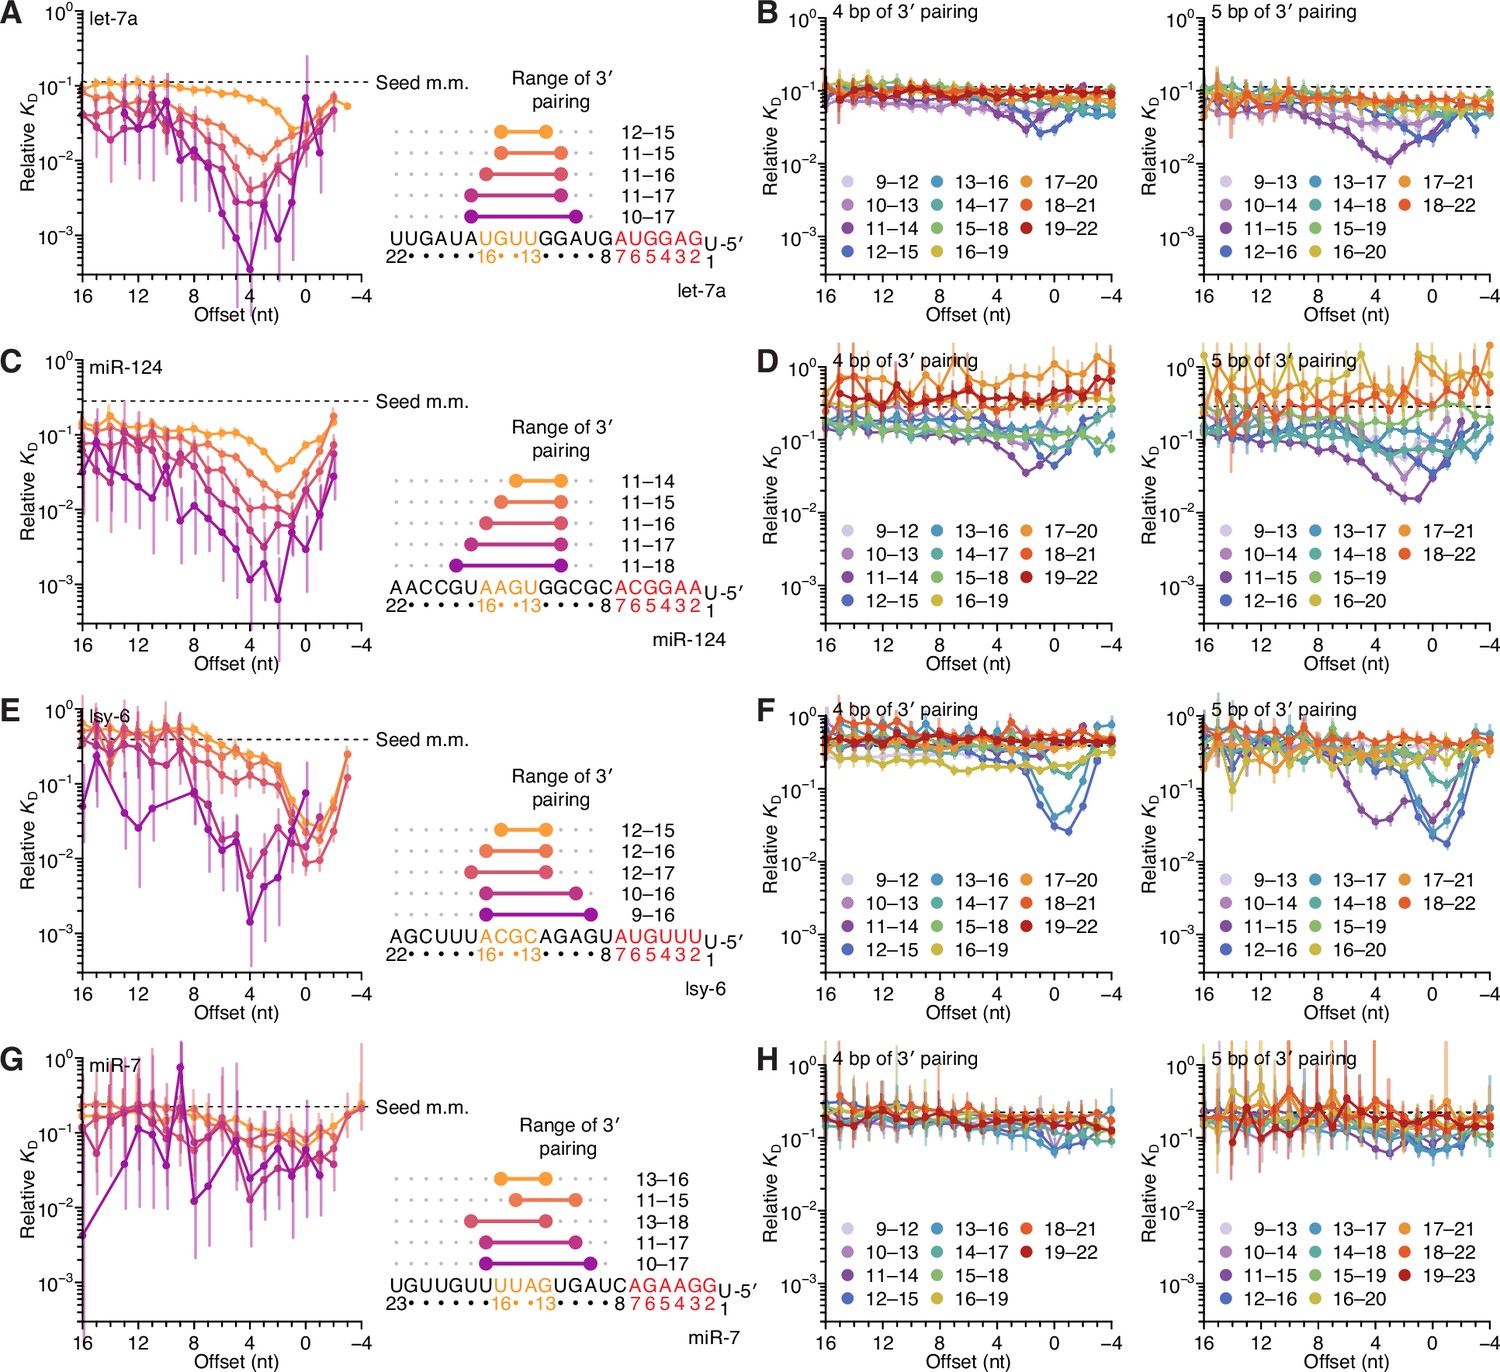
Identification of two binding modes for most miRNAs in random-sequence AGO-RBNS experiments.
(A) Relative KD values of let-7a 3′-compensatory sites that had optimally positioned 3′ pairing of lengths 4–8 bp, as measured with data obtained previously from fully randomized libraries (McGeary et al., 2019). Otherwise, this panel is as in Figure 2B. (B) The dependency of let-7a 3′-pairing affinity on pairing length, position, and offset, for 3′ pairing of 4 (left) and 5 (right) bp of pairing. Otherwise, this panel is as in Figure 2C. (C–H) Equivalent analyses to those of (A) and (B), performed with miR-124 (C and D), lsy-6 (E and F), and miR-7 (G and H), as measured with data obtained previously from fully randomized libraries.
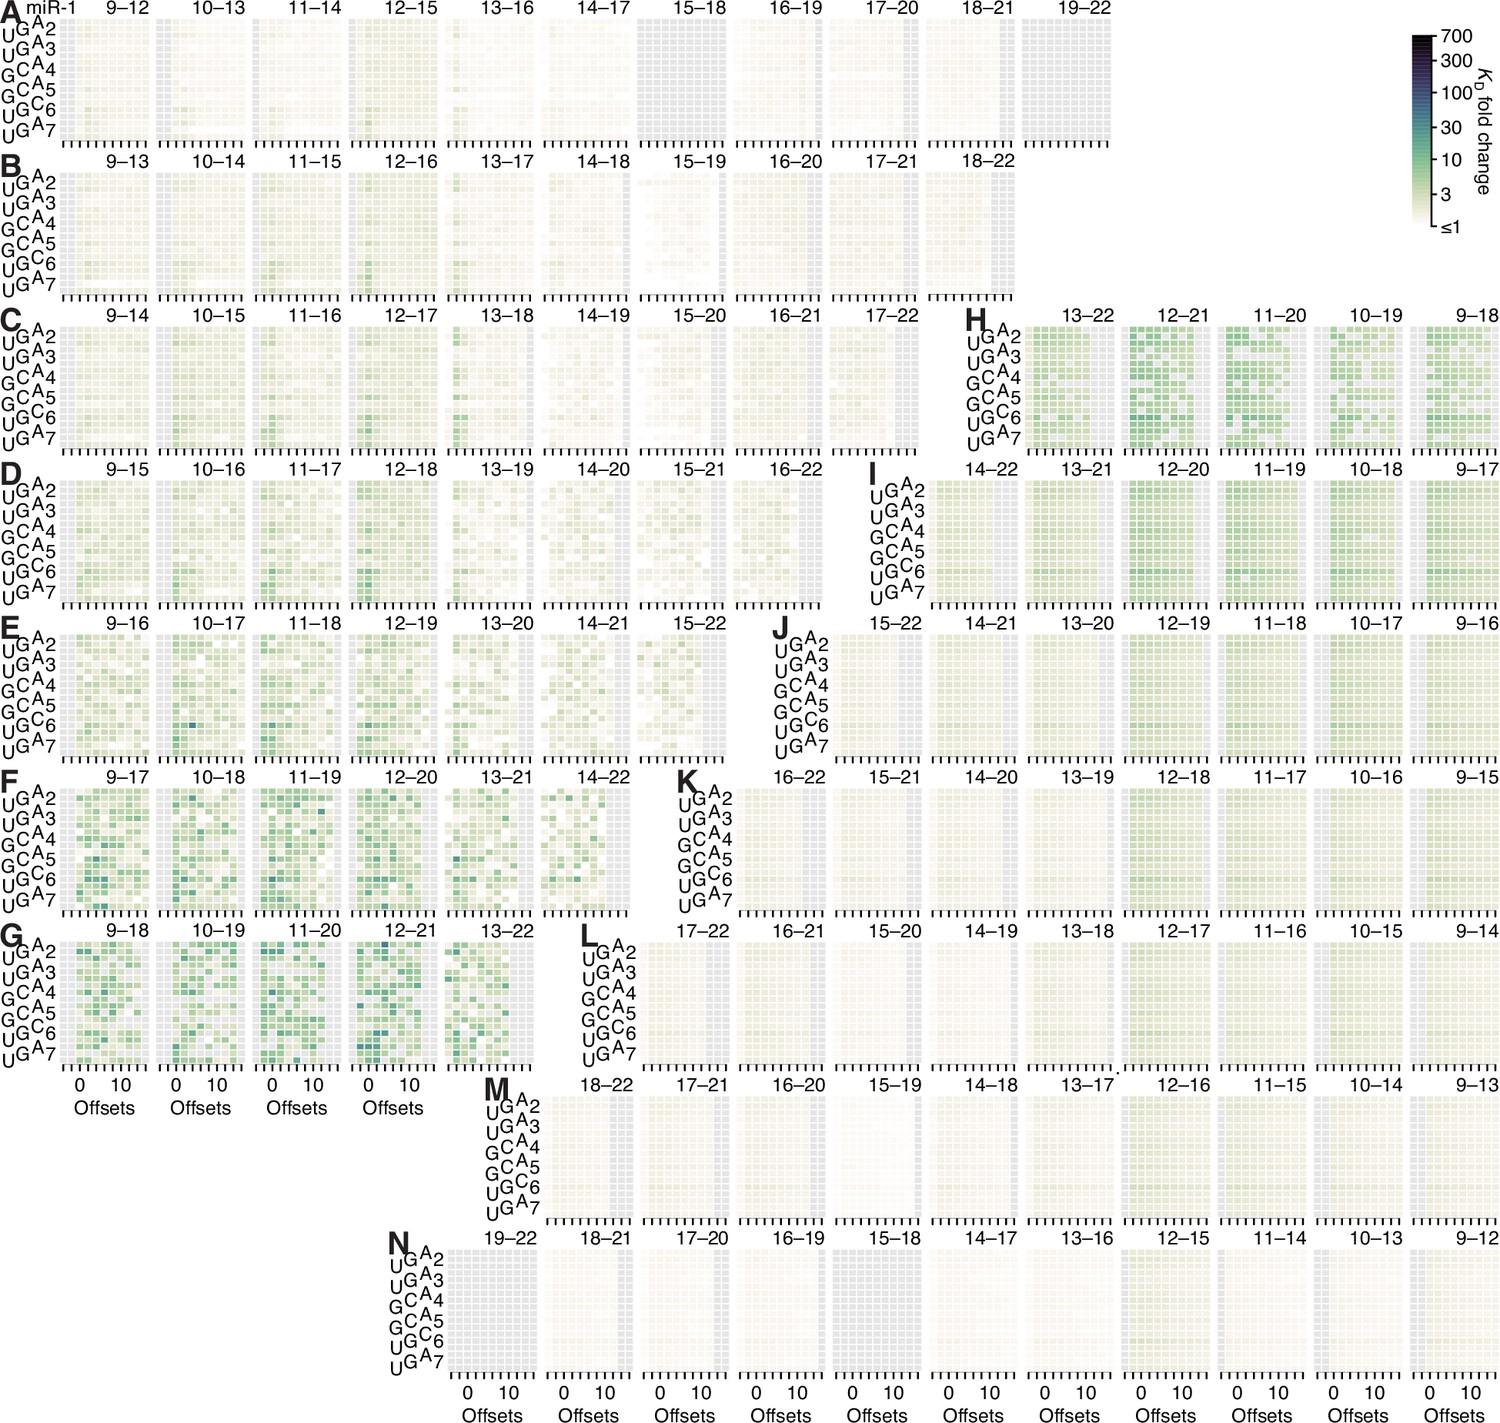
Figure 5—figure supplement 5

Model prediction of pairing, offset, and seed-mismatch effects for let-7a.
(A–N) Visual representation of the model performance evaluated in Figure 5—figure supplement 2F, left. The heat maps within the upper-left triangle (A–G) show the measured KD fold-change values, while the heat maps within the lower-right triangle (H–N) show the model predictions. The two triangular arrays of heat maps are rotationally symmetric. Each individual heat map describes all of the variation associated with one defined stretch of 3′ pairing. Within each heat map, each row corresponds to a different seed-mismatch type, with the left-hand numbers referring to the seed-mismatch position of every three rows, the staggered left-hand letters designating the mismatch identity of each row, and the columns each corresponding to a different even-valued offset of pairing between −4 and +16 nt.
The seed-mismatch coefficients were modeled to influence the affinity of 3′ pairing as a function of the amount of affinity associated with each 3′-pairing architecture, which varied between miRNAs. Thus, the range of 0.50, 0.48, and 0.57 observed for seed-mismatch coefficients for let-7a, miR-1, and miR-155, respectively (Figure 5F), corresponded to 9.2-, 2.6-, and 11.2-fold predicted variation in KD fold change, respectively, for each miRNA in the context of its most favorable pairing and offset, with the lower impact on miR-1 attributed to the lower amount of affinity attainable by its 3′ pairing. These predicted effects generally agreed with those observed when examining affinities of the top quartile of 3′ sites in the context of their optimal offset, which respectively varied by 14.9-, 5.1-, and 6.5-fold depending on seed-mismatch identity. Furthermore, visual inspection of the trends in observed 3′-site affinities confirmed the increased effect of seed mismatches for higher-affinity 3′ sites (Figure 5—figure supplements 5–7). For example, only a few of the 4-nt 3′ sites to let-7a were sensitive to the particular seed-mismatch type (A), whereas for 8-nt sites, more positions and offsets exhibited such variation, and these were positions and offsets with higher average affinities (E).
Figure 5—figure supplement 6
Model prediction of pairing, offset, and seed-mismatch effects for miR-1.
(A–N) Visual representation of the model performance evaluated in Figure 5—figure supplement 2F, middle. No model-predicted or measured KD fold-change values are reported for pairing to positions 15–18 or 19–22 because both segments have the same sequence and are thus indistinguishable. Otherwise, this figure is as in Figure 5—figure supplement 5.
Figure 5—figure supplement 7
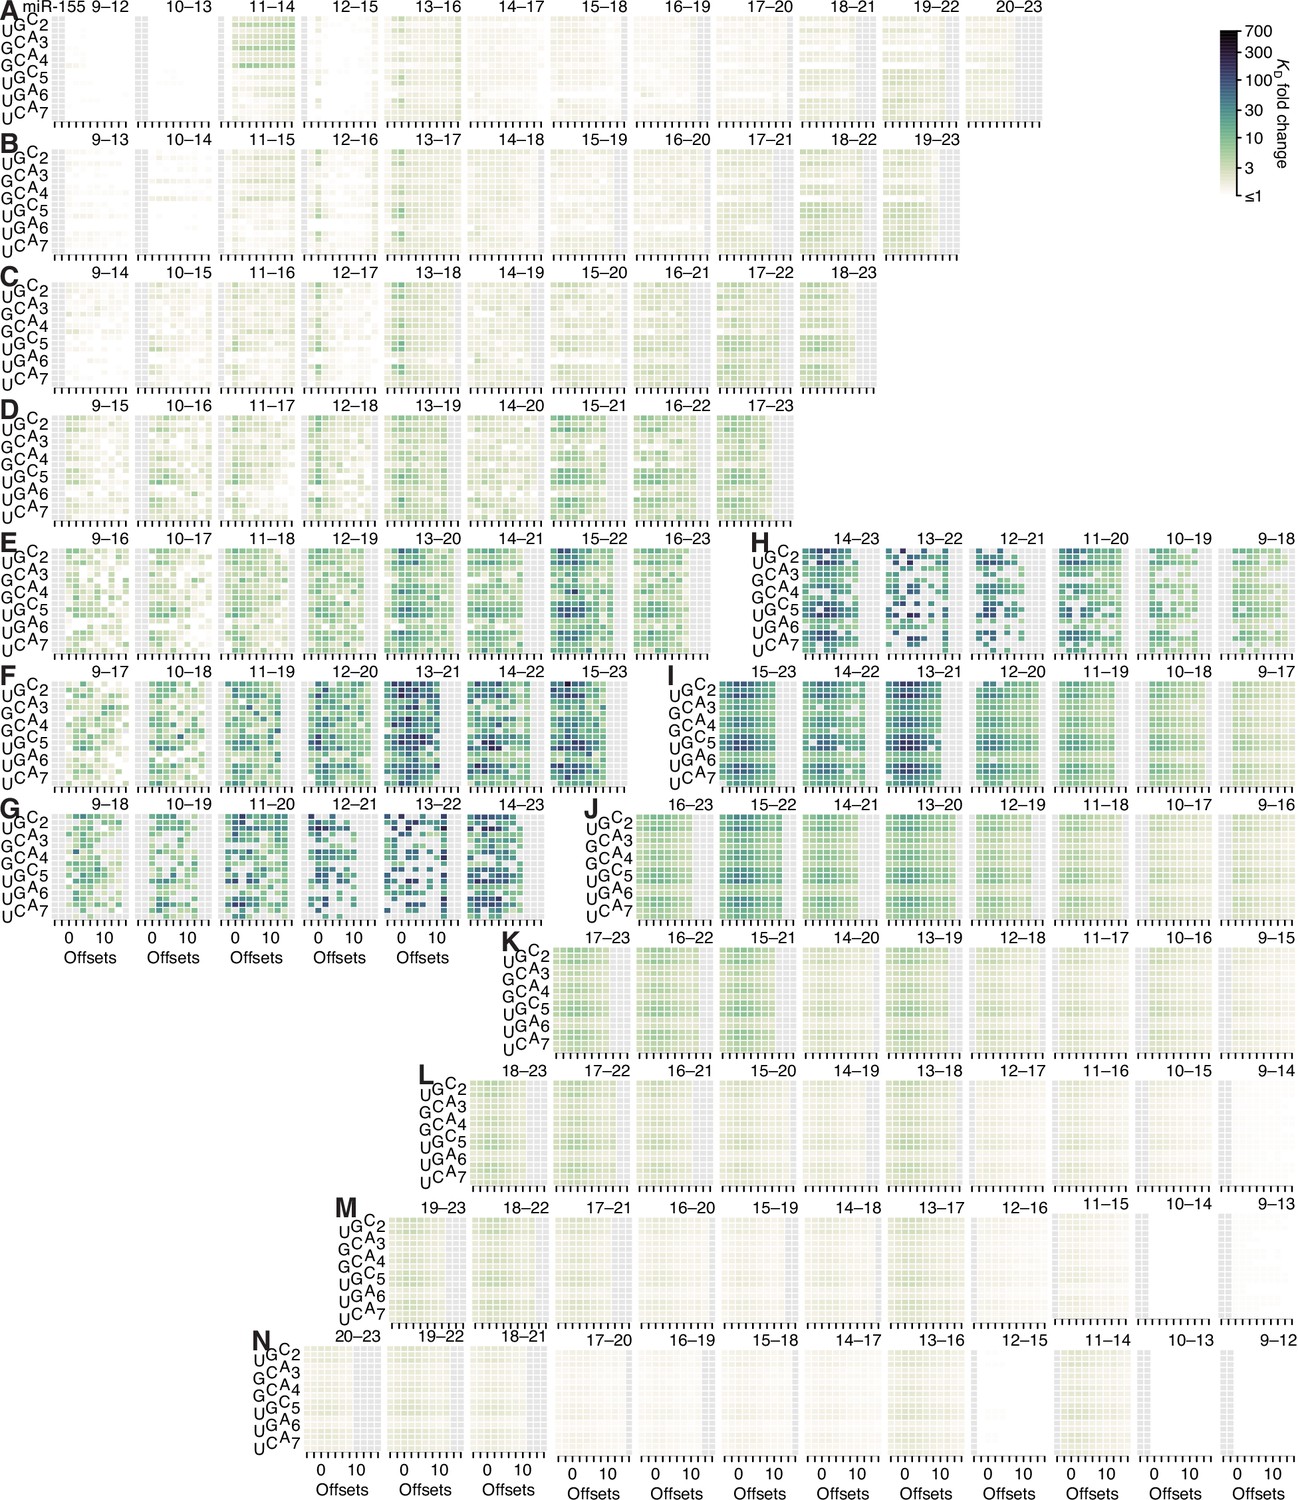
Model prediction of pairing, offset, and seed-mismatch effects for miR-155.
(A–N) Visual representation of the model performance evaluated in Figure 5—figure supplement 2F, right. Otherwise, this figure is as in Figure 5—figure supplement 5.
Figure 5—figure supplement 8
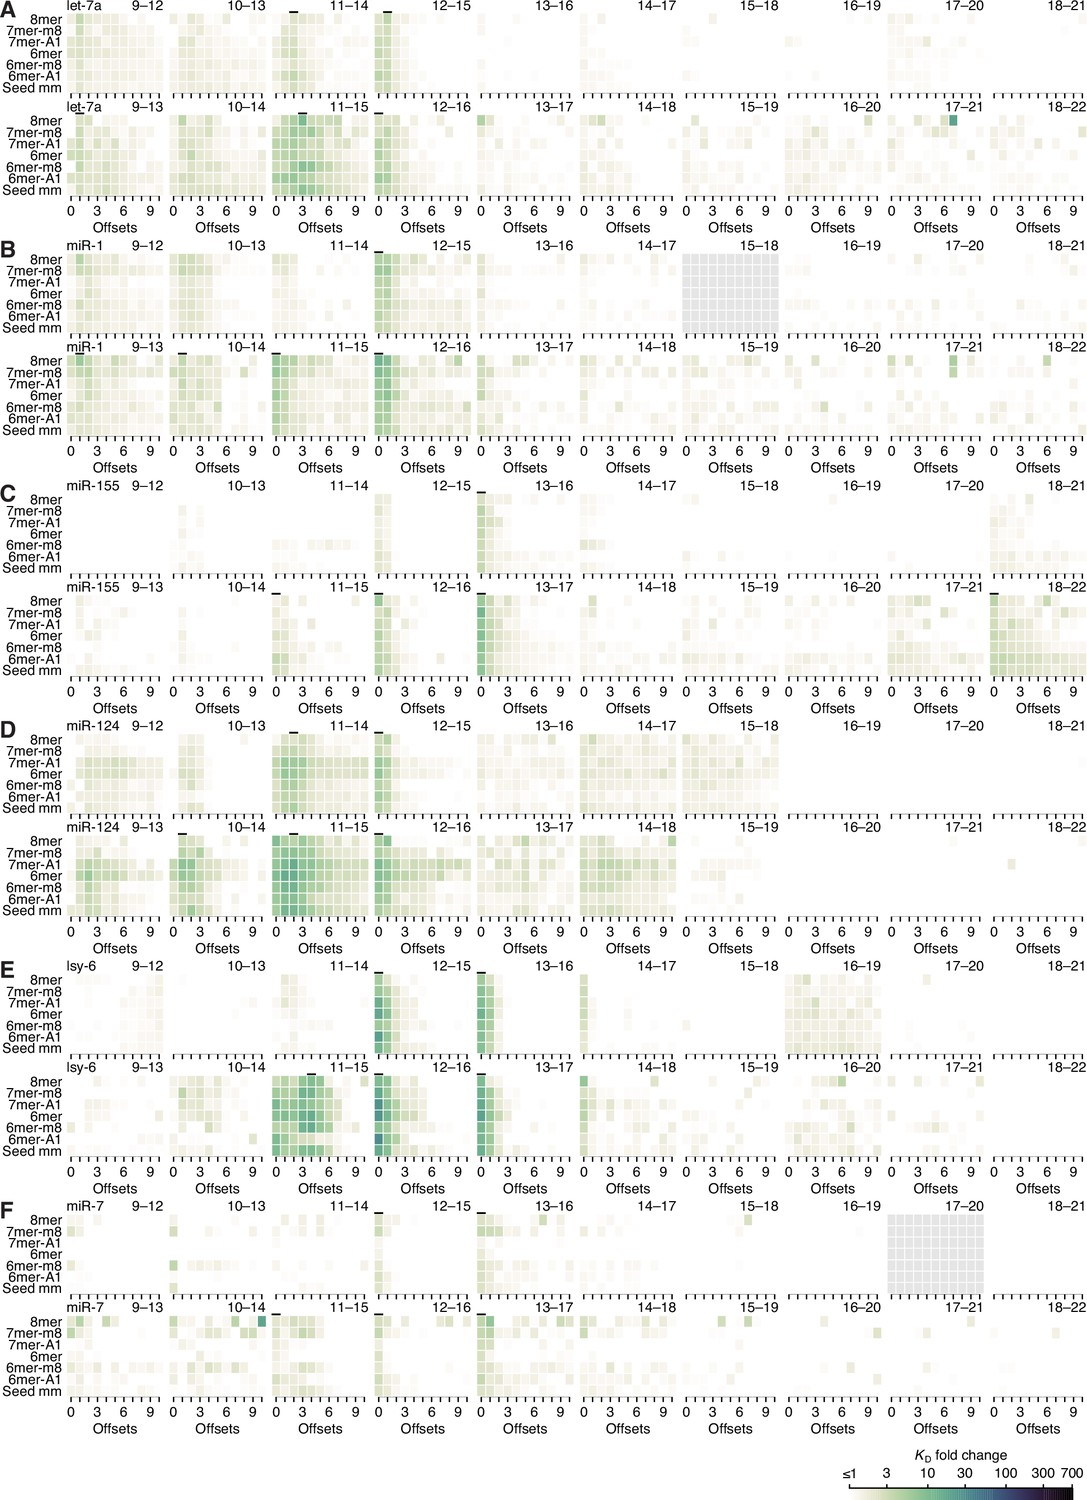
Minimal influence of seed site type on 3′-supplementary pairing.
(A–F) Heat maps depicting the KD fold change of canonical sites and seed-mismatch sites of let-7a (A), miR-1 (B), miR-155 (C), miR-124 (D), lsy-6 (E), and miR-7 (F), using data from previously reported, random-sequence AGO-RBNS experiments. Each individual heat map represents the pairing range to the miRNA 3′ region shown in the upper-right, with each row corresponding either to one the six canonical sites or to a seed-mismatch site given by summing the read counts of all 18 internal 8mer-mismatch sites, and each column corresponding to a different pairing offset ranging from 0 to +10 nt. Those columns with horizontal lines above them were used to compute the average 3′-supplementary pairing for the six canonical sites in the analysis of Figure 5H. KD fold-change values were not calculated for pairing to positions 15–18 of miR-1 nor for pairing to positions 17–20 of miR-7 because each of these two segments were identical to the 4-nt segment at the very 3′ end of each respective miRNA sequence.
Figure 6 with 2 supplements
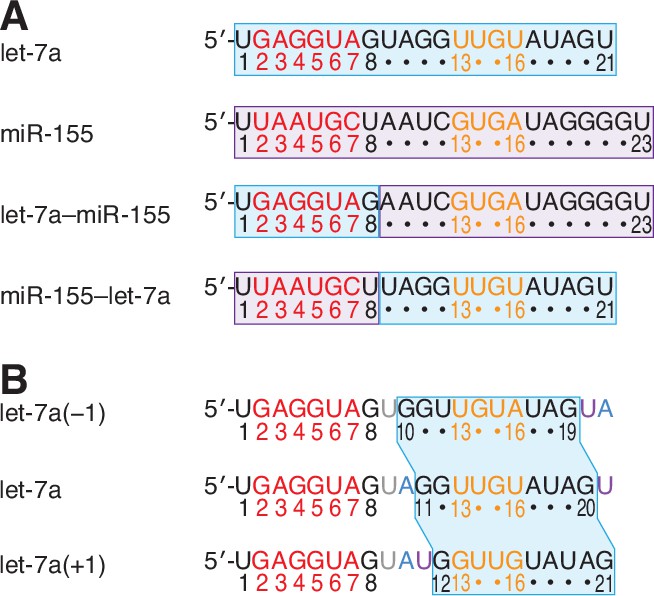
Variant miRNAs designed to query the contributions of the seed and 3′ regions to binding, and the positional dependence of pairing preferences of the 3′ region.
(A) Sequences of native let-7a, native miR-155, a chimeric miRNA containing the seed region of let-7a appended to nucleotides 9–23 of miR-155 (let-7a–miR-155), and a chimeric miRNA containing the seed region of miR-155 appended to nucleotides 9–21 of let-7a (miR-155–let-7a). (B) Sequences of let-7a(−1), which has a 3′ region permuted one nucleotide toward the 5′ end, native let-7a, and let-7a(+1), which has a 3′ region permuted one nucleotide toward the 3′ end. The 3′ sequence shared between all three miRNAs is shaded in blue, and the A and U nucleotides that were rearranged to generate the permuted variants are in blue and purple, respectively.
Figure 6—figure supplement 1

Independence of seed-mismatch and 3′-sequence effects.
(A, redrawn from Figure 6A) Sequences of native let-7a, native miR-155, a chimeric miRNA containing the seed region of let-7a appended to nucleotides 9–23 of miR-155 (let-7a–miR-155), and a chimeric miRNA containing the seed region of miR-155 appended to nucleotides 9–21 of let-7a (miR-155–let-7a). (B and C) Pairing and offset coefficients describing the 3′-pairing preferences of let-7a–miR-155 (B) and miR-155–let-7a (C). Orange cells indicate pairing coefficients or KD fold-change values between 700–1,200. Otherwise, this panel is as in Figure 5A. (D) Comparison of the pairing and offset coefficients determined for let-7a–miR-155 with those of miR-155. Left, comparison of pairing coefficients, after first dividing by the geometric mean of all pairing coefficients of the same length for that miRNA, which normalized the trivial effect of pairing length. Points are colored according to pairing length, as in Figure 2A; error bars indicate 95% confidence intervals. Right, comparison of offset coefficients, colored from light blue to dark blue, progressing from offsets of −4 to +16 nt; error bars indicate 95% confidence intervals. For each graph, the gray region indicates the 95% confidence interval for the linear least-squares fit to the data (r, Pearson correlation coefficient). (E) Comparison of the pairing and offset coefficients determined for miR-155–let-7a with those of let-7a. Otherwise, this panel is as in (D). (F) Comparison of the pairing and offset coefficients determined for miR-155–let-7a with those of miR-155. Otherwise, this panel is as in (D). (G) Comparison of the pairing and offset coefficients determined for let-7a–miR-155 with those of let-7a. Otherwise, this panel is as in (D). (H) Seed-mismatch coefficients of the let-7a–miR155 (left) and miR-155–let-7a (right) chimeric miRNAs. Otherwise, this panel is as in Figure 5F. (I) Correspondence between mismatch coefficients of chimeric miRNAs and those of their seed-native miRNAs. For let-7a–miR-155 (left) and miR-155–let-7a (right), the values from (H) are plotted against those of Figure 5F (r2, coefficient of determination). Colors and symbols indicate the position and nucleotide identity, respectively, of each seed mismatch coefficient (key).
The distinct pairing, offset, and seed-mismatch preferences of the three miRNAs measured using the programmed libraries raised the question of the extent to which these preferences depended on the sequence of the seed region, the sequence of the 3′ region (i.e., beginning at miRNA nucleotide 9), or a combination of the two. To answer this question, we generated two chimeric miRNAs, one fusing the seed of let-7a to the 3′ region of miR-155 (let-7a–miR-155) and the other fusing the seed of miR-155 to the 3′ region of let-7a (miR-155–let-7a) (Figure 5A), and then performed AGO-RBNS using their corresponding seed-mismatched programmed libraries. As done previously with the natural miRNAs, we first determined the pairing and offset preferences of both chimeric miRNAs by summing over all 18 seed-mismatch types, measuring the KD fold change for each range of pairing and offsets possible in the libraries, and fitting a multiplicative model of pairing and offset-preferences to the resultant 1,181 and 934 measured affinity values for let-7a–miR-155 (B) and miR-155–let-7a (C).
Both of the chimeric miRNAs had 3′-pairing and offset preferences that were remarkably similar to those of the natural miRNAs containing the same 3′ sequences (B) and (C), and (Figure 5A and C). Indeed, comparison for each chimeric miRNA to its 3′-native sequence revealed a high correspondence of pairing and offset coefficients (D and E), and comparison of each chimeric miRNA to its seed-native miRNAs showed much lower correspondence of the pairing and offset coefficients. (F and G). Furthermore, the fitted slopes for four 3′-native comparisons approached unity (range, 0.80–1.17), which showed that the effect sizes of these preferences were similar regardless of whether the coefficients were derived from chimeric or native miRNA datasets. When analyzing the influence of the 18 seed mismatches on the affinity of 3′ pairing, miRNAs with the same seed sequence but different 3′ sequences had largely similar preferences (H and I, and Figure 5F). The two most prominent exceptions were the increased affinity in the context of a mismatched A at position 7 of the let-7–miR-155 chimeric miRNA (I, left), and the decreased affinity in the context of a mismatched U at position 6 of the miR-155–let-7a chimeric miRNA (I, right). Despite these outliers, the influence of the seed mismatch on the magnitude of 3′-pairing affinity depended primarily on the seed-mismatch type and position, with relatively little dependence on the sequence of the 3′ region.
Figure 6—figure supplement 2
Sequence preferences for 3′ sites are maintained at adjacent positions.
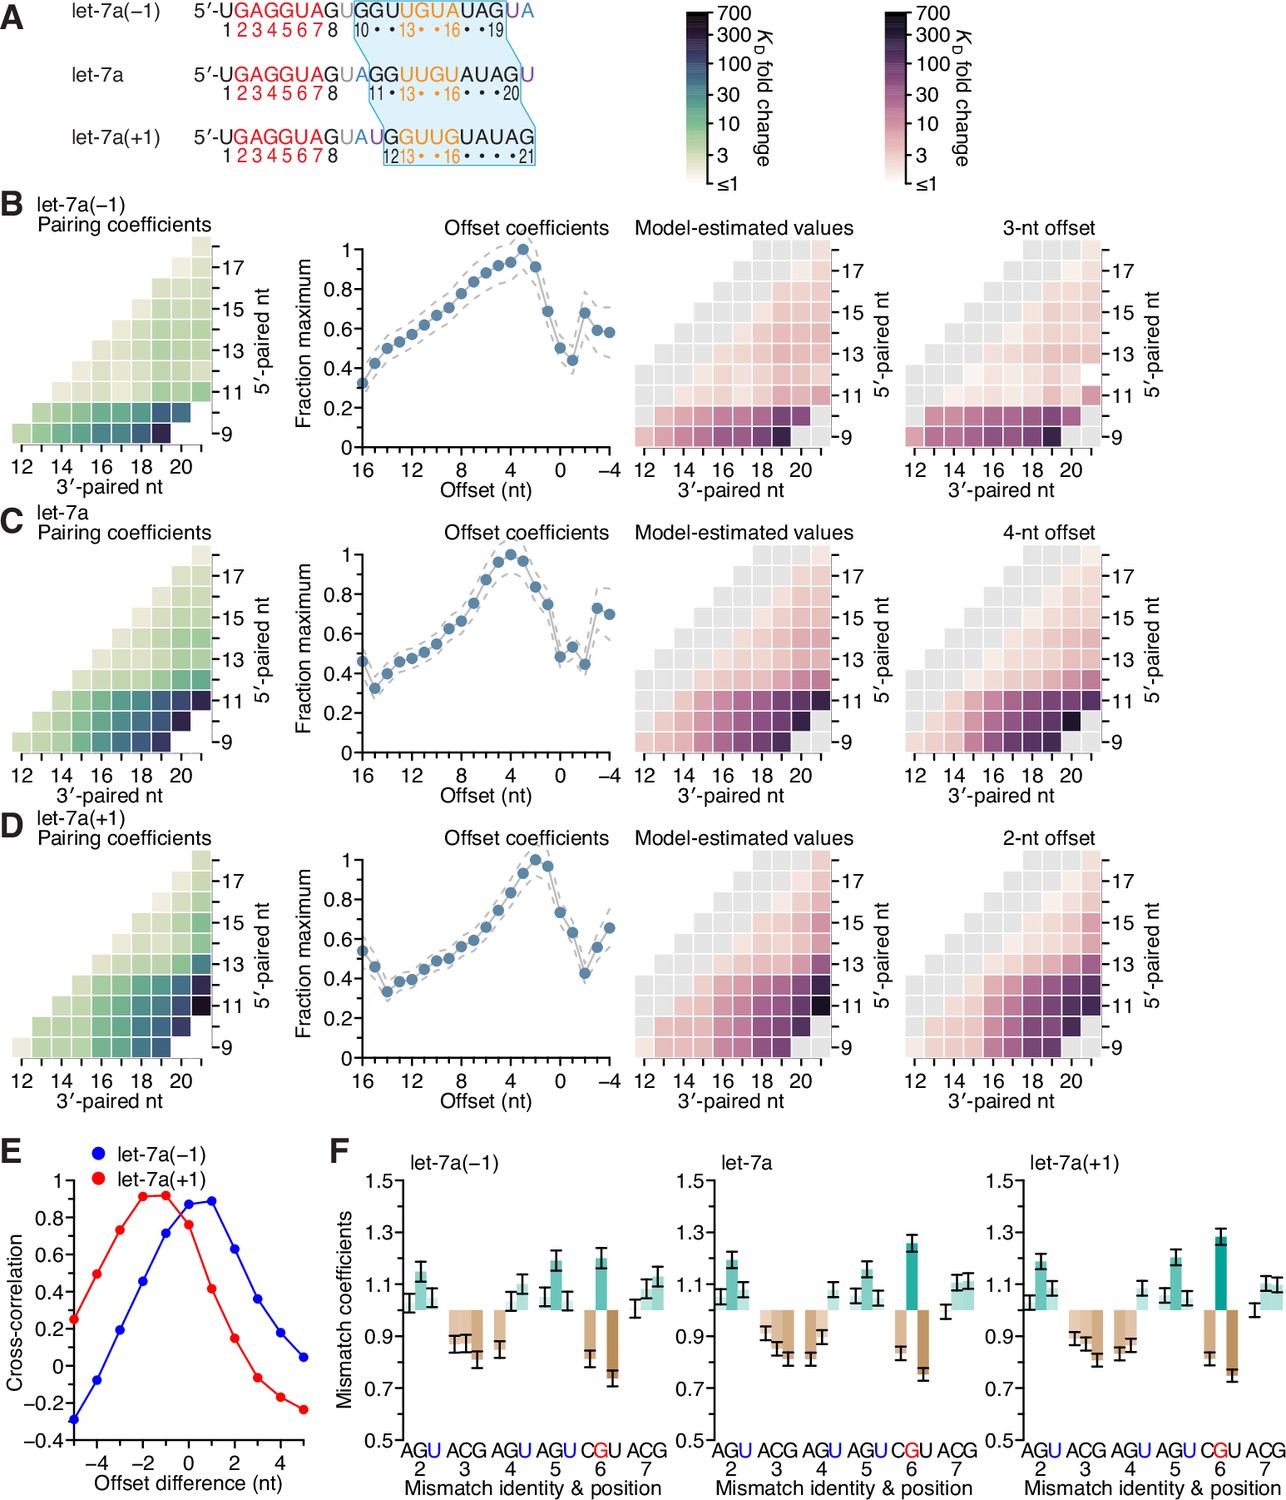
(A, redrawn from Figure 6B) Sequences of let-7a(−1), which has a 3′ region permuted one nucleotide toward the 5′ end, native let-7a, and let-7a(+1), which has a 3′ region permuted one nucleotide toward the 3′ end. The 3′ sequence shared between all three miRNAs is shaded in blue, and the A and U nucleotides that were rearranged to generate the permuted variants are in blue and purple, respectively. (B–D) Pairing and offset coefficients describing the 3′-compensatory pairing of let-7a(−1) (B), let-7a (C, redrawn from Figure 5A, for comparison), and let-7a(+1) (D). Otherwise, this panel is as in Figure 5A. (E) Cross-correlations of offset coefficients for either let-7a(−1) (blue) or let-7a(+1) (red) with respect to those of let-7a (B and C, middle-left), plotted as a function of the difference in offset. (F) Effects of seed mismatches on 3′-pairing affinities of let-7a(−1) (left), let-7a (middle, redrawn from Figure 5F, for comparison), and let-7a(+1) (right). Otherwise, this panel is as in Figure 5F.
To investigate the extent to which the positional dependencies of 3′-pairing affinity were dependent on the positions themselves rather than the sequence at these positions, we generated 3′-pairing profiles of let-7a variants that shifted the native let-7a 3′ sequence by a single nucleotide in either direction (let-7a(−1) and let-7a(+1)) while maintaining the miRNA length (A). Comparison of the pairing preferences of let-7a(−1) and let-7a(+1) showed corresponding shifts of the pairing coefficients, such that the characteristic benefit of pairing to the G found at nucleotide 11 of the native miRNA was maintained in both variants. Thus, the most consequential nucleotide shifted to 10 when this G shifted to position 10 in let-7a(−1), and likewise, it shifted to 12 for let-7a(+1) (B–D).
The offset preference of let-7a(+1) was between +2 and +3 nt, which corresponded to a 1- to 2-nt shift compared to the +4-nt offset preference of let-7a (E). These results supported the idea that fewer nucleotides were required to bridge the seed and 3′ pairing when the 3′ pairing started at position 12 rather than position 11. The offset preference of let-7a(−1) shifted between 0 and +1 nt, which indicated that a target loop length of 6 nt was sufficient for inclusion of the centrally located GG dinucleotide within the 3′ pairing, regardless of whether this dinucleotide resided at positions 10 and 11 or at positions 11 and 12. Moreover, the seed mismatch preferences of both let-7a derivatives were nearly identical to those of the native let-7a (F; r2 = 0.91 and 0.99 for let-7a(−1) and let-7a(+1), respectively). Considered together, these results provided further evidence of the independent effects of the seed and 3′ region on 3′ pairing, with the behavior of the 3′ region depending on both position and sequence, with sequence preferences transferable to nearby positions, especially if compensating changes to the offset optimize the length of the target segment bridging the seed and 3′ pairing.
Figure 7 with 2 supplements
The impact of mismatched, bulged, and deleted target nucleotides on 3′-compensatory pairing.
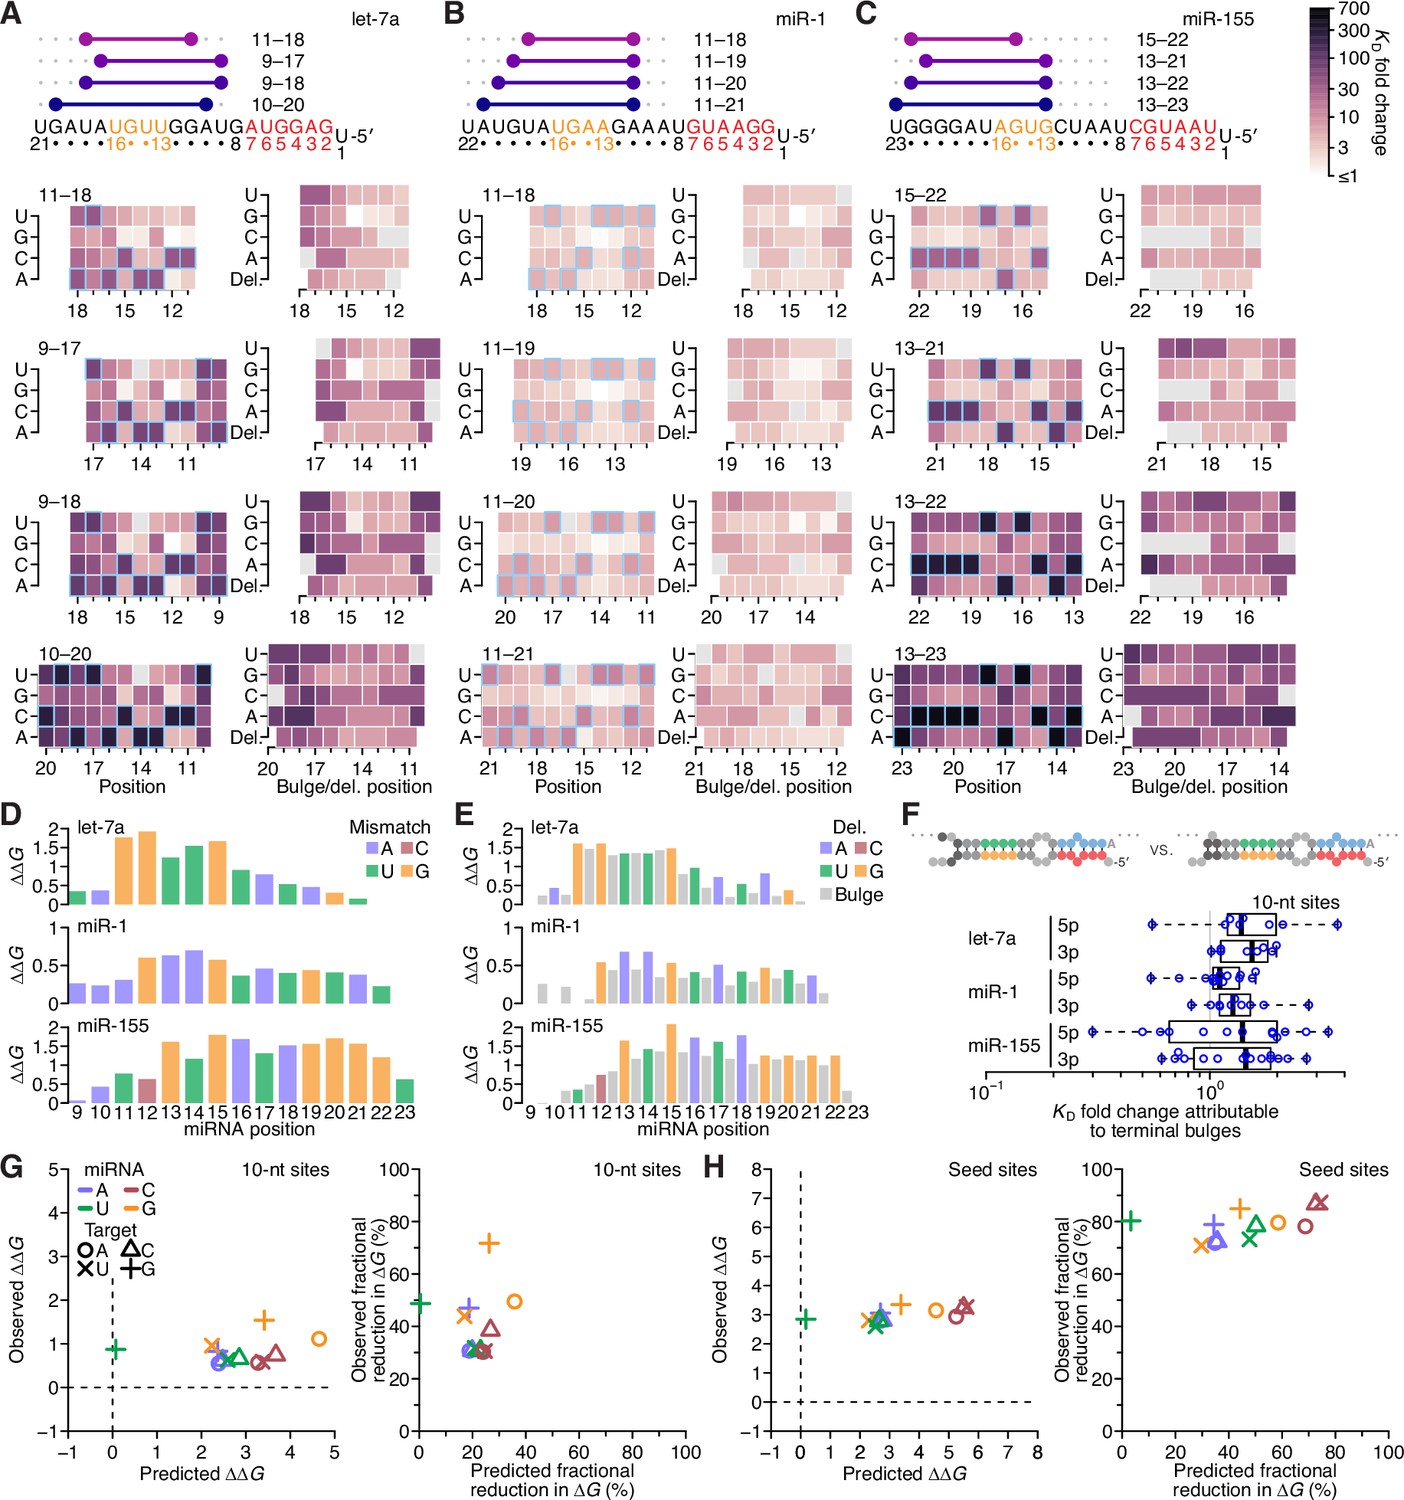
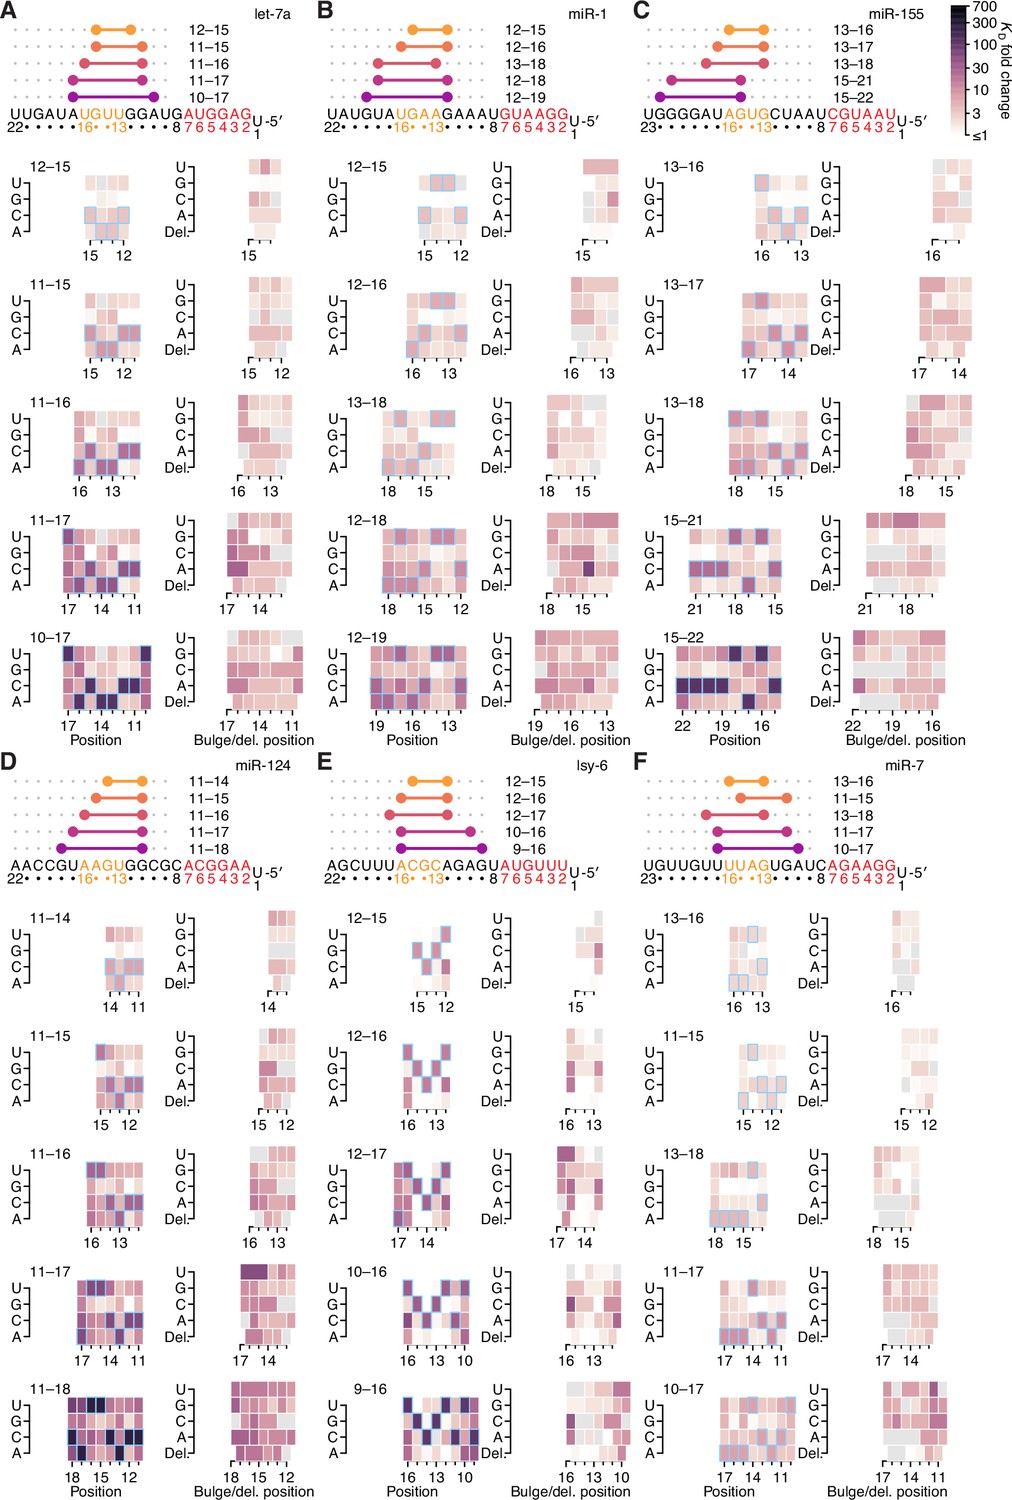
(A) The effect of mismatched, bulged, and deleted target nucleotides on 3′-compensatory pairing to let-7a. At the top is a schematic depicting the position of highest-affinity 3′-pairing for 3′ sites of lengths 8–11 nt, redrawn from Figure 2B. Below, at the left are heat maps corresponding to each of the pairing positions shown above, indicating the affinities with each of the four possible nucleotides at each position of the site. Cells corresponding to the Watson–Crick match are outlined in blue. Cells for affinities of mismatches that could not be calculated due to sequence similarity to another site type (e.g., the mismatched U across from position 14, which was indistinguishable from a 6mer-m8 seed site) are in gray. To the right are heat maps that correspond to the same pairing ranges but indicate the effects of a bulged or a deleted (del.) 3′-target nucleotide. A bulged nucleotide at position n corresponded to an extra target nucleotide inserted between the nucleotides pairing to miRNA positions n – 1 and n. (B and C) The effects of mismatched, bulged, and deleted target nucleotides on 3′-compensatory pairing to miR-1 (B) and miR-155 (C). Otherwise, these panels are as in (A). (D) Profiles of 3′-pairing mismatch tolerances. Each bar represents the ∆∆G value when averaging over the three possible mismatches at that position, for let-7a (top), miR-1 (middle), and miR-155 (bottom). Each of the mismatch ∆∆G values was an average of the values observed in the context of each 10-nt 3′ site that included the position. The color indicates whether the miRNA nucleotide was an A (blue), U (green), C (red), or G (yellow). (E) Profiles of tolerances to bulged and deleted nucleotides. Each colored bar represents the ∆∆G value when deleting the target nucleotide complementary to the miRNA at that position, and each dark gray bar represents the ∆∆G value when averaging all four bulged nucleotide possibilities occurring at that inter-nucleotide position, for let-7a (top), miR-1 (middle), and miR-155 (bottom). Each of the ∆∆G values represents the average of the values observed in the context of each 10-nt 3′ site that included the position. The color of each bar corresponding to a deletion indicates whether the resulting bulged miRNA nucleotide was an A (blue), U (green), C (red), or G (yellow). (F) The tolerance of bulged nucleotides near the ends of 3′ sites. Plotted are ratios of KD fold-changes comparing a site that has a bulged nucleotide between the penultimate and terminal base pairs with a site that does not have the terminal base pair (in which case, the bulged nucleotide in the former pairing architecture becomes a terminal mismatch). The box plots indicate the minimum, lower-quartile, median, upper-quartile, and maximum values. For each of the three miRNAs, comparisons are made for bulges occurring at the 5′ end of the 3′ pairing (5p), and at the 3′ end of the 3′ pairing (3p). The vertical gray line indicates a KD fold-change ratio of 1.0. At the top is an example of a 3p comparison. (G) Comparison of the measured mismatch ∆∆G values in 3′ sites with values predicted by nearest-neighbor rules. Left, comparison of the average measured ∆∆G value with the average predicted value for each of the 12 possible miRNA–target mismatch combinations. Right, comparison of measured and predicted average fractional reduction in ∆G attributed to each mismatch. The fractional reduction was given by (∆GWC − ∆Gmm)/∆GWC, where ∆GWC corresponds to the ∆G of the site with full Watson–Crick pairing, and ∆Gmm corresponds to the ∆G of a site containing the mismatch. These average values were calculated using KD fold-change values determined for 10-nt sites, first averaging results for the same position over all 10-nt sites that included the position, then averaging results for that mismatch across all positions of the miRNA that had that mismatch, and then averaging the results across all three miRNAs. Colors and symbols indicate miRNA and target nucleotide identities, respectively (key). (H) Comparison of the measured seed mismatch ∆∆G values with values predicted by nearest-neighbor rules. For each mismatch type, both the measured and predicted ∆∆G values were the average over all occurrences within positions 2–7 for let-7a, miR-1, miR-155, miR-124, lsy-6, and miR-7, using relative KD values from analyses of random-sequence AGO-RBNS results. Otherwise, this panel is as in (G).
Figure 7—figure supplement 1

Further analyses of the impact of mismatched, bulged, and deleted target nucleotides on 3′-compensatory pairing.
(A–C) The effect of mismatched, bulged, and deleted target nucleotides on 3′-compensatory pairing to let-7a (A), miR-1 (B), and miR-155 (C), in the context of the optimal sites of lengths 4–7 nt for each miRNA. Otherwise, these panels are as in Figure 7A. (D) Profile of mismatch tolerances of sites analogous to those of C. elegans lin-41. Each bar represents the ∆∆G value of a particular mismatch and position, in the context of a site with contiguous pairing from positions 11–19 of let-7a and an offset of +1 nt. Error bars indicate 95% confidence intervals, and colors indicates whether the target nucleotide was changed to an A (blue), U (green), C (red), or G (yellow). A similar polarity in effects, in which mismatches near position 11 are more consequential that those near position 19, is observed when mutating individual let-7 nucleotides in the animal, although the in vivo experiment observes a more stepwise pattern, in which nucleotides 11, 12, and 13 are each critical for viability, nucleotides 14, 15, and 16 each have intermediate importance, and nucleotides 17, 18, and 19 each have no detectable importance (Duan et al., 2021). This difference might be attributable to the differences between in vitro affinity and in vivo phenotype, as observed to some degree in our let-7a reporter experiment (Figure 3C). Other possible explanations include differences between human and nematode, and the different mismatches examined in the two studies, with our study creating mismatches by changing the nucleotide in the target site and the other study creating a different mismatch by changing the nucleotide in the miRNA.
Figure 7—figure supplement 2
The impact of mismatched, bulged, and deleted target nucleotides on 3′-compensatory pairing in random-sequence AGO-RBNS experiments.
(A–F) The effect of mismatched, bulged, and deleted target nucleotides on 3′-compensatory pairing to let-7a (A), miR-1 (B), and miR-155 (C), miR-124 (D), lsy-6 (E), and miR-7 (F), in the context of the optimal sites 4–8 nt in length for each miRNA, using data from previously reported random-sequence AGO-RBNS experiments. Otherwise, these panels are as in Figure 7A.
Additional files
-
Supplementary file 1
Library of DNA sequences used for let-7a massively parallel reporter assay.
- https://cdn.elifesciences.org/articles/69803/elife-69803-supp1-v2.xlsx
-
Supplementary file 2
Oligonucleotides used in this study.
- https://cdn.elifesciences.org/articles/69803/elife-69803-supp2-v2.xlsx
-
Transparent reporting form
- https://cdn.elifesciences.org/articles/69803/elife-69803-transrepform1-v2.docx
Download links
A two-part list of links to download the article, or parts of the article, in various formats.
Downloads (link to download the article as PDF)
Open citations (links to open the citations from this article in various online reference manager services)
Cite this article (links to download the citations from this article in formats compatible with various reference manager tools)
MicroRNA 3′-compensatory pairing occurs through two binding modes, with affinity shaped by nucleotide identity and position
eLife 11:e69803.
https://doi.org/10.7554/eLife.69803


