Fascin limits Myosin activity within Drosophila border cells to control substrate stiffness and promote migration
- Anatomy and Cell Biology, University of Iowa Carver College of Medicine, United States
- Department of Chemistry, University of Iowa, United States
Figures
Figure 1
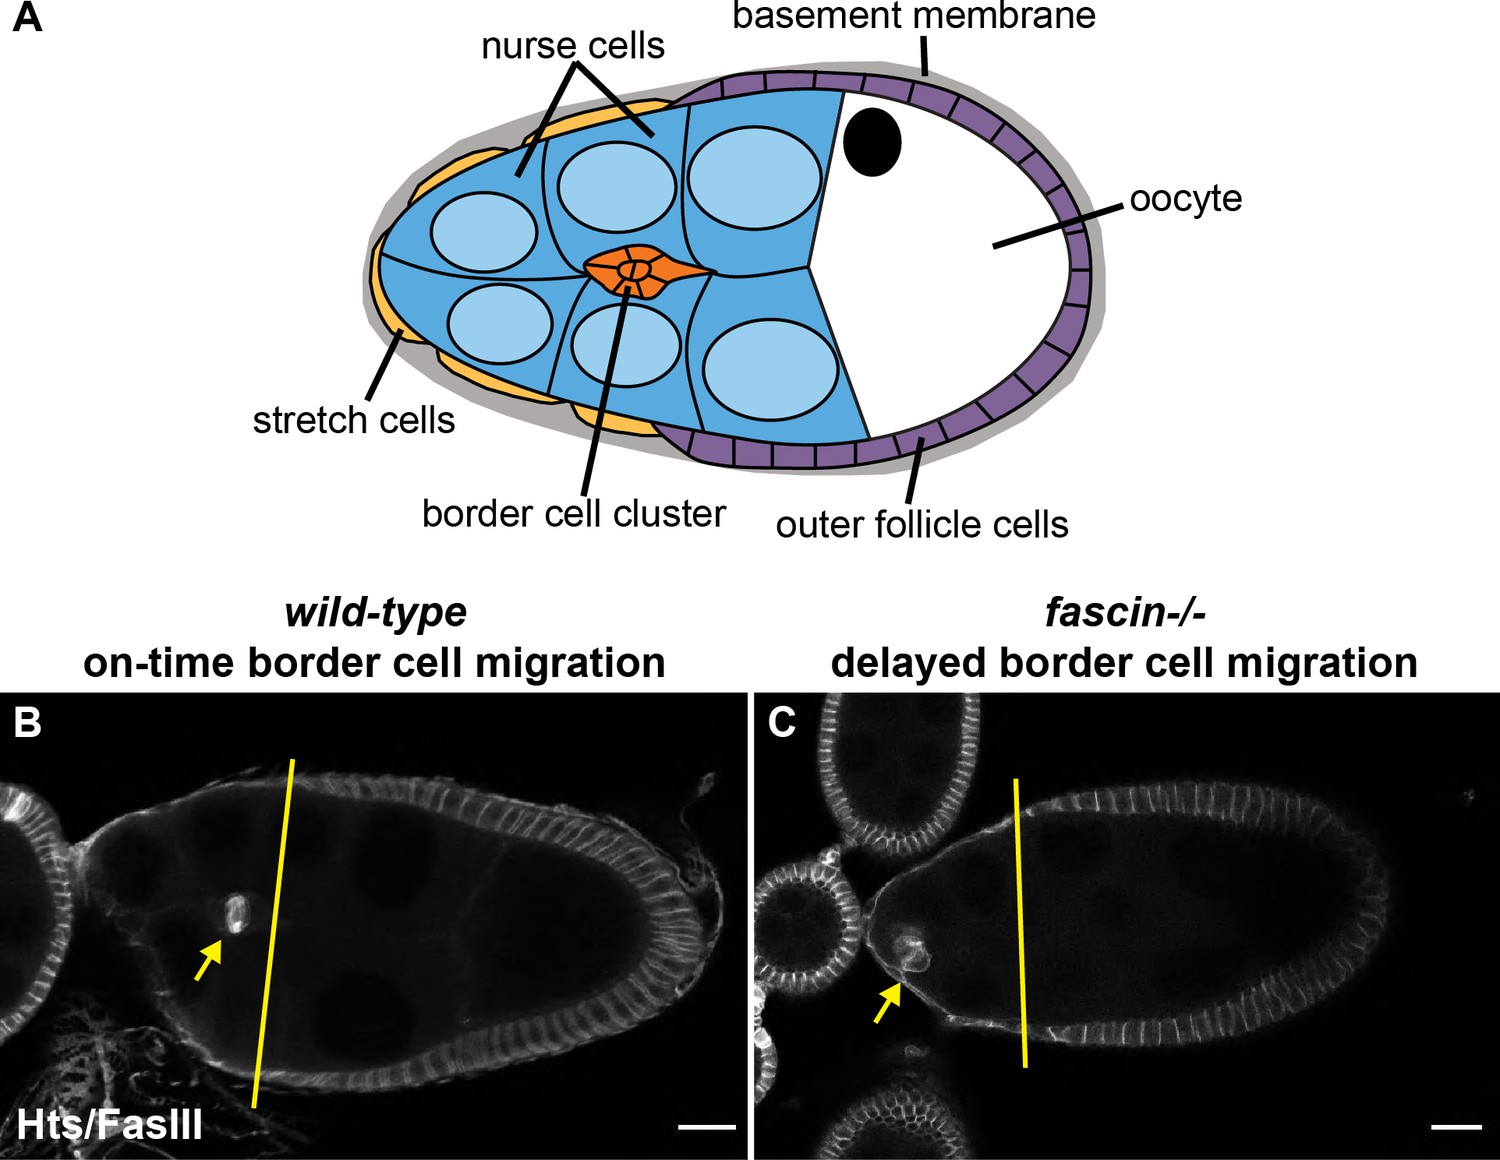
Fascin is required for on-time border cell migration during Stage 9.
(A) Schematic of a Stage 9 Drosophila follicle. The nurse cells (blue) are the substrate for the migrating border cell cluster (orange); the direction of border cell migration is to the right. The follicle is surrounded by a layer of somatic epithelial cells which include the outer follicle cells (purple) and the stretch cells (gold). These cells are surrounded by a layer of basement membrane (grey). (B–C). Maximum projections of 2–4 confocal slices of Stage 9 follicles of the indicated genotypes. Border cell stain (Hts/FasIII, white). (B) wild-type (yw). (C) fascin-null (fascinsn28/sn28). Yellow lines indicate the position of the outer follicle cells and the yellow arrows indicate the position of the border cell cluster. In wild-type follicles, the border cells are in line with the position of the outer follicle cells (B), whereas in fascin mutant follicles the border cells are significantly behind the outer follicle cells, indicating that loss of Fascin results in delayed border cell migration during Stage 9 of oogenesis (C). All genotypes are listed in Table 1.
Figure 2 with 1 supplement

Fascin limits Myosin activity in the Stage 9 Drosophila follicle.
(A-B’’) Maximum projections of 2–4 confocal slices of Stage 9 follicles of the indicated genotypes. (A-A’, B-B’) phospho-MRLC (pMRLC, white). (A’’, B’’) pMRLC pseudocolored with Rainbow RGB, red = highest intensity pixels. (A-A’’) wild-type (yw). (B-B’’) fascin-null (fascinsn28/sn28). Samples were stained in the same tube. Blue arrows = pMRLC enrichment on nurse cells. Orange arrows = pMRLC enrichment on border cell cluster. Scale bars = 50 μm in A, B and 10 μm in A’-A’’, B’-B’’. (C–F) Graphs of quantification of pMRLC intensity and localization at the nurse cell membranes (C) and border cell cluster (D, E, F) in wild-type and fascin-null follicles. Each circle represents a follicle. Error bars = SD. ***p < 0.001, ****p < 0.0001 (unpaired t-test). In C, peak pMRLC intensity was quantified at the nurse cell membranes and normalized to phalloidin staining in the same follicle, three measurements were taken per follicle and averaged. In D, pMRLC intensity on the border cell cluster was quantified and normalized to background pMRLC staining in the same follicle. For examples of the quantifications in C and D see Figure 2—figure supplement 1. In E, the number of Myosin puncta per cluster was manually counted. In F, the maximum length of each Myosin puncta was measured. (G-H’’’) Maximum projection of three confocal slices from time-lapse imaging of MRLC-GFP in the indicated genotypes. Direction of migration is to the right. Scale bars = 10 μm. (G-G’’’) Control follicle (fascinsn28/+; MRLC-GFP/+; Video 1). (H-H’’’) fascin-null follicle (fascinsn28/sn28; MRLC-GFP/+; Video 2). (I) Quantification of puncta lifetime from time-lapse imaging for control (n = 4) and fascin-null (n = 4) MRLC-GFP expressing follicles. Puncta lifetime was defined as the amount of time elapsed from when a punctum first appeared to when it completely disappeared. ****p < 0.0001 (unpaired t-test). Error bars = SD. fascin-null follicles have increased pMRLC on the the nurse cell membranes (B, C) and border cell cluster (B’, D) compared to wild-type follicles (A, A’, C, D). The border cell clusters in fascin-null mutants also have increased Myosin puncta number but decreased length (E, F). fascin mutants have significantly slowed Myosin dynamics (H-H’’’, I) compared to the control clusters (G-G’’’, I). All genotypes are listed in Table 1.
-
Figure 2—source data 1
Source data for Figure 2C-F and I.
- https://cdn.elifesciences.org/articles/69836/elife-69836-fig2-data1-v2.xlsx
Figure 2—figure supplement 1
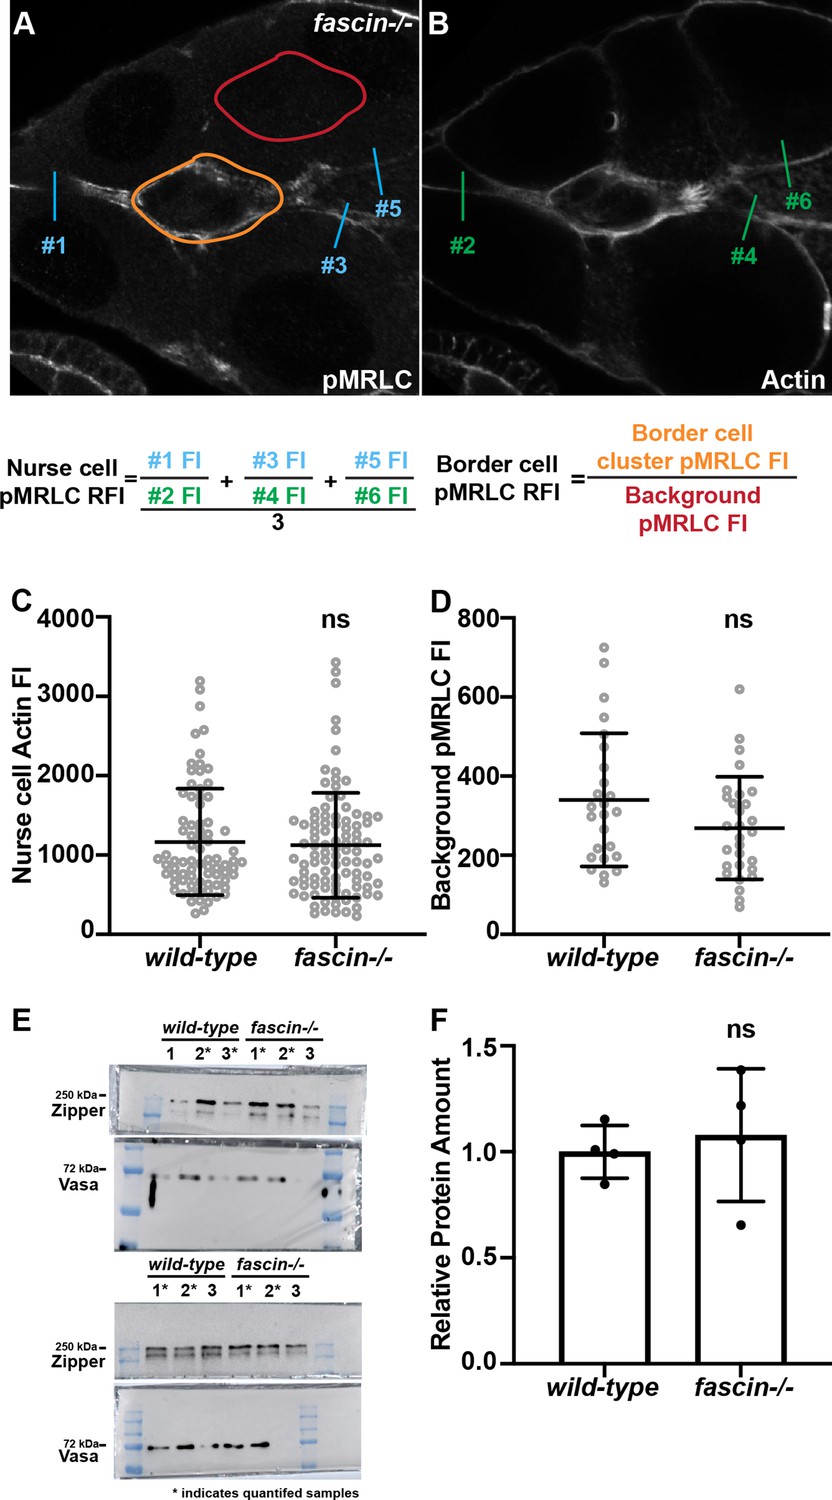
Myosin activity assessments.
(A–B) Maximum projections of 2–4 confocal slices of a Stage 9 fascin-null follicle. (A) phospho-MRLC (pMRLC, white) (B) Actin (Phalloidin, white). The blue (A) and green (B) lines indicate the lines drawn across nurse cell-nurse cell boundaries to measure the pMRLC and Actin fluorescence intensity (FI) values, respectively. The pMRLC FI was divided by the Actin FI from the same location and three measurements were taken per follicle and averaged to generate the Nurse cell pMRLC RFI measurement. The orange circle is an example of the circle drawn around the border cell cluster to measure the pMRLC FI of the border cell cluster. The red circle is the same size and shape as the orange circle but measures the pMRLC FI of the nurse cell cytoplasm; this is the background pMRLC FI. The border cell pMRLC FI value is then divided by the background FI to give the Border cell pMRLC RFI measurement. (C) Graph of all the peak Actin FI measurements (green lines) used to calculate the Nurse cell pMRLC RFI for both wild-type (yw) and fascin-/- (fascinsn28/sn28) follicles. Error bars = SD. ns indicates p > 0.05 (unpaired t-test). (D) Graph of the background nurse cell cytoplasm pMRLC FI measurements (red circle) used to calculate the Border cell pMRLC RFI for both wild-type (yw) and fascin-/- (fascinsn28/sn28) follicles. Error bars = SD. ns indicates p > 0.05 (unpaired t-test). (E, F) Western blots and quantification for Zipper (Drosophila Myosin heavy chain) levels for the indicated genotypes. Vasa was used as a loading control and Zipper protein levels were normalized to Vasa. Only samples labeled with an * were used in the quantification due to loading control issues. Entire blots are displayed, blots were cut prior to primary antibody incubation. There is no significant difference between the the peak Actin FI (C), nurse cell cytoplasmic pMRLC FI (D), or Zipper protein levels (E, F) between wild-type and fascin-/- follicles. All genotypes are listed in Table 1.
-
Figure 2—figure supplement 1—source data 1
Source data for Figure 2—figure supplement 1C, D and F.
- https://cdn.elifesciences.org/articles/69836/elife-69836-fig2-figsupp1-data1-v2.xlsx
-
Figure 2—figure supplement 1—source data 2
Source data for Figure 2—figure supplement 1E.
- https://cdn.elifesciences.org/articles/69836/elife-69836-fig2-figsupp1-data2-v2.zip
Figure 3
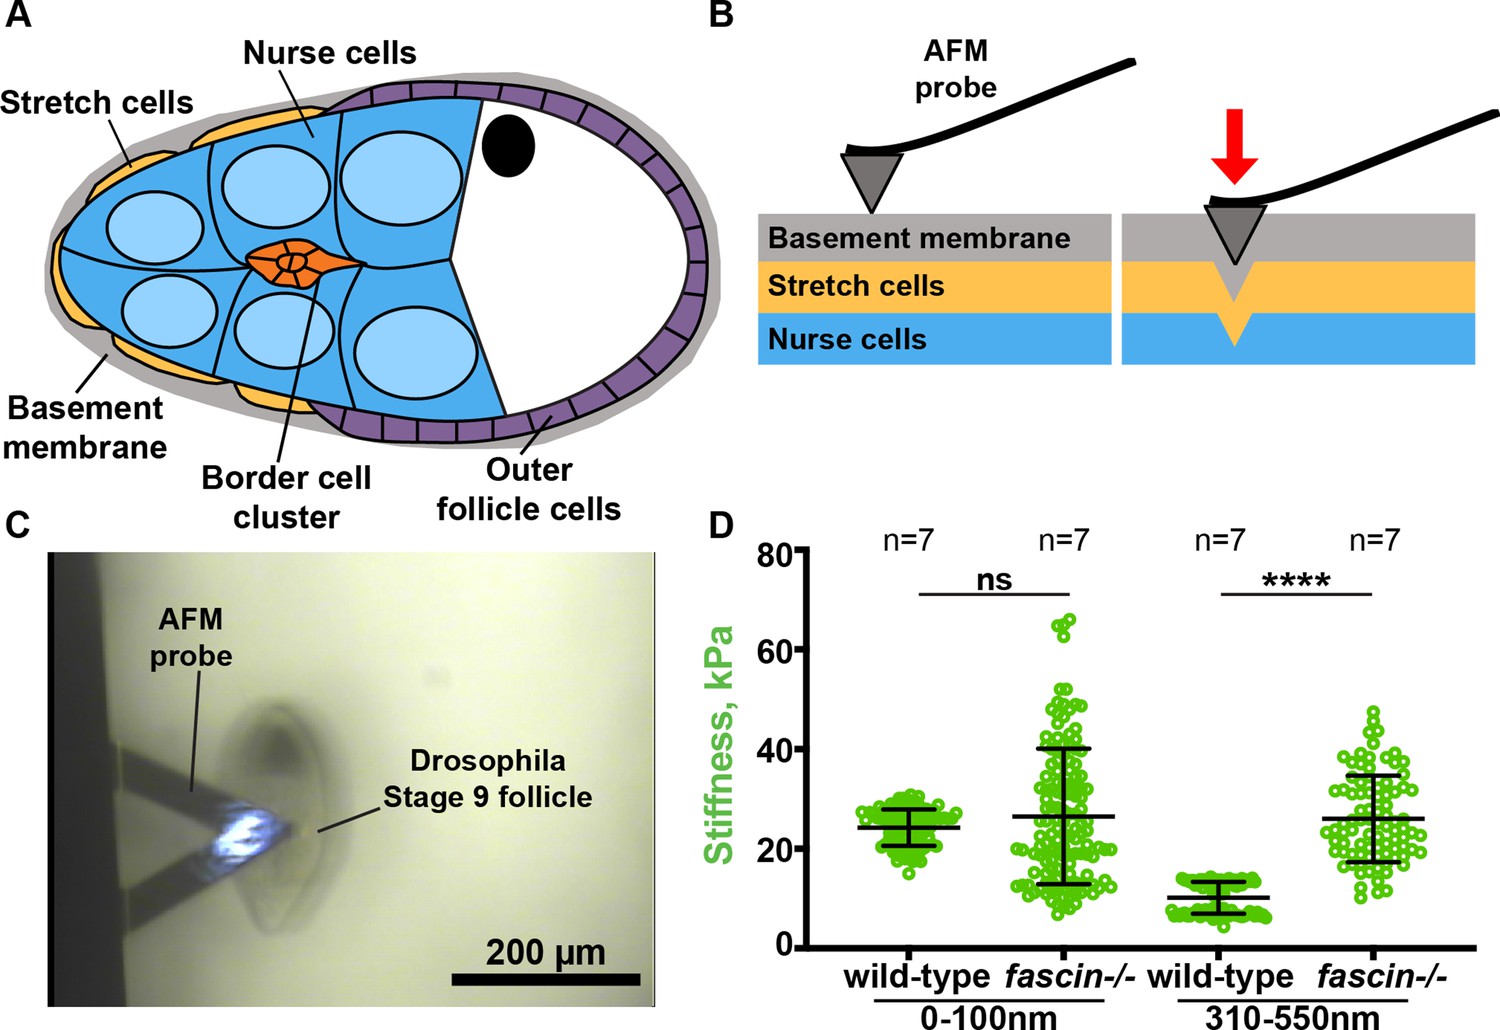
Fascin regulates nurse cell stiffness in the Drosophila follicle.
(A) Schematic of Stage 9 Drosophila follicle. The nurse cells (blue) are surrounded by a layer of stretch cells (gold) and basement membrane (gray). (B) Schematic of AFM probe indentation through the basement membrane (gray) and stretch cells (gold) into the underlying nurse cells (blue). (C) Bright-field image of AFM probe over a Stage 9 follicle. (D) Graph of nurse cell stiffness (kPa) in wild-type or fascin-null follicles as measured by AFM. Each circle represents a single indentation. Error bars = SD. ns indicates p > 0.05, ****p < 0.0001 (unpaired t-test). Loss of Fascin significantly increases the stiffness of the nurse cells (D). All genotypes are listed in Table 1.
-
Figure 3—source data 1
Source data Figure 3F.
- https://cdn.elifesciences.org/articles/69836/elife-69836-fig3-data1-v2.xlsx
Figure 4 with 1 supplement

Reducing Myosin activity rescues border cell migration in fascin mutant follicles.
(A) Schematics of the migration index quantification for on-time and delayed border cell migration during Stage 9. The migration index is the distance the border cell cluster has migrated (green line) divided by the distance of the outer follicle cells from the anterior end of the follicle (magenta line). A value of ~1 indicates on-time migration, a value <1 indicates delayed migration and a value >1 indicates accelerated migration. (B–F) Maximum projections of 2–4 confocal slices of Stage 9 follicles of the indicated genotypes. Merged images: Hts/FasIII (magenta, border cell migration stain), phalloidin (white), and DAPI (cyan). Yellow lines = outer follicle cell distance. Yellow arrows = border cell cluster. Black boxes have been added behind text. Scale bars = 20 μm. (B) wild-type (yw) treated with control S9 media + vehicle (DMSO). (C) fascin-/- (fascinsn28/sn28) treated with control S9 media + vehicle. (D) fascin-/- (fascinsn28/sn28) treated with 200 µM of Y-27632. (E) fascinsn28/sn28; oskar GAL4 (2)/+ (F) fascinsn28/sn28; oskar GAL4 (2)/MRLC-RNAi. (G, H) Migration index quantification of the indicated genotypes. Dotted line at 1 = on time migration. Circle = Stage 9 follicle. Lines = averages and error bars = SD. ns indicates p > 0.05, *p< 0.05, **p < 0.01 (one-way ANOVA with Tukey’s multiple comparison test). Pharmacological inhibition of Myosin activity rescues border cell migration delays in fascin mutant follicles (B–D, G). Similarly, germline knockdown of MRLC restores on-time border cell migration in fascin mutants, suggesting that increased active Myosin in the nurse cells of fascin mutants leads to the border cell migration delays (E, F, H). All genotypes are listed in Table 1.
-
Figure 4—source data 1
Source data for Figure 4G, H.
- https://cdn.elifesciences.org/articles/69836/elife-69836-fig4-data1-v2.xlsx
Figure 4—figure supplement 1
Pharmacological inhibition of Myosin and germline MRLC knockdown reduce active Myosin in the follicle.
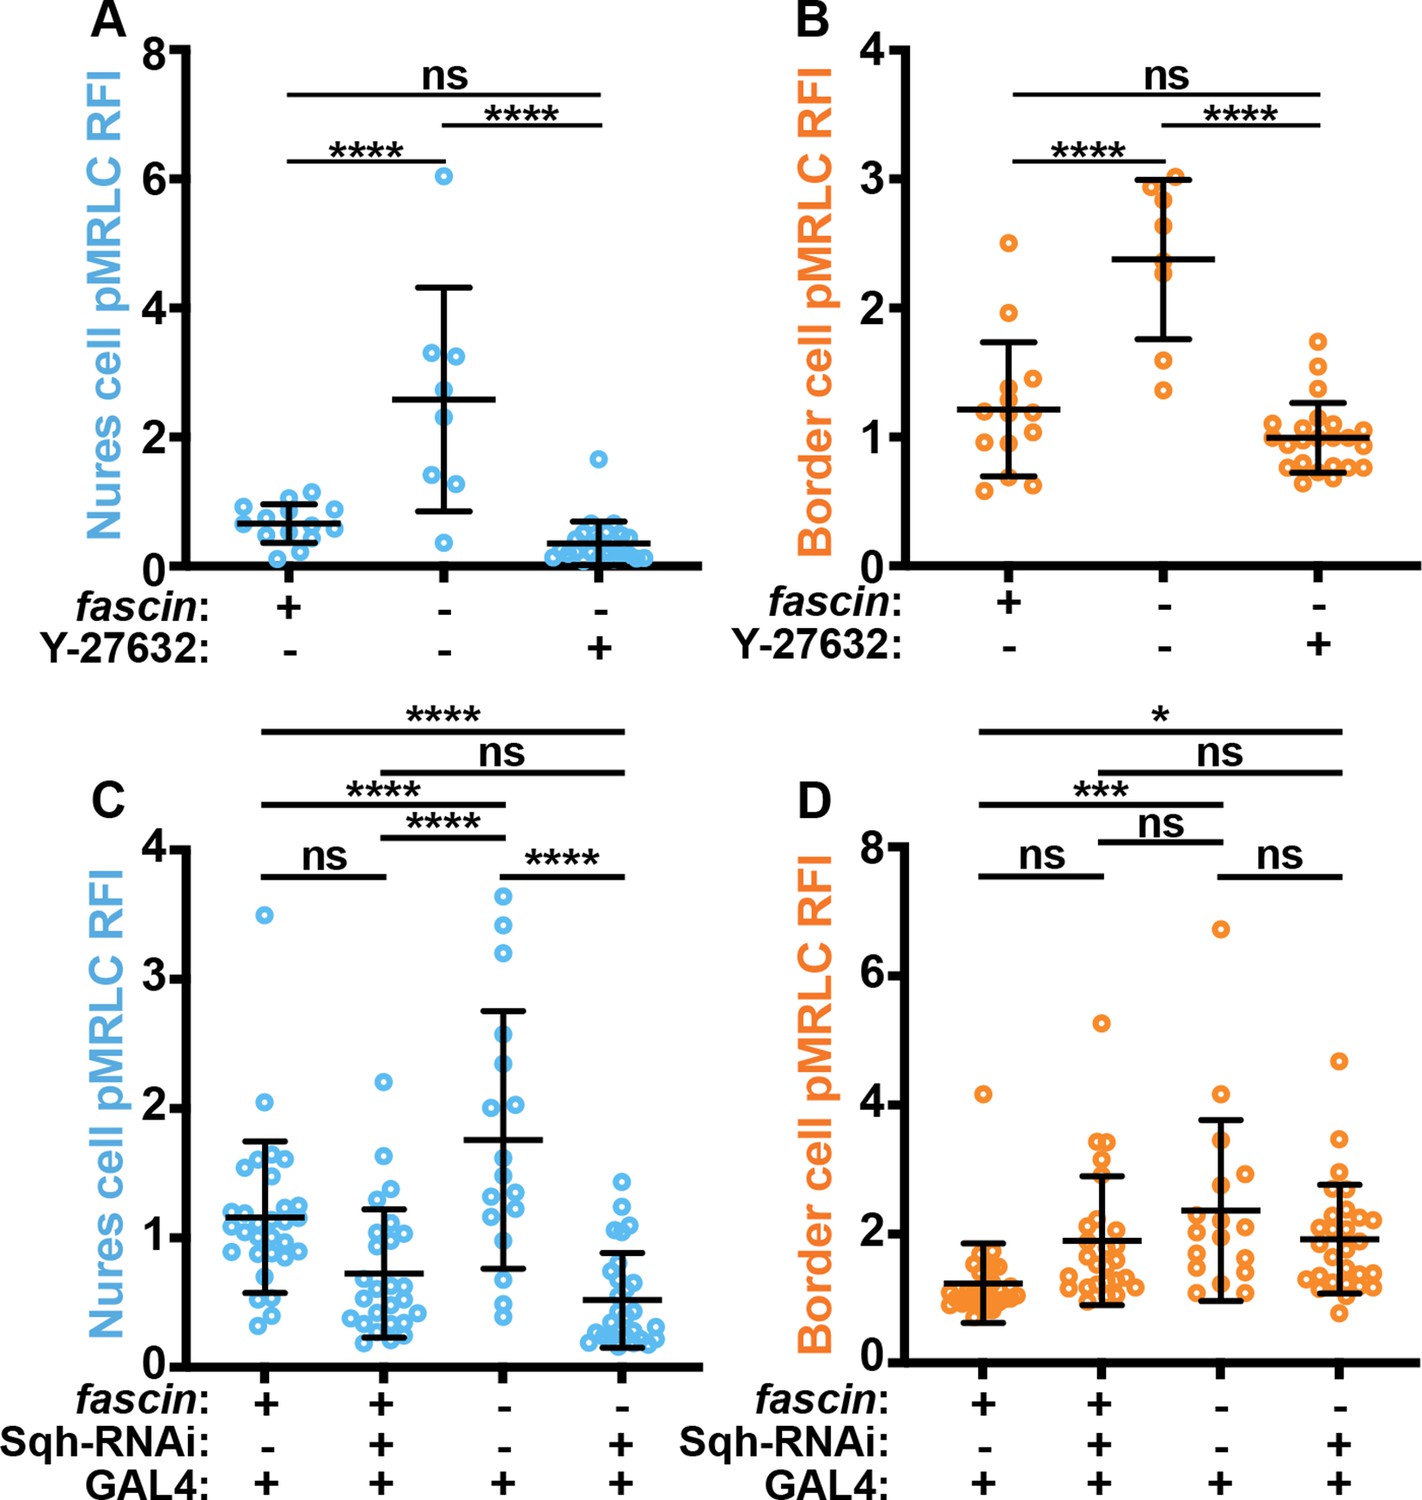
(A–D) Graphs of quantification of pMRLC intensity at the nurse cell membranes (A, C) and border cell cluster (B, D) in the indicated genotypes. Each circle represents a follicle. Error bars = SD. ns indicates p > 0.05, *p < 0.05, ***p < 0.001, ****p < 0.0001 (one-way ANOVA with Tukey’s multiple comparison test). In A, C, peak pMRLC intensity was quantified at the nurse cell membranes and normalized to phalloidin staining in the same follicle, three measurements were taken per follicle and averaged. In B, D, pMRLC intensity on the border cell cluster was quantified and normalized to background staining in the same follicle. Pharmacological inhibition of Myosin reduces active Myosin in the border cells and nurse cells (A, B), while germline knockdown of MRLC reduced activated Myosin on only the nurse cell membranes (C, D). All genotypes are listed in Table 1.
-
Figure 4—figure supplement 1—source data 1
Source data for Figure 4—figure supplement 1A-D.
- https://cdn.elifesciences.org/articles/69836/elife-69836-fig4-figsupp1-data1-v2.xlsx
Figure 5 with 1 supplement
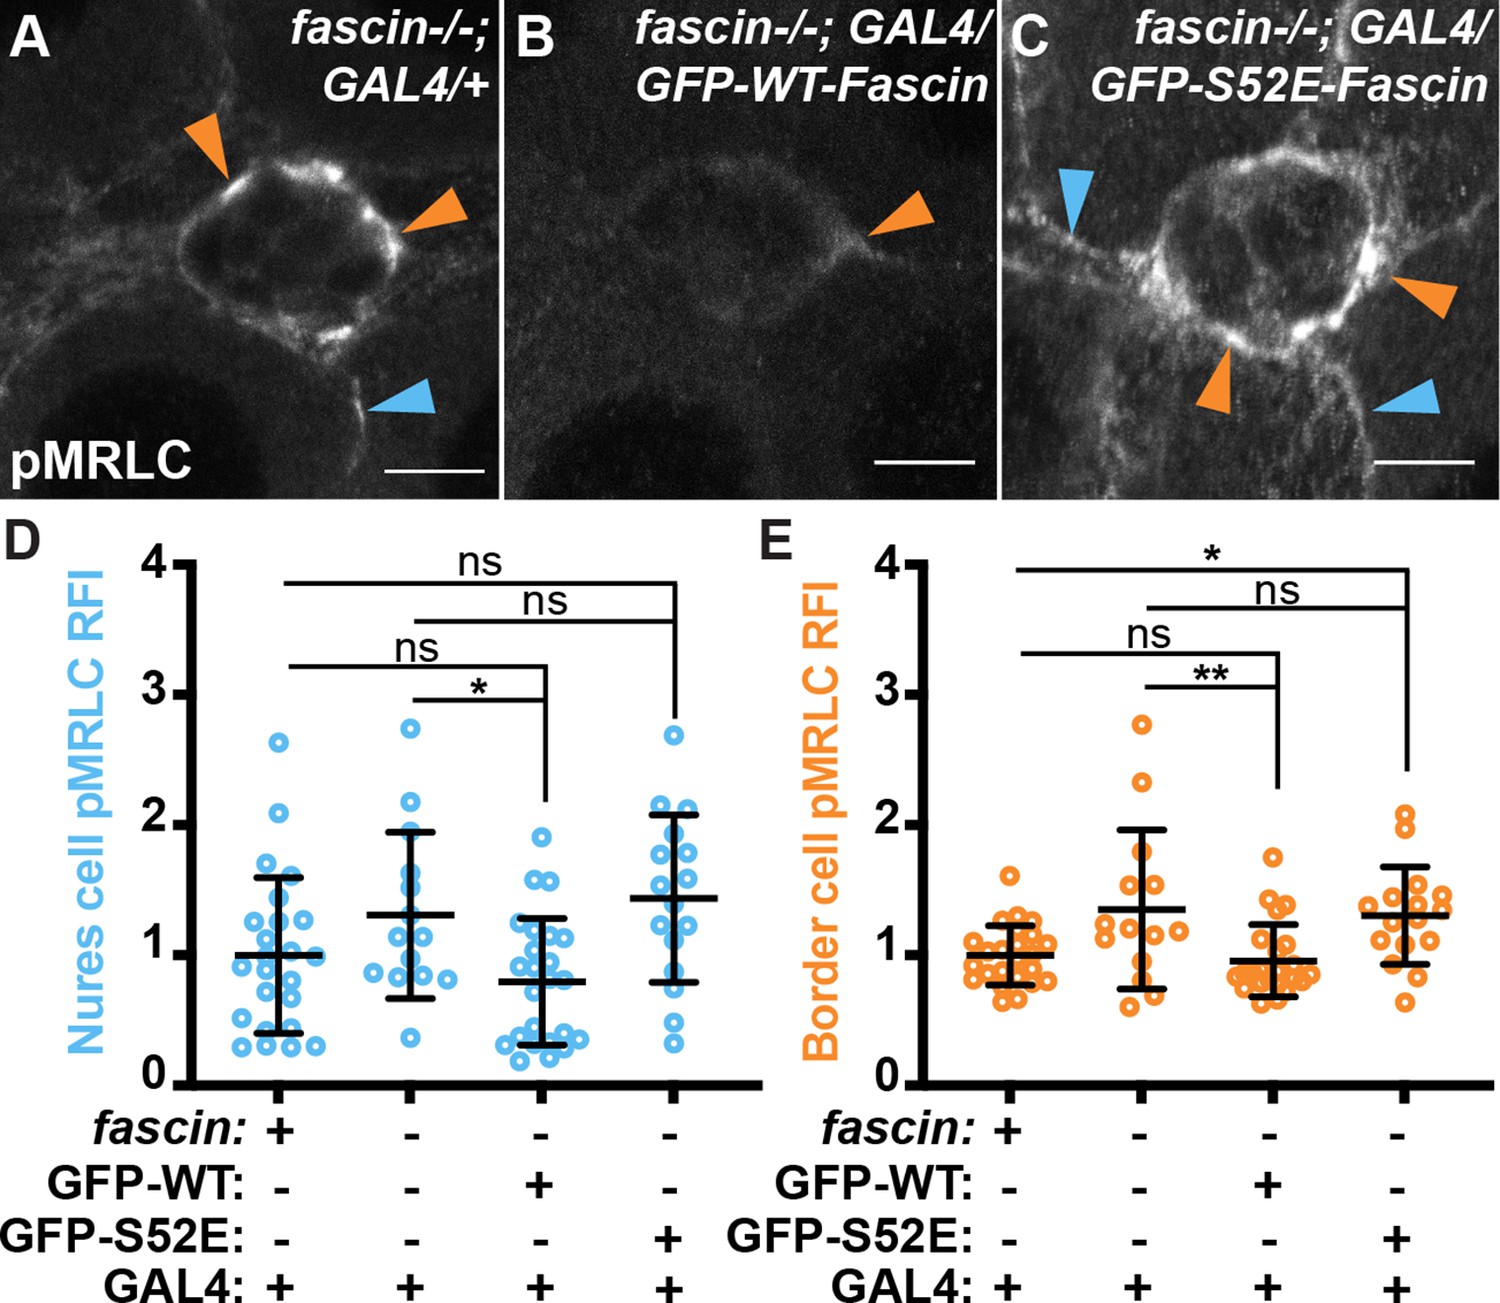
Phosphorylated Fascin fails to limit Myosin activation.
(A–C) Maximum projections of 2–4 confocal slices of Stage 9 follicles of the indicated genotypes stained for phospho-MRLC (pMRLC, white). Blue arrows = pMRLC enrichment on surrounding nurse cells. Orange arrows = pMRLC enrichment on border cell cluster. Scale bars = 10 μm. (A) fascin mutant with global GAL4 (fascinsn28/sn28; actin5c GAL4/+). (B) Global GFP-Fascin expression in fascin mutant (fascinsn28/sn28; actin5c GAL4/UAS-GFP-Fascin). (C) Global GFP-Fascin-S52E expression in fascin mutant (fascinsn28/sn28; actin5c GAL4/UAS-GFP-Fascin-S52E). (D, E) Graphs of quantification of pMRLC intensity at the nurse cell membranes (D) and border cell cluster (E) in the indicated genotypes. Each circle represents a follicle. Error bars = SD. ns indicates p > 0.05, *p < 0.05, **p < 0.01 (One-way ANOVA with Tukey’s multiple comparison test). In D, peak pMRLC intensity was quantified at the nurse cell membranes and normalized to phalloidin staining in the same follicle, three measurements were taken per follicle and averaged. In E, pMRLC intensity on the border cell cluster was quantified and normalized to background staining in the same follicle. Restoring wild-type Fascin expression in both the somatic and germline cells of fascin mutant follicles (B) significantly reduces activated Myosin enrichment on the nurse cell membranes (D) and border cell cluster (E) compared to the fascin-null control (B, D, E). Whereas expressing a phosphomimetic form of Fascin in a fascin mutant (C) does not alter activated Myosin on the nurse cell membranes (D) or border cell cluster (E). All genotypes are listed in Table 1.
-
Figure 5—source data 1
Source data for Figure 5D, E.
- https://cdn.elifesciences.org/articles/69836/elife-69836-fig5-data1-v2.xlsx
Figure 5—figure supplement 1
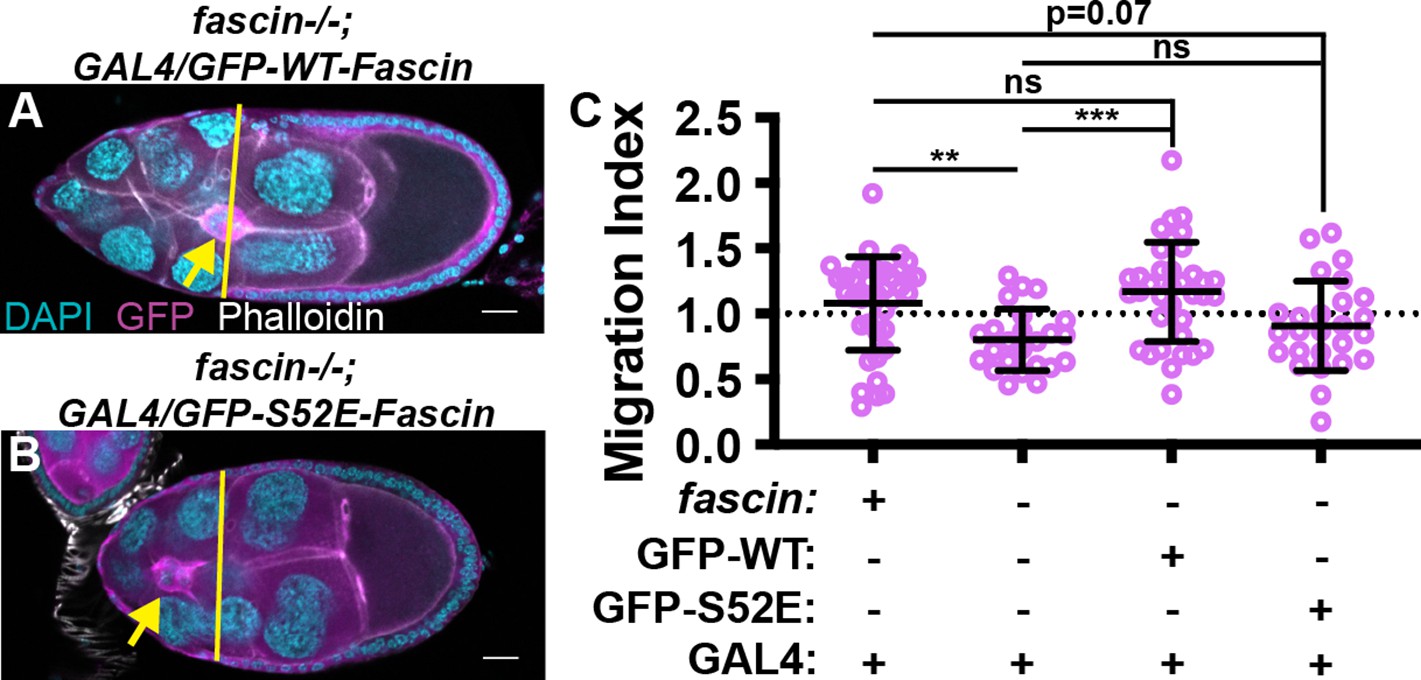
Phosphorylation of Fascin regulates border cell migration.
(A, B) Maximum projections of 2–4 confocal slices of Stage 9 follicles of the indicated genotypes. Merged images: GFP-Fascin (magenta), phalloidin (white), and DAPI (cyan). Yellow lines = outer follicle cell distance. Yellow arrows = border cell cluster. Scale bars = 20 μm. (A) Global GFP-Fascin expression in fascin mutant (fascinsn28/sn28; actin5c GAL4/UAS-GFP-Fascin). (B) Global GFP-Fascin-S52E expression in fascin mutant (fascinsn28/sn28; actin5c GAL4/UAS-GFP-Fascin-S52E). (C) Migration index quantification of the indicated genotypes. Dotted line at 1 = on time migration. Circle = S9 follicle. Lines = averages and error bars = SD. ns indicates p > 0.05, **p < 0.01, ***p < 0.001 (one-way ANOVA with Tukey’s multiple comparison test). Phosphomimetic Fascin expression in fascin mutants partially rescues delays in border cell migration (A–C). All genotypes are listed in Table 1.
-
Figure 5—figure supplement 1—source data 1
Source data Figure 5—figure supplement 1C.
- https://cdn.elifesciences.org/articles/69836/elife-69836-fig5-figsupp1-data1-v2.xlsx
Figure 6
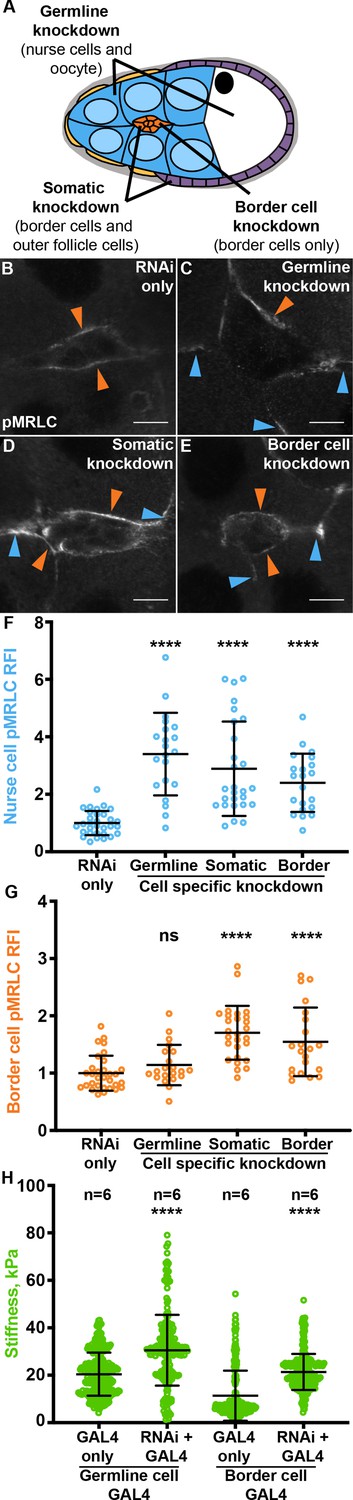
Germline Fascin knockdown increases Myosin activation on the nurse cells while somatic Fascin knockdown increases Myosin activation on both the border and nurse cells.
(A) Schematic of cell-specific Fascin knockdown for each GAL4 driver: germline knockdown will knockdown Fascin in the nurse cells (blue) and oocyte (white), somatic cell knockdown will knockdown Fascin in the border cells (orange) and follicle cells (purple and gold), and the border cell knockdown will knockdown Fascin in only the border cells (orange). (B–E) Maximum projections of 2–4 confocal slices of Stage 9 follicles of the indicated genotypes stained for phospho-MRLC (pMRLC, white). Orange arrows = pMRLC enrichment on border cell cluster. Blue arrows = pMRLC enrichment on surrounding nurse cells. Scale bars = 10 μm. (B) RNAi only (fascin RNAi/+). (C) Germline knockdown of Fascin (matα GAL4(3)/fascin RNAi). (D) Somatic cell knockdown of Fascin (c355 GAL4/+; fascin RNAi/+). (E) Border cell knockdown of Fascin (c306 GAL4/+; fascin RNAi/+). (F, G) Graphs of quantification of pMRLC intensity at the nurse cell membranes (F) and border cell cluster (G) in the indicated genotypes. Each circle represents a follicle. Error bars = SD. ns indicates p > 0.05, ****p < 0.0001 (One-way ANOVA with Tukey’s multiple comparison test). In F, peak pMRLC intensity was quantified at the nurse cell membranes and normalized to phalloidin staining in the same follicle, three measurements were taken per follicle and averaged. In G, pMRLC intensity on the border cell cluster was quantified and normalized to background staining in the same follicle. (H) Graph of nurse cell stiffness (kPa) of the indicated genotypes as measured by AFM. Each circle represents a single indentation. ****p < 0.0001 (unpaired t-test). Error bars = SD. Fascin regulates Myosin activation in the germline (C, F, G) and somatic cells (D, E, F, G). Knockdown of Fascin in the germline cells increases Myosin activity and stiffness of the nurse cells (C, F, H). Knockdown of Fascin in either all somatic cells or only the border cells increases Myosin activity and stiffness of the nurse cells (D, E, F, H), and Myosin activity in the border cell cluster (D, E, G). All genotypes are listed in Table 1.
-
Figure 6—source data 1
Source data for Figure 6F-H.
- https://cdn.elifesciences.org/articles/69836/elife-69836-fig6-data1-v2.xlsx
Figure 7 with 1 supplement
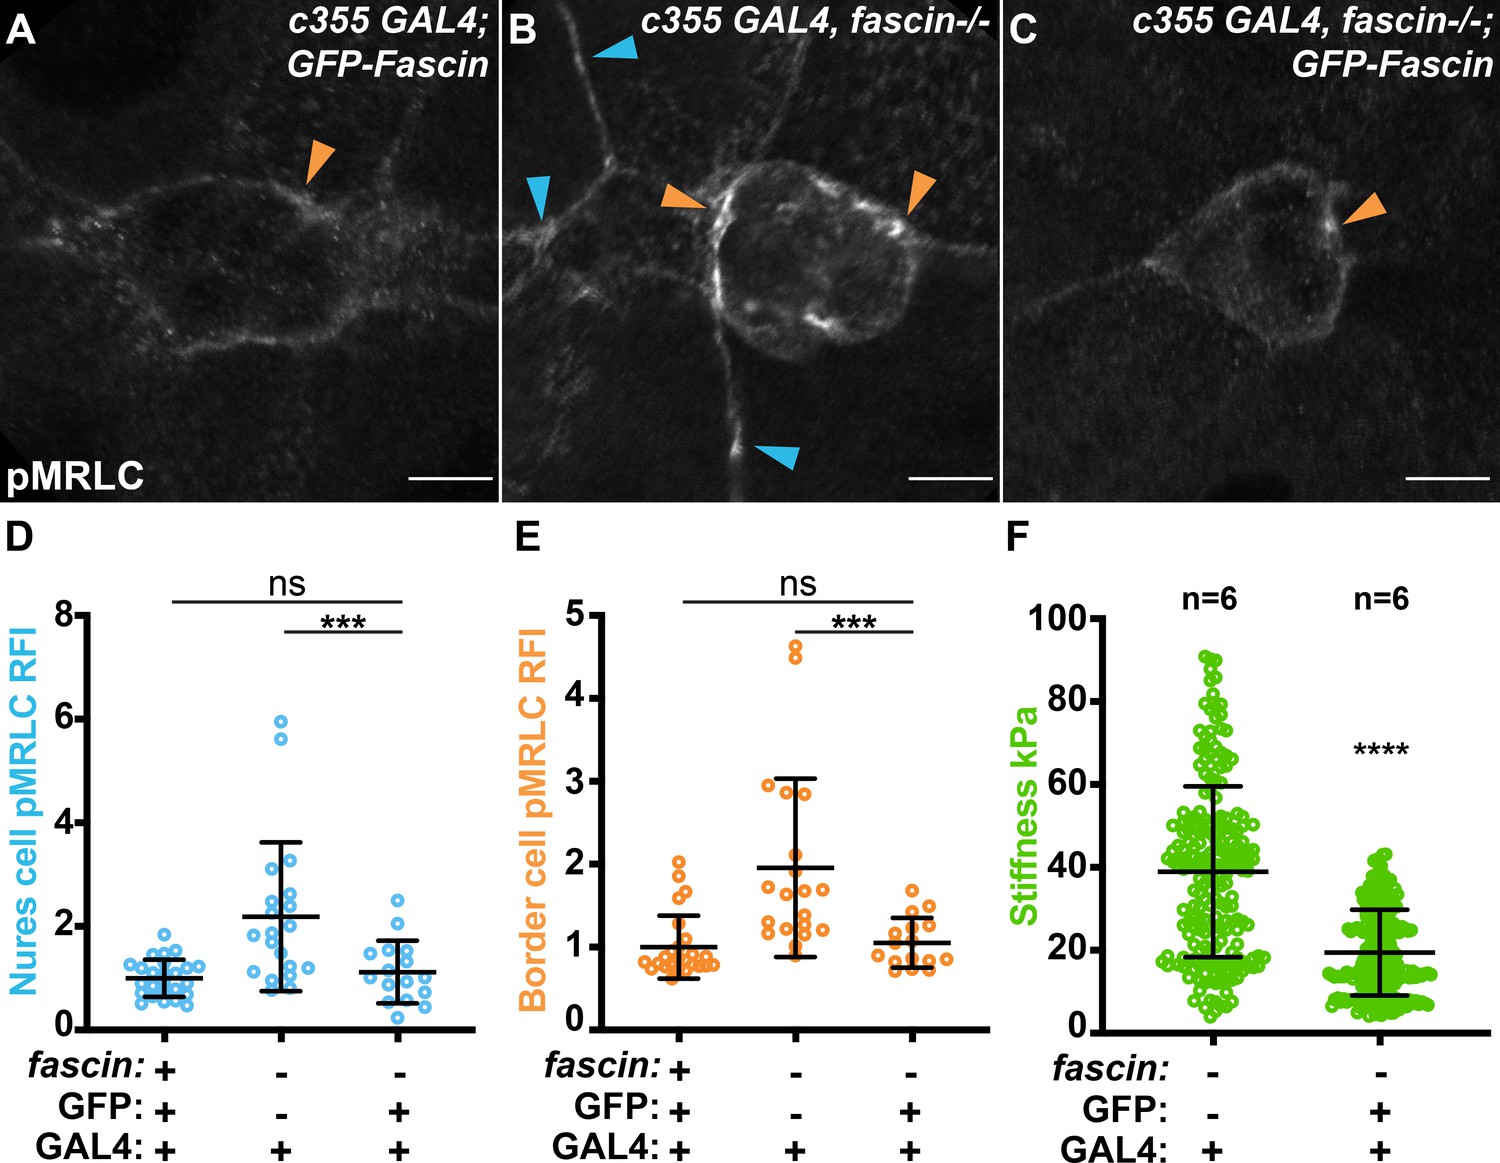
Somatic rescue of Fascin reduces nurse cell Myosin activity and stiffness.
(A–C) Maximum projections of 2–4 confocal slices of Stage 9 follicles of the indicated genotypes stained for phospho-MRLC (pMRLC, white). Blue arrows = pMRLC enrichment on surrounding nurse cells. Orange arrows = pMRLC enrichment on border cell cluster. Scale bars = 10 μm. (A) Somatic GFP-Fascin expression (c355 GAL4/+; UAS-GFP-Fascin/+). (B) fascin mutant with somatic GAL4 (c355 GAL4, fascinsn28/sn28). (C) Somatic GFP-Fascin expression in fascin mutant (c355 GAL4, fascinsn28/sn28; UAS-GFP-Fascin/+). (D, E) Graphs of quantification of pMRLC intensity at the nurse cell membranes (D) and border cell cluster (E) in the indicated genotypes. Each circle represents a follicle. Error bars = SD. ns indicates p > 0.05, ***p < 0.0001 (one-way ANOVA with Tukey’s multiple comparison test). In D, peak pMRLC intensity was quantified at the nurse cell membranes and normalized to phalloidin staining in the same follicle, three measurements were taken per follicle and averaged. In E, pMRLC intensity on the border cell cluster was quantified and normalized to background staining in the same follicle. (F) Graph of nurse cell stiffness (kPa) of the indicated genotypes as measured by AFM. Each circle represents a single indentation. Error bars = SD. ****p < 0.0001 (unpaired t-test). Restoring Fascin expression in the somatic cells of a fascin mutant follicle (C) significantly reduces activated Myosin enrichment on the nurse cell membranes (D) and border cell cluster (E) and reduces nurse cell stiffness by AFM (F) compared to the fascin-null control. All genotypes are listed in Table 1.
-
Figure 7—source data 1
Source data for Figure 7D, E.
- https://cdn.elifesciences.org/articles/69836/elife-69836-fig7-data1-v2.xlsx
Figure 7—figure supplement 1
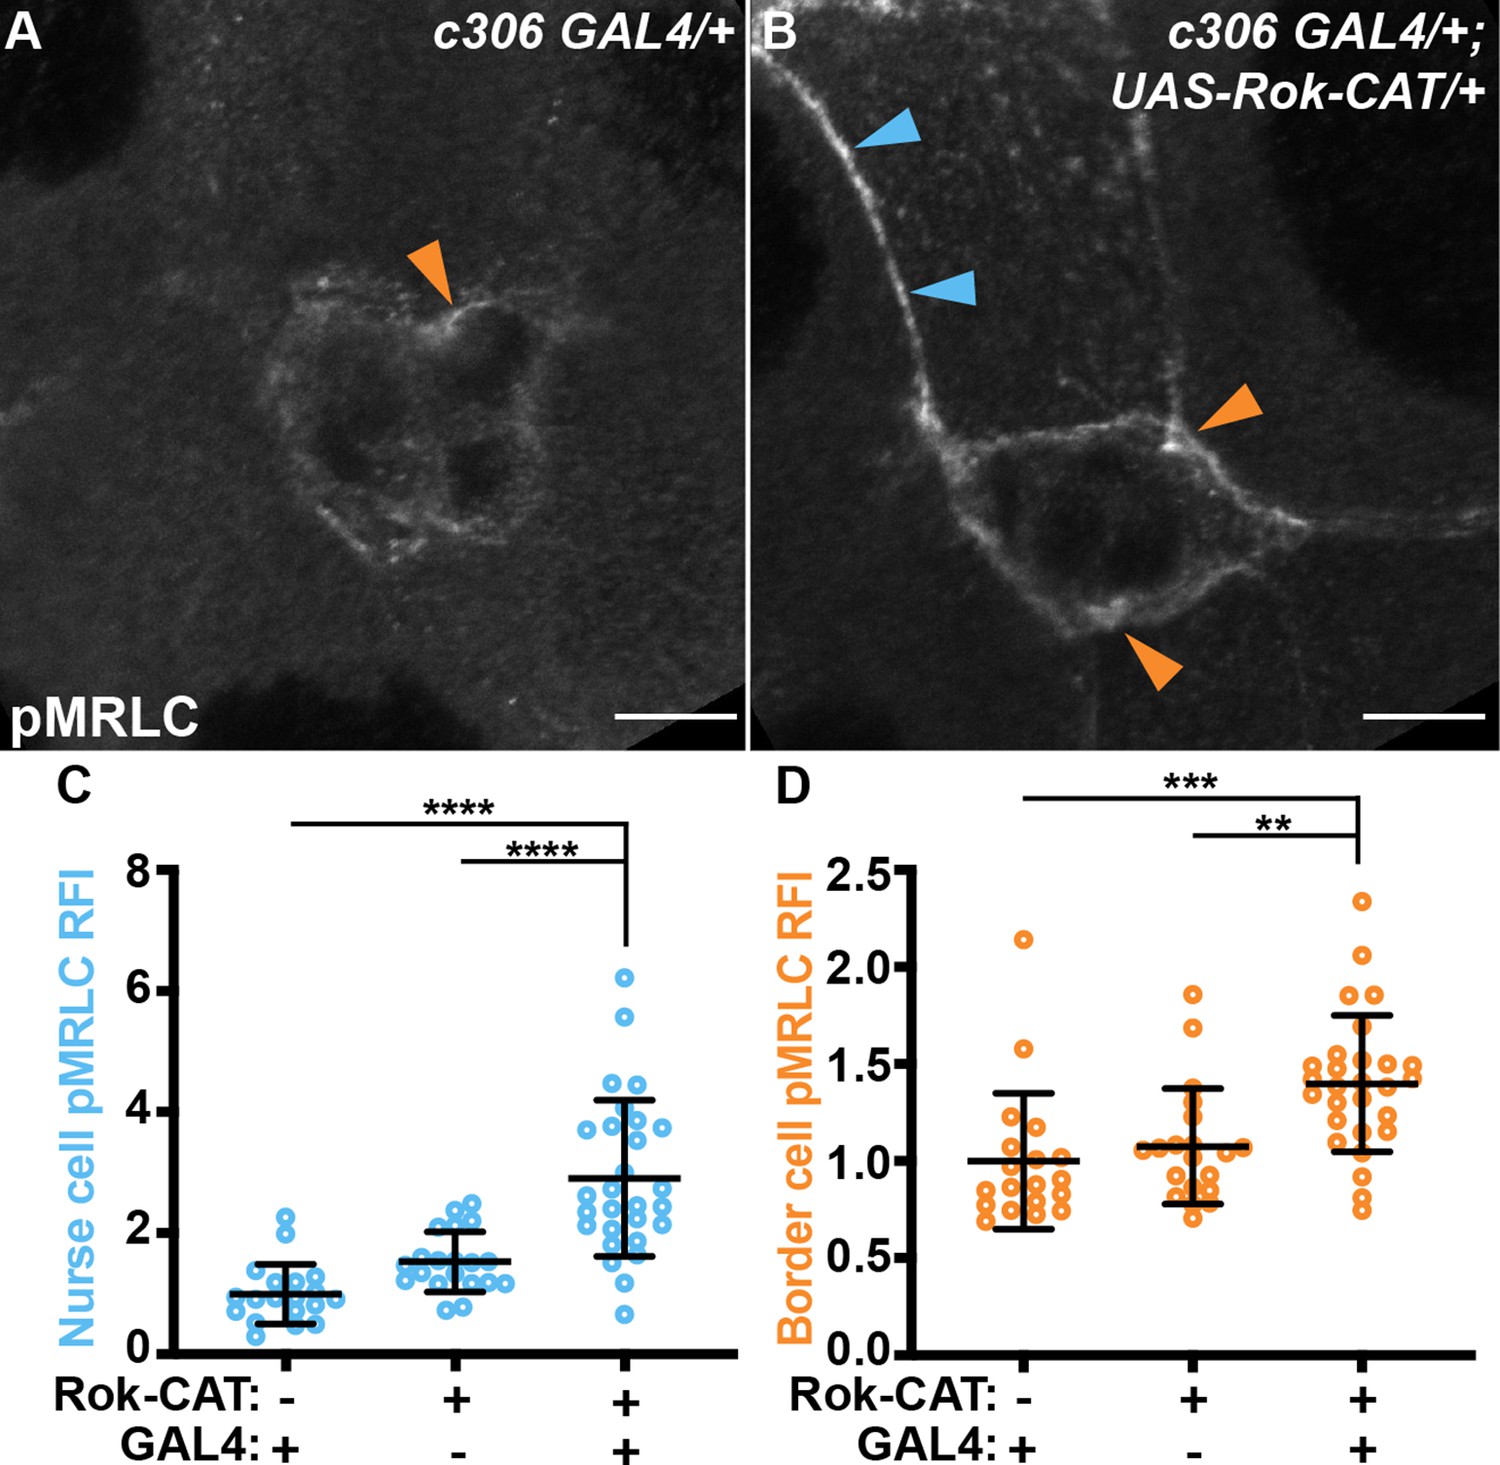
Increasing border cell stiffness through activated Rok increases activated Myosin on the nurse cells.
(A, B) Maximum projections of 2–4 confocal slices of Stage 9 follicles of the indicated genotypes stained for phospho-MRLC (pMRLC, white). Blue arrows = pMRLC enrichment on surrounding nurse cells. Orange arrows = pMRLC enrichment on border cell cluster. Scale bars = 10 μm. (A) Border cell GAL4 only control (c306 GAL4/+). (B) Border cell expression of constitutively active Rok (c306 GAL4/+; UAS-Rok-CAT/+). (C, D) Graphs of quantification of pMRLC intensity at the nurse cell membranes (C) and border cell cluster (D) in the indicated genotypes. Each circle represents a follicle. Error bars = SD. **p < 0.01, ***p < 0.001, ****p < 0.0001 (One-way ANOVA with Tukey’s multiple comparison test). In C, peak pMRLC intensity was quantified at the nurse cell membranes and normalized to phalloidin staining in the same follicle, three measurements were taken per follicle and averaged. In D, pMRLC intensity of the border cell cluster was quantified and normalized to background staining in the same follicle. Expression of constitutively active Rok in the border cells (B) leads to significantly increased activated Myosin enrichment on both the nurse cell membranes (C) and border cell cluster (D) compared to the controls (A, C, D). All genotypes are listed in Table 1.
-
Figure 7—figure supplement 1—source data 1
Source data Figure 7—figure supplement 1C, D.
- https://cdn.elifesciences.org/articles/69836/elife-69836-fig7-figsupp1-data1-v2.xlsx
Figure 8

Proposed model for Fascin limiting Myosin activity to control substrate stiffness during border cell migration.
In wild-type border cell clusters (orange), Fascin (green circles) bundles F-actin (red lines) to limit Myosin activity (magenta stars) on the border cell cluster and on the nurse cell membranes. Myosin activity in the border cell cluster generates forces (black arrows) that pushes on the nurse cells which results in the nurse cells responding with force (white arrows). This balance of forces is required for on-time migration. In fascin mutant follicles, Myosin activity on the border cell cluster is increased, driving increased Myosin activity on the nurse cells. This imbalance of forces between the border cell cluster and the nurse cell substrate impairs border cell migration.
Videos
Video 1
Myosin dynamics in control follicle.
Video of Stage 9 control MRLC-GFP expressing follicle (fascinsn28/+; MRLC-GFP/+). Time listed in seconds. Images were acquired every 30 s. Anterior is to the right. Scale bar = 20 μm. The control cluster displays Myosin dynamics in which Myosin puncta appear and disappear rapidly on the border cell cluster. All genotypes are listed in Table 1.
Video 2
Myosin dynamics in fascin-null follicle.
Video of Stage 9 fascin-null MRLC-GFP expressing follicle (fascinsn28/sn28; MRLC-GFP/+). Time listed in seconds. Images were acquired every 30 s. Anterior is to the right. Scale bar = 20 μm. Loss of Fascin results in slower Myosin dynamics, with Myosin puncta appearing and remaining longer than in controls (see Video 1). All genotypes are listed in Table 1.
Tables
Key resources table
| Reagent type (species) or resource | Designation | Source or reference | Identifiers | Additional information |
|---|---|---|---|---|
| Genetic reagent (Drosophila melanogaster) | y1w1 | Bloomington Drosophila Stock Center | BDSC Cat # 1495 RRID:BDSC_1495 | |
| Genetic reagent (D. melanogaster) | fascinsn28/sn28 | other | FBgn0003447 | from J. Zanet |
| Genetic reagent (D. melanogaster) | fTRG sqh | Vienna Drosophila Resource Center | VRDC Cat # 318,484 | fTRG 10075 |
| Genetic reagent (D. melanogaster) | oskar GAL4 (2) | Bloomington Drosophila Stock Center | BDSC Cat # 44,241RRID:BDSC_44241 | Anne Ephrussi |
| Genetic reagent (D. melanogaster) | UAS-sqh RNAi | Bloomington Drosophila Stock Center | BDSC Cat # 33,892RRID:BDSC_33892 | |
| Genetic reagent (D. melanogaster) | actin 5 c GAL4 | Bloomington Drosophila Stock Center | BDSC Cat # 8,807RRID:BDSC_8807 | |
| Genetic reagent (D. melanogaster) | UAS-GFP-Fascin | Zanet et al., 2009 PMID: 19592575 | from J. Zanet | |
| Genetic reagent (D. melanogaster) | UAS-GFP-Fascin-S52E | Zanet et al., 2009 PMID: 19592575 | from J. Zanet | |
| Genetic reagent (D. melanogaster) | UAS-Fascin-RNAi | Bloomington Drosophila Stock Center | BDSC Cat # 42,615RRID:BDSC_42615 | |
| Genetic reagent (D. melanogaster) | matα GAL4 | Bloomington Drosophila Stock Center | BDSC Cat # 7,063RRID:BDSC_7063 | |
| Genetic reagent (D. melanogaster) | c355 GAL4 | Bloomington Drosophila Stock Center | BDSC Cat # 3,750RRID:BDSC_3750 | |
| Genetic reagent (D. melanogaster) | c306 GAL4 | Bloomington Drosophila Stock Center | BDSC Cat # 3,743RRID:BDSC_3743 | |
| Genetic reagent (D. melanogaster) | UAS-Rok-CAT | Bloomington Drosophila Stock Center | BDSC Cat # 6,669RRID:BDSC_6669 | |
| Antibody | rabbit polyclonal anti-Phospho-Myosin Light Chain 2 (Ser19) | Cell Signaling | #3,671RRID:AB_330248 | (1:100) |
| Antibody | mouse monoclonal anti-Hu li tai shao (Hts) | Developmental Studies Hybridoma Bank | 1B1RRID:AB_528070 | (1:50) |
| Antibody | mouse monoclonal anti-Fasciclin III | Developmental Studies Hybridoma Bank | 7G10RRID:AB_528238 | (1:50) |
| Antibody | rat monoclonal anti-Vasa | Developmental Studies Hybridoma Bank | RRID:AB_760351 | (1:100) |
| Antibody | rabbit polyclonal anti-Zipper | Wheatley et al., 1995 PMID: 7601006 | (1:10000) | |
| Antibody | rabbit polyclonal anti-GFP | Torrey Pines Biolabs, Inc | TP401RRID:AB_10013661 | (1:2000) |
| Antibody | goat polyclonal anti-GFP | Fitzgerald Industries International | 70R-GG001 RRID:AB_1286216 | (1:2000) |
| Antibody | goat polyclonal Alexa Fluor 488 anti-mouse | Thermo Fischer Scientific | A-11001RRID:AB_2534069 | (1:500) |
| Antibody | goat polyclonal Alexa Fluor 568 anti-mouse | Thermo Fischer Scientific | A-11004RRID:AB_2534072 | (1:500) |
| Antibody | goat polyclonal Alexa Fluor 488 anti-rabbit | Thermo Fischer Scientific | A-11034RRID:AB_2576217 | (1:500) |
| Antibody | goat polyclonal Alexa Fluor 568 anti-rabbit | Thermo Fischer Scientific | A-11036 RRID:AB_10563566 | (1:500) |
| Antibody | donkey polyclonal Alexa Fluor 488 anti-goat | Thermo Fischer Scientific | A-11055 RRID:AB_2534102 | (1:500) |
| Antibody | Peroxidase-AffiniPure goat polyclonal anti-rabbit | Jackson ImmunoResearch Laboratories | 111-035-003RRID:AB_2313567 | (1:5000) |
| Antibody | Peroxidase-AffiniPure goat polyclonal anti-rat | Jackson ImmunoResearch Laboratories | 112-035-003RRID:AB_2338128 | (1:5000) |
| Chemical compound, drug | 4’,6-Diamidino-2-phenylindole (DAPI) | Millipore Sigma | D9542 | 5 mg/ml |
| Chemical compound, drug | Alexa Flour 568 or 647 Phalloidin | Thermo Fischer Scientific | A12380 or A22287 | (1:250 or 1:500) |
| Chemical compound, drug | Y-27632 | Millipore Sigma | Y0503 | 200 µM |
| Software, algorithm | FIJI | Schindelin et al., 2012 PMID:22743772 | RRID:SCR_002285 | |
| Software, algorithm | Prism 8 and 9 | https://www.graphpad.com/ | RRID:SCR_002798 | |
| Software, algorithm | Adobe Photoshop CC | https://ww.adobe.com/ | RRID:SCR_014199 | |
| Software, algorithm | Adobe Illustrator CC 25.2.3 | https://ww.adobe.com/ | RRID:SCR_010279 | |
| Software, algorithm | LAS AS SPE Core | Leica | ||
| Software, algorithm | ZEN Axio Observer.Z1 | Zeiss |
Table 1
Genotype by figures.
List of genotype show in the figures.
| Figure | Panel | Genotype |
|---|---|---|
| Figure 1 | B | yw |
| C | fascinsn28/sn28 | |
| Figure 2 | A-A" | yw |
| B-B" | fascinsn28/sn28 | |
| C-F | yw | |
| fascinsn28/sn28 | ||
| G-G''' | fascinsn28/+; +/sqh-GFP | |
| H-H''' | fascinsn28/sn28; +/sqh-GFP | |
| I | fascinsn28/+; +/sqh-GFP | |
| fascinsn28/sn28; +/sqh-GFP | ||
| Figure 2—figure supplement 1 | A-B | fascinsn28/sn28 |
| C-F | yw | |
| fascinsn28/sn28 | ||
| Figure 3 | C | yw |
| D | yw | |
| fascinsn28/sn28 | ||
| Figure 4 | B | yw |
| C-D | fascinsn28/sn28 | |
| E | fascinsn28/sn28; oskar GAL4 (2)/+ | |
| F | fascinsn28/sn28; oskar GAL4 (2)/UAS-sqh-RNAi | |
| G | yw | |
| fascinsn28/sn28 | ||
| H | oskar GAL4 (2)/+ | |
| oskar GAL4 (2)/UAS-sqh-RNAi | ||
| fascinsn28/sn28; oskar GAL4 (2)/+ | ||
| fascinsn28/sn28; oskar GAL4 (2)/UAS-sqh-RNAi | ||
| Figure 4—figure supplement 1 | A-B | yw |
| fascinsn28/sn28 | ||
| C-D | oskar GAL4 (2)/+ | |
| oskar GAL4 (2)/UAS-sqh-RNAi | ||
| fascinsn28/sn28; oskar GAL4 (2)/+ | ||
| fascinsn28/sn28; oskar GAL4 (2)/UAS-sqh-RNAi | ||
| Figure 5 | A | fascinsn28/sn28; actin 5c GAL4/+ |
| B | fascinsn28/sn28; actin 5c GAL4/UAS-GFP-Fascin | |
| C | fascinsn28/sn28; actin 5c GAL4/UAS-GFP-Fascin-S52E | |
| D-E | actin 5c GAL4/+ | |
| fascinsn28/sn28; actin 5c GAL4/+ | ||
| fascinsn28/sn28; actin 5c GAL4/UAS-GFP-Fascin | ||
| fascinsn28/sn28; actin 5c GAL4/UAS-GFP-Fascin-S52E | ||
| Figure 5—figure supplement 1 | A | fascinsn28/sn28; actin 5c GAL4/UAS-GFP-Fascin |
| B | fascinsn28/sn28; actin 5c GAL4/UAS-GFP-Fascin-S52E | |
| C | actin 5c GAL4/+ | |
| fascinsn28/sn28; actin 5c GAL4/+ | ||
| fascinsn28/sn28; actin 5c GAL4/UAS-GFP-Fascin | ||
| fascinsn28/sn28; actin 5c GAL4/UAS-GFP-Fascin-S52E | ||
| Figure 6 | B | +/UAS-Fascin-RNAi (3) |
| C | matα GAL4 (3)/UAS-Fascin-RNAi (3) | |
| D | c355 GAL4/+; +/UAS-Fascin-RNAi (3) | |
| E | c306 GAL4/+; +/UAS-Fascin-RNAi (3) | |
| F-H | +/UAS-Fascin-RNAi (3) | |
| matα GAL4 (3)/UAS-Fascin-RNAi (3) | ||
| c355 GAL4/+; +/UAS-Fascin-RNAi (3) | ||
| c306 GAL4/+; +/UAS-Fascin-RNAi (3) | ||
| Figure 7 | A | c355 GAL4/+; +/UAS-GFP-Fascin |
| B | c355 GAL4, fascinsn28/sn28 | |
| C | c355 GAL4, fascinsn28/sn28; +/UAS-GFP-Fascin | |
| D-E | c355 GAL4/+; +/UAS-GFP-Fascin | |
| c355 GAL4, fascinsn28/sn28 | ||
| c355 GAL4, fascinsn28/sn28; +/UAS-GFP-Fascin | ||
| F | c355 GAL4, fascinsn28/sn28 | |
| c355 GAL4, fascinsn28/sn28; +/UAS-GFP-Fascin | ||
| Figure 7—figure supplement 1 | A | c306 GAL4/+ |
| B | c306 GAL4/+; +/UAS-Rok-CAT | |
| C-D | c306 GAL4/+ | |
| +/UAS-Rok-CAT | ||
| c306 GAL4/+; +/UAS-Rok-CAT | ||
| Video 1 | fascinsn28/+; +/sqh-GFP | |
| Video 2 | fascinsn28/sn28; +/sqh-GFP |
Additional files
Download links
A two-part list of links to download the article, or parts of the article, in various formats.
Downloads (link to download the article as PDF)
Open citations (links to open the citations from this article in various online reference manager services)
Cite this article (links to download the citations from this article in formats compatible with various reference manager tools)
Fascin limits Myosin activity within Drosophila border cells to control substrate stiffness and promote migration
eLife 10:e69836.
https://doi.org/10.7554/eLife.69836


