Heat shock factor 1 (HSF1) cooperates with estrogen receptor α (ERα) in the regulation of estrogen action in breast cancer cells
- Maria Sklodowska-Curie National Research Institute of Oncology, Gliwice Branch, Wybrzeże Armii Krajowej, Poland
- Department of Systems Biology and Engineering, Silesian University of Technology, Poland
- Department of Clinical Science, University of Bergen, Norway
- Laboratory of Molecular Neurobiology, Nencki Institute of Experimental Biology, Polish Academy of Sciences, Poland
- Departments of Statistics and Bioengineering, Rice University, United States
Figures
Figure 1 with 2 supplements
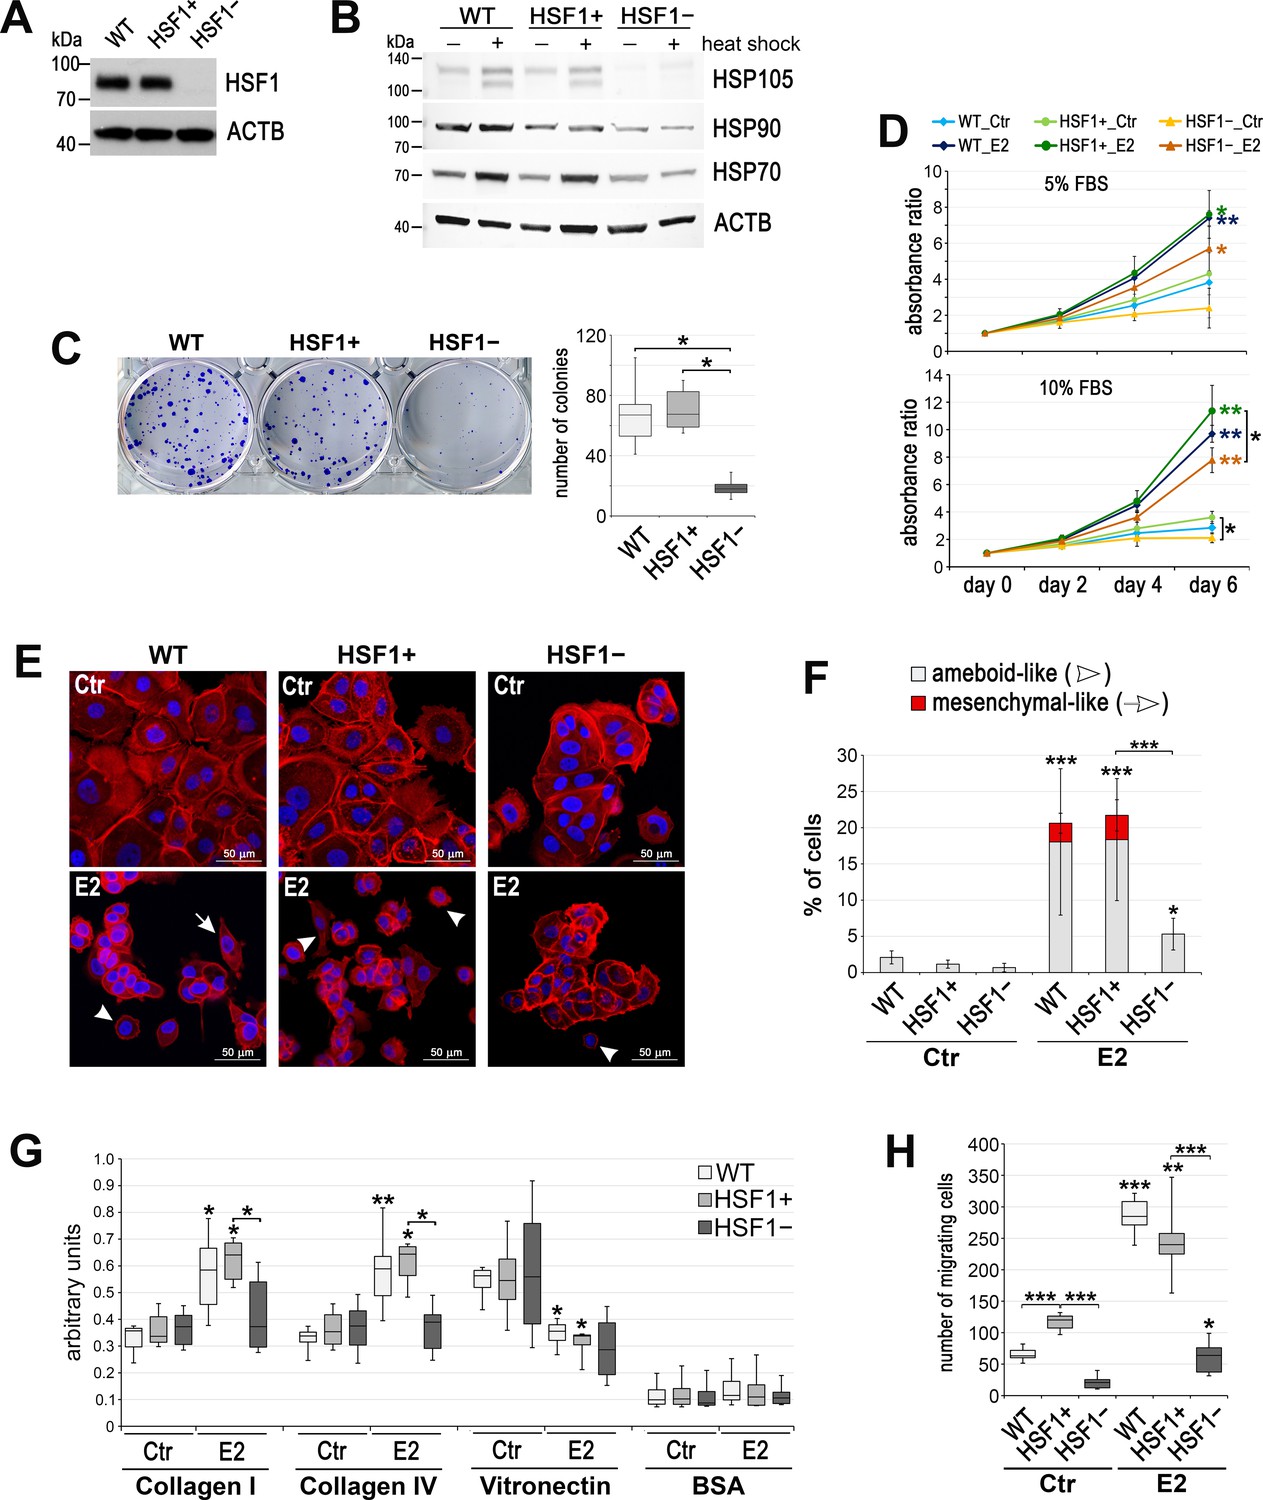
Effect of HSF1 depletion on MCF7 cell growth and migration.
(A) HSF1 level and (B) heat shock response assessed by western blot in unmodified cells (WT) and in cells obtained using DNA-free CRISPR/Cas9 system: HSF1+ (six clones with the normal HSF1 level were pooled) and HSF1− (six HSF1-negative clones were pooled). Actin (ACTB) was used as a protein loading control. Heat shock: 43°C/1 hr + recovery 37°C/6 hr. (C) The number of colonies formed in the clonogenic assay: representative images of single-cell clones stained with crystal violet and their quantification (mean ± SD, n = 4). (D) Growth curves of untreated (Ctr) and E2-stimulated cells in phenol red-free media with 5% or 10% charcoal-stripped FBS (assessed using crystal violet staining). Mean and standard deviation from three independent experiments (each in three technical replicates) are shown. (E) F-actin staining in cells treated with E2 (10 nM for 14 days), then seeded for 24 hr on fibronectin-coated slides. Arrowheads, ameboid-like cells; arrows, mesenchymal-like cells; scale bar, 50 μm. (F) The number of cells after F-actin staining was counted in 10 random fields and single cells (ameboid-like and mesenchymal-like) were calculated as a percent of all cells. (G) Cell adhesion to collagens and vitronectin analyzed after E2 treatment (10 nM for 14 days); adhesion to BSA serves as a negative control (n = 4) (H) The number of migrating cells assessed by Boyden chamber assay after E2 treatment (10 nM for 14 days) (n = 3, each in three technical replicates). Boxplots represent the median, upper and lower quartiles, maximum and minimum; ***p<0.0001, **p<0.001, *p<0.05 (significance of differences versus the corresponding control – next to the curve/box/bar or between cell variants). See Figure 1—figure supplement 1 and Figure 1—figure supplement 2 for an extended characteristic of other HSF1-deficient MCF7 and T47D cell models.
Figure 1—figure supplement 1
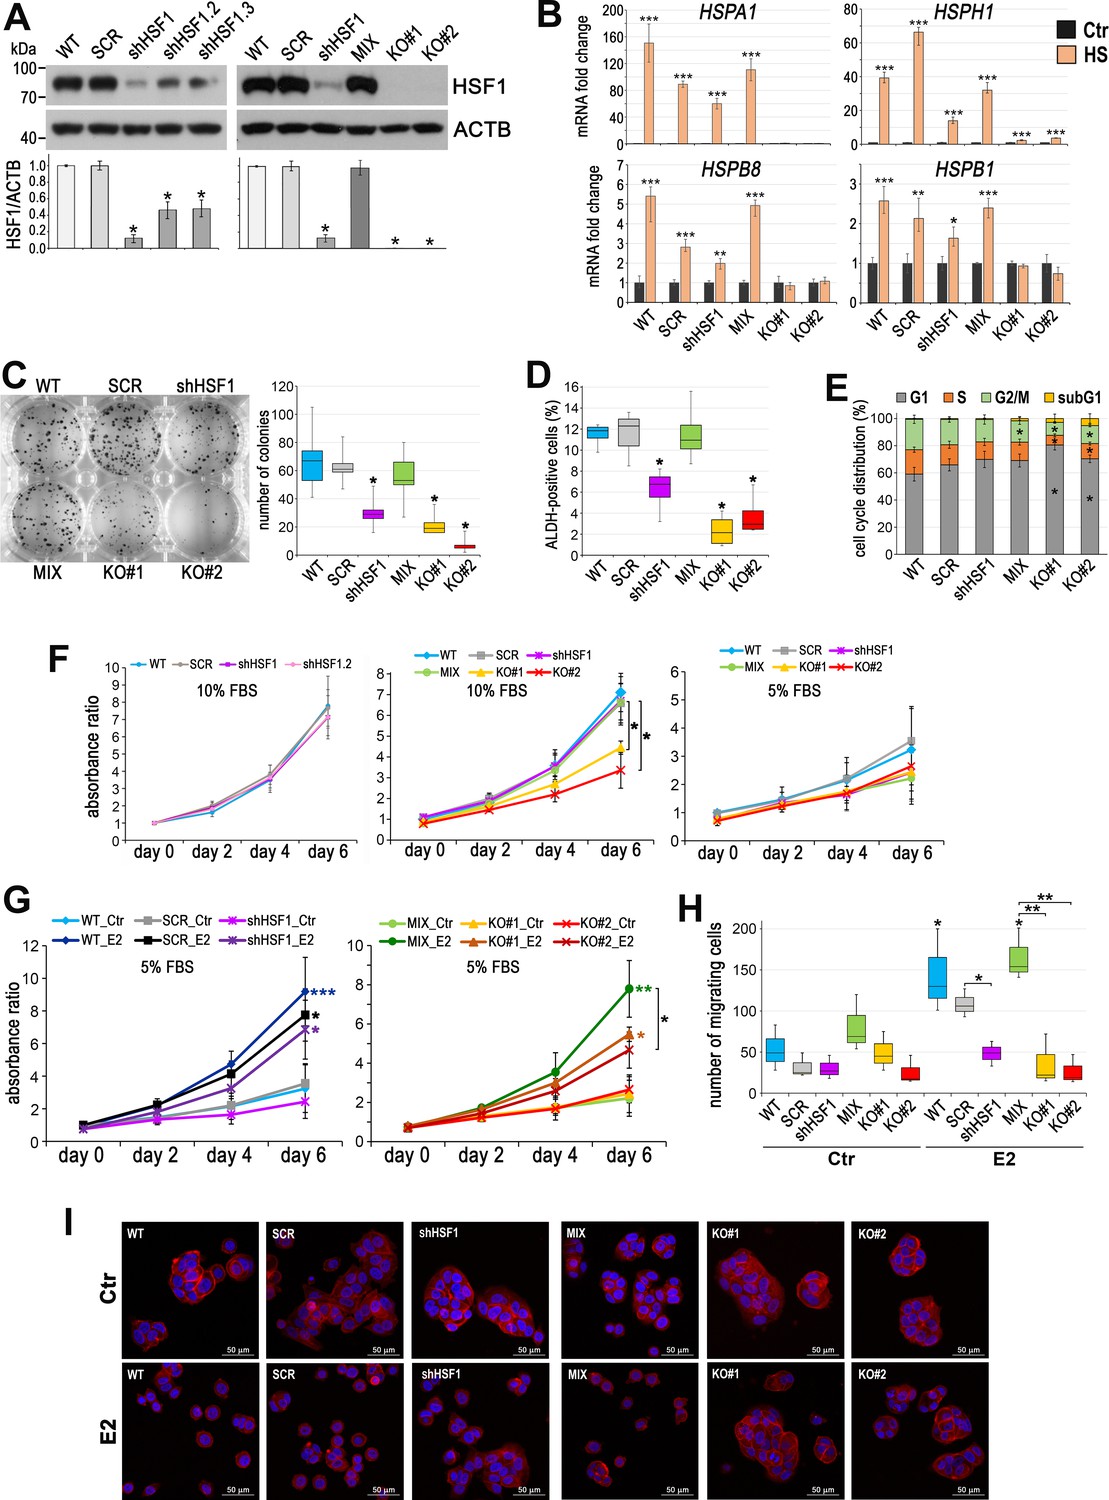
Characteristic of HSF1-deficient MCF7 cell variants.
(A) Western blot analysis of HSF1 level in unmodified cells (WT), variants stably transduced with nonspecific shRNA (SCR) or with three different HSF1-specific shRNAs (shHSF1), and combination of control clones (MIX) or two HSF1-negative clones (KO#1, KO#2) arisen from single cells following CRISPR/Cas9 gene targeting. Actin (ACTB) was used as a protein loading control. The graph below shows the results of densitometric analyses of HSF1 immunodetection (n = 3). (B) Expression of indicated HSP genes analyzed by RT-qPCR in MCF7 cell variants exposed to elevated temperature (HS: 43°C/1 hr + recovery 37°C/4 hr) in relation (fold change) to untreated control (Ctr). (C) The number of colonies formed in the clonogenic assay: representative images of single-cell clones stained with crystal violet and their quantification (mean ± SD, n = 5). (D) ALDEFLUOR assay of progenitor (ALDH-positive) cells assessed by flow cytometry (n = 4). (E) Cell cycle phases and sub-G1 distribution in sub-confluent cells at 72 hr after plating presented as 100% stacked column plots (mean ± SD, n = 3). *p<0.05, significantly different to WT (C–E). Growth curves of untreated (Ctr) (F) and E2-stimulated (G) cell variants in phenol red-free media with 5% or 10% charcoal-stripped FBS assessed using crystal violet staining. Mean and standard deviation from four independent experiments (each in 2–6 technical replicates) are shown. (H) Number of migrating cells analyzed by Boyden chamber assay after E2 treatment (10 nM for 14 days) (n = 3). Boxplots represent the median, upper and lower quartiles, maximum and minimum; ***p<0.0001, **p<0.001, *p<0.05 – significance of differences versus the corresponding control (next to the curve/box/bar) or between cell variants (F–H). (I) F-actin staining in cells treated with E2 (10 nM for 14 days), then seeded for 24 hr on fibronectin-coated slides. Scale bar, 50 μm.
Figure 1—figure supplement 2
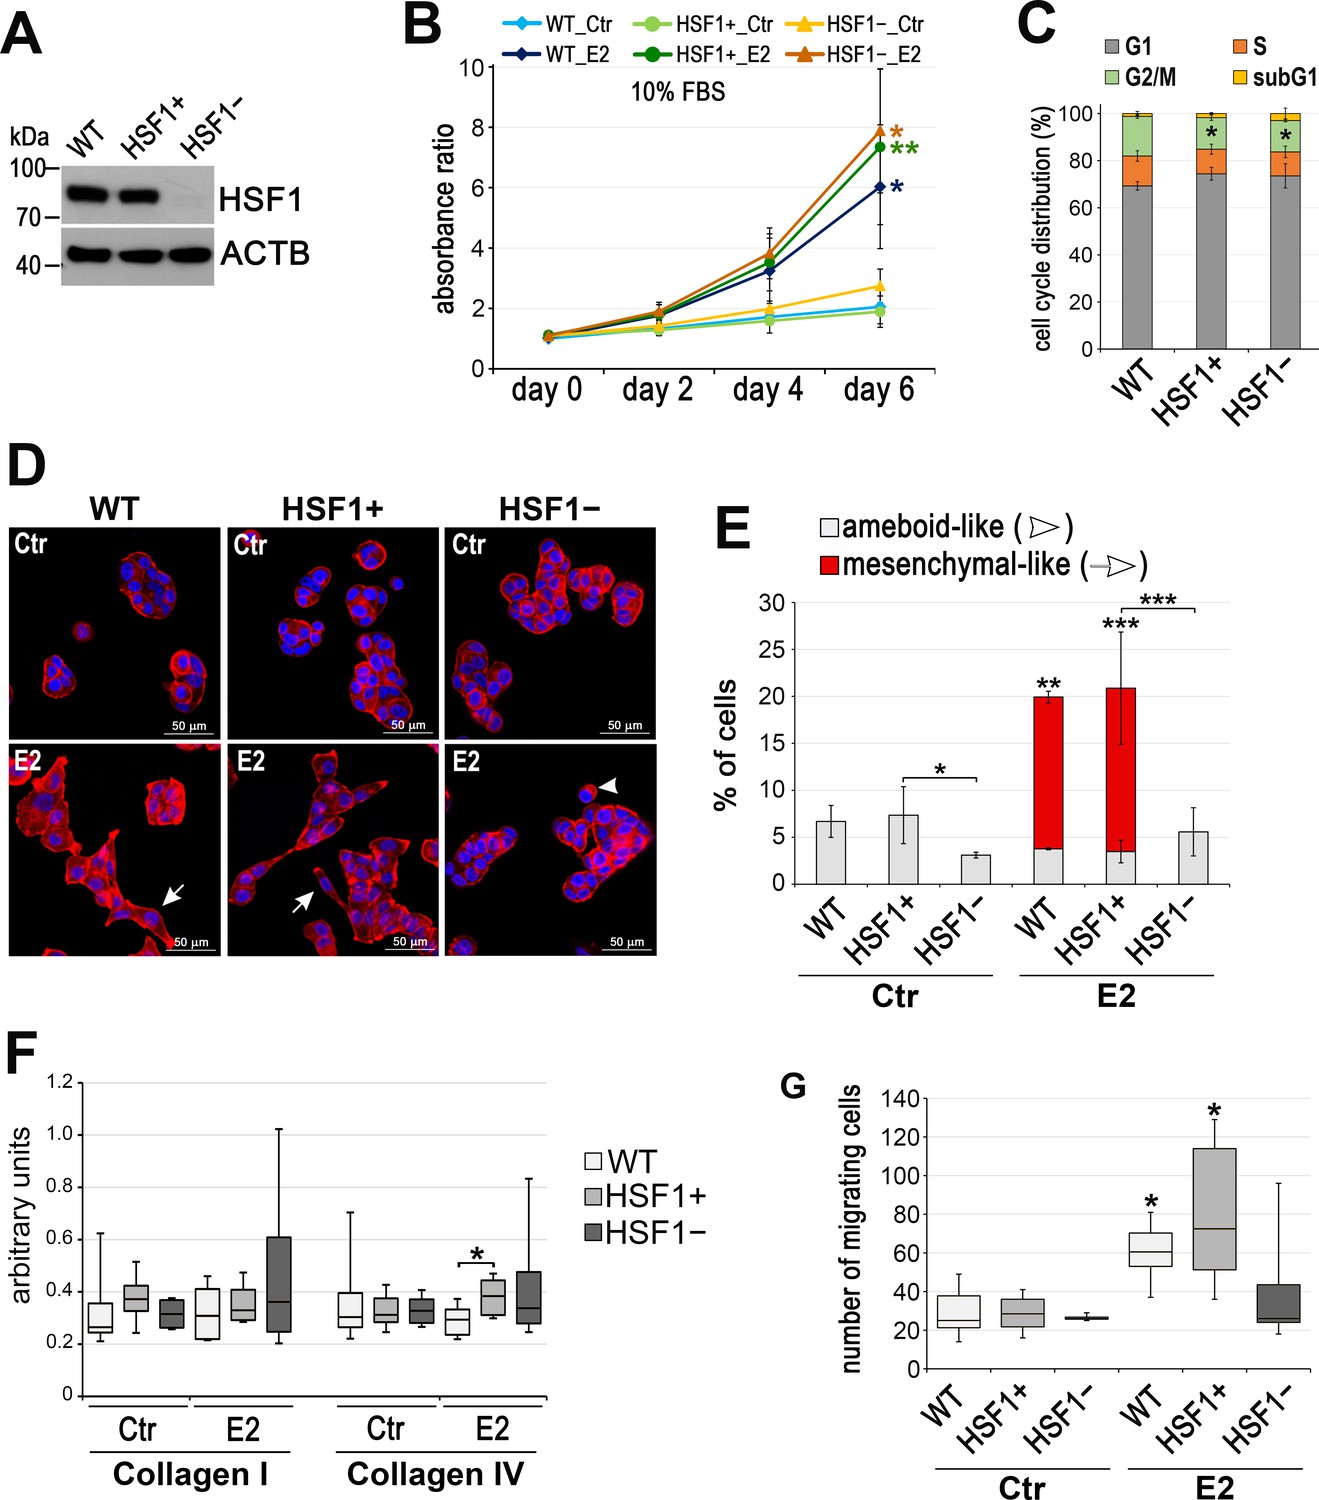
Characteristic of HSF1-deficient T47D cells.
(A) Western blot analysis of HSF1 level in T47D cell variants: unmodified (WT), a combination of five control (HSF1+) and five HSF1-negative (HSF1−) clones arisen from single cells following CRISPR/Cas9 gene targeting. Actin (ACTB) was used as a protein loading control. (B) Cell growth curves of untreated (Ctr) and E2-treated cells in phenol red-free media with 10% charcoal-stripped FBS assessed using crystal violet staining. Mean and standard deviation from three independent experiments (each in six technical replicates) are shown. (C) Cell cycle phases and sub-G1 distribution in sub-confluent cells at 72 hr after plating presented as 100% stacked column plots (mean ± SD, n = 3). *p<0.05, significantly different to WT. (D) F-actin staining in cells treated with E2 (10 nM for 14 days), then seeded for 24 hr on fibronectin-coated slides. Arrowheads, ameboid-like cells; arrows, mesenchymal-like cells; scale bar, 50 μm. (E) The number of cells after F-actin staining was counted in 10 random fields and single cells (ameboid-like and mesenchymal-like) were calculated as a percent of all cells. (F) Cell adhesion to collagens analyzed after E2 treatment (10 nM for 14 days) (n = 8). (G) The number of migrating cells assessed by Boyden chamber assay after E2 treatment (10 nM for 14 days) (n = 3). Boxplots represent the median, upper and lower quartiles, maximum and minimum; ***p<0.0001, **p<0.001, *p<0.05 – significance of differences versus the corresponding control (next to the curve/box/bar) or between cell variants (B,, E–G).
Figure 2 with 2 supplements
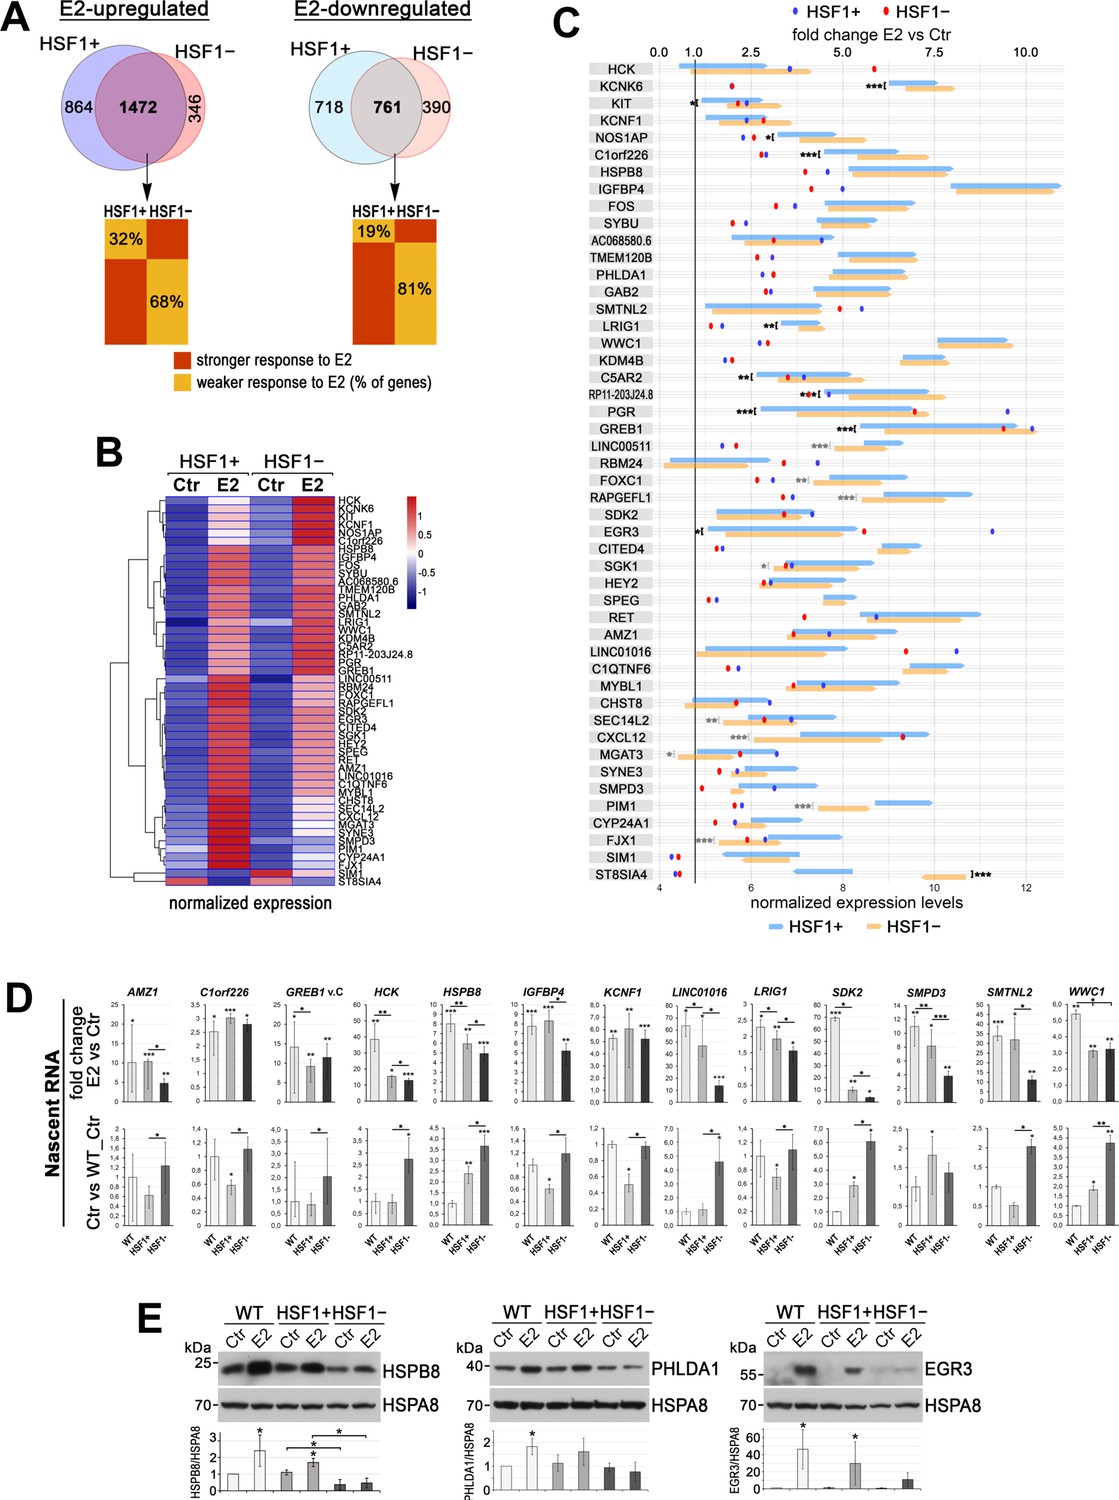
The deficiency of HSF1 reduces a transcriptional response to estrogen (E2) in ER-positive MCF7 cells.
(A) Overlap of genes stimulated or repressed after the E2 treatment (RNA-seq analyses) in HSF1+ and HSF1− cells (model created as described in Figure 1). The bottom panel compares the degree of response to E2 of overlapping genes. (B) Heatmap with hierarchical clustering of normalized read counts from RNA-seq (row z-score) for selected genes (identified as similarly responding in all MCF7 cell models; see Figure 2—figure supplement 1) stimulated or repressed after the E2 treatment. (C) The response to E2 stimulation presented as a mean fold change E2 versus Ctr (dots; scale on the top) as well as changes in the expression level between Ctr and E2 (arrows begin at the level of mean expression in untreated cells and end at the level of mean expression in treated cells; normalized RNA-seq read counts with a scale on the bottom). Genes are sorted according to the hierarchical clustering shown in the heatmap. Upregulation, fold change >1.0; downregulation, fold change <1.0. Statistically significant differences between untreated HSF1+ and HSF1− cells are marked: ***p<0.0001, **p<0.001, *p<0.05. (D) Nascent RNA gene expression analyses by RT-qPCR in wild-type (WT), HSF1+, and HSF1− cells. The upper panel shows E2-stimulated changes (E2 versus Ctr fold change; E2 treatment: 10 nM, 4 hr), bottom panel shows basal expression level represented as fold differences between untreated wild-type control (WT), HSF1+, and HSF1− cells. Corresponding total RNA analyses are shown in Figure 2—figure supplement 2B. ***p<0.0001, **p<0.001, *p<0.05 (significance of differences versus the corresponding control – above the bar, or between cell variants). (E) Analyses at the protein level (western blot) after 48 hr treatment with E2. HSPA8 was used as a protein loading control. The graph below shows the results of densitometric analyses (n = 3).
Figure 2—figure supplement 1
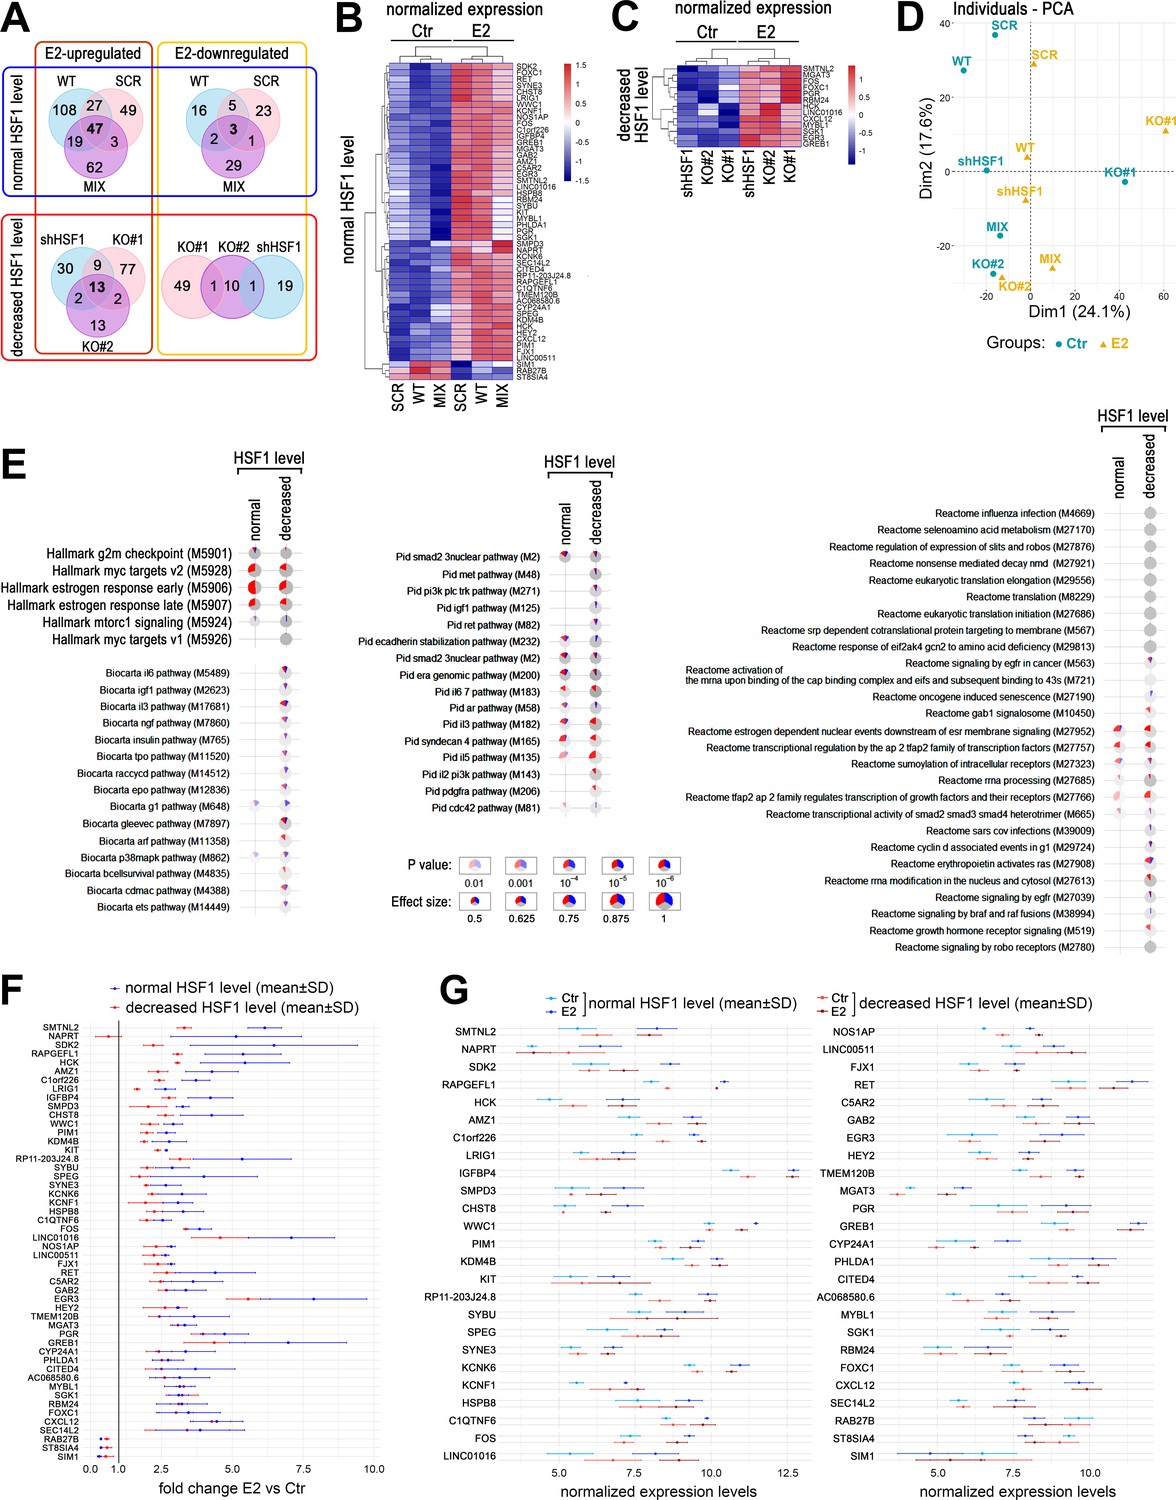
Analyses of a transcriptional response to estrogen (E2) in ER-positive MCF7 cells with different levels of HSF1.
(A) Overlap of differentially expressed genes and (B, C) heatmaps with hierarchical clustering of normalized read counts from RNA-seq (row z-score) for genes stimulated or repressed after the E2 treatment in cells with different levels of HSF1: unmodified (WT), stably transduced with nonspecific shRNA (SCR), stably transduced with HSF1-specific shRNA (shHSF1), the combination of control clones arisen from single cells following CRISPR/Cas9 gene targeting (MIX), HSF1-negative single clones obtained by CRISPR/Cas9 gene targeting (KO#1, KO#2). Ctr, untreated cells; E2, 17β-estradiol treatment (10 nM, 4 hr). (D) Principal component analysis (PCA) of normalized RNA-seq read counts (dimensions 1 and 2 were responsible for 41.7% of variability). (E) Gene set enrichment analysis showing significant terms from the Hallmark, BioCarta, PID, and Reactome subsets of the canonical pathways collection detected in E2-stimulated HSF1-proficient and HSF1-deficient cells. Blue, a fraction of downregulated genes; red, a fraction of upregulated genes. (F) Comparison of the response to E2 stimulation (E2 versus Ctr) in HSF1-proficient and HSF1-deficient cells. Genes shown in (B) are sorted from the highest to the lowest difference between average fold changes in both cell variants decreased by the standard deviation (SD). Upregulation, fold change >1.0; downregulation, fold change <1.0. (G) Comparison of the expression level (normalized RNA-seq read counts; mean ± SD) of the same set of genes in unstimulated (Ctr) and E2-stimulated HSF1-proficient and HSF1-deficient cells.
Figure 2—figure supplement 2
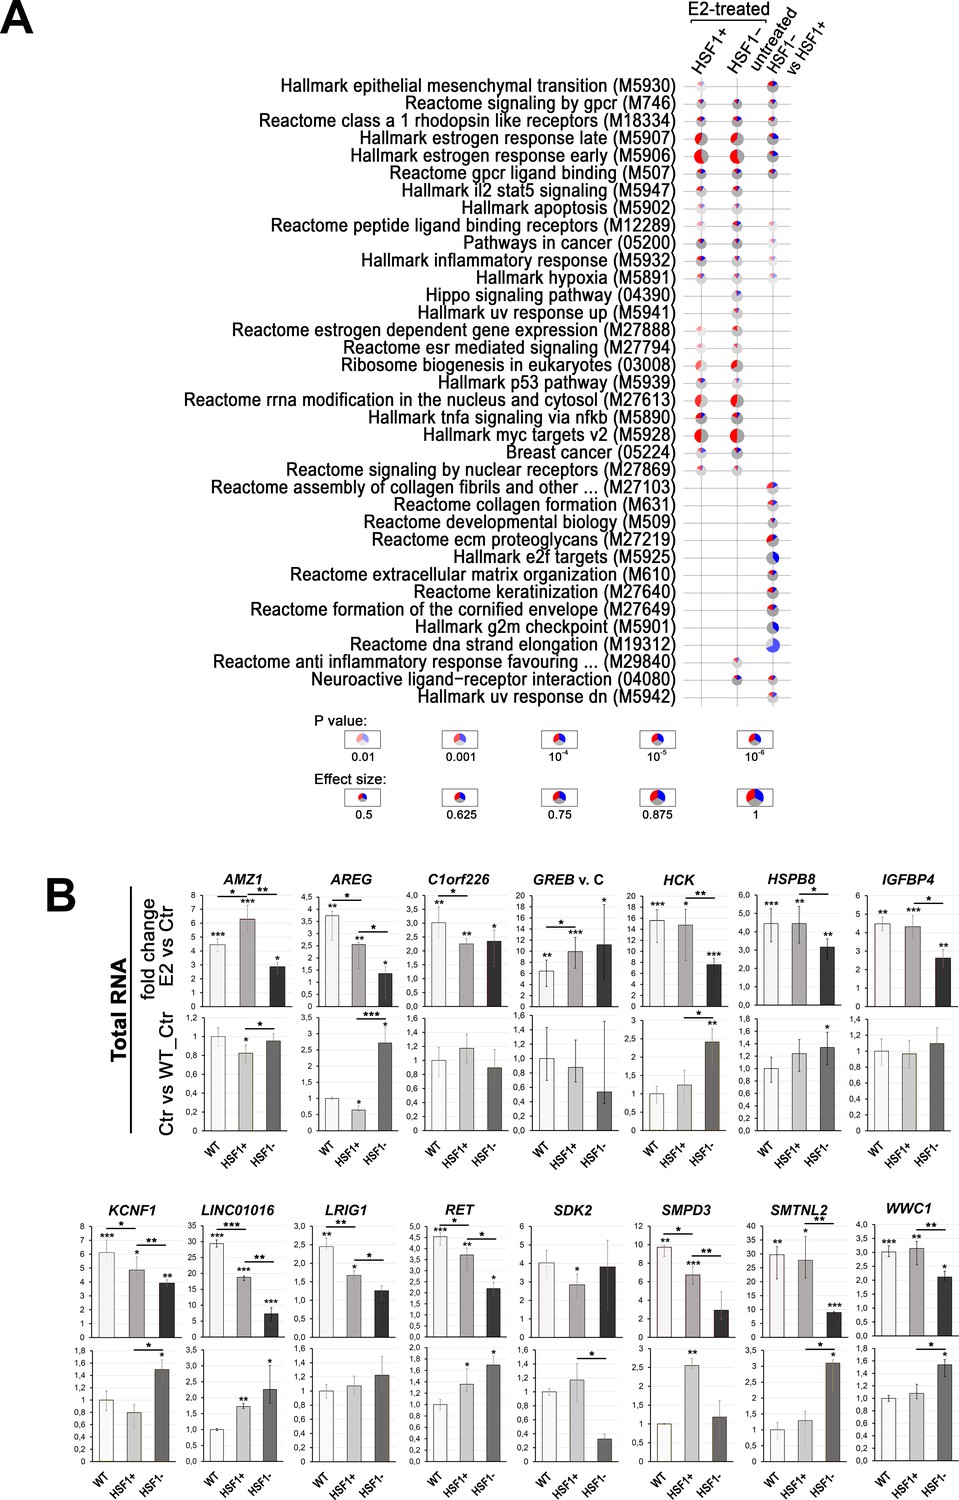
E2-stimulated gene expression analyses in MCF7 cells with different levels of HSF1 created using DNA-free CRISPR/Cas9 system.
(A) Gene set enrichment analysis showing significant (false discovery rate [FDR] ≤ 0.001) terms from the Hallmark, Reactome, BioCarta, and KEGG gene sets collection detected in E2-stimulated HSF1+ and HSF1− cells, as well as differentiating untreated cells. Blue, a fraction of downregulated genes; red, a fraction of upregulated genes. (B) Analyses of the expression by RT-qPCR using total RNA. The upper panels show E2-stimulated changes, lower panels show differences between untreated WT, HSF1+, and HSF1− cells (fold change). Ctr, untreated cells; E2, 17β-estradiol treatment (10 nM, 4 hr). ***p<0.0001, **p<0.001, *p<0.05 (above the bar – versus the corresponding control, between the bars – between cell variants).
Figure 3 with 2 supplements
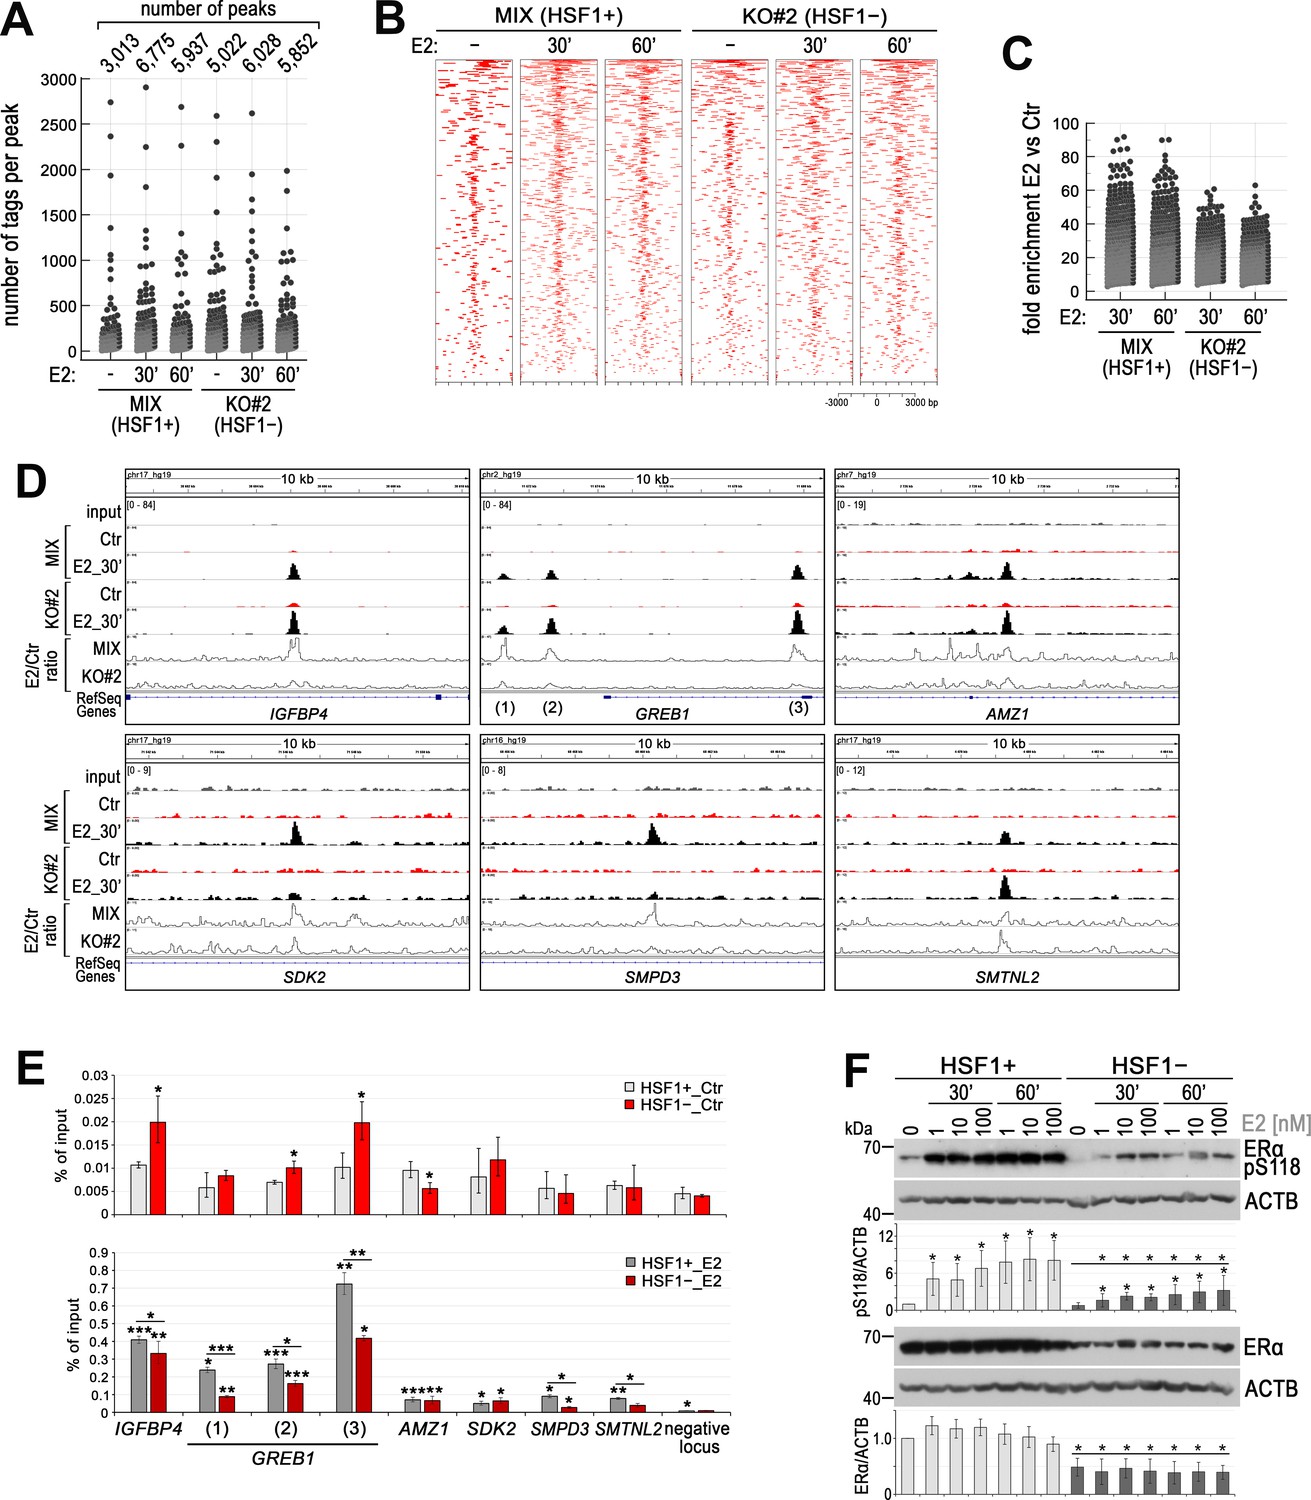
HSF1 deficiency influences the binding of ERα to chromatin in ER-positive MCF7 cells.
(A) Number of peaks and peak size distribution (number of tags per peak), (B) heatmap visualization of ERα ChIP-seq data (versus input), and (C) binding enrichment (fold enrichment E2 versus Ctr) after E2 stimulation (10 nM for 30 or 60 min) in HSF1-deficient cells (KO#2) and corresponding control (MIX, a combination of control clones arisen from single cells following CRISPR/Cas9 gene targeting). Heatmaps depict all ERα-binding events centered on the peak region within a 3 kb window around the peak. Peaks in each sample were ranked on intensity. (D) Examples of ERα peaks identified in ChIP-seq analyses, normalized by scaling factor using bamCoverage tool, and visualized by the IGV browser in unstimulated cells (Ctr) and after E2 treatment (10 nM, 30 min). The scale for each sample is shown in the left corner. Line plots show the E2/Ctr ratio obtained using the bamCoverage tool. (E) Comparison of ERα-binding efficiency (by ChIP-qPCR; % of input) in selected sequences in untreated (Ctr; upper panel) and after E2 stimulation (10 nM, 30 min; bottom panel) HSF1+ and HSF1− MCF7 cells (model created as described in Figure 1). ***p<0.0001, **p<0.001, *p<0.05 (significance of differences versus the corresponding control – above the bar, or between cell variants). (F) Western blot analysis of ERα level and its phosphorylated form (pS118) after E2 treatment (1, 10, and 100 nM for 30 or 60 min) in HSF1+ and HSF1− cells. Actin (ACTB) was used as a protein loading control. Graphs below show the results of densitometric analyses (n = 4). *p<0.05 (significance of differences versus the corresponding control – above the bar, or between cell variants, versus the same treatment).
Figure 3—figure supplement 1
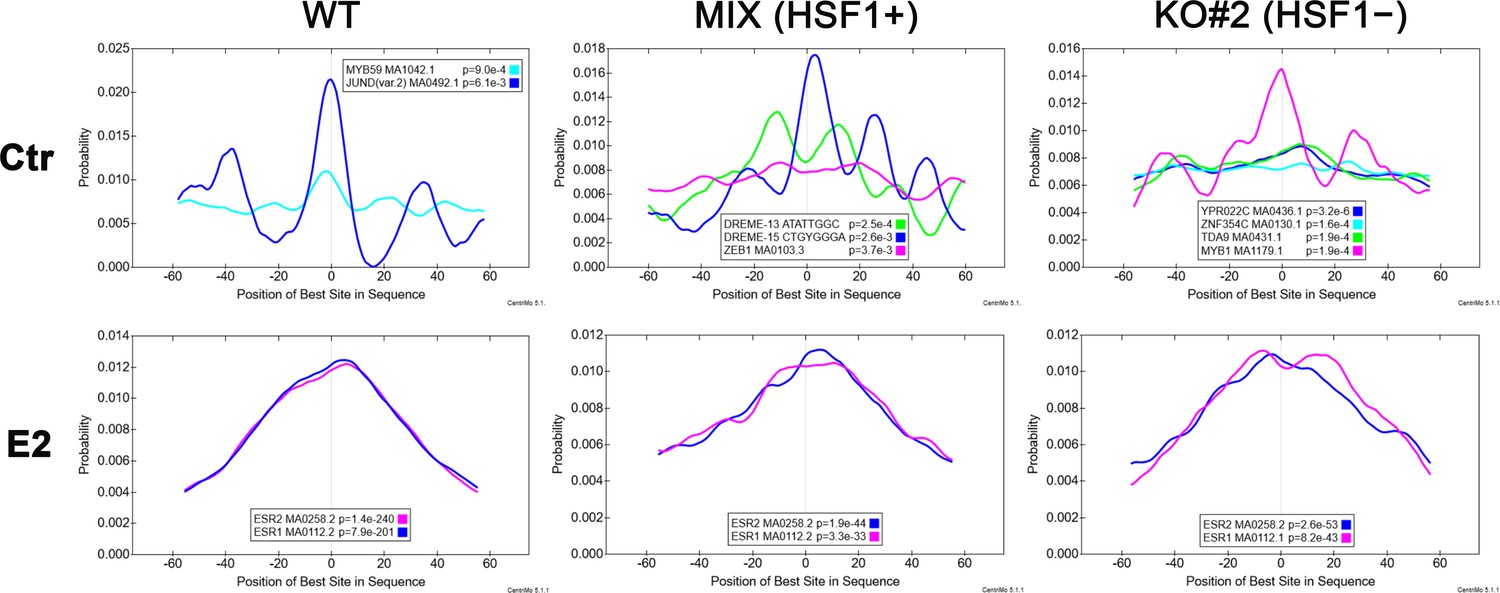
Top enriched motifs in ERα ChIP-seq peak regions.
The CentriMo plots show the distribution of the given motifs in peaks from untreated (Ctr) and estrogen (E2)-treated (10 nM for 30 min) MCF7 cell variants. JASPAR motif names, IDs, and the p-value of the motif’s central enrichment in peaks are shown in the legend of each plot. MCF7 cell variants: wild type (WT), a combination of control clones arisen from single cells following CRISPR/Cas9 gene targeting (MIX), HSF1-negative clone obtained by CRISPR/Cas9 gene targeting (KO#2).
Figure 3—figure supplement 2
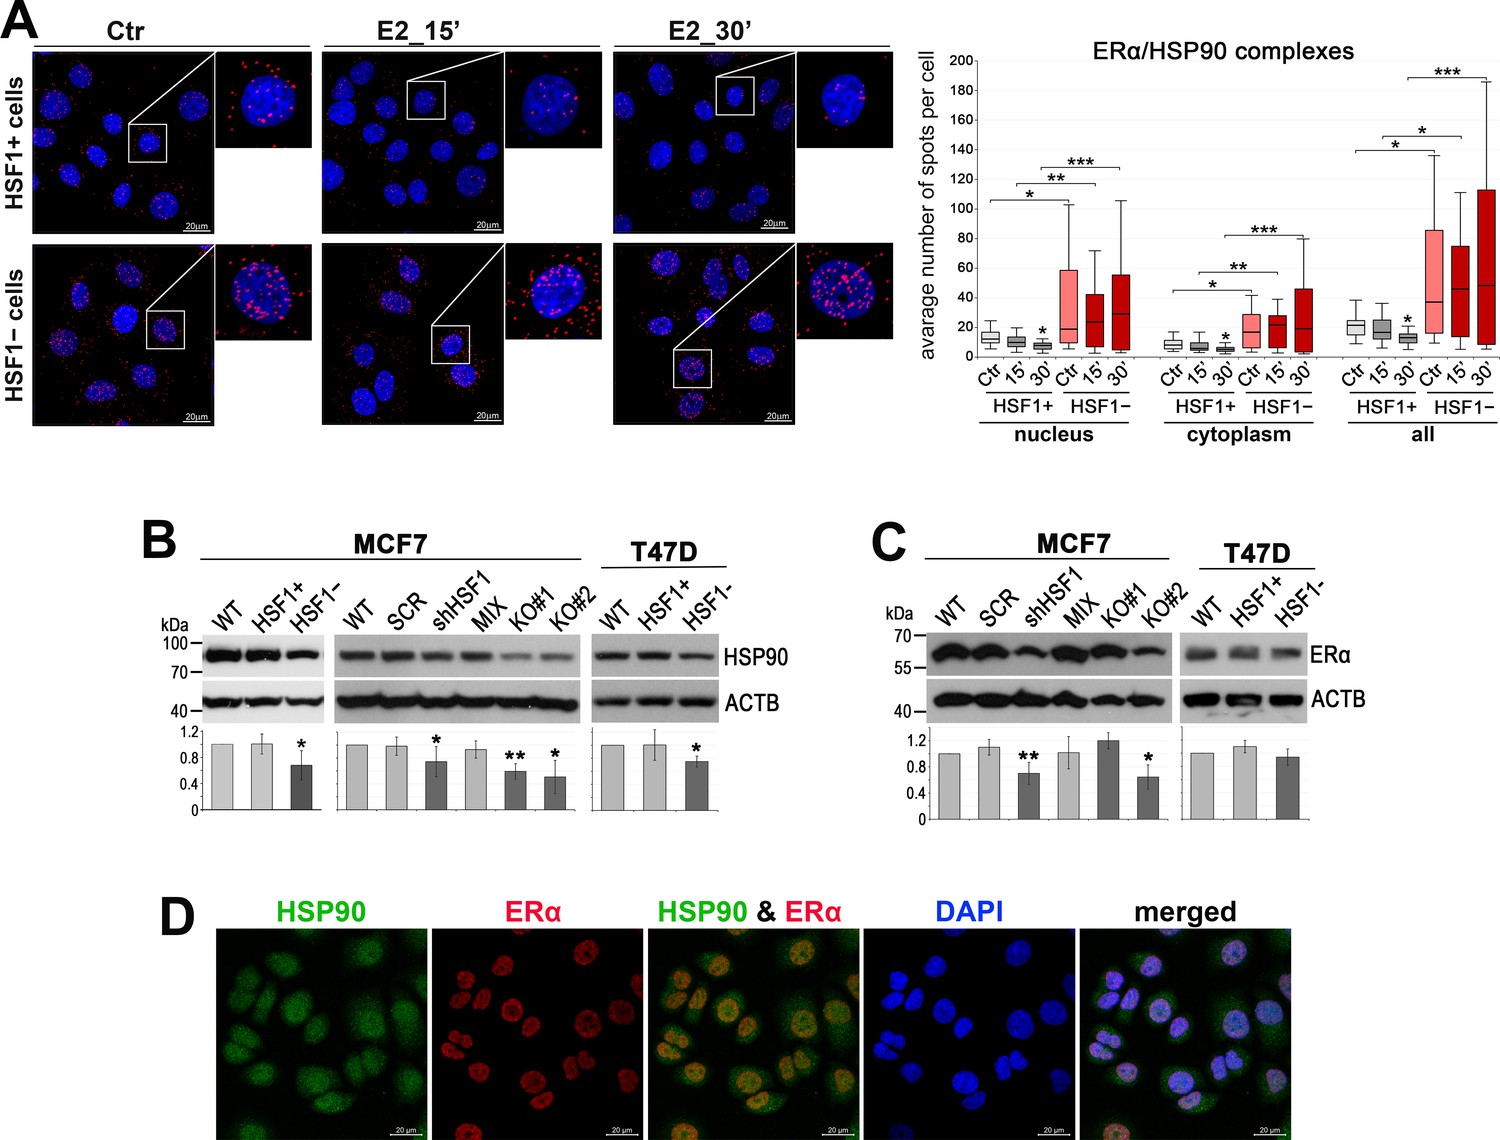
Analyses of HSP90 and ERα expression/interactions in ER-positive breast cancer cells.
(A) Interactions between ERα and HSP90 assessed by Proximity Ligation Assay (PLA; red spots) in HSF1-positive (HSF1+) and HSF1-negative (HSF1−) MCF7 cells created using DNA-free CRISPR/Cas9 system. Ctr, untreated cells; E2, 17β-estradiol treatment (10 nM). DNA was stained with DAPI. Scale bar, 20 μm. The mean number of spots per cell is shown in the boxplots below, which represent the median, upper and lower quartiles, maximum and minimum; ***p<0.0001, **p<0.001, *p<0.05 – significance of differences versus the corresponding control (above the box) or between cell variants. (B) Western blot analysis of HSP90 and (C) ERα levels in MCF7 and T47D cells cultured in standard conditions: unmodified (WT), variants stably transduced with nonspecific shRNA (SCR) or with HSF1-specific shRNA (shHSF1), a combination of control clones (MIX, HSF1+), two HSF1-negative clones (KO#1, KO#2), and a combination of HSF1-negative (HSF1−) clones arisen from single cells following CRISPR/Cas9 gene targeting. Actin (ACTB) was used as a protein loading control. The graphs show the results of densitometric analyses (n = 3); **p<0.001, *p<0.05 – significance of differences versus the corresponding control. (D) HSP90 and ERα localization assessed by immunofluorescence in wild-type MCF7 cells. DNA was stained with DAPI. Scale bar, 20 μm.
Figure 4 with 2 supplements
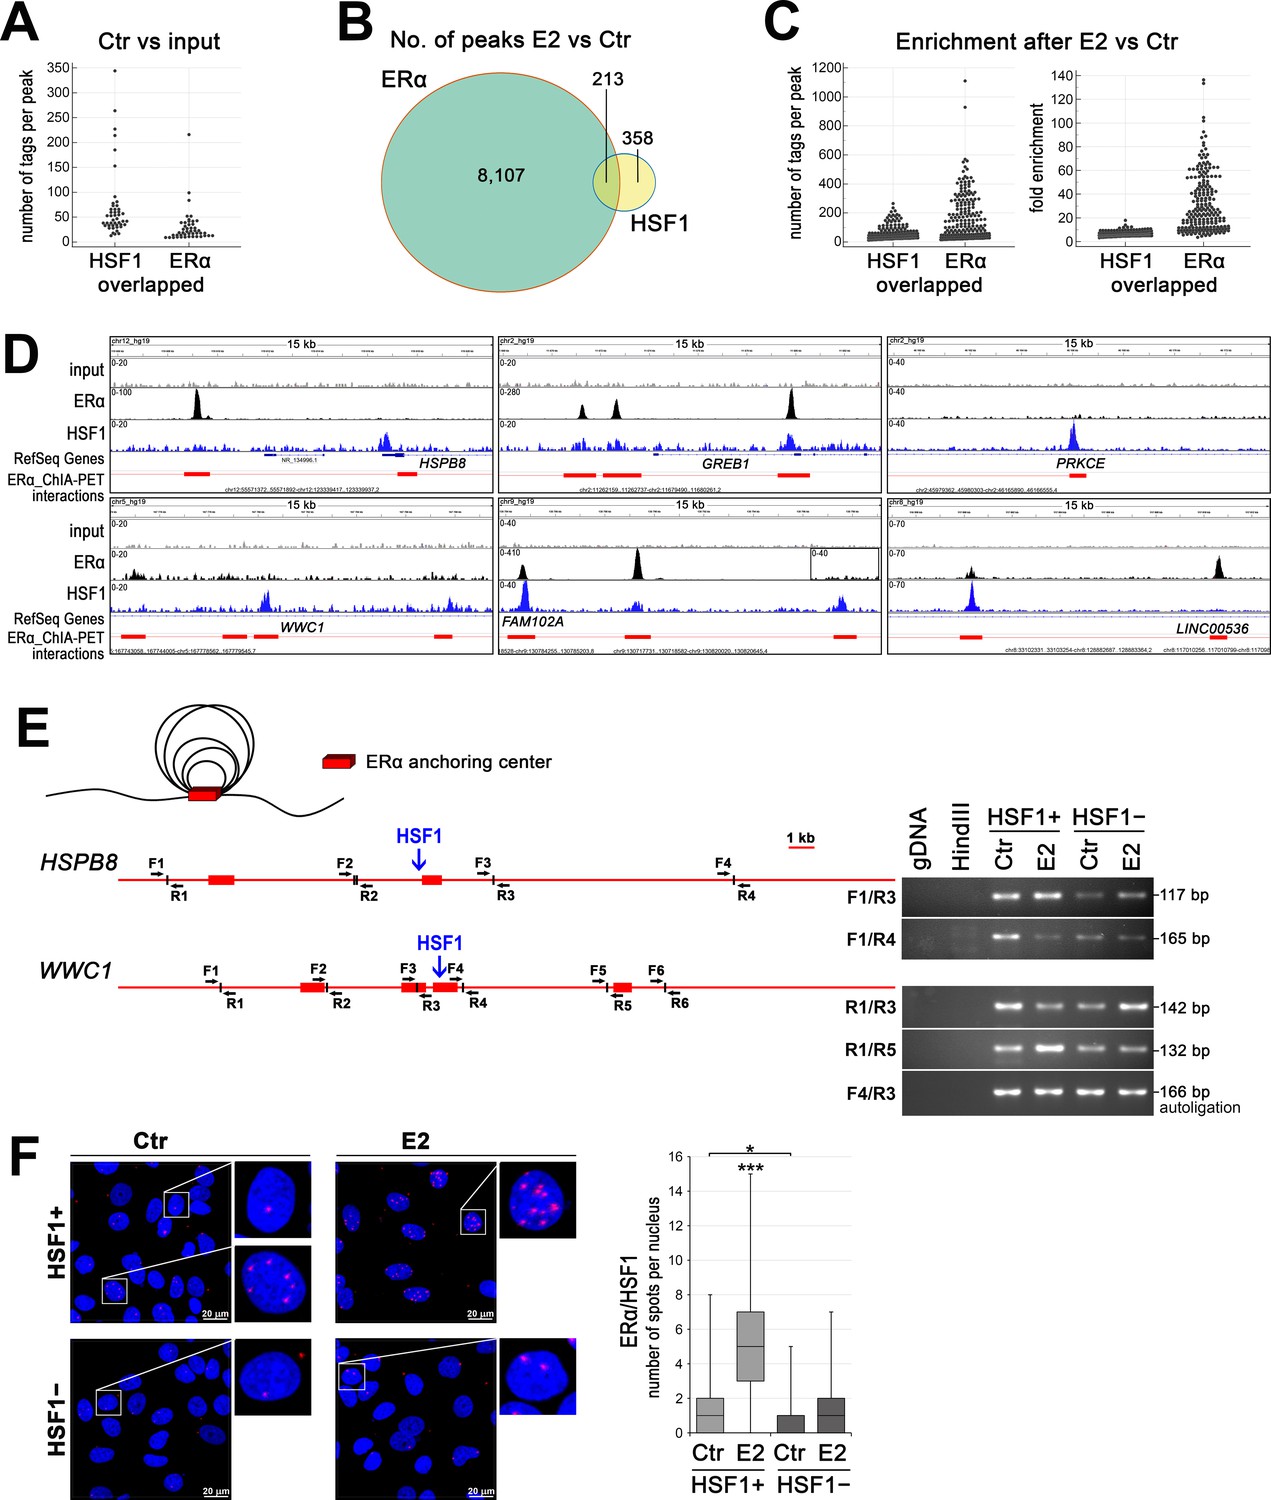
HSF1 may cooperate with ERα in DNA binding and take a part in chromatin organization.
(A) Overlapped HSF1 and ERα ChIP-seq peaks in untreated wild-type MCF7 cells – peak size distribution (number of tags per peak). (B) The number of overlapped ERα and HSF1 peaks identified after E2 stimulation in wild-type MCF7 cells. (C) Overlapped HSF1 and ERα ChIP-seq peaks in wild-type MCF7 after E2 stimulation – peak size distribution (number of tags per peak) and fold enrichment. (D) Examples of ERα and HSF1 peaks identified by MACS in ChIP-seq analyses in wild-type MCF7 cells after E2 treatment and corresponding ChIA-PET interactions (Fullwood et al., 2009) downloaded from ENCODE database and visualized by the IGV browser. The red bar shows the ERα anchor region (interacting loci), the red line – the intermediate genomic span between the two anchors forming a putative loop; the scale for each sample is shown in the left corner. (E) ERα-mediated chromatin interactions analyzed by chromosome conformation capture (3C) technique in HSPB8 and WWC1 loci. The scheme represents ERα anchor regions (red bars), HSF1-binding sites (blue arrows), and forward (F) and reverse (R) primers around subsequent HindIII cleavage sites. A model of chromatin loops resulting from interactions between ERα anchor regions is also illustrated above. Interactions between selected DNA regions were analyzed by PCR in untreated and E2-stimulated HSF1+ and HSF1− cells. (F) Interactions between ERα and HSF1 assessed by Proximity Ligation Assay (PLA) (red spots) in HSF1+ and HSF1− MCF7 cells after E2 treatment. DNA was stained with DAPI. Scale bar, 20 μm. Representative nuclei are enlarged. The number of spots per nucleus is shown in boxplots (which represent the median, upper and lower quartiles, maximum and minimum). ***p<0.0001, *p<0.05. E2, 10 nM for 60 min (or 30 min for 3C).
Figure 4—figure supplement 1
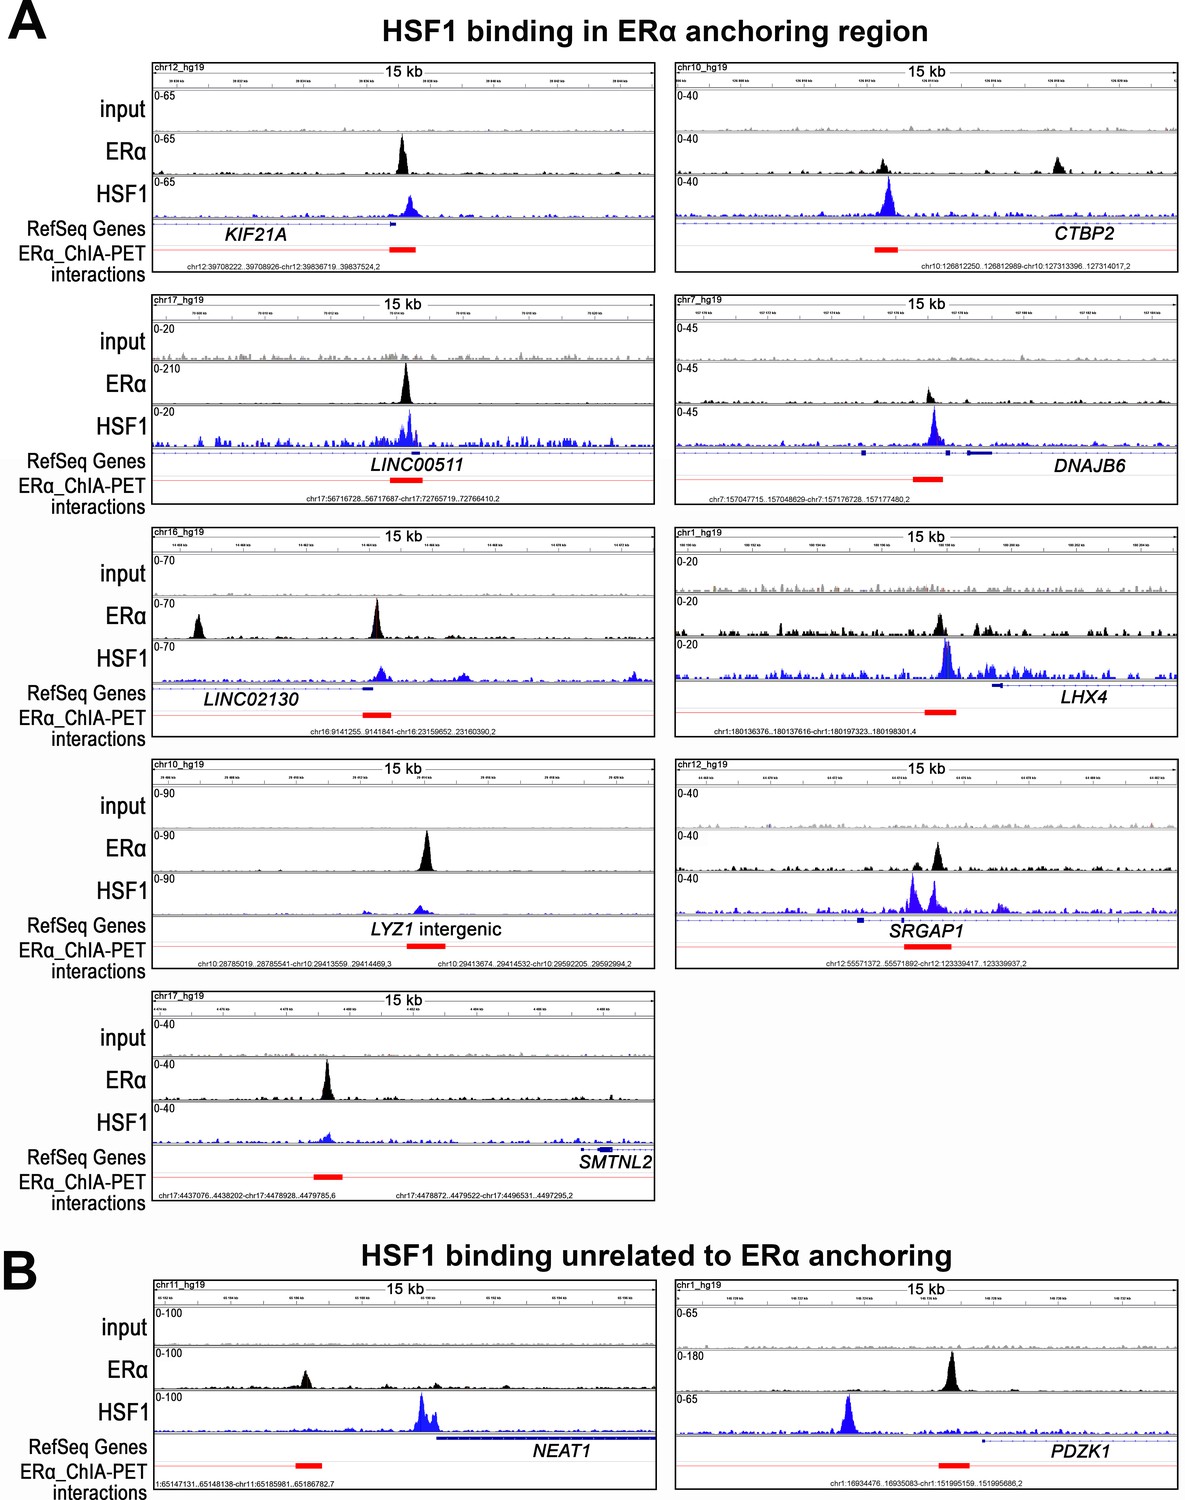
Examples of different patterns of ERα and HSF1 binding to chromatin.
(A) HSF1 binding in ERα anchoring region. (B) HSF1 binding unrelated to ERα anchoring. Peaks identified by MACS in ChIP-seq analyses in wild-type MCF7 cells after E2 treatment (10 nM, 60 min) and corresponding ChIA-PET interactions (Fullwood et al., 2009) downloaded from ENCODE database and visualized by the IGV browser. The red bar shows the ERα anchor region (interacting loci), red line – a loop (the intermediate genomic span between the two anchors). The scale for each sample is shown in the left corner.
Figure 4—figure supplement 2
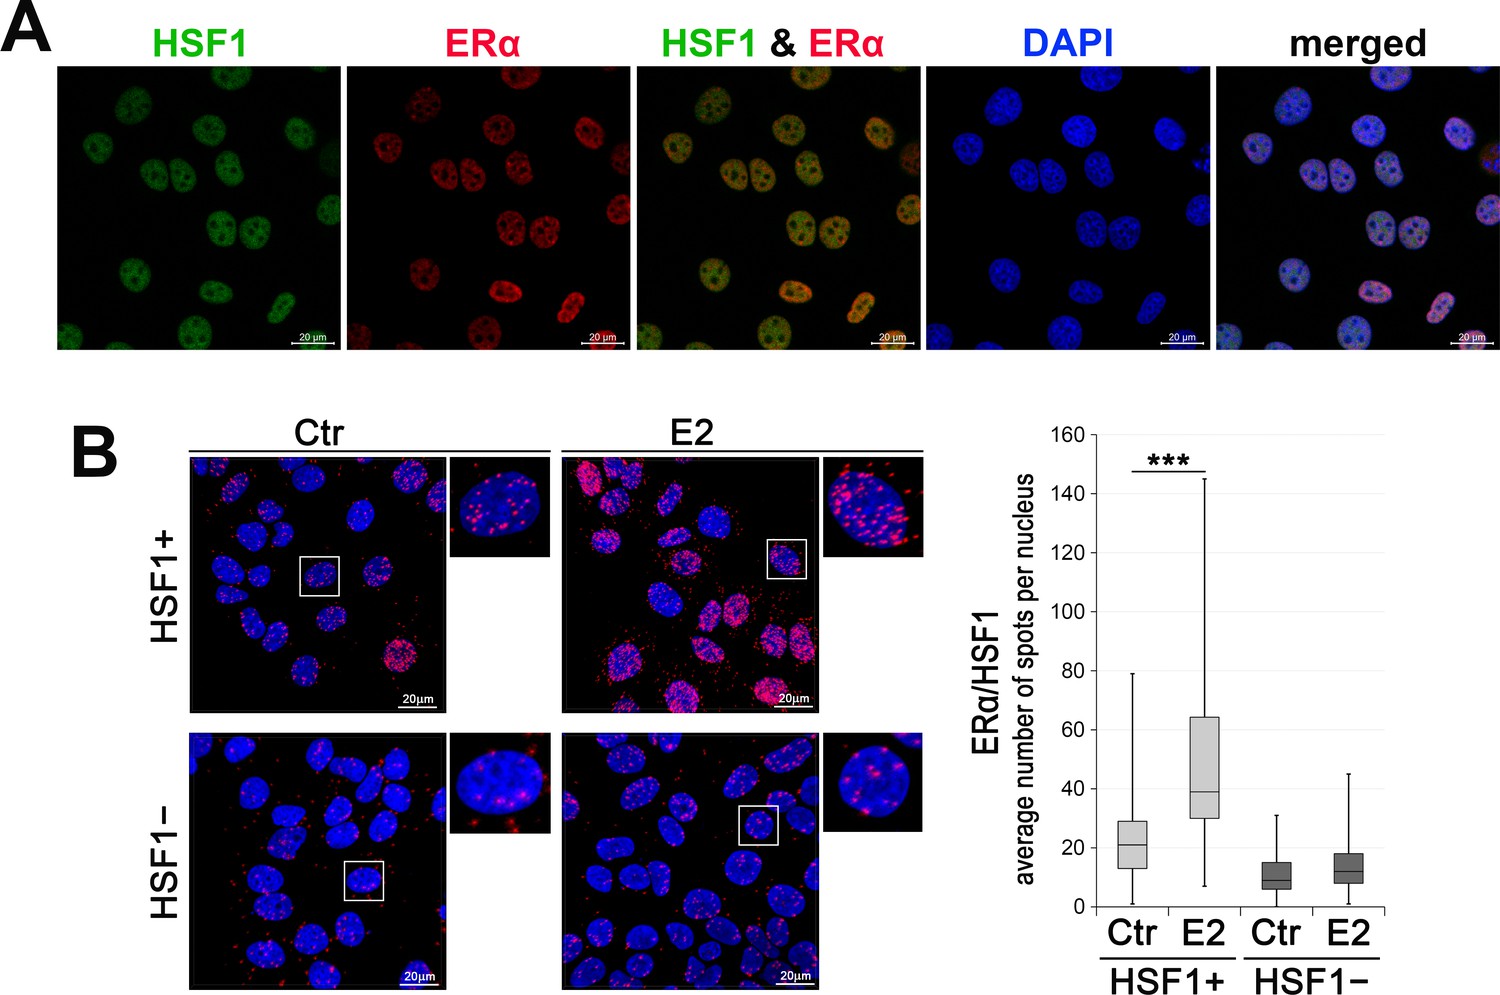
Analyses of ERα, and HSF1 expression/interactions in ER-positive breast cancer cells.
(A) HSF1 and ERα localization assessed by immunofluorescence in wild-type MCF7 cells. DNA was stained with DAPI. Scale bar, 20 μm. (B) Interactions between ERα (mouse Ab) and HSF1 (rabbit Ab) assessed by Proximity Ligation Assay (PLA) (red spots) in HSF1+ and HSF1− MCF7 cells after E2 treatment (10 nM for 60 min). DNA was stained with DAPI. Scale bar, 20 μm. Representative nuclei are enlarged. The average number of spots per nucleus is shown in boxplots. ***p<0.0001.
Figure 5

Classification of the ERα and HSF1-binding patterns in gene regulatory regions in estrogen-treated MCF7 cells.
(A) A workflow of the search for possible ERα and HSF1-binding patterns based on the presence (+) and absence (−) of estrogen-response element (ERE) and heat shock element (HSE) motifs within the binding/anchoring sites detected by ChIP-seq/ChIA-PET. (B) Graphical illustration of possible cooperation between ERα and HSF1 in the chromatin. (C) The number of genes potentially regulated by ERα and HSF1 via canonical binding, tethering, or cobinding. Peaks were annotated to the nearest gene transcription start site (several modes of regulation are possible for one gene). (D) Comparative analysis of 569, 220, and 65 genes potentially co-regulated by canonical ERα and HSF1 binding, tethering, and cobinding, respectively; examples of genes are shown in gray boxes.
Figure 6 with 2 supplements
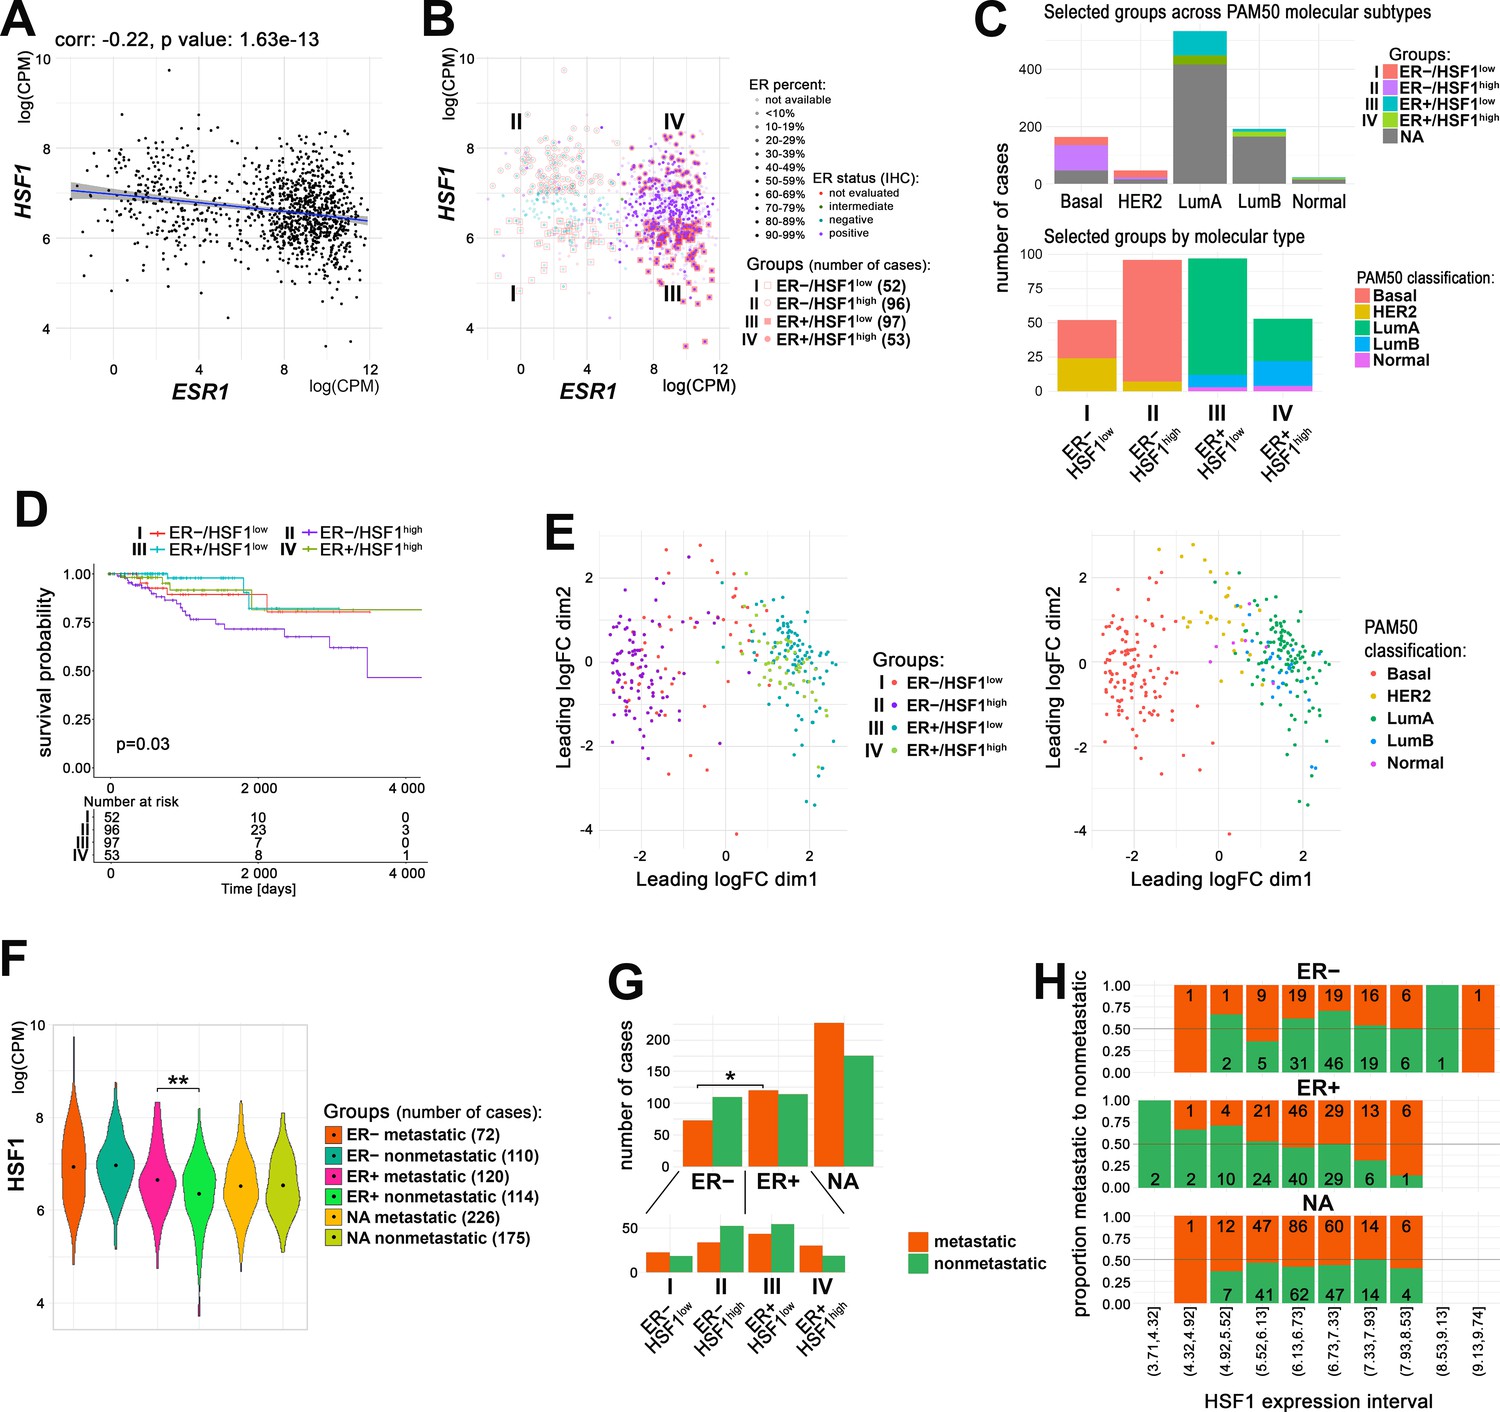
Relationship between ERα and HSF1 expression in breast cancer.
(A) Correlation of HSF1 and ESR1 transcript level in all TCGA breast cancers. Each dot represents one cancer case; log(CPM), log2-counts per million. (B) Cases with markedly different mRNA levels of ESR1 (additionally, protein level determined by immunohistochemistry [IHC] was considered) and HSF1 selected for further analyses (groups I–IV). (C) Characteristics of selected groups by the molecular subtypes of breast cancer. (D) Kaplan–Meier plots for all selected groups. (E) Multidimensional scaling (MDS) plots of selected cases with marked: ER and HSF1 statuses (left) or molecular subtypes (right). (F) Plots of HSF1 expression levels in groups defined by ER status and presence/absence of metastases (**p<0.001). Black dots represent mean values. (G) Metastatic and nonmetastatic cases in groups of patients defined by ER status and HSF1 expression level. *p<0.05. (H) The proportion of metastatic (red) to nonmetastatic (green) cases (and their number) in ER+, ER−, and NA groups with different levels of HSF1 expression (deciles). ER+/−, estrogen receptor-positive/negative; HSF1high, high HSF1 level, HSF1low, low HSF1 level; NA, not assigned to any group.
Figure 6—figure supplement 1
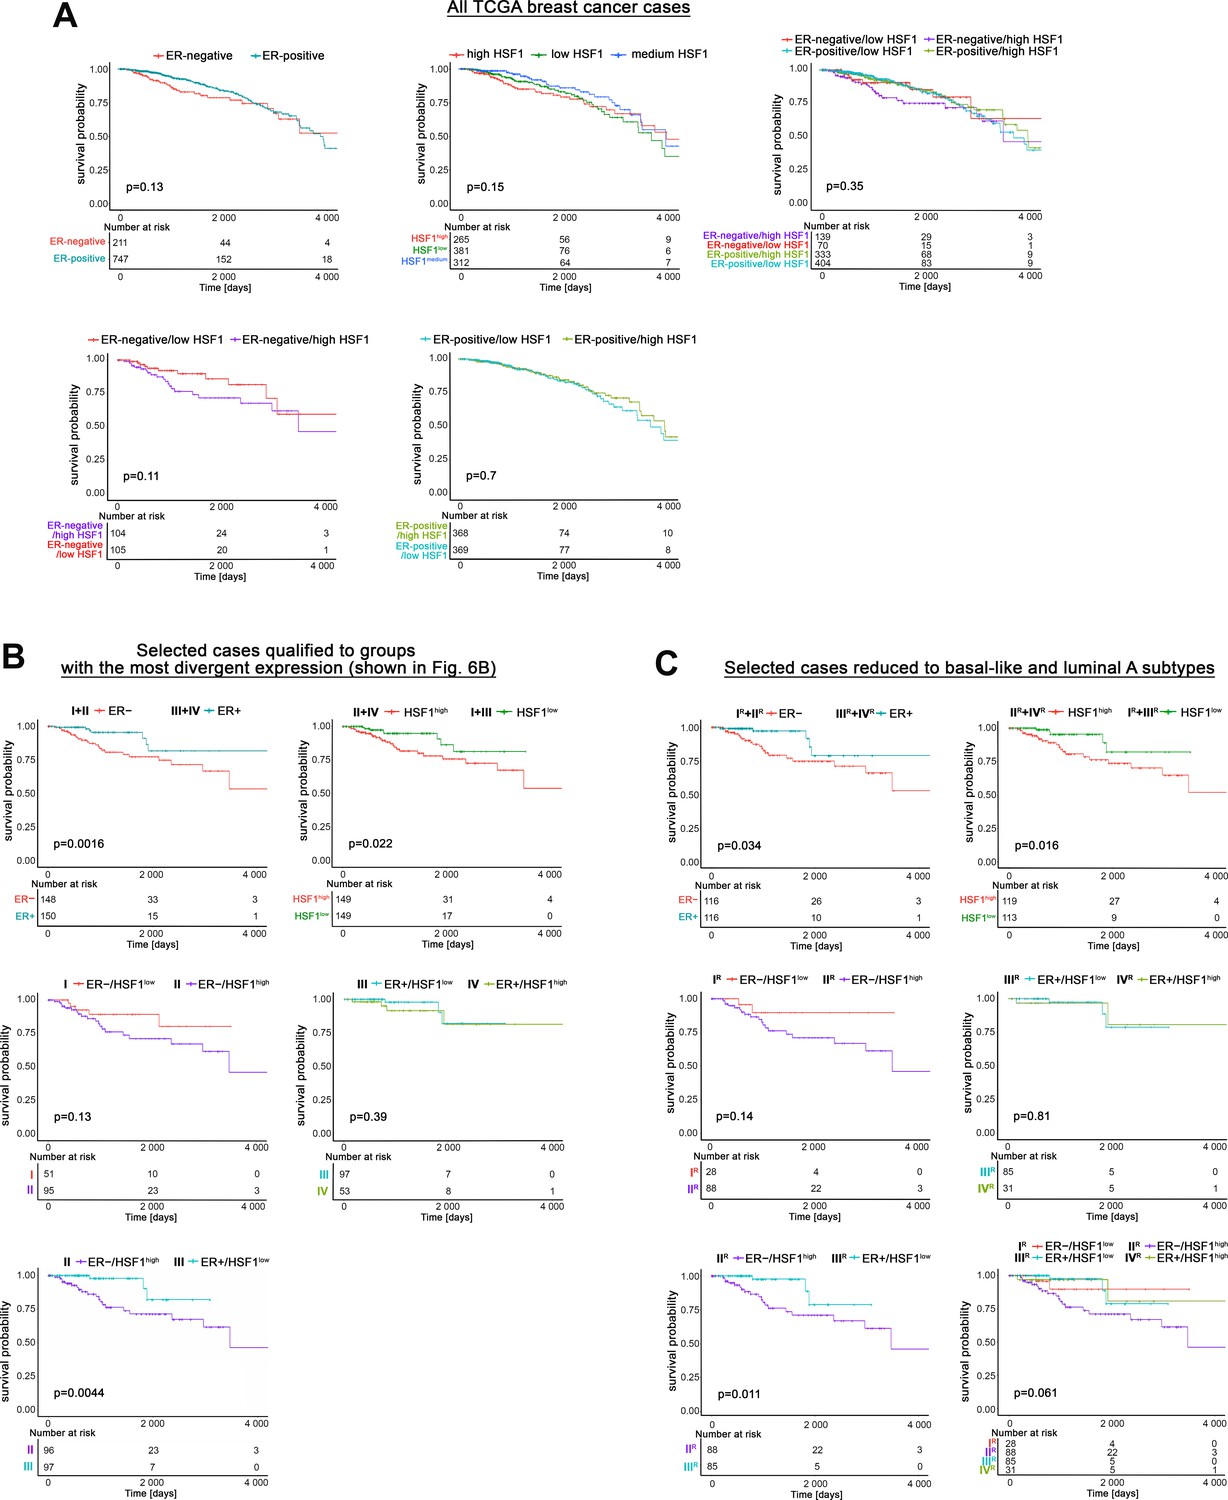
Effect of ESR1 and HSF1 transcript levels on survival in TCGA breast cancer patients cohort analyzed separately or in combination using the Kaplan–Meier plotter.
(A) All TCGA breast cancer cases. In the combined analysis, patients were split into high HSF1 and low HSF1 groups by the median value of HSF1 expression. (B) Cases with the most divergent ESR1 or HSF1 expression selected as shown in Figure 6B. (C) Selected cases were limited to basal-like and luminal A subtypes as shown in Figure 7B.
Figure 6—figure supplement 2
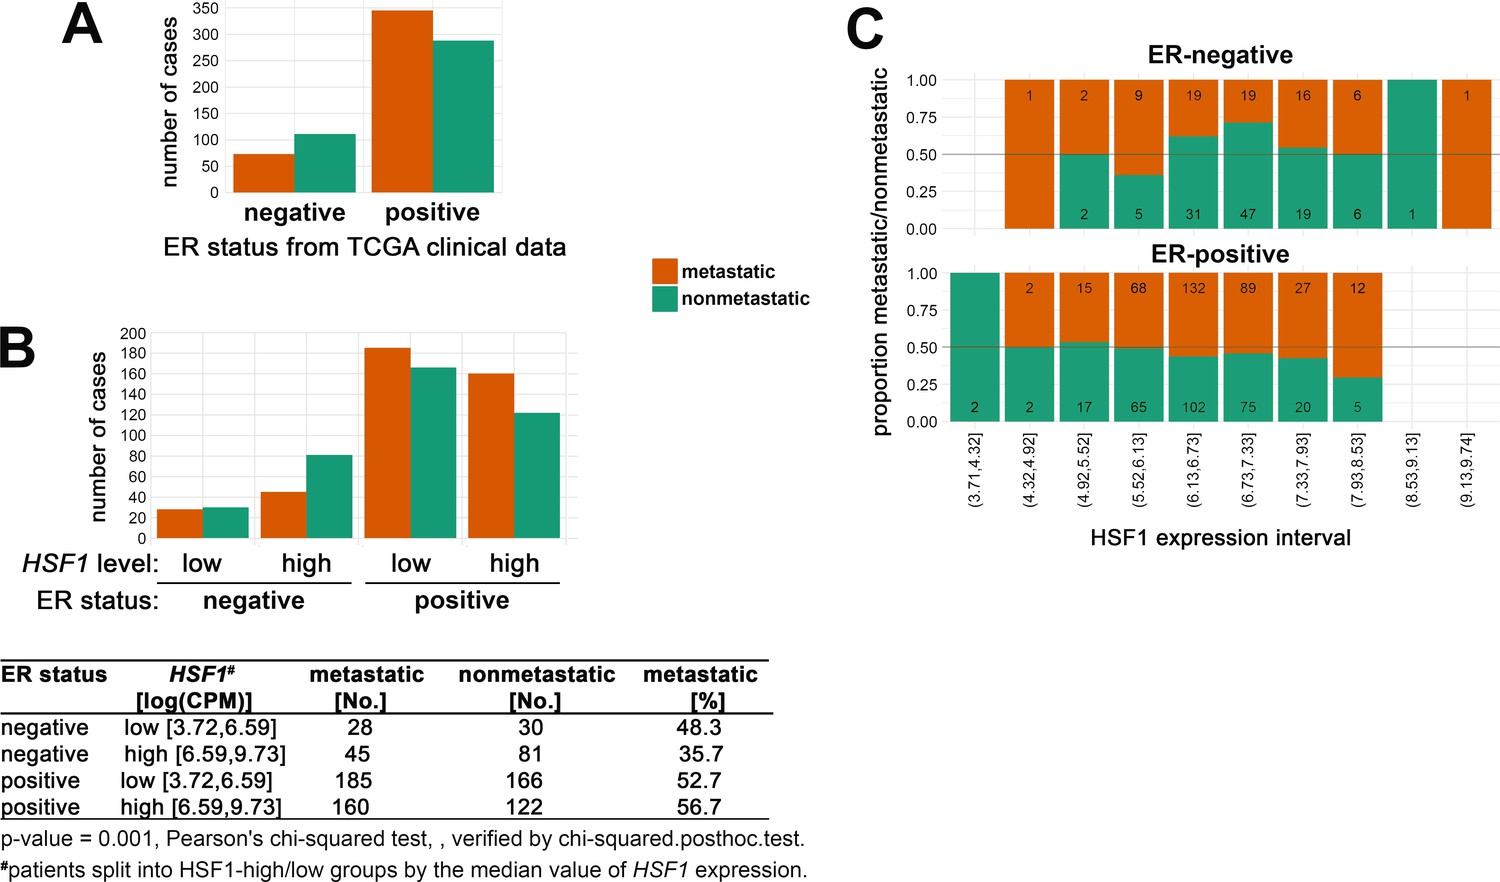
Metastatic and nonmetastatic breast cancer cases in subgroups of patients defined by (A) ER status only (from TCGA clinical data); (B) ER status and HSF1 expression level.
(C) The proportion of metastatic (red) to nonmetastatic (green) cases (and their number) in ER-positive and ER-negative groups with different levels of HSF1 expression (deciles).
Figure 7 with 2 supplements
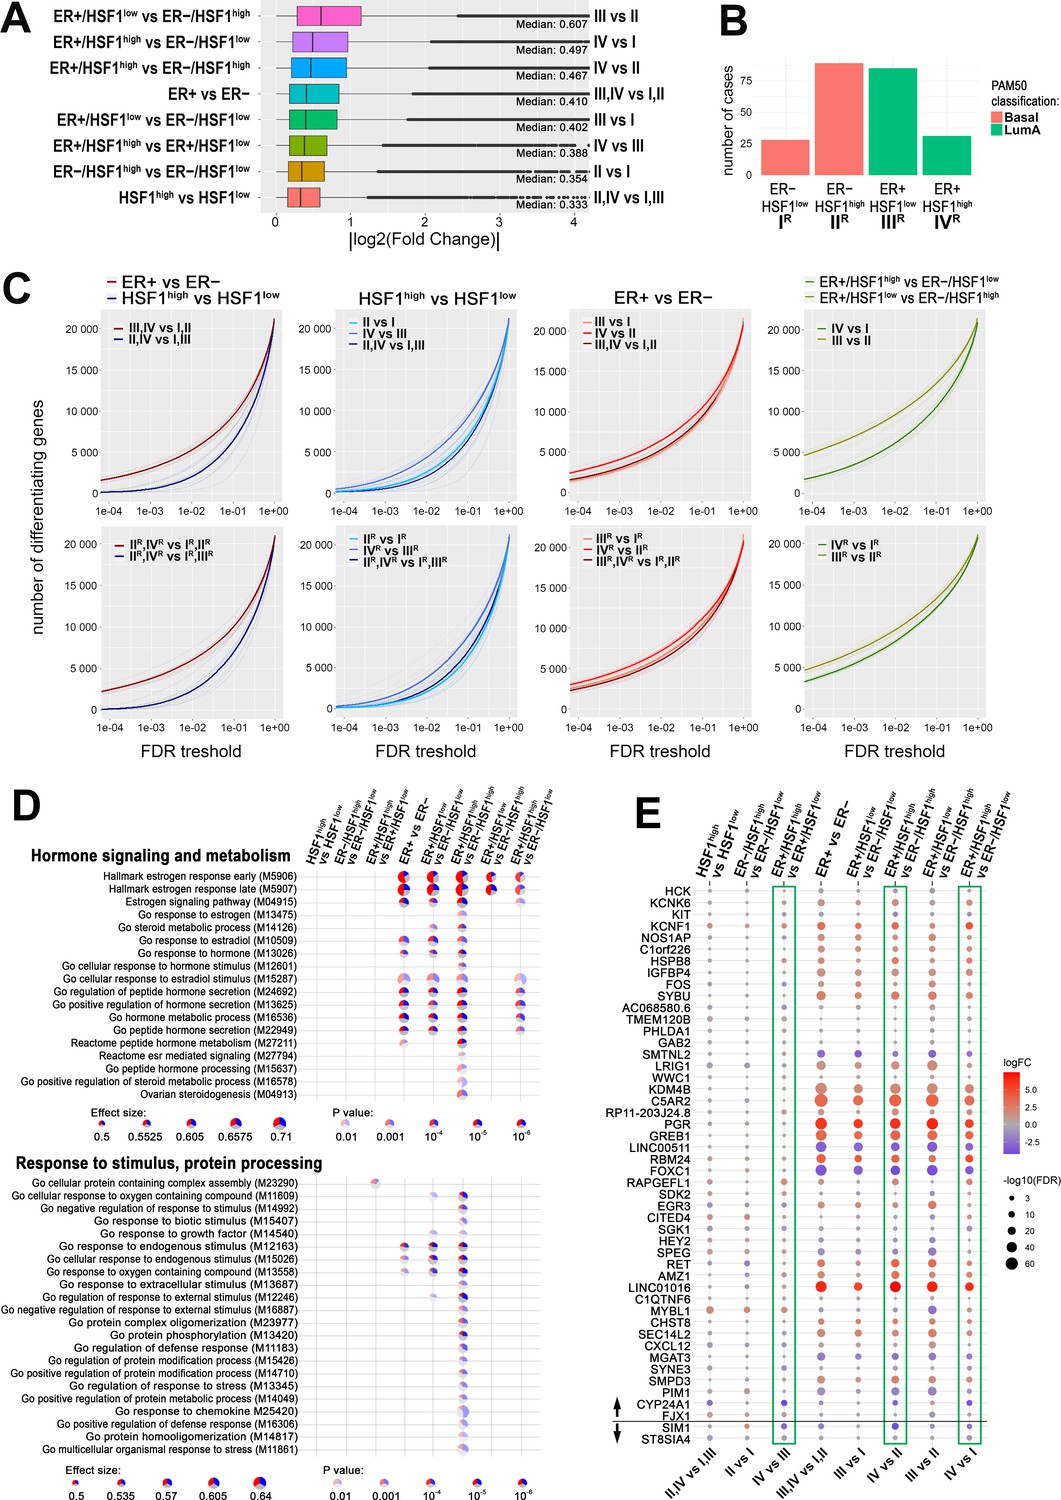
HSF1 increases the disparity of the transcriptome of ER-positive breast cancer.
(A) Boxplots of fold changes (log fold change [logFC] absolute values) illustrating differences in gene expression between groups characterized in Figure 6; represented are the median, upper/lower quartiles, and the highest/lowest values (excluding outliers shown as dots). (B) Composition of ER+ and ER− groups with different levels of HSF1 reduced to one molecular subtype (luminal A and basal, respectively). (C) The number of differently expressed genes (y-axis) plotted cumulatively against the false discovery rate (FDR) value of differences (x-axis). Comparisons of ER+ and ER− cancer cases as well as HSF1high and HSF1low: all cases (upper graphs; for group indexes see panel A) and cases from pre-selected cancer subtypes (lower graphs; for group indexes, see panel B). (D) Gene set enrichment analyses showing differences between ER+ and ER− breast cancers with different HSF1 levels. Terms related to hormone signaling and metabolism and response to stimulus and protein processing in comparisons between groups that were selected in Figure 6B. Blue, a fraction of downregulated genes; red, a fraction of upregulated genes. (E) Differences in the expression of the E2-regulated gene set (as identified in MCF7 cells by RNA-seq; see Figure 2 and Figure 2—figure supplement 1) between breast cancers with different levels of ESR1 and HSF1 selected from TCGA database and qualified into four groups as shown in Figure 6B. Green boxes mark all possible comparisons between the ER+/HSF1high group to other groups. The black horizontal line separates genes up- and downregulated after E2 treatment in MCF7 cells.
Figure 7—figure supplement 1
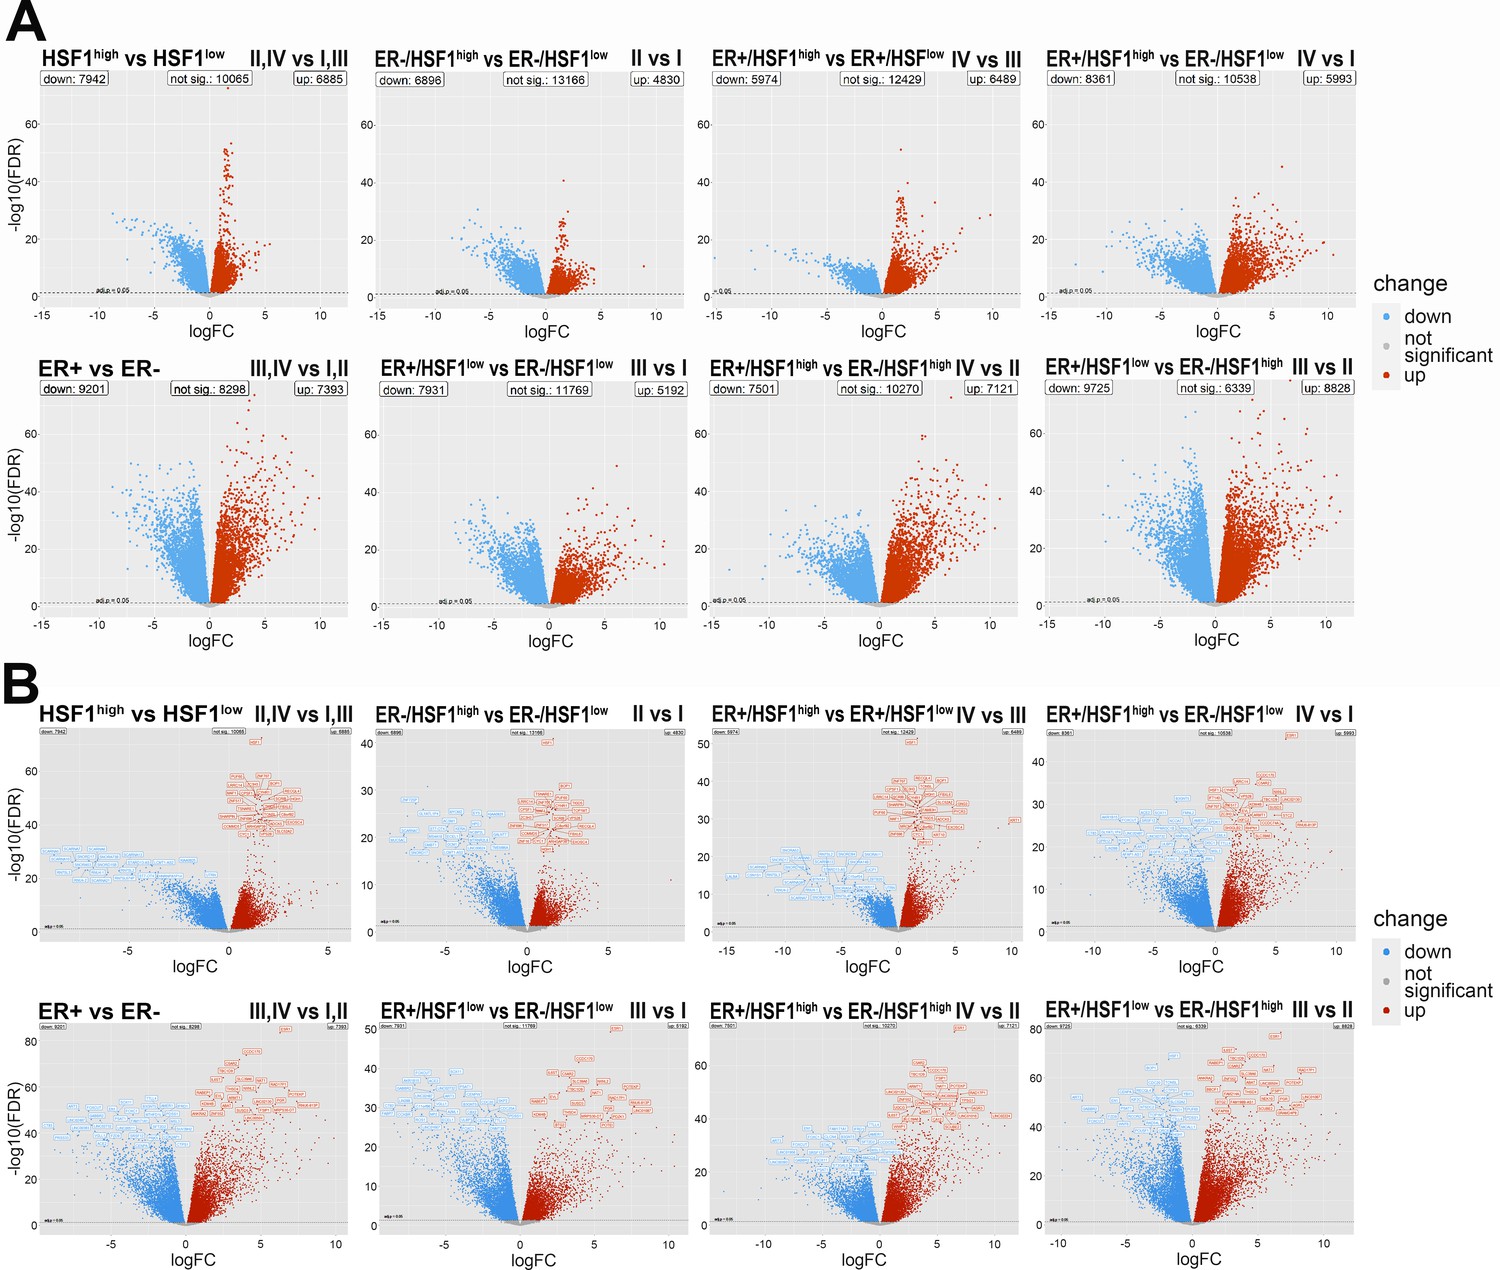
Volcano plots showing differential expression patterns between two distinct groups of breast cancers with different levels of ESR1 and HSF1 expression.
(A) Without gene labels (the same scale is kept). (B) With gene labels. The points in the plots represent genes with statistically significant increased expression in the first group (red) or in the second group (blue) in the given comparison; group symbols as in Figure 6 (false discovery rate [FDR] < 0.05).
Figure 7—figure supplement 2
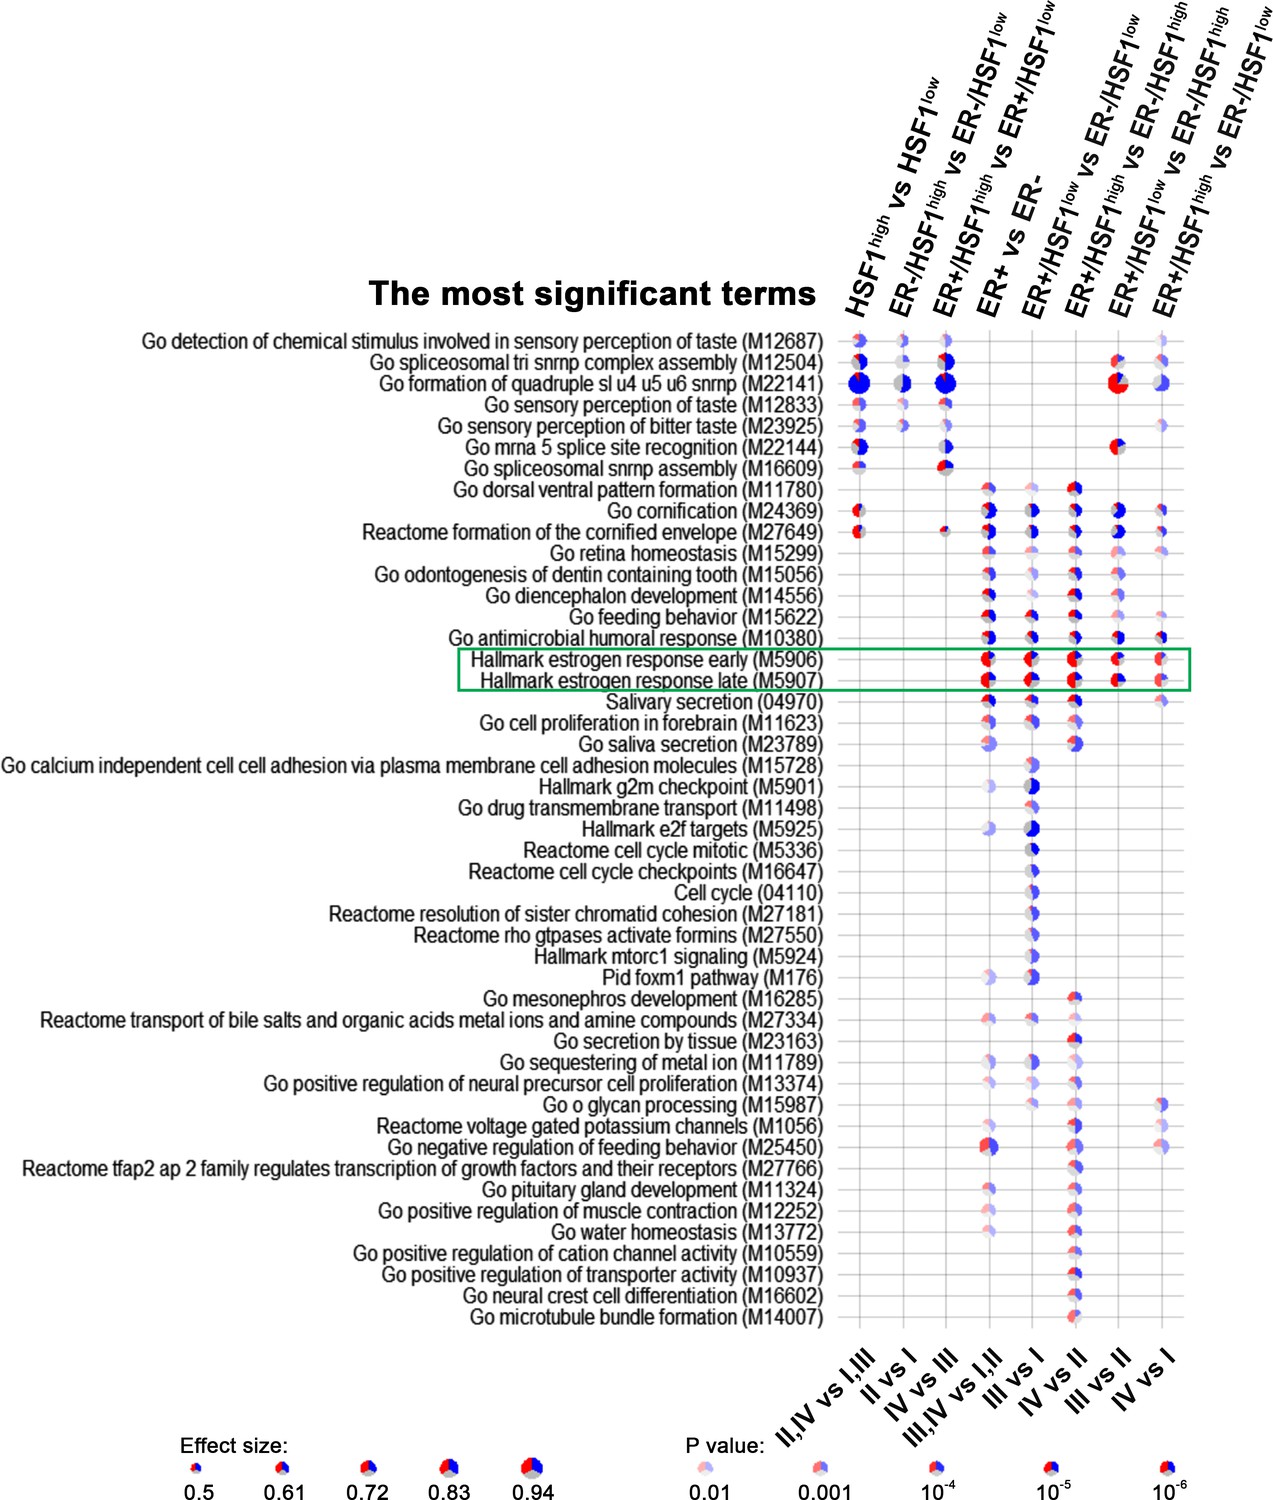
Gene set enrichment analyses showing the most significant terms differentiating ER+ and ER– breast cancers with different HSF1 levels (in comparisons between groups selected in Figure 6B).
Blue, downregulated genes; red, upregulated genes. Terms related to estrogen response are marked with the green rectangle.
Figure 8
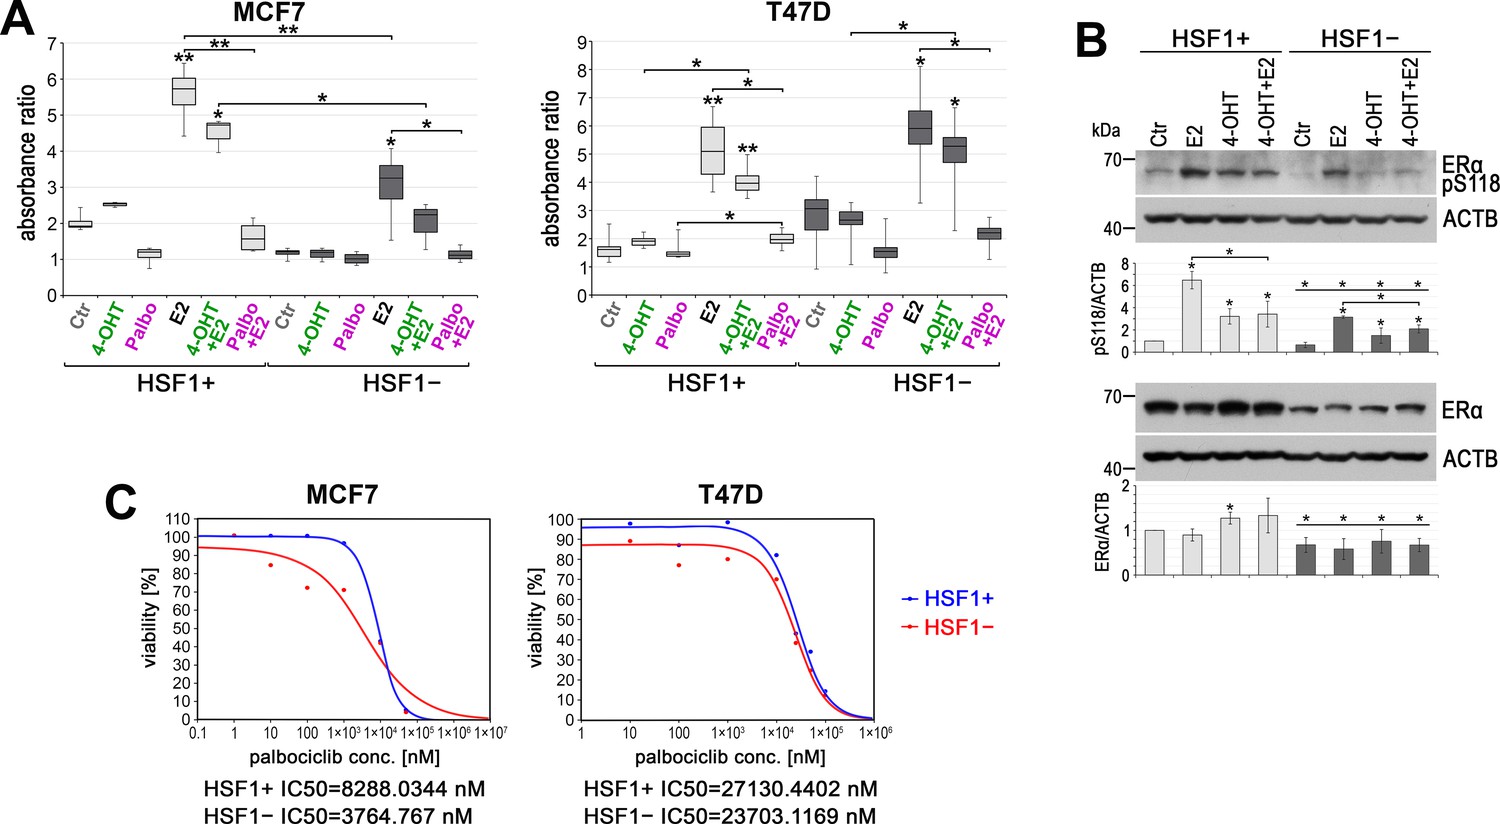
HSF1 functional knockout affects the response of cells to 4-hydroxytamoxifen (4-OHT) and palbociclib (Palbo).
(A) Growth of HSF1+ and HSF1− MCF7 and T47D cells (assessed using crystal violet staining). Cells were treated with DMSO (Ctr), 4-OHT (100 nM), Palbo (1 µM in MCF7 cells, 10 µM in T47D cells), and E2 for 6 days. Boxplots represent the median, upper and lower quartiles, maximum and minimum of absorbance ratio from three independent experiments (each in two technical replicates); **p<0.001, *p<0.05 (significance of differences versus the corresponding control – above the box, or between cell variants/treatments). (B) Western blot analysis of ERα level and its phosphorylated form (pS118) after E2 or/and (4-OHT) treatment in HSF1+ and HSF1− MCF7 cells. Ctr: DMSO; E2: 10 nM E2; 4-OHT: 100 nM 4-OHT; 4-OHT+ E2: 100 nM 4-OHT and 10 nM E2. All cells were incubated for 2 hr, E2 was added 1 hr before harvesting the cells. Actin (ACTB) was used as a protein loading control. Graphs below show the results of densitometric analyses (n = 3). *p<0.05 (significance of differences versus corresponding Ctr – above the bar, or between cell variants, versus the same treatment). (C) Viability of HSF1+ and HSF1− MCF7 and T47D cells treated with palbociclib and assessed by MTS. IC50 plots and values were generated with the Quest Graph IC50 Calculator.
Figure 9
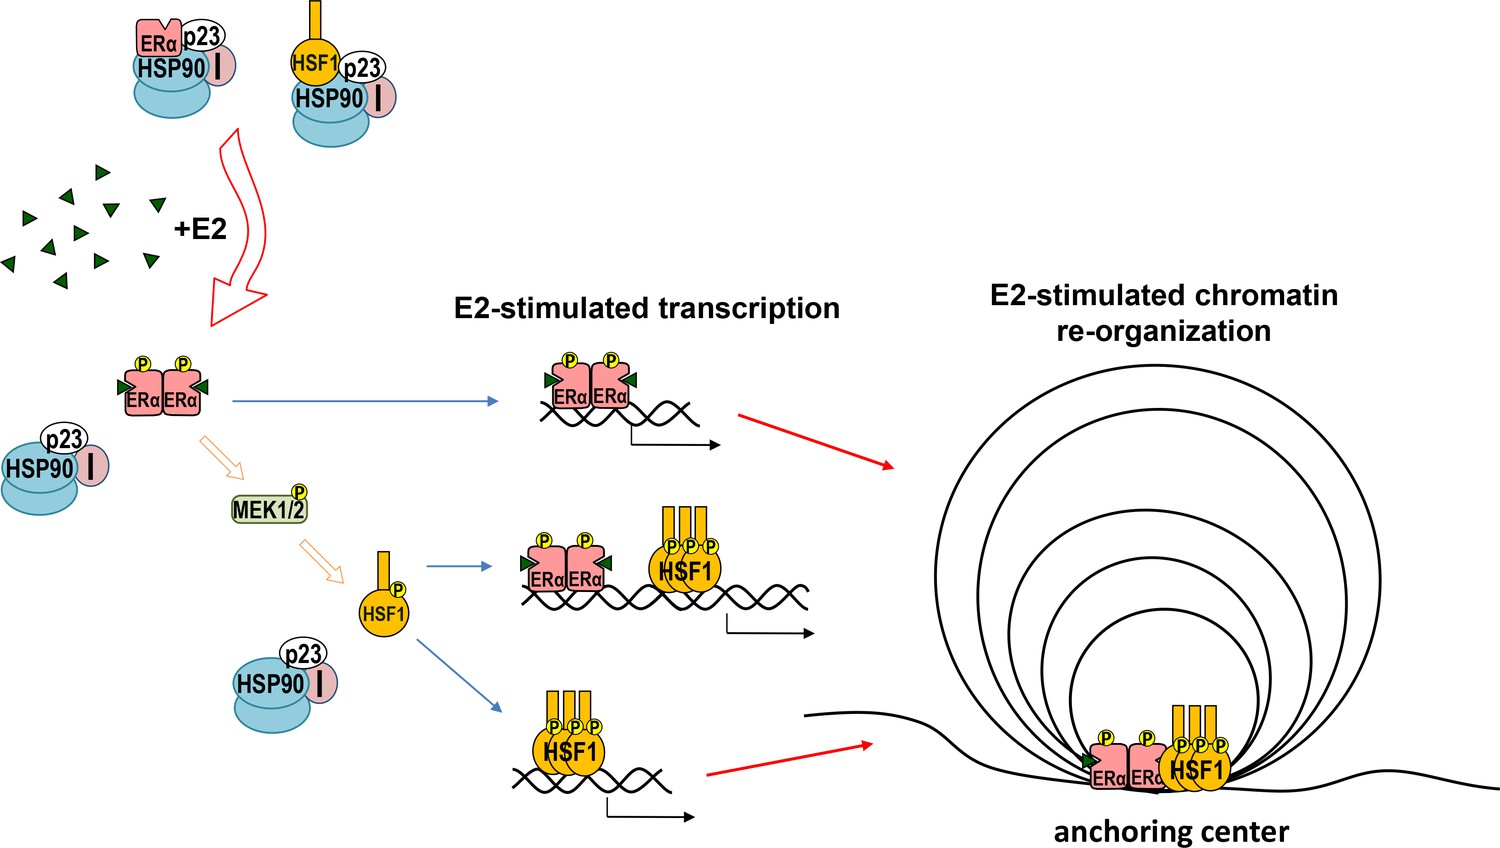
Model of cooperation between ERα and HSF1 in response to estrogen (E2) stimulation.
Both ERα and HSF1 are kept in an inactive state by the complexes of HSP90, p23, and immunophilins (I). The binding of E2 to ERα is connected with the release of the chaperone complex and activation of ERα, leading to the phosphorylation of MEK1/2 followed by HSF1 activation. Oligomers of active transcription factors can bind to DNA and cooperate in the regulation of the transcription either directly or through chromatin reorganization. This may be influenced by other factors (differently in individual cells).
Author response image 1

ERα level (assessed by western blot) is decreased in HSF1− cells (new model), especially in media without phenol red (A) and in wild-type MCF7 cells after treatment with E2 (B).
Cells were seeded on plates and the next day the medium was replaced into a phenol-free medium supplemented with 10% dextranactivated charcoal-stripped FBS. 48 hours later cells were collected (A) or E2 was added to a final concentration of 10 nM for the indicated time (B).
Tables
Key resources table
| Reagent type (species) or resource | Designation | Source or reference | Identifiers | Additional information |
|---|---|---|---|---|
| Cell line (Homo sapiens) | MCF7 | American Type Culture Collection | Cat#:HTB-22; RRID:VCL_0031 | |
| Cell line (H. sapiens) | T47D | European Collection of Authenticated Cell Cultures | Cat#:85102201; RRID:CVCL_0553 | |
| Transfected construct (human) | Edit-R Human HSF1 crRNAs | Dharmacon, Horizon Discovery Group Company | Cat#:CM-012109-02-0002 | Transfected construct (human)5′GGTGTCCGGGTCGCTCACGA |
| Transfected construct (human) | Edit-R Human HSF1 crRNAs | Dharmacon, Horizon Discovery Group Company | Cat#:CM-012109-05-0002 | Transfected construct (human)AAAGTGGTCCACATCGAGCA |
| Transfected construct (human) | Edit-R Human HSF1 crRNAs | Dharmacon, Horizon Discovery Group Company | Cat#:CM-012109-03-0002 | Transfected construct (human)GTGGTCCACATCGAGCAGGG |
| Transfected construct (human) | Edit-R tracrRNA | Dharmacon, Horizon Discovery Group Company | Cat#:U-002005 | Transfected construct |
| Antibody | Anti-HSF1 (rabbit polyclonal) | Enzo, Life Sciences, Famingdale, NY | Cat#:ADI-SPA-901; RRID:AB_1083465 | WB (1:4000),IF (1:300)PLA (1:300)ChIP (4 μg/sample) |
| Antibody | Anti-HSF1 (E-4) (mouse monoclonal) | Santa Cruz Biotechnology, Inc, Inc, Dallas, TX | Cat#:sc-17757; RRID:AB_627753 | PLA (1:200) |
| Antibody | Anti-ERα (estrogen receptor α) (D8H8) (rabbit monoclonal) | Cell Signaling Technology, Danvers, MA | Cat#:8644; RRID:AB_2617128 | WB (1:1000)PLA (1:200) |
| Antibody | Anti-ERα (mouse monoclonal) ERalpha | Diagenode, Liège, Belgium | Cat#:C15100066; RRID:AB_2716575 | PLA (1:200)ChIP (4 μg/sample)IF (1:200) |
| Antibody | Anti-phosphoERα (S118) (16J4) (mouse monoclonal) | Cell Signaling Technology, Danvers, MA | Cat#:2511; RRID:AB_331289 | WB (1:2000) |
| Antibody | Anti-ACTB (AC-15)(HRP) (mouse monoclonal) | Sigma-Aldrich, Merck KGaA, Darmstadt, Germany | Cat#:A3854; RRID:AB_262011 | WB (1:25,000) |
| Antibody | Anti-HSP90 (rabbit polyclonal) | Enzo, Life Sciences, USA Famingdale, NY | Cat#:ADI-SPA-836; RRID:AB_10615944 | WB (1:2000)PLA (1:200)IF (1:200) |
| Antibody | Anti-HSP70 (HSPA1) (mouse monoclonal) | Enzo, Life Sciences, Famingdale, NY | Cat#:ADI-SPA-810; RRID:AB_10616513 | WB (1:2000) |
| Antibody | Anti-HSP105 (rabbit polyclonal) | BioVision, Milpitas, CA | Cat#:3390-100; RRID:AB_2264190 | WB (1:600) |
| Antibody | Anti-HSPB8/HSP22 (rabbit polyclonal) | Cell Signaling Technology, Danvers, MA | Cat#:3059; RRID:AB_2248643 | WB (1:1000) |
| Antibody | Anti-TDAG51 (PHLDA1) (RN-E62) (mouse monoclonal) | Santa Cruz Biotechnology, Inc, Inc, Dallas, TX | Cat#:sc-23866; RRID:AB_628117 | WB (1:1000) |
| Antibody | Anti-EGR3 (A-7) (mouse monoclonal) | Santa Cruz Biotechnology, Inc, Inc, Dallas, TX | Cat#:sc-390967; RRID:AB_2894831 | WB (1:1000) |
| Antibody | Anti-HSC70 (HSPA8) (B-6) (mouse monoclonal) | Santa Cruz Biotechnology, Inc, Inc, Dallas, TX | Cat#:sc-7298; RRID:AB_627761 | WB (1:5000) |
| Antibody | Anti-mouse IgG (HRP) | Millipore, Billerica, MA | Cat#:AP124P; RRID:AB_90456 | WB (1:5000) |
| Antibody | Anti-rabbit IgG (HRP) | Millipore, Billerica, MA | Cat#:AP132P; RRID:AB_90264 | WB (1:2000) |
| Antibody | Anti-rabbit IgG (Alexa Fluor 488) | Abcam, Cambridge, Great Britain | Cat#:ab150077; RRID:AB_2630356 | IF (1:200) |
| Antibody | Anti-mouse IgG (Alexa Fluor 594) | Abcam, Cambridge, Great Britain | Cat#:ab150116; RRID:AB_2650601 | IF (1:200) |
| Recombinant DNA reagent | pLVX-shRNA1 vector | Clontech/Takara Bio USA, Inc. | Cat#:632177 | Lentivirus construct to express a small hairpin RNA (shRNA) |
| Recombinant DNA reagent | pLVX-shHSF1 | This paper | pLVX-shRNA1 vector encoding shRNA specific for HSF1 | |
| Recombinant DNA reagent | Edit-R hCMV-PuroR-Cas9 Expression Plasmid | Dharmacon, Horizon Discovery Group Company | Cat#:U-005100-120 | Cas9 expression vector |
| Sequence-based reagent | qPCR primers | This paper | See Supplementary files 6–8 | |
| Sequence-based reagent | shRNA | This paper | See Materials and methods | |
| Peptide, recombinant protein | eSpCas9-GFP protein | Sigma-Aldrich, Merck KGaA, Darmstadt, Germany | Cat#:ECAS9GFPPR | |
| Commercial assay or kit | Duolink In Situ Red Kit Mouse/Rabbit | Sigma-Aldrich, Merck KGaA, Darmstadt, Germany | Cat#:DUO92101 | |
| Commercial assay or kit | ALDEFLUOR Kit | STEMCELL Technologies | Cat#:01700 | |
| Commercial assay or kit | The iDeal ChIP-seq Kit for Transcription Factors | Diagenode | Cat#:C01010055 | |
| Commercial assay or kit | Direct-Zol RNA MiniPrep Kit | Zymo Research | Cat#:R2052 | |
| Commercial assay or kit | μMacs Streptavidin Kit | Miltenyi Biotec, Bergisch Gladbach, Germany | Cat#:130-074-101 | |
| Commercial assay or kit | CellTiter 96 AQueous One Solution Assay | Promega; Madison, WI | Cat#:G3580 | |
| Commercial assay or kit | SuperSignal West Pico PLUS Chemiluminescent Substrate | Thermo Fisher Scientific, Waltham, MA | Cat#:34577 | |
| Commercial assay or kit | QIAseq Ultralow Input Library Kit | Qiagen, Venlo, Netherlands | Catt#:180492 | |
| Commercial assay or kit | ECM Cell Adhesion Array kit | Sigma-Aldrich, Merck KGaA, Darmstadt, Germany | Cat#:ECM540 | |
| Commercial assay or kit | PCR Master Mix SYBR Green | A&A Biotechnology, Gdynia, Poland | Cat#:2008-100A | |
| Chemical compound, drug | 17 beta-estradiol | Sigma-Aldrich, Merck KGaA, Darmstadt, Germany | Cat#:E4389 | |
| Chemical compound, drug | 4-Hydroxytamoxifen | Sigma-Aldrich, Merck KGaA, Darmstadt, Germany | Cat#:T176 | |
| Chemical compound, drug | Palbociclib, hydrochloride salt | LC Laboratories, Woburn, MA | Cat#:P-7788 | |
| Chemical compound, drug | 4-Thiouridine | Cayman Chemical, Ann Arbor, MI | Cat#:16373-100 | |
| Chemical compound, drug | Puromycin | Sigma-Aldrich, Merck KGaA, Darmstadt, Germany | Cat#:P8833 | |
| Chemical compound, drug | Phalloidin-TRITC | Sigma-Aldrich, Merck KGaA, Darmstadt, Germany | Cat#:P1951 | IF (1:800) |
| Software, algorithm | Adobe Photoshop CS6 | Adobe | Version 13.0.1; RRID:SCR_014199 | |
| Software, algorithm | ImageJ | NIH | RRID:SCR_003070 | |
| Software, algorithm | Samtools | doi:10.1093/bioinformatics/btp352 | RRID:SCR_002105 | |
| Software, algorithm | R software | R Foundation for Statistical Computing | Package v.3.6.2; RRID:SCR_001905 | |
| Software, algorithm | DESeq2 | doi:10.1158/0008-5472.CAN-13-1070 | RRID:SCR_015687 | |
| Software, algorithm | NOISeq | doi:10.1093/nar/gkv711 | Package v.3.12; RRID:SCR_003002 | |
| Software, algorithm | FastQC software | https://www.bioinformatics.babraham.ac.uk/projects/fastqc | RRID:SCR_014583 | |
| Software, algorithm | Hisat2 | doi:10.1038/nmeth.3317 | Version 2.0.5; RRID:SCR_015530 | |
| Software, algorithm | FeatureCounts | doi:10.1093/bioinformatics/btt656 | Version 1.6.5; RRID:SCR_012919 | |
| Software, algorithm | ChIPpeakAnno | doi:10.1186/1471-2105-11-237 | Version 3.24.2; RRID:SCR_012828 | |
| Software, algorithm | deepTools2 | doi:10.1093/nar/gkw257 | Version 3.5.0; SCR_016366 | |
| Software, algorithm | Bowtie2 | doi:10.1038/nmeth.1923 | Version 2.2.9; SCR_016368 | |
| Software, algorithm | MEME Suite | doi:10.1093/nar/gkv416 | Version. 5.4.1; RRID:SCR_001783 | |
| Software, algorithm | MACS software | doi:10.1038/nprot.2012.101 | Version 1.4.2; RRID:SCR_013291 | |
| Software, algorithm | Bedtools software | doi:10.1093/bioinformatics/btq033 | RRID:SCR_006646 | |
| Software, algorithm | MedCalc Statistical Software | MedCalc Software Ltd, Ostend, Belgium | Version 19.2.1; RRID:SCR_015044 | |
| Software, algorithm | ChIPseeker | Bioconductor package | Version 1.26.2; RRID:SCR_021322 | |
| Software, algorithm | TCGAbiolinks package | doi:10.1093/nar/gkv1507 | Version 2.14; RRID:SCR_017683 | |
| Software, algorithm | edgeR package | doi:10.1093/bioinformatics/btp616 | Version 3.28.1; RRID:SCR_012802 | |
| Software, algorithm | Statistica | TIBCO Software Inc | RRID:SCR_014213 | |
| Software, algorithm | MSigDB | doi:10.1073/pnas.0506580102 | RRID:SCR_016863 | |
| Other | Deoxyribonuclease I | Worthington Biochemical Corporation | Cat#:LS006333 | |
| Other | RNAClean XP beads | Beckman Coulter Life Science, Indianapolis, IN | Cat#:A63987 | |
| Other | MTSEA-biotin-XX | Biotium, Fremont, CA | Cat#:90066 | |
| Other | DAPI stain | Invitrogen | Cat#:D1306 | 1 µg/ml |
| Other | DharmaFECT Duo | Dharmacon, Horizon Discovery Group Company | Cat#:T-2010 | Transfection reagent |
| Other | Viromer CRISPR | Lipocalyx GmbH, Halle (Saale), Germany | Cat#:VCr-01LB-01 | Transfection reagent |
| Other | cOmplete Protease Inhibitor Cocktail | Sigma-Aldrich, Merck KGaA, Darmstadt, Germany | Cat#:4693116001 | |
| Other | PhosSTOP (phosphatase inhibitor tablets) | Sigma-Aldrich, Merck KGaA, Darmstadt, Germany | Cat#:4906837001 | |
| Other | Collagen I | Sigma-Aldrich, Merck KGaA, Darmstadt, Germany | Cat#:804592 | |
| Other | Collagen IV | Sigma-Aldrich, Merck KGaA, Darmstadt, Germany | Cat#:C55333 | |
| Other | Fibronectin | Corning, NY | Cat#:354008 |
Additional files
-
Supplementary file 1
Summary table of RNA-seq results (normalized signals and expression fold changes after E2 treatment) in MCF7 cell variants with different levels of HSF1.
- https://cdn.elifesciences.org/articles/69843/elife-69843-supp1-v2.xlsx
-
Supplementary file 2
Summary tables of ChIP-seq results: characteristics of ERα binding in wild-type, HSF1-proficient (MIX), and HSF1-deficient (KO#2) MCF7 cells, untreated (Ctr) and after E2 stimulation.
- https://cdn.elifesciences.org/articles/69843/elife-69843-supp2-v2.xlsx
-
Supplementary file 3
Summary tables of ChIP-seq results: characteristics of ERα and HSF1 common binding regions in wild-type MCF7 cells, untreated (Ctr versus input) and after E2 stimulation (versus Ctr).
- https://cdn.elifesciences.org/articles/69843/elife-69843-supp3-v2.xlsx
-
Supplementary file 4
Lists of all HSF1 and ERα ChIP-seq peaks (E2 versus input) and ERα anchoring regions with annotation and information about the presence of ERE and HSE motifs in wild-type MCF7 cells.
- https://cdn.elifesciences.org/articles/69843/elife-69843-supp4-v2.xlsx
-
Supplementary file 5
Differential expression tests between selected groups of breast cancer patients with different ESR1 and HSF1 statuses based on RNA-seq data deposited in TCGA database.
- https://cdn.elifesciences.org/articles/69843/elife-69843-supp5-v2.xlsx
-
Supplementary file 6
RT-qPCR primers for gene expression analyses.
- https://cdn.elifesciences.org/articles/69843/elife-69843-supp6-v2.docx
-
Supplementary file 7
ChIP-qPCR primers for ESR1-binding analyses.
- https://cdn.elifesciences.org/articles/69843/elife-69843-supp7-v2.docx
-
Supplementary file 8
PCR primers for chromosome conformation capture assay.
- https://cdn.elifesciences.org/articles/69843/elife-69843-supp8-v2.docx
-
Transparent reporting form
- https://cdn.elifesciences.org/articles/69843/elife-69843-transrepform1-v2.docx
-
Source data 1
Figures 1A, B—8, Figure 1—figure supplement 1A, Figure 1—figure supplement 2A, Figure 3—figure supplement 2B and C source data (unedited gels and blots).
The original files of the full raw unedited blots and gels and figures with the uncropped blots and gels with the relevant bands labeled.
- https://cdn.elifesciences.org/articles/69843/elife-69843-supp9-v2.zip
Download links
A two-part list of links to download the article, or parts of the article, in various formats.
Downloads (link to download the article as PDF)
Open citations (links to open the citations from this article in various online reference manager services)
Cite this article (links to download the citations from this article in formats compatible with various reference manager tools)
Heat shock factor 1 (HSF1) cooperates with estrogen receptor α (ERα) in the regulation of estrogen action in breast cancer cells
eLife 10:e69843.
https://doi.org/10.7554/eLife.69843


