Notch-induced endoplasmic reticulum-associated degradation governs mouse thymocyte β−selection
- Department of Molecular and Cellular Biology, Baylor College of Medicine, United States
- Lester and Sue Smith Breast Center and Dan L Duncan Comprehensive Cancer Center, Baylor College of Medicine, United States
- Department of Pathology, School of Medicine, Case Western Reserve University, United States
- Center for Molecular Medicine and Genetics, Wayne State University, United States
- Department of Chemistry and Physics, La Trobe University, Australia
- Department of Molecular and Integrative Physiology, University of Michigan Medical School, United States
Figures
Figure 1 with 1 supplement
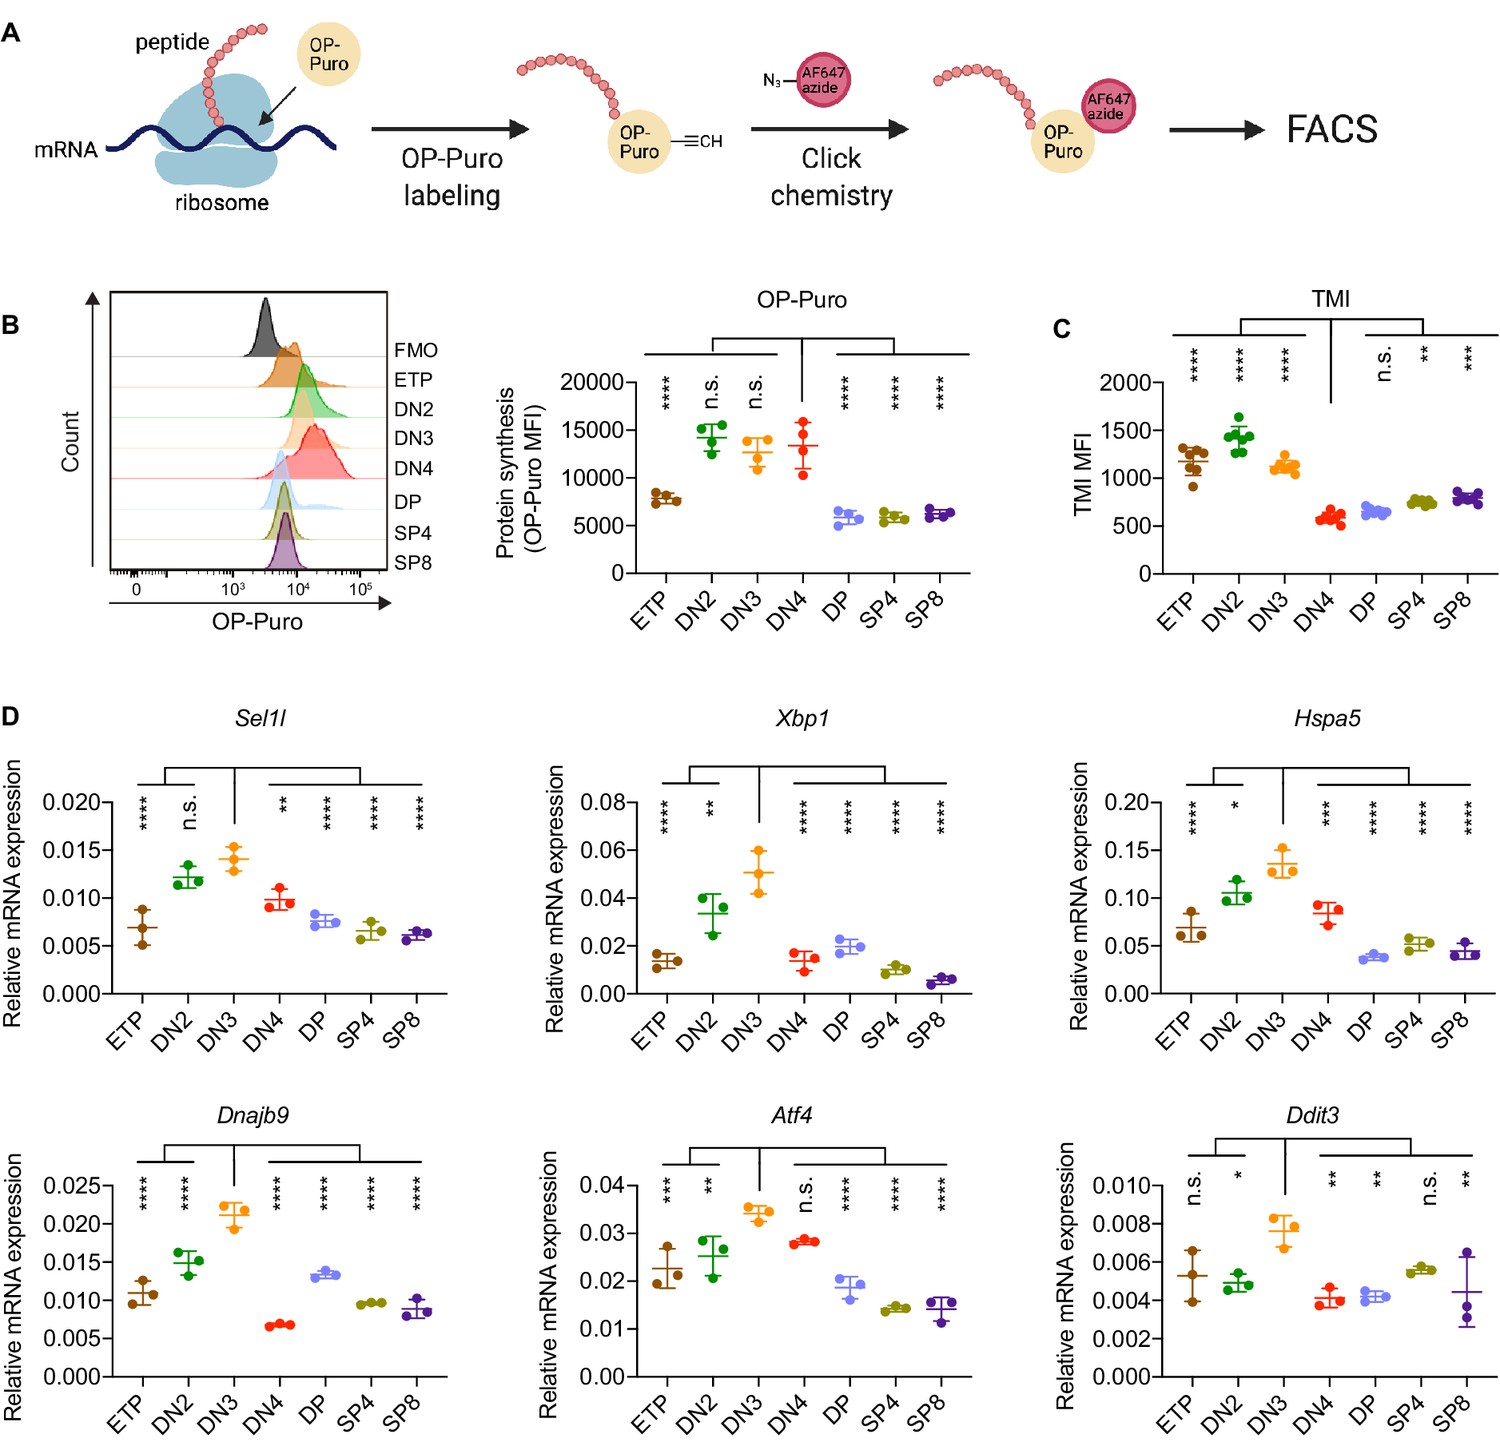
Protein quality control in β-selected thymocytes.
(A) Schematic of labeling and detection of nascent protein with OP-Puro. OP-Puro (O-propargyl puromycin) is a cell-permeable puromycin analog that is incorporated into the C-terminus of newly synthesized peptide chain. Fluorophore conjugated with Alexa Fluor 647 was then attached to OP-Puro through a copper-catalyzed click chemistry reaction between alkyne and azide group, which quantifies protein synthesis by fluorescence intensity. (B) Representative histogram (left) and quantification (right) of OP-Puro incorporation in different thymocyte subsets from 8-week-old wild-type mice. FMO represents AF647 control which is the background from the click chemistry in the absence of OP-Puro. MFI, mean fluorescence intensity. n = four mice. (C) Quantification of tetraphenylethene maleimide (TMI) fluorescence in different thymocyte subsets from 8-week-old wild-type mice. n = seven mice. (D) Quantitative RT-PCR analysis of ERAD (Sel1l) and UPR-related (Xbp1, Hspa5(Bip), Dnajb9, Ddit3 (Chop), Atf4) genes expression in different thymocyte subsets from 6-week-old wild-type mice. Data are presented relative to Actb; n = three mice. (B–D), ETP: early T lineage precursor (Lin- CD4- CD8- CD44+ CD25- CD117+); DN2: double negative two thymocytes (Lin- CD4- CD8- CD44+ CD25+); DN3: double negative three thymocytes (Lin- CD4- CD8- CD44- CD25+); DN4: double negative four thymocytes (Lin- CD4- CD8- CD44- CD25-); DP: double positive thymocytes (Lin- CD4+ CD8+); SP4: CD4 single positive thymocytes (Lin- CD4+ CD8-); SP8: CD8 single positive thymocytes (Lin- CD4- CD8+). Results are shown as mean ± s.d. The statistical significance was calculated by one-way ANOVA with Bonferroni test. *p < 0.05, **p < 0.01, ***p < 0.001, ****p < 0.0001, n.s., not significant.
-
Figure 1—source data 1
Excel file containing numerical values shown in Figure 1.
- https://cdn.elifesciences.org/articles/69975/elife-69975-fig1-data1-v3.xlsx
Figure 1—figure supplement 1
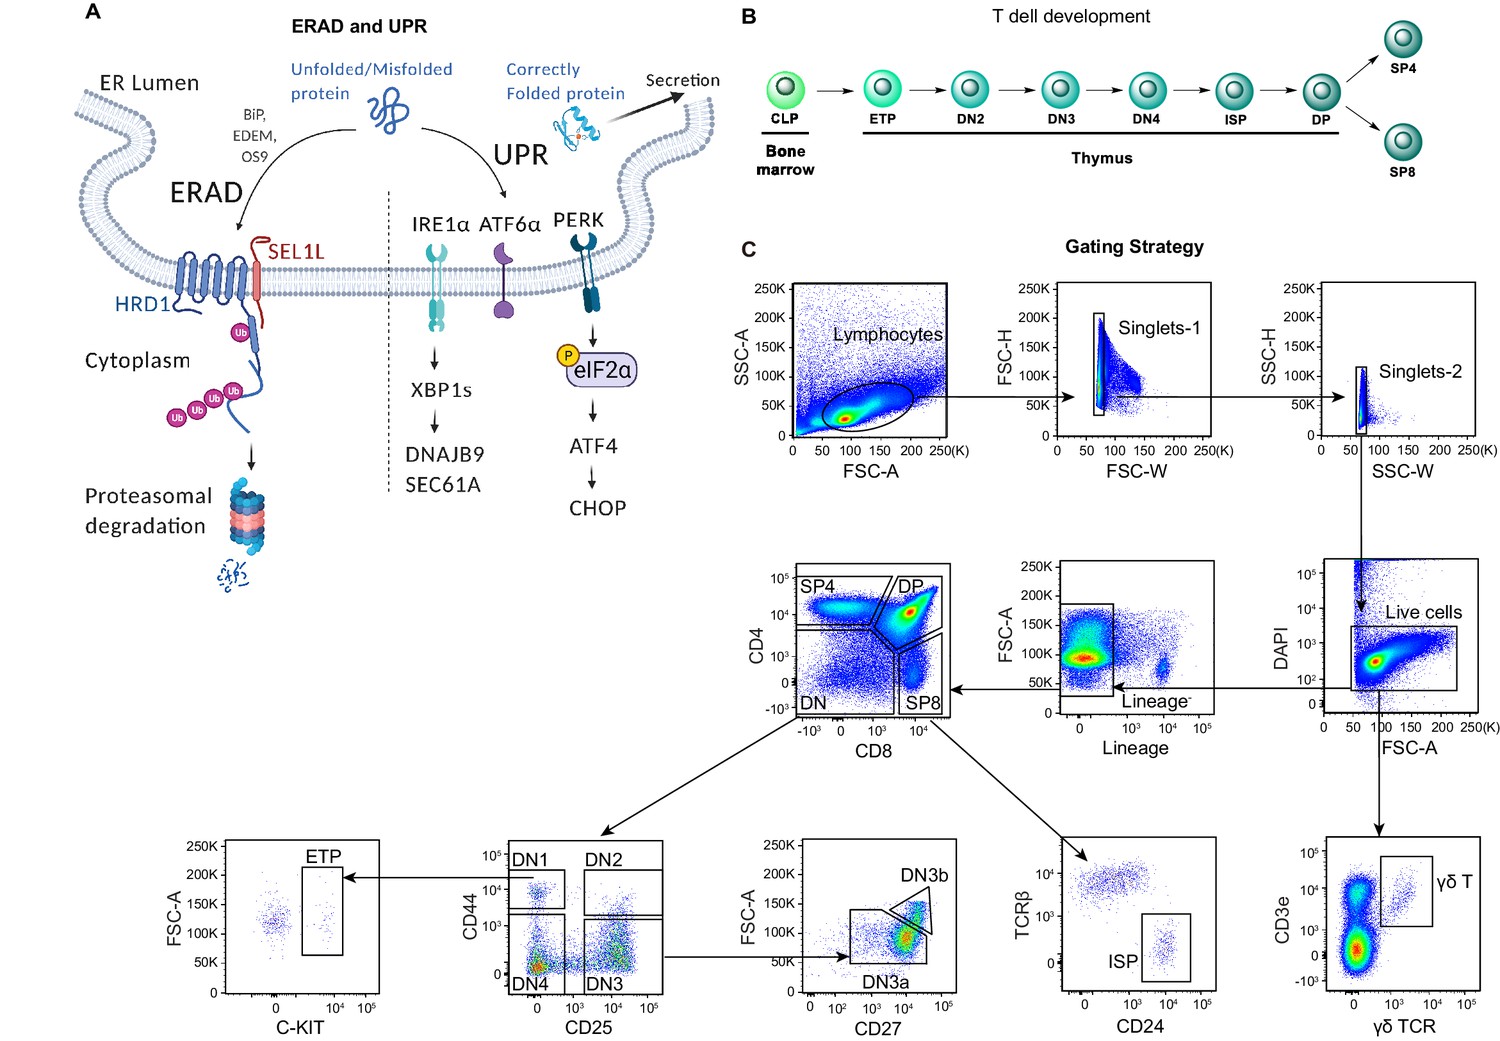
Diagrams and representative flow cytometry gates used in this study.
(A) Diagram showing two ER quality control machineries: ERAD and UPR. The E3 ubiquitin ligase HRD1 and its adaptor protein SEL1L is the most conserved ERAD complex in mammals. While correctly folded proteins exit the ER, misfolded proteins in the ER are recruited to the SEL1L-HRD1 complex through ER chaperones (such as BiP, EDEM, and OS9), and then retrotranslocated into the cytosol, ubiquitinated and degraded by the proteasome. Failure to clear the misfolded or unfolded proteins in the ER activates the UPR signaling through three ER stress sensors IRE1α, ATF6, and PERK. Upon activation, IRE1α oligomerizes and undergoes trans-autophosphorylation to activate its RNase domain, resulting in the removal of 26 nucleotides from unspliced XBP1 (XBP1u) mRNA to produce mature, spliced XBP1 (XBP1s) mRNA. PERK is a serine-threonine kinase. ER stress induces PERK-dependent eIF2α phosphorylation and subsequent increased cap-independent translation of ATF4 and induction of CHOP. (B) Schematic diagram of T-cell development in the thymus. CLP: common lymphoid progenitors; ETP: early T lineage precursor (Lin- CD4- CD8- CD44+ CD25- CD117+); DN2: double negative two thymocytes (Lin- CD4- CD8- CD44+ CD25+); DN3: double negative three thymocytes (Lin- CD4- CD8- CD44- CD25+); DN4: double negative four thymocytes (Lin- CD4- CD8- CD44- CD25-); ISP: immature single-positive thymocytes (Lin-CD8+CD24+TCRβ-); DP: double positive thymocytes (Lin- CD4+ CD8+); SP4: CD4 single positive thymocytes (Lin- CD4+ CD8-); SP8: CD8 single positive thymocytes (Lin- CD4- CD8+). (C) Representative pseudocolor plots showing the gating strategy to identify different thymocyte subsets in the thymus.
Figure 2 with 2 supplements
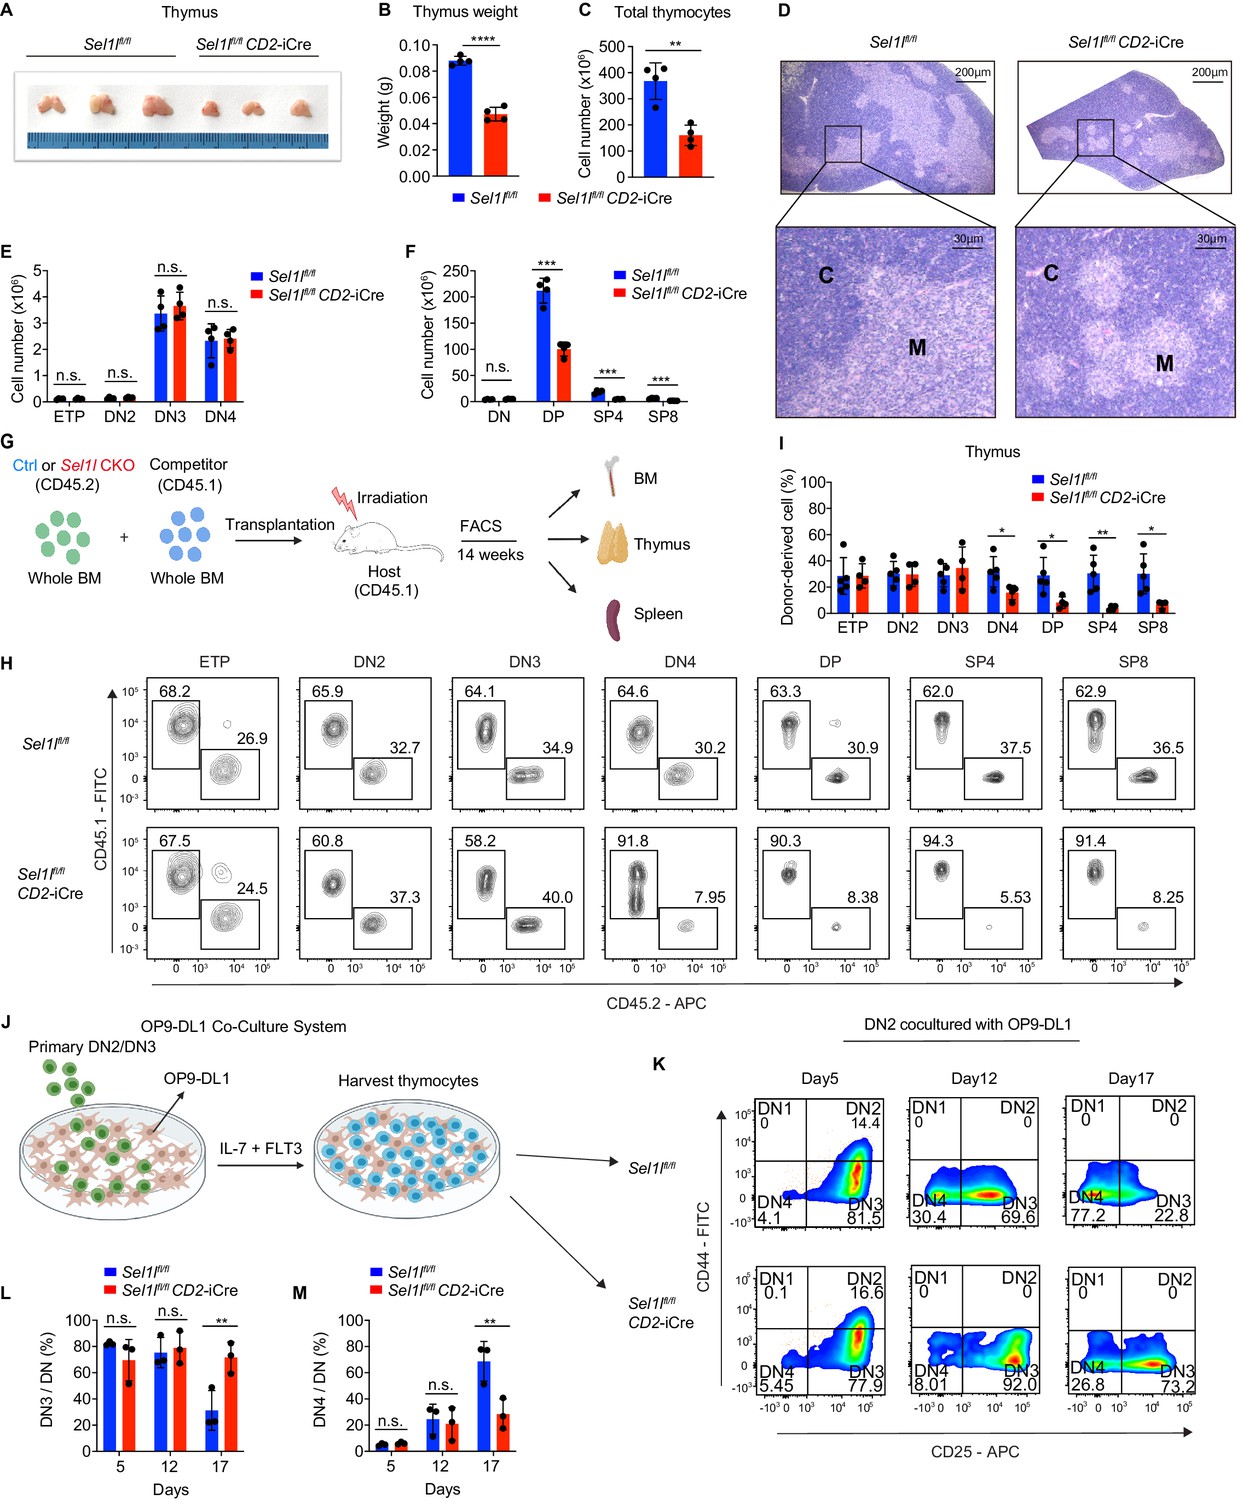
SEL1L is required for αβ T cell development.
(A) Images of thymus from 6 to 8 week-old control (Ctrl, Sel1lflox/flox) and Sel1l CKO (Sel1lflox/flox; CD2-iCre) mice. n = 3. (B and C) Thymus weight (B) and thymus cellularity (C) of age and gender-matched control (Ctrl, Sel1lflox/flox) and Sel1l CKO (Sel1lflox/flox; CD2-iCre) mice. n = 4. (D) Representative images of H and E staining of thymus from 6~8-week-old control (Ctrl, Sel1lflox/flox) and Sel1l CKO (Sel1lflox/flox; CD2-iCre) mice. Scale bars are indicated. C: Cortex. M: Medulla. (E and F) Quantification of cell numbers of the indicated thymocyte subsets in 6- to 8-week-old control (Ctrl, Sel1lflox/flox) and Sel1l CKO (Sel1lflox/flox; CD2-iCre) mice. n = 4. (G) Schematic depiction of the competitive bone marrow transplantation (BMT) experiment using whole bone marrow cells from control (Ctrl, Sel1lflox/flox) or Sel1l CKO (Sel1lflox/flox; CD2-iCre) mice as donors. (H and I) Representative flow cytometry plots (H) and percentage (I) of control (Ctrl, Sel1lflox/flox) or Sel1l CKO donor-derived thymocyte subsets in the recipient mice 14 weeks after transplantation. n = 4–5. (J), Schematic overview of OP9-DL1 cell co-culture system. Sorted DN2 or DN3 cells from control (Ctrl) or Sel1l CKO mice were cultured on a monolayer of OP9 -DL1 cells supplemented with IL-7 and Flt3. (K, L, M) Representative pseudocolor plots (K) and percentage of DN3 (L) or DN4 (M) in DN thymocytes at indicated time points after in vitro co-culture of equal number of control (Ctrl, Sel1lflox/flox) or Sel1l CKO DN2 cells on OP9-DL1 cells supplemented with IL-7 and Flt3. n = 3. Results are shown as mean ± s.d. The statistical significance was calculated by two-tailed unpaired t-test (B, C, E, F, I) or two-way ANOVA with Bonferroni test (L, M). *p < 0.05, **p < 0.01, ***p < 0.001, ****p < 0.0001, n.s., not significant.
-
Figure 2—source data 1
Excel file containing numerical values shown in Figure 2.
- https://cdn.elifesciences.org/articles/69975/elife-69975-fig2-data1-v3.xlsx
Figure 2—figure supplement 1
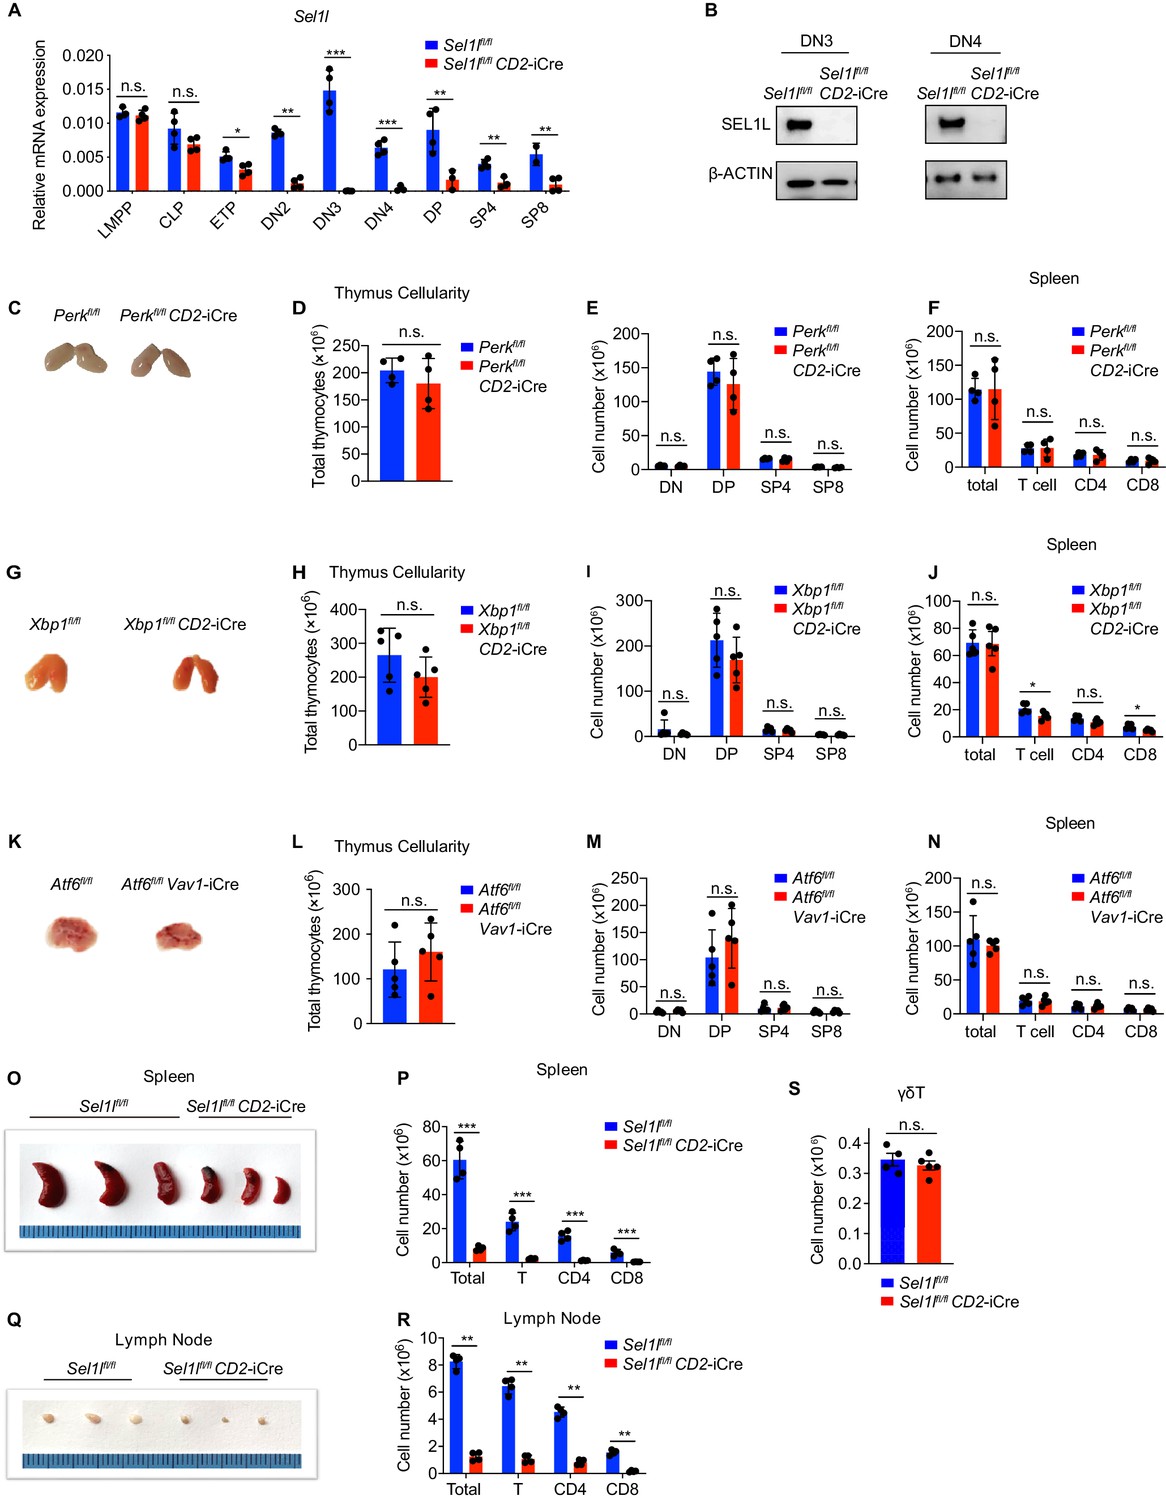
UPR is dispensable for αβ T cell development.
(A) Quantitative RT-PCR analysis of Sel1l expression in murine bone marrow progenitors and different thymocyte subsets from control (Ctrl, Sel1lflox/flox) or Sel1l CKO (Sel1lflox/flox; CD2-iCre) mice. Data are presented relative to Actb. n = 4. LMPP: lymphoid-primed multipotent progenitor. (B) Western blot analysis of SEL1L protein in sorted DN3 and DN4 thymocytes from Ctrl or Sel1l CKO mice. β-ACTIN was used as loading control. The original western blot images are provided in Figure 2—figure supplement 1—source data 1. (C–F) Representative images of thymus (C), thymus cellularity (D), cell numbers of indicated populations in the thymus (E) and peripheral splenocyte numbers of indicated populations (F) from age and gender-matched control (Ctrl, Perkflox/flox) or Perk CKO (Perkflox/flox; CD2-iCre) mice. n = 4. (G–J) Representative images of thymus (G), thymus cellularity (H), cell numbers of indicated populations in the thymus (I) and peripheral splenocyte numbers of indicated populations (J) from age and gender-matched control (Ctrl, Xbp1flox/flox) or Xbp1 CKO (Xbp1flox/flox; CD2-iCre) mice. n = 3–4. (K–N) Representative images of thymus (K), thymus cellularity (L), cell numbers of indicated populations in the thymus (M) and peripheral splenocyte numbers of indicated populations (N) from age and gender-matched control (Ctrl, Atf6flox/flox) and Atf6flox/flox; Vav1-iCre mice. n = 5. (O) Images of spleen from 6 to 8 week-old control (Ctrl, Sel1lflox/flox) and Sel1l CKO (Sel1lflox/flox; CD2-iCre) mice. (P) Quantification of cell numbers of the indicated populations in the spleen of 6- to 8-week-old control (Ctrl, Sel1lflox/flox) and Sel1l CKO (Sel1lflox/flox; CD2-iCre) mice. (Q) Images of the inguinal (left) lymph nodes from 6- to 8-week-old control (Ctrl, Sel1lflox/flox) and Sel1l CKO (Sel1lflox/flox; CD2-iCre) mice. (R) Quantification of cell numbers in the lymph nodes of 6- to 8 week-old control (Ctrl, Sel1lflox/flox) and Sel1l CKO (Sel1lflox/flox; CD2-iCre) mice. n = 4. (S) Quantification of cell numbers of γδ T cells from 6- to 8-week-old control (Ctrl, Sel1lflox/flox) and Sel1l CKO (Sel1lflox/flox; CD2-iCre) mice. Ctrl: n = 4. Sel1l CKO: n = 5. Data are representative of three independent experiments and are shown as mean ± s.d. Two-tailed Student’s t-tests (A, D–F, H–J, L–N, P, R, S) was used to calculate p values. n.s., not significant, *p < 0.05, **p < 0.01, ***p < 0.001, ****p < 0.0001.
-
Figure 2—figure supplement 1—source data 1
Original western blot images shown in Figure 2—figure supplement 1.
- https://cdn.elifesciences.org/articles/69975/elife-69975-fig2-figsupp1-data1-v3.pdf
-
Figure 2—figure supplement 1—source data 2
Excel file containing numerical values shown in Figure 2—figure supplement 1.
- https://cdn.elifesciences.org/articles/69975/elife-69975-fig2-figsupp1-data2-v3.xlsx
Figure 2—figure supplement 2
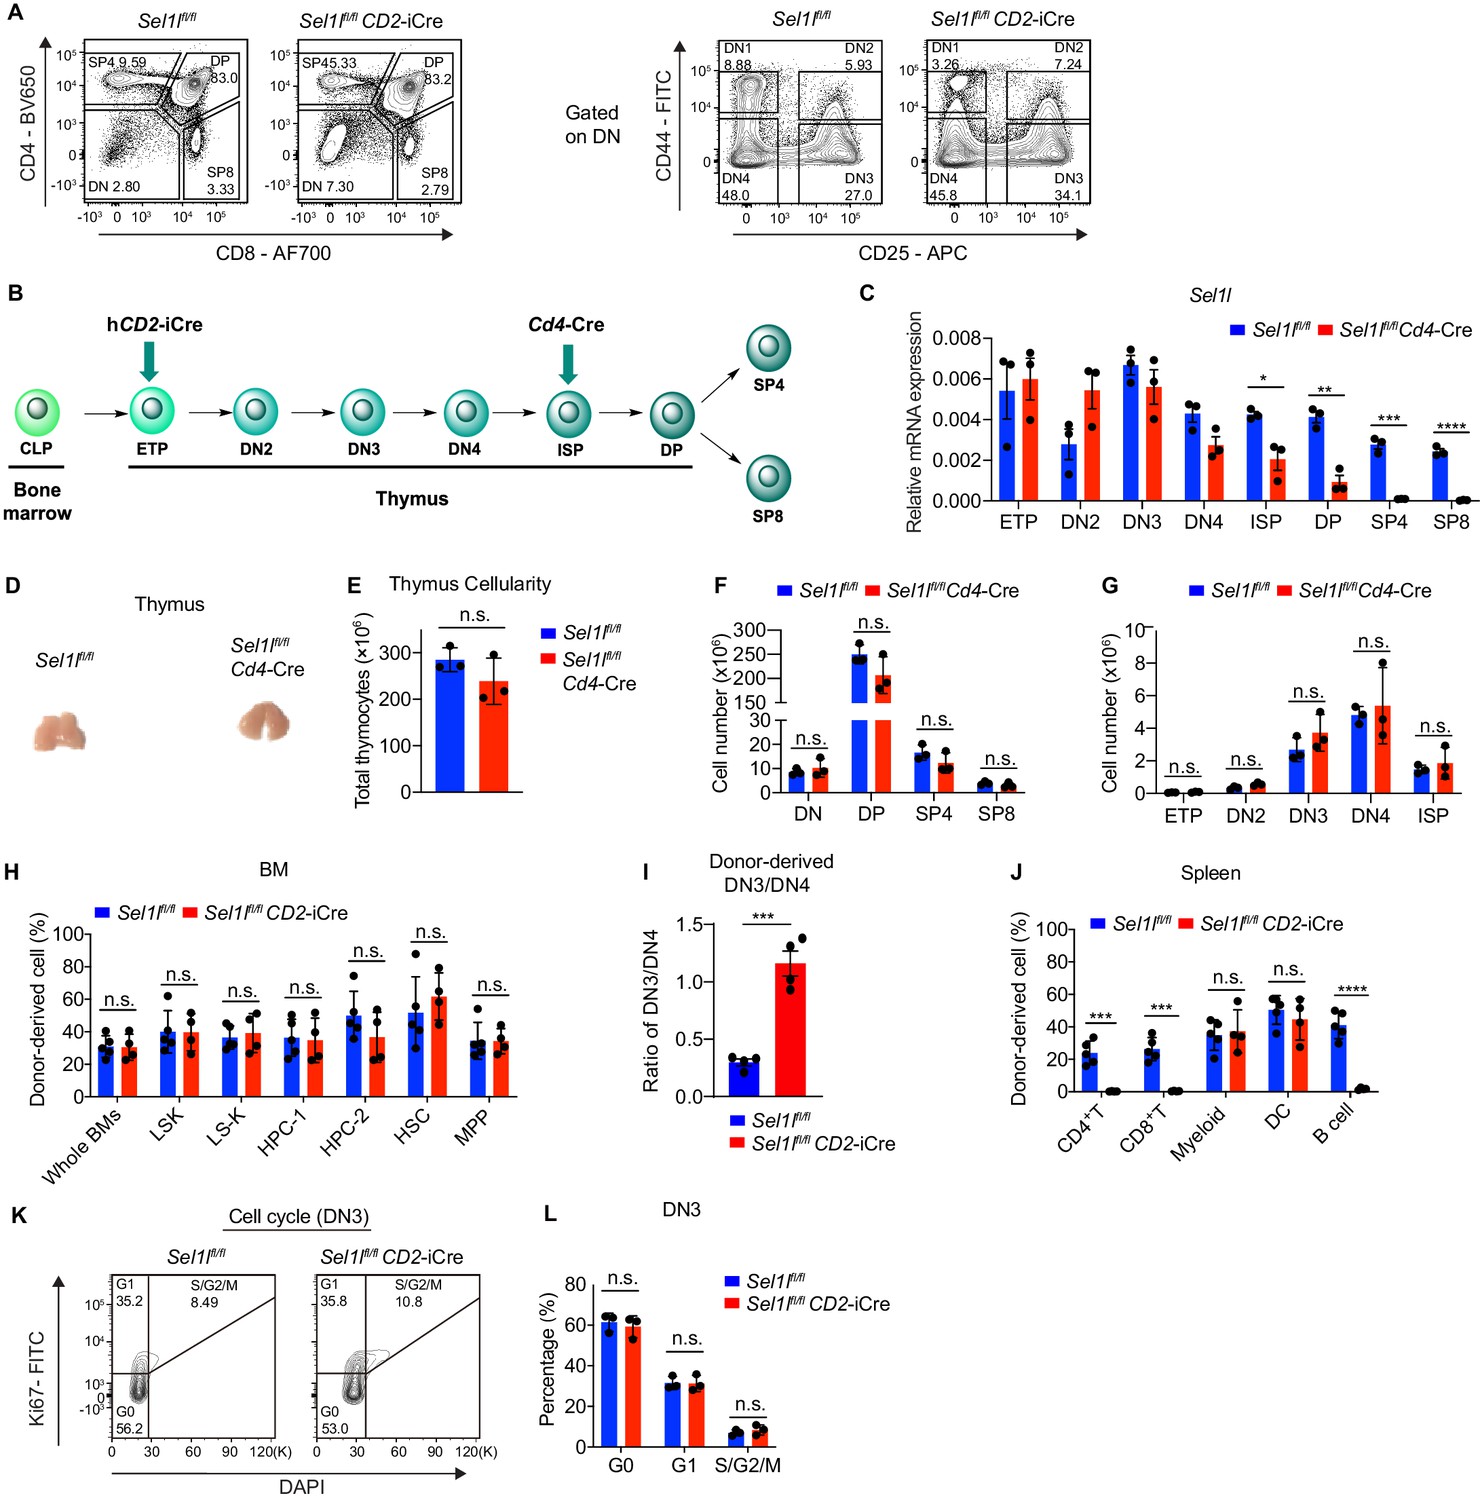
SEL1L is required for DN to DP thymocyte transition following β selection.
(A) Representative flow cytometry plots of different thymocyte subsets in control (Ctrl, Sel1lflox/flox) and Sel1l CKO (Sel1lflox/flox; CD2-iCre) mice. (B) Diagram showing different stages of CD2-iCre and Cd4-Cre initiated gene depletion during T cell development. (C) Quantitative RT-PCR analysis of Sel1l in different thymocyte subsets from control (Ctrl, Sel1lflox/flox) and Sel1lflox/flox; Cd4-Cre mice. Data are presented relative to Actb. n = 3. (D and E) Representative images of thymus (D) and quantification of thymus cellularity (E) in 6- to 8-week-old control (Ctrl, Sel1lflox/flox) and Sel1lflox/flox; Cd4-Cre mice. n = 3. (F and G) Quantification of cell numbers of different thymocyte subsets from control (Ctrl, Sel1lflox/flox) and Sel1lflox/flox; Cd4-Cre mice. n = 3. (H) Percentage of Ctrl or Sel1l CKO donor-derived progenitors in the bone marrow of recipient mice 14 weeks after transplantation. n = 4–5. (I) Quantification of Ctrl or Sel1l CKO donor-derived DN3/DN4 ratio. n = 4–5. (J) Percentage of Ctrl or Sel1l CKO donor-derived CD4+ T cells, CD8+ T cells, myeloid cells, and dendritic cells (DC) in the spleen of recipient mice 14 weeks after transplantation. n = 4–5. (K and L) Cell cycle analysis of DN3 thymocytes in 6-week-old control (Ctrl) and Sel1l CKO mice using Ki67 and DAPI. Representative flow cytometry plots (K) and quantification (L) are shown. n = 3. Data are shown as mean ± s.d. The statistical significance was calculated by two-tailed unpaired t-test (C, E-J) or Two-way ANOVA with Bonferroni test (L). n.s., not significant, *p < 0.05, **p < 0.01, ***p < 0.001, ****p < 0.0001.
-
Figure 2—figure supplement 2—source data 1
Excel file containing numerical values shown in Figure 2—figure supplement 2.
- https://cdn.elifesciences.org/articles/69975/elife-69975-fig2-figsupp2-data1-v3.xlsx
Figure 3
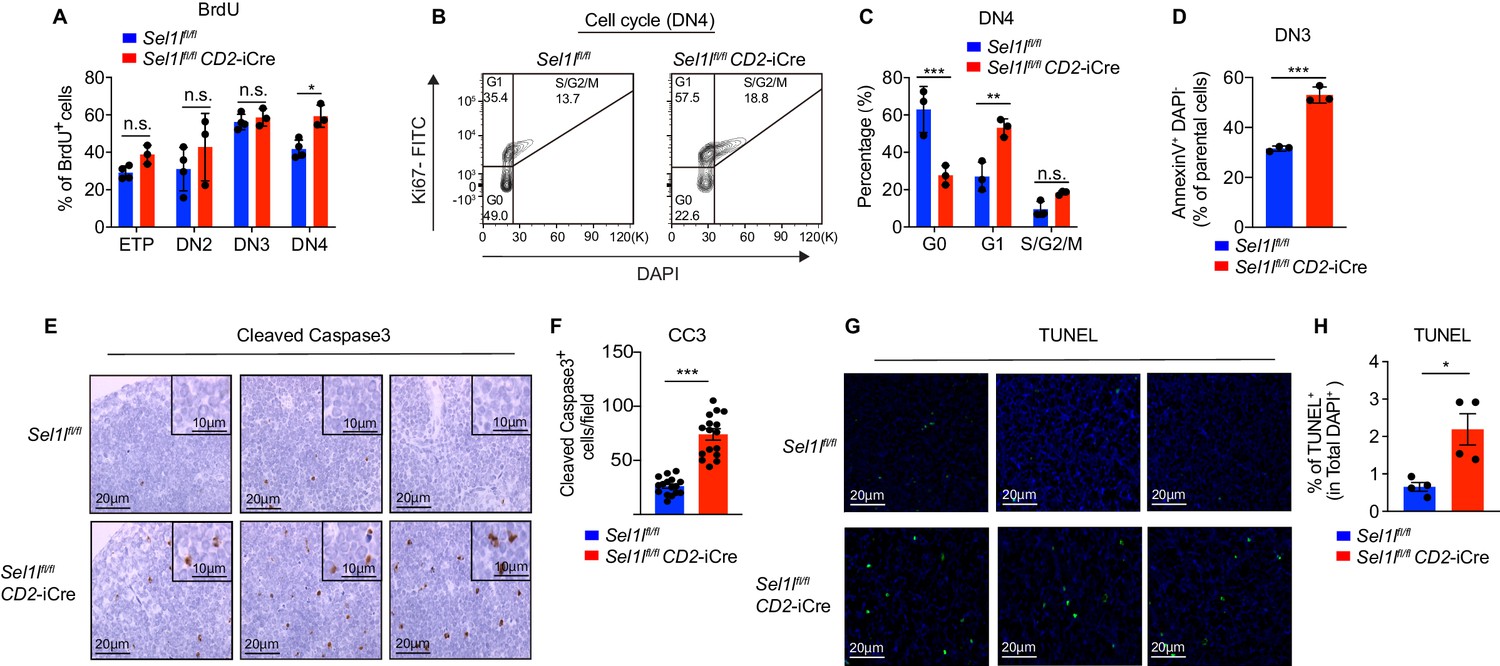
SEL1L is required for thymocyte survival at the β-selection checkpoint.
(A) Quantification of BrdU incorporation in different thymocyte subsets from 6-week-old control (Ctrl, Sel1lflox/flox) or Sel1l CKO mice. n = 3–4. (B and C) Cell cycle analysis of DN4 thymocytes in 6-week-old control (Ctrl, Sel1lflox/flox) and Sel1l CKO (Sel1lflox/flox; CD2-iCre) using Ki67 and DAPI. Representative flow cytometry plots (B) and quantification (C) are shown. n = 3. (D) Quantification of apoptotic Ctrl or Sel1l CKO (Sel1lflox/flox; CD2-iCre) DN3 thymocytes co-cultured with OP9-DL1 cells in vitro for 2 days. n = 3. (E and F) Representative images (E) and quantification (F) of cleaved caspase-3 (CC3) positive cells in the thymus of 6- to 8-week-old control (Ctrl, Sel1lflox/flox) or Sel1l CKO (Sel1lflox/flox; CD2-iCre) mice. Sixteen fields were counted at ×20 magnification from 4 Ctrl or Sel1l CKO mice. Scale bars are indicated. (G and H) Representative images (G) and quantification (H) of TUNEL positive cells in the thymus of 6- to 8-week-old control (Ctrl, Sel1lflox/flox) or Sel1l CKO (Sel1lflox/flox; CD2-iCre) mice. n = 4. Scale bar, 20 μM. Results are shown as mean ± s.d. The statistical significance was calculated by two-tailed unpaired t-test (D, F, H) or two-way ANOVA with Bonferroni test (A, C). *p < 0.05, **p < 0.01, ***p < 0.001, ****p < 0.0001, n.s., not significant.
-
Figure 3—source data 1
Excel file containing numerical values shown in Figure 3.
- https://cdn.elifesciences.org/articles/69975/elife-69975-fig3-data1-v3.xlsx
Figure 4 with 1 supplement
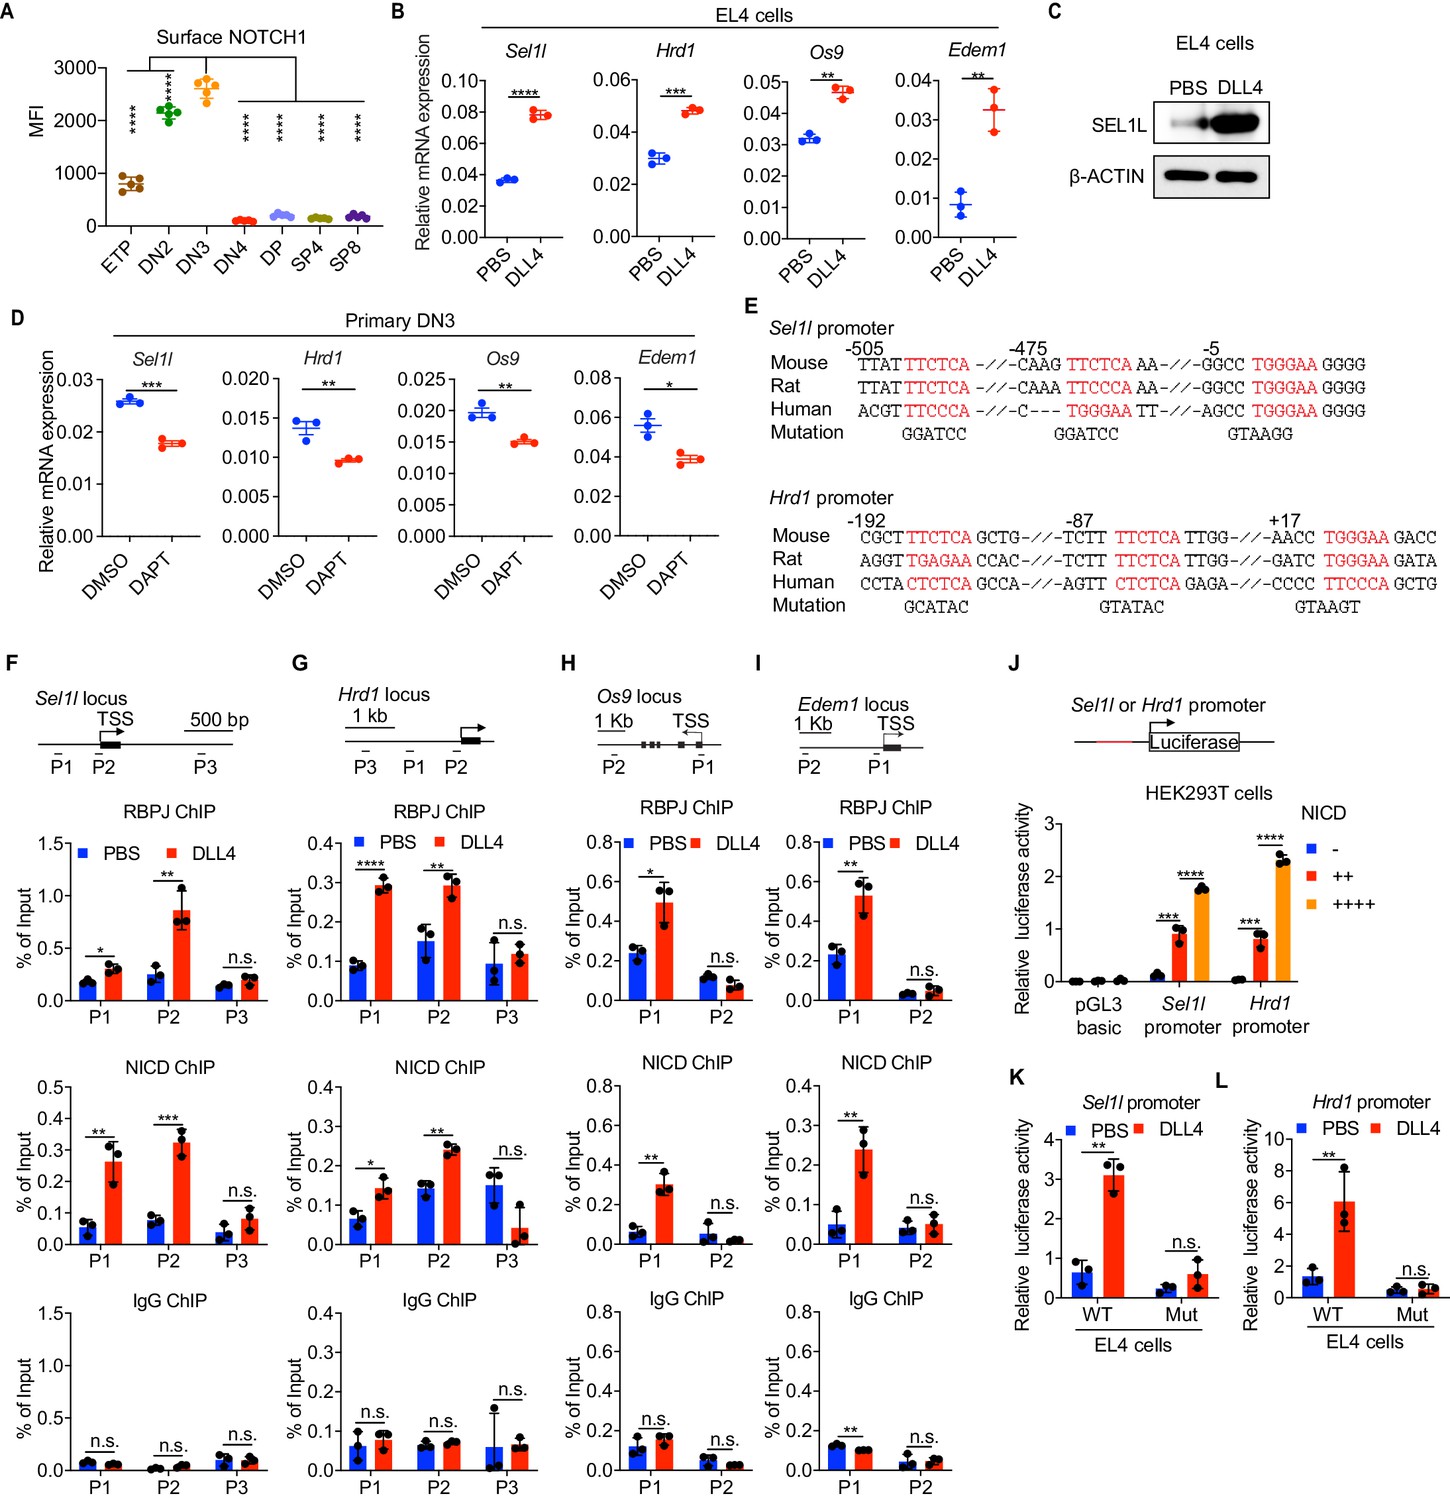
Notch directly regulates transcription of ERAD genes.
(A) Quantification of surface NOTCH1 levels in different thymocyte subsets from wild-type mice. MFI, mean fluorescence intensity. n = four mice. (B) Quantitative RT–PCR analysis of ERAD genes (Sel1l, Hrd1, Os9, Edem1) expression in EL4 cells after stimulation with 5 μg/ml Delta ligand 4 (DLL4) for 24 hr. Data are presented relative to Actb. n = 3. (C) Western blot analysis of SEL1L level in EL4 cells after stimulation with Delta ligand 4 (DLL4) for 12 hr. β-ACTIN was used as loading control. The original western blot images are provided in Figure 4—source data 1. (D) Quantitative RT–PCR analysis of ERAD genes (Sel1l, Hrd1, Os9, Edem1) expression in primary DN3 thymocytes treated with 2 μM γ-secretase inhibitor DAPT for 5 hr. Data are presented relative to Actb. n = 3. (E) Conserved RBP-J binding motif (Red) within the promoters of Sel1l and Hrd1. Alignment of the Sel1l (Upper) or Hrd1 (lower) promoter from genomic sequence from human, mouse, and rat. The numbering corresponds to the mouse sequence and is relative to the transcription start site (TSS). Mutations of the RBP-J-binding motifs within Sel1l or Hrd1 promoter luciferase reporters (as in L, M) are shown. (F–I). Upper: Schematic diagram of the ChIP primer (P1–P3) locations across the Sel1l (F) Hrd1, (G) Edem1, (H) or Os9 (I) promoter regions. TSS: transcription start site. Lower: Chromatin extracts from EL4 cells treated with PBS or 5 μg/ml DLL4 for 24 hr were subjected to ChIP using anti-RBP-J antibody, anti-NICD antibody, or normal IgG. Genomic regions of Sel1l (F), Hrd1 (G), Edem1 (H), or Os9 (I) promoter (as in left panel) were tested for enrichment of RBP-J, NICD or IgG. Data are shown as percentage of input. (J) Sel1l or Hrd1 promoter luciferase reporter was co-transfected with empty vector or different doses of NICD into HEK293T cells, and luciferase activity was measured 36 hr after transfection. pGL3 basic was used as control. (K and L) Wild-type or mutant (RBP-J motif mutations, as shown in E) Sel1l (K) or Hrd1 (L) promoter luciferase reporter was transfected into EL4 cells which were treated with PBS or 5 μg/ml DLL4 for 24 hr before harvest. Luciferase activity was measured 36 hr after transfection. All luciferase data are presented relative to Renilla readings. Data are shown as mean ± s.d. Two-tailed Student’s t-tests (A, B, D, F-I, K, L) or one-way ANOVA with Bonferroni test (J) were used to calculate p values. n.s., not significant, *p < 0.05, **p < 0.01, ***p < 0.001, ****p < 0.0001.
-
Figure 4—source data 1
Original western blot images shown in Figure 4.
- https://cdn.elifesciences.org/articles/69975/elife-69975-fig4-data1-v3.pdf
-
Figure 4—source data 2
Excel file containing numerical values shown in Figure 4.
- https://cdn.elifesciences.org/articles/69975/elife-69975-fig4-data2-v3.xlsx
Figure 4—figure supplement 1
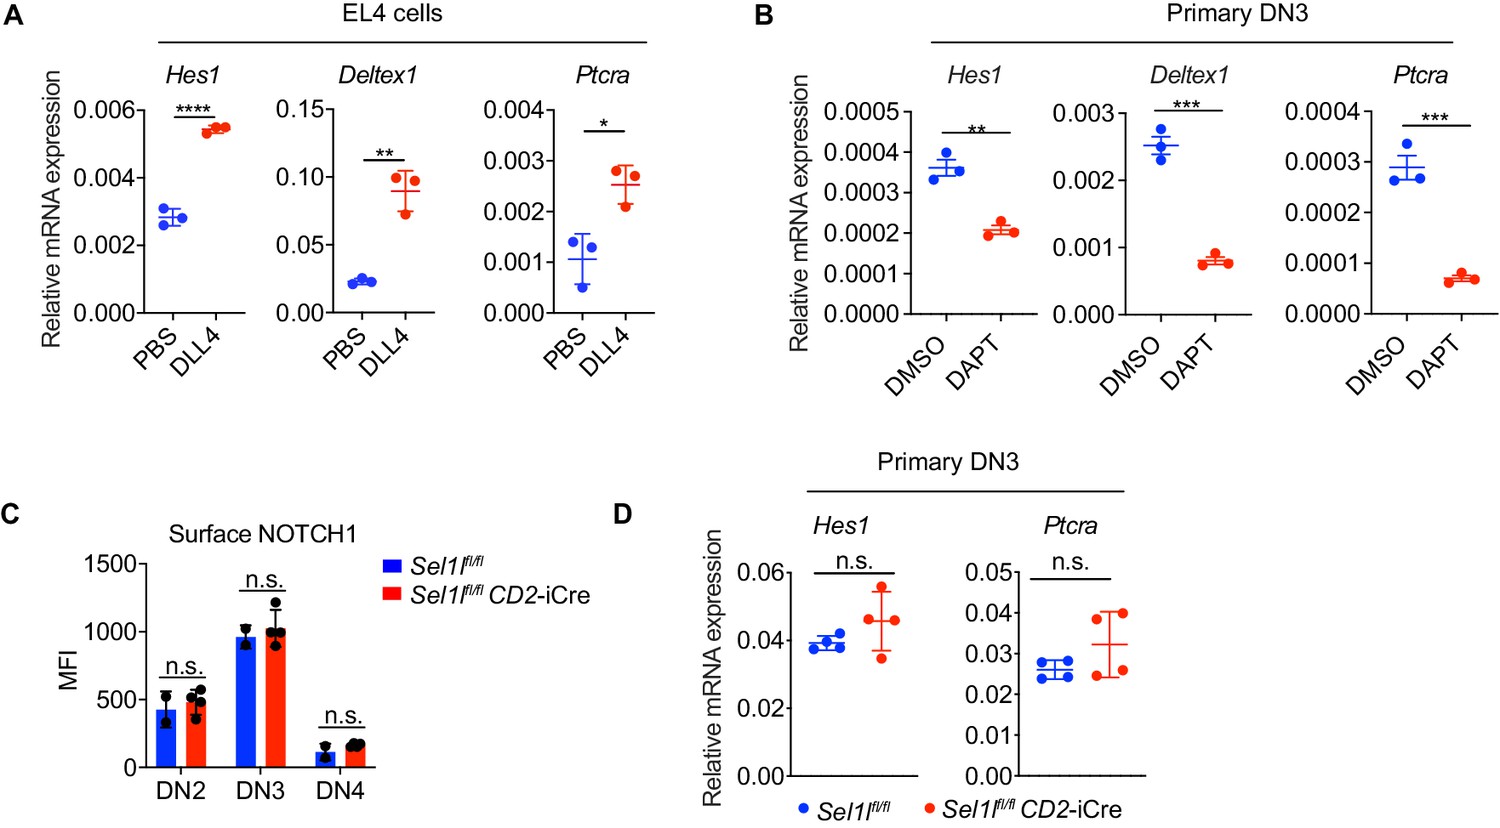
Notch signal regulates ERAD genes expression.
(A) Quantitative RT-PCR analysis of Notch target genes expression in EL4 cells after stimulation with 5 μg/ml Delta ligand 4 (DLL4) for 24 hr. Data are presented relative to Actb. n = 3. (B) Quantitative RT-PCR analysis of Notch target genes expression in primary DN3 thymocytes treated with 2 μM γ-secretase inhibitor DAPT for 5 hr. Data are presented relative to Actb. n = 3. (C) Expression of Notch1 on cell surface of different thymocyte subsets from control (Ctrl, Sel1lflox/flox) and Sel1l CKO (Sel1lflox/flox; CD2-iCre) mice. Ctrl: n = 2. Sel1l CKO: n = 4. (D) Quantitative RT-PCR analysis of Notch target genes expression in primary DN3 thymocytes from control (Ctrl, Sel1lflox/flox) and Sel1l CKO (Sel1lflox/flox; CD2-iCre) mice. n = 4. Data are shown as mean ± s.d. Two-tailed Student’s t-tests (A–C) was used to calculate p values. n.s., not significant, *p < 0.05, **p < 0.01, ***p < 0.001, ****p < 0.0001.
-
Figure 4—figure supplement 1—source data 1
Excel file containing numerical values shown in Figure 4—figure supplement 1.
- https://cdn.elifesciences.org/articles/69975/elife-69975-fig4-figsupp1-data1-v3.xlsx
Figure 5 with 2 supplements

Sel1l-deficiency triggers unresolved ER stress during β-selection.
(A) Heatmap showing differentially expressed genes from the RNA-seq analysis of DN3 thymocytes sorted from control (Ctrl, Sel1lflox/flox) or Sel1l CKO (Sel1lflox/flox; CD2-iCre) mice. n = 4. (B) Gene Ontology (GO) analysis of the most significantly upregulated pathways in Sel1l CKO (Sel1lflox/flox; CD2-iCre) DN3 thymocytes compared with control (Ctrl, Sel1lflox/flox) DN3 thymocytes. (C–E) Plots from GSEA analysis showing enrichment of Unfolded Protein Response (C), IRE1α (D), and PERK (E) pathways in Sel1l CKO (Sel1lflox/flox; CD2-iCre) DN3 thymocytes compared to control (Ctrl, Sel1lflox/flox) DN3 thymocytes. (F and G) Representative histogram (F) and quantification(G) of ER-tracker staining in DN3 thymocytes sorted from control (Ctrl, Sel1lflox/flox) and Sel1l CKO (Sel1lflox/flox; CD2-iCre) mice. Ctrl: n = 4; Sel1l CKO: n = 3. MFI, mean fluorescence intensity. (H) Western blot analysis of UPR pathway markers in primary DN3 thymocytes sorted from 6-week-old Ctrl or Sel1l CKO mice. β-ACTIN was used as loading control. The original western blot images are provided in Figure 5—source data 1. (I) PCR analysis of XBP1-splicing in DN3 thymocytes sorted from Ctrl or Sel1l CKO mice. Xbp1u: Unspliced Xbp1; Xbp1s: Spliced Xbp1. ACTIN was used as loading control. The original gel images are provided in Figure 5—source data 2. (J and K) Representative histogram (J) and quantification (K) of unfolded/misfolded protein level measured by TMI in DN3 thymocytes sorted from Ctrl or Sel1l CKO mice. n = 3. (L) Schematic illustration of labeling and detection of misfolded and aggregated proteins with ProteoStat dye. (M and N) Representative images (M) and quantification (N) of protein aggregation measured by ProteoStat Protein Aggregation Detection Kit in primary DN3 thymocytes sorted from three pooled Ctrl or Sel1l CKO mice. Results are shown as mean ± s.d. Two-tailed Student’s t-tests (G, K, N) was used to calculate p values. **p < 0.01, ***p < 0.001, ****p < 0.0001.
-
Figure 5—source data 1
Original western blot images shown in Figure 5.
- https://cdn.elifesciences.org/articles/69975/elife-69975-fig5-data1-v3.pdf
-
Figure 5—source data 2
Original gels images shown in Figure 5.
- https://cdn.elifesciences.org/articles/69975/elife-69975-fig5-data2-v3.pdf
-
Figure 5—source data 3
Excel file containing numerical values shown in Figure 5.
- https://cdn.elifesciences.org/articles/69975/elife-69975-fig5-data3-v3.xlsx
Figure 5—figure supplement 1
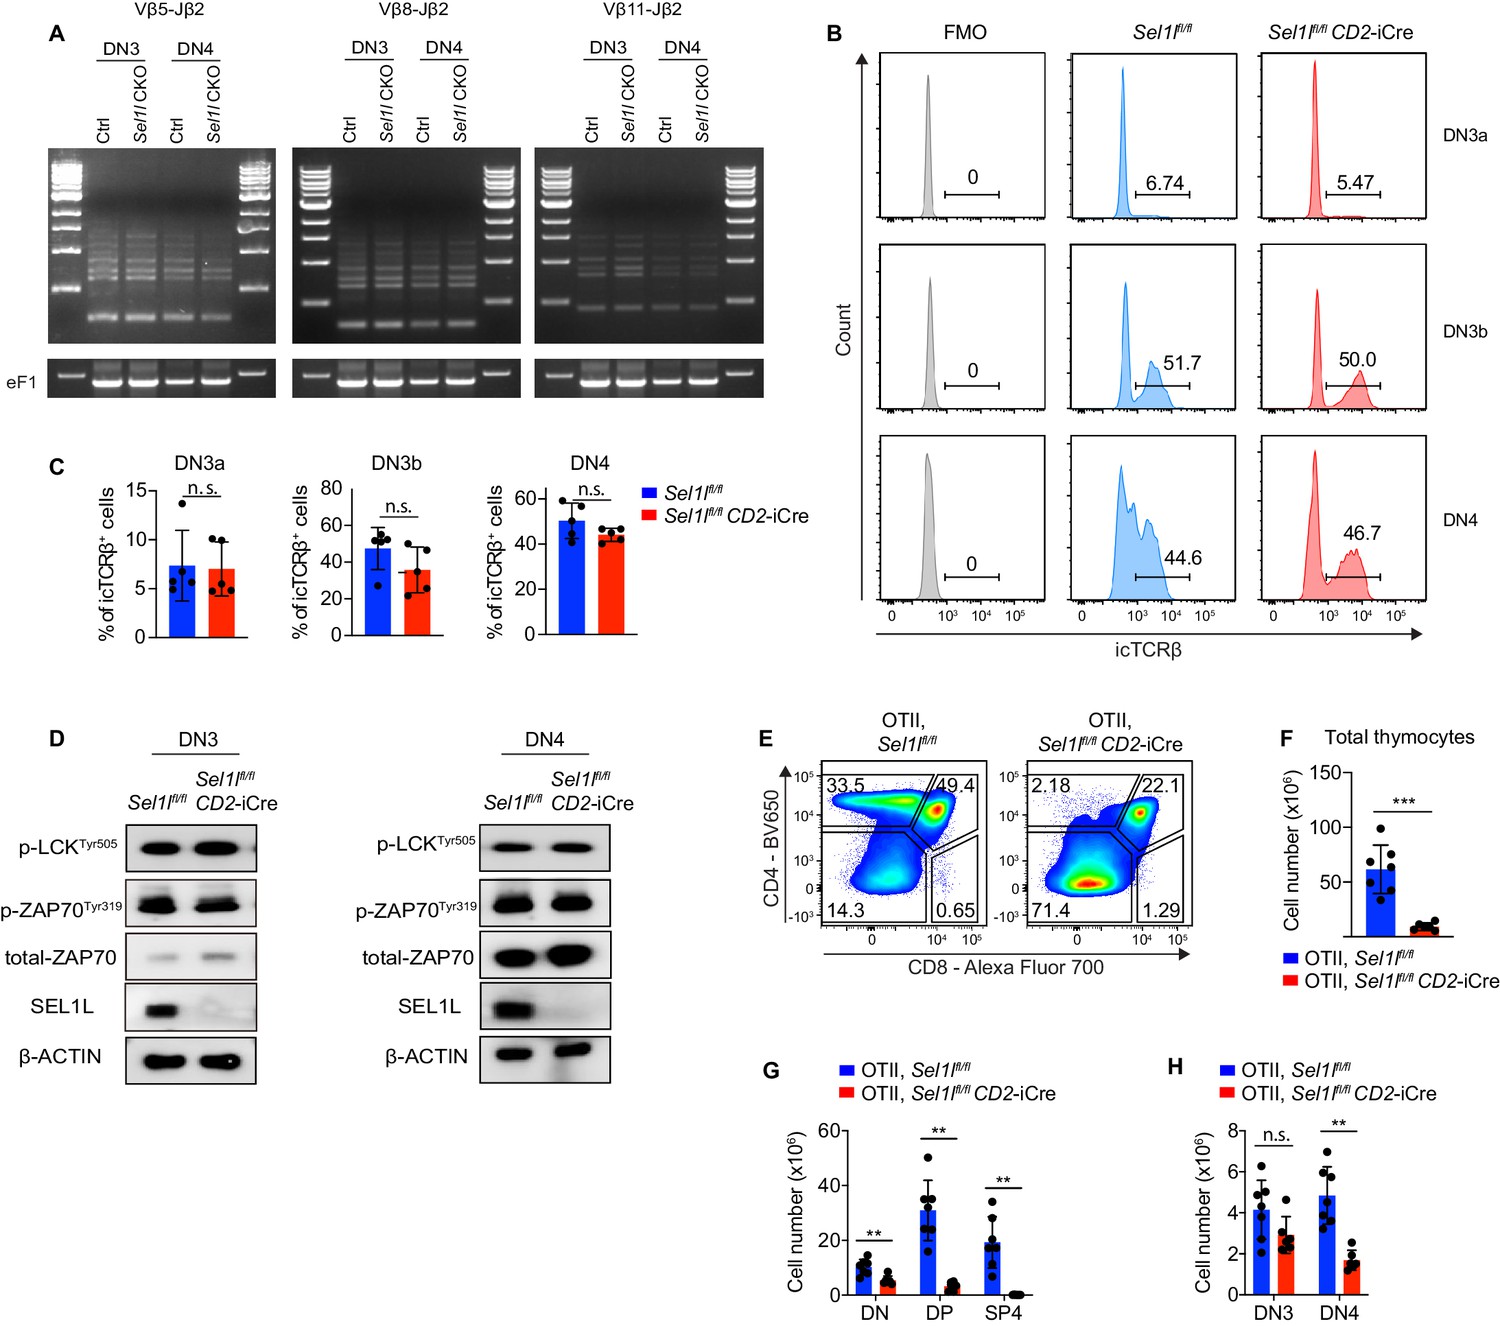
SEL1L is not required for TCRβ gene rearrangement and pre-TCR signaling.
(A) PCR analysis of Vβ5-Jβ2, Vβ8-Jβ2, and Vβ11-Jβ2 gene rearrangements using genomic DNA of DN3 and DN4 thymocytes sorted from control (Ctrl, Sel1lflox/flox) or Sel1l CKO (Sel1lflox/flox; CD2-iCre) mice. The original gel images are provided in Figure 5—figure supplement 1—source data 1. (B and C) Representative flow cytometry plots (B) and quantification (C) of intracellular TCRβ positive cells in DN3a, DN3b and DN4 thymocytes from Ctrl or Sel1l CKO mice. n = 5. (D) Western blot analysis of the expression of proteins involved in pre-TCR signaling in primary DN3 and DN4 thymocytes sorted from Ctrl or Sel1l CKO mice. β-ACTIN was used as loading control. The original western blot images are provided in Figure 5—figure supplement 1—source data 2. (E–H) Representative pseudocolor plots (E) quantification of total thymocytes (F) and cell numbers of indicated populations (G and H) from OT-II.Ctrl (OT-II; Sel1lflox/flox) or OT-II. Sel1l CKO (OT-II; Sel1lflox/flox; CD2-iCre) mice. OT-II.Ctrl: n = 7. OT-II. Sel1l CKO: n = 6. Data are shown as mean ± s.d. Two-tailed Student’s t-tests (C, F–H) was used to calculate p values. n.s., not significant, *p < 0.05, **p < 0.01, ***p < 0.001, ****p < 0.0001.
-
Figure 5—figure supplement 1—source data 1
Original gels images shown in Figure 5—figure supplement 1.
- https://cdn.elifesciences.org/articles/69975/elife-69975-fig5-figsupp1-data1-v3.pdf
-
Figure 5—figure supplement 1—source data 2
Original western blot images shown in Figure 5—figure supplement 1.
- https://cdn.elifesciences.org/articles/69975/elife-69975-fig5-figsupp1-data2-v3.pdf
-
Figure 5—figure supplement 1—source data 3
Excel file containing numerical values shown in Figure 5—figure supplement 1.
- https://cdn.elifesciences.org/articles/69975/elife-69975-fig5-figsupp1-data3-v3.xlsx
Figure 5—figure supplement 2
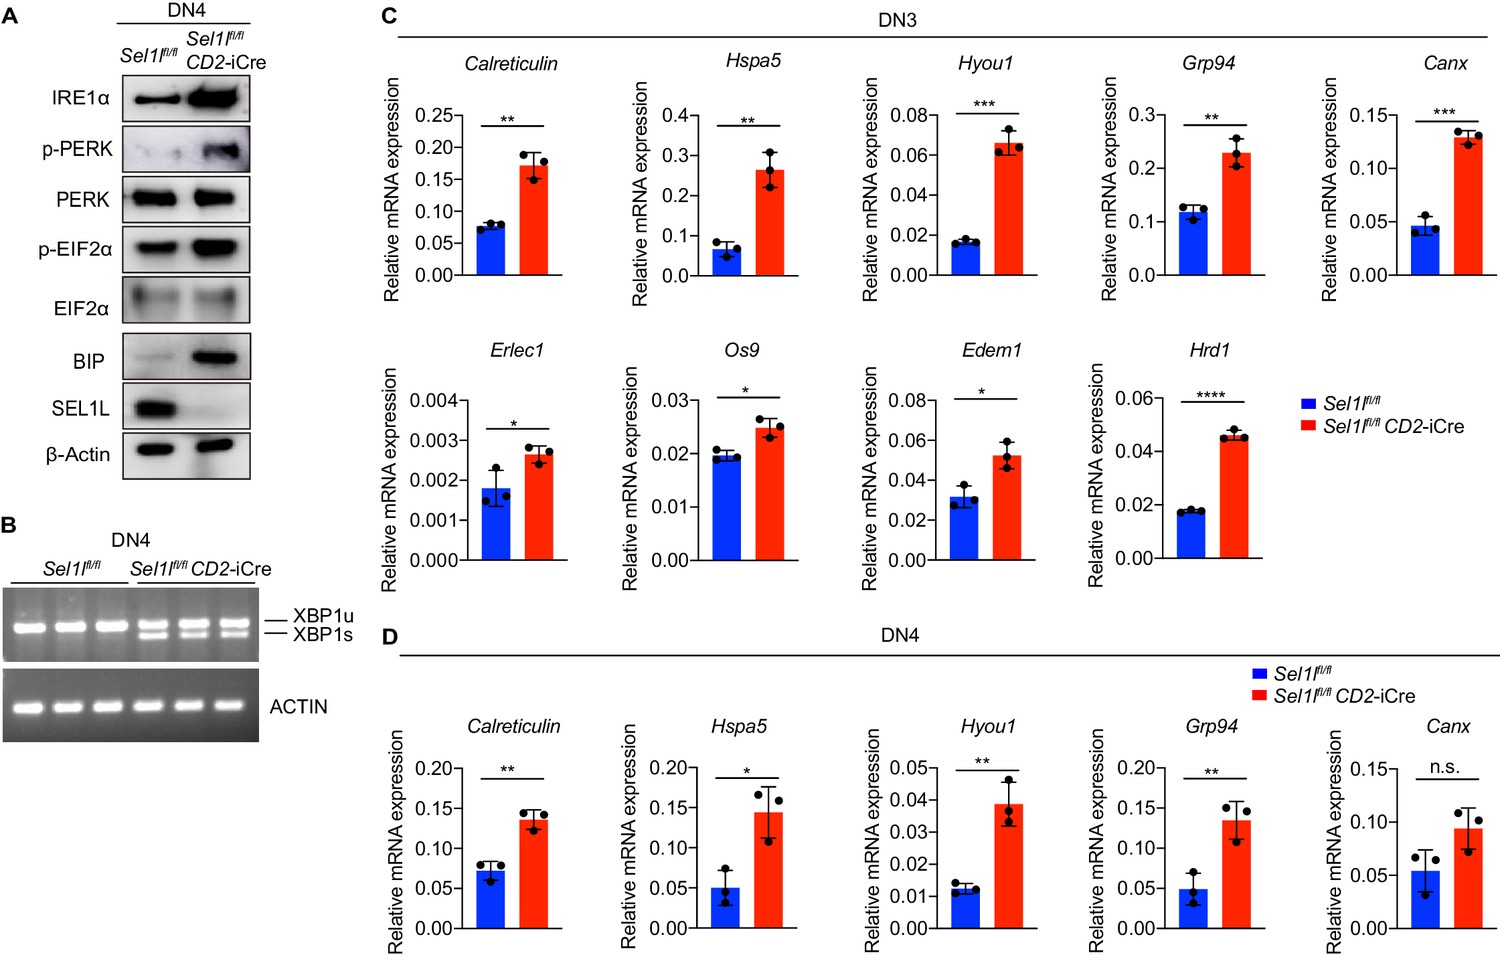
Sel1l knockout induces ER stress.
(A) Western blot analysis of UPR pathway markers in primary DN4 thymocytes sorted from 6-week-old Ctrl or Sel1l CKO mice. β-ACTIN was used as loading control. The original western blot images are provided in Figure 5—figure supplement 2—source data 1. (B) PCR analysis of XBP1-splicing in DN4 thymocytes sorted from Ctrl or Sel1l CKO mice. Xbp1u: Unspliced Xbp1; Xbp1s: Spliced Xbp1. ACTIN was used as loading control. The original gel images are provided in Figure 5—figure supplement 2—source data 2. (C and D) Quantitative RT-PCR analysis of ER chaperone genes expression in DN3 (C) and DN4 (D) thymocytes sorted from 6-week-old Ctrl or Sel1l CKO mice. Data are presented relative to Actb. n = 3. Data are shown as mean ± s.d. Two-tailed Student’s t-tests was used to calculate p values. n.s., not significant, *p < 0.05, **p < 0.01, ***p < 0.001, ****p < 0.0001.
-
Figure 5—figure supplement 2—source data 1
Original western blot images shown in Figure 5—figure supplement 2.
- https://cdn.elifesciences.org/articles/69975/elife-69975-fig5-figsupp2-data1-v3.pdf
-
Figure 5—figure supplement 2—source data 2
Original gels images shown in Figure 5—figure supplement 2.
- https://cdn.elifesciences.org/articles/69975/elife-69975-fig5-figsupp2-data2-v3.pdf
-
Figure 5—figure supplement 2—source data 3
Excel file containing numerical values shown in Figure 5—figure supplement 2.
- https://cdn.elifesciences.org/articles/69975/elife-69975-fig5-figsupp2-data3-v3.xlsx
Figure 6 with 1 supplement
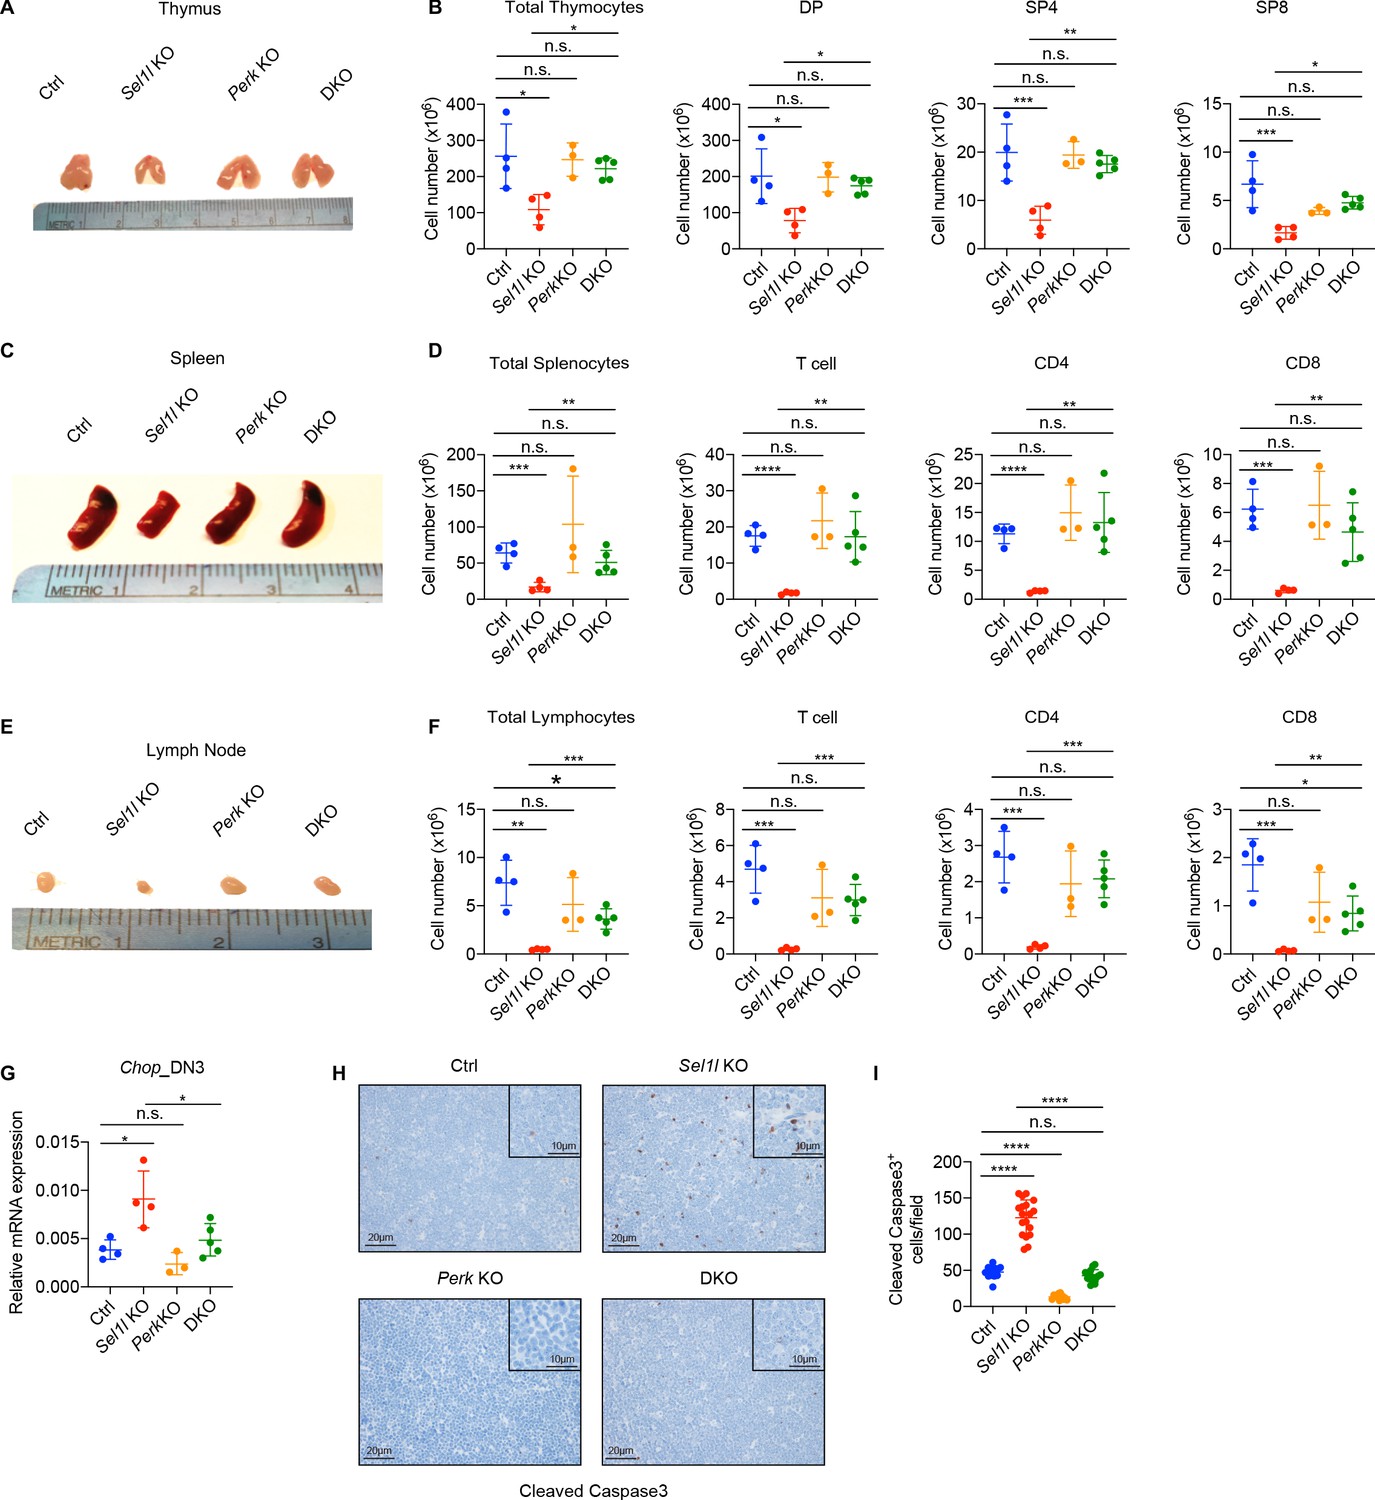
PERK signaling drives β-selected thymocyte apoptosis in Sel1l CKO mouse.
(A and B) Representative images of thymus (A) and quantification of total thymocytes, DP, SP4 and SP8 thymocytes (B) from age (6-week-old) and gender-matched control (Ctrl, Sel1lflox/flox), Sel1l KO (Sel1lflox/flox; CD2-iCre), Perk KO (Perkflox/flox; CD2-iCre)and Sel1l/Perk double knockout (DKO. Sel1lflox/flox, Perkflox/flox; CD2-iCre) mice. n = 3–5 each group. (C and D) Representative images of spleen (C) and quantification of total splenocytes, total CD3+ T cells, CD4+ T cells, and CD8+ T cells (D) from the same mice with indicated genotype as in A and B. n = 3–5 each group. (E and F) Representative images of the inguinal (left) lymph node (E) and quantification of total lymphocytes, total CD3+ T cells, CD4+ T cells, and CD8+ T cells (F) from the same mice with indicated genotype as in A and B. n = 3–5 each group. (G) Quantitative RT–PCR analysis of Chop expression in DN3 thymocytes sorted from mice with indicated genotype. n = 3–5 each group. (H and I) Representative images (H) and quantification (I) of cleaved caspase-3 (CC3)-positive cells in the thymus of 6- to 8-week-old gender-matched mice with indicated genotype. Twelve fields were counted at ×20 magnification from four mice with indicated genotype. Scale bars are indicated. Data are representative of three independent experiments and are shown as mean ± s.d. The statistical significance was calculated by two-tailed unpaired t-test (D, F) One-way ANOVA with turkey test (B, G) or one-way ANOVA with Bonferroni test (I). ns, not significant, *p < 0.05, **p < 0.01, ***p < 0.001, ****p < 0.0001.
-
Figure 6—source data 1
Excel file containing numerical values shown in Figure 6.
- https://cdn.elifesciences.org/articles/69975/elife-69975-fig6-data1-v3.xlsx
Figure 6—figure supplement 1
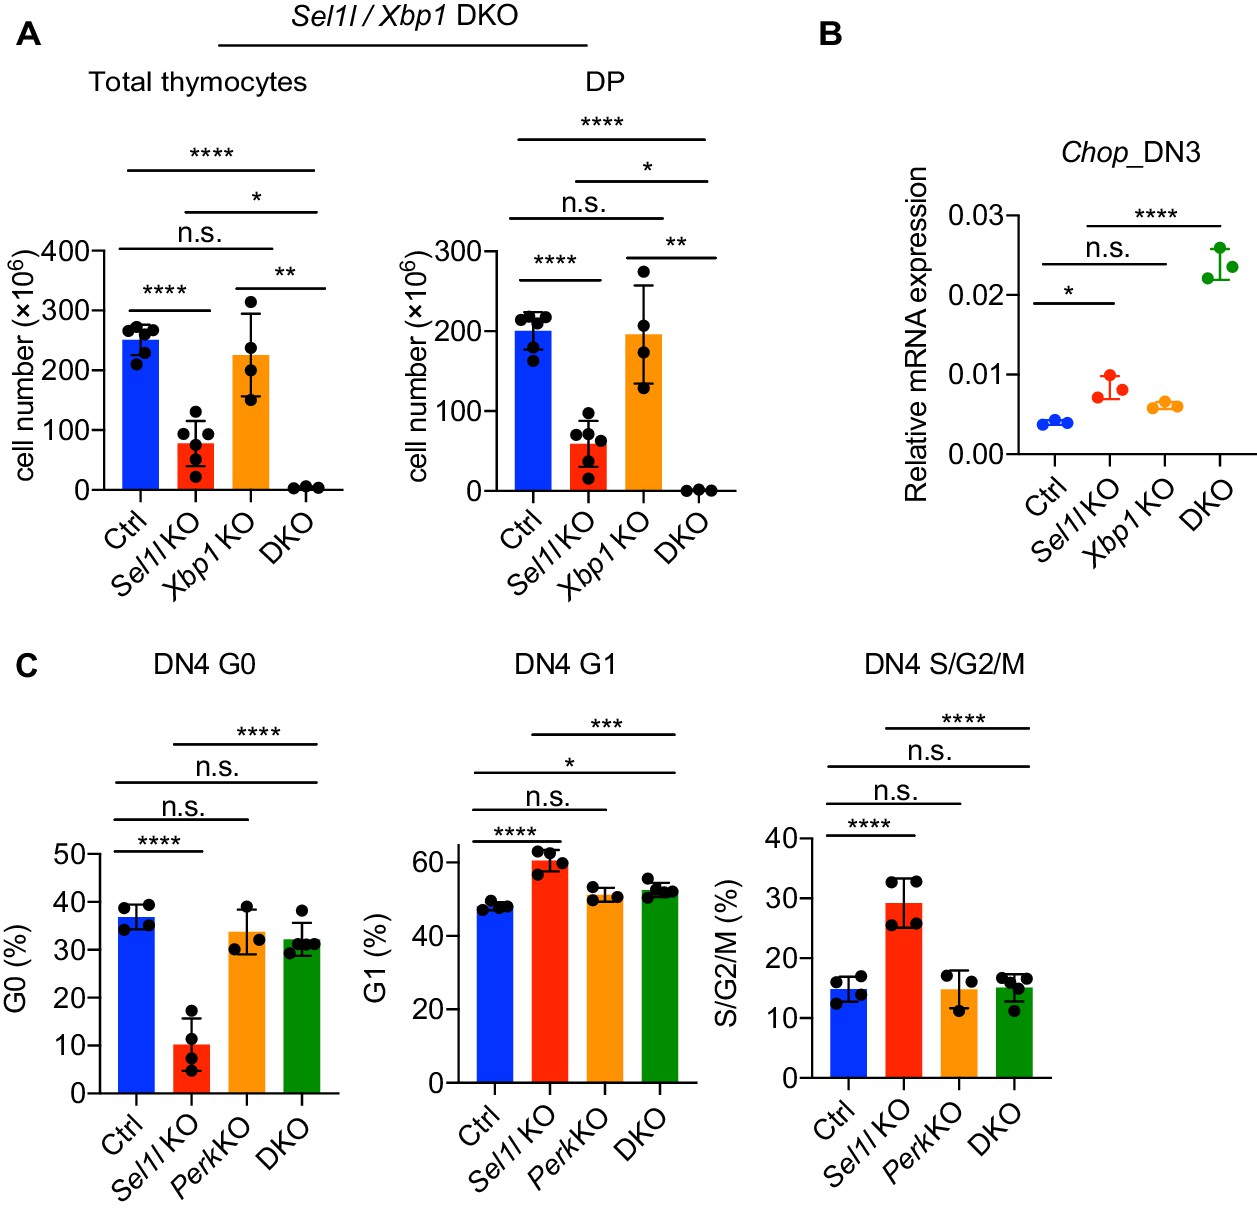
XBP1 functions as a compensatory adaptative mechanism in Sel1l CKO mouse.
(A) Quantification of total cellularity and DP cell numbers of 6–8 week-old gender-matched control (Ctrl, Sel1lflox/flox), Sel1l KO (Sel1lflox/flox; CD2-iCre), Xbp1 KO (Xbp1 flox/flox; CD2-iCre), and Sel1l/Xbp1 double knockout (DKO, Sel1lflox/flox; Xbp1flox/flox; CD2-iCre) mice. n = 3–6/each group. (B) Quantitative RT-PCR analysis Chop expression in DN3 thymocytes sorted from mice with indicated genotype. Data are presented relative to Actb. (C) Cell cycle analysis of DN4 thymocytes from age (6-week-old) and gender-matched control (Ctrl, Sel1lflox/flox), Sel1l KO (Sel1lflox/flox; CD2-iCre), Perk KO (Perkflox/flox; CD2-iCre) and Sel1l/Perk double knockout (DKO. Sel1lflox/flox; Perkflox/flox; CD2-iCre) mice. n = 3–5 each group. Data are shown as mean ± s.d. The statistical significance was calculated by two-tailed unpaired t-test (A, B) or One-way ANOVA with Turkey test (C). n.s., not significant, *p < 0.05, **p < 0.01, ***p < 0.001, ****p < 0.0001.
-
Figure 6—figure supplement 1—source data 1
Excel file containing numerical values shown in Figure 6—figure supplement 1.
- https://cdn.elifesciences.org/articles/69975/elife-69975-fig6-figsupp1-data1-v3.xlsx
Tables
Appendix 1—key resources table
| Reagent type (species) or resource | Designation | Source or reference | Identifiers | Additional information |
|---|---|---|---|---|
| Genetic reagent (M. musculus) | Sel1lflox | PMID:24453213 | Dr. Ling Qi (Department of Molecular and Integrative Physiology, University of Michigan Medical School) | |
| Genetic reagent (M. musculus) | Xbp1flox | PMID:18556558 | Dr. Laurie H. Glimcher (Dana Farber Cancer Institute) | |
| Genetic reagent (M. musculus) | Perkflox | Jackson Laboratory | Stock No. 023066 RRID:IMSR_JAX:023066 | |
| Genetic reagent (M. musculus) | hCD2-iCre | Jackson Laboratory | Stock No. 008520 RRID:IMSR_JAX:008520 | |
| Genetic reagent (M. musculus) | Cd4-Cre | Jackson Laboratory | Stock No. 022071 RRID:IMSR_JAX:022071 | |
| Genetic reagent (M. musculus) | Atf6lflox | Jackson Laboratory | Stock No. 028253 RRID:IMSR_JAX:028253 | |
| Genetic reagent (M. musculus) | Vav1-iCre | Jackson Laboratory | Stock No. 008610 RRID:IMSR_JAX:008610 | |
| Genetic reagent (M. musculus) | OTII transgenic | Jackson Laboratory | Stock No. 004194 RRID:IMSR_JAX:004194 | |
| Cell line (M. musculus) | EL4 | ATCC | TIB-39 RRID:CVCL_0255 | |
| Cell line (M. musculus) | OP9-DL1 | PMID:12479821 | Dr. Juan Carlos Zúñiga-Pflücker (University of Toronto) | |
| Cell line (Homo sapiens) | HEK293T | ATCC | CRL-3216 RRID:CVCL_0063 | |
| Antibody | FITC anti-mouse CD45.1, Clone A20 (Mouse monoclonal) | Biolegend | 110706 RRID:AB_313494 | (1:100) FC |
| Antibody | APC anti-mouse CD45.2, Clone 104 (Mouse monoclonal) | Biolegend | 109814 RRID:AB_389211 | (1:100) FC |
| Antibody | Pacific Blue anti-mouse CD45.1, Clone A20 (Mouse monoclonal) | Biolegend | 110721 RRID:AB_492867 | (1:100) FC |
| Antibody | Alexa Fluor 700 anti-mouse CD45.2, Clone 104 (Mouse monoclonal) | Biolegend | 109822 RRID:AB_493731 | (1:100) FC |
| Antibody | FITC anti-mouse/human CD44, Clone IM7 (Rat monoclonal) | Biolegend | 103006 RRID:AB_312957 | (1:100) FC |
| Antibody | PE/Dazzle 594 anti-mouse/human CD44, Clone IM7 (Rat monoclonal) | Biolegend | 103056 RRID:AB_2564044 | (1:100) FC |
| Antibody | APC anti-mouse CD25, Clone 3C7 (Rat monoclonal) | Biolegend | 101910 RRID:AB_2280288 | (1:100) FC |
| Antibody | FITC anti-mouse Ki-67, Clone 16A8 (Rat monoclonal) | Biolegend | 652409 RRID:AB_2562140 | (1:100) FC |
| Antibody | APC/Fire 750 anti-mouse CD117 (c-Kit), Clone 2B8 (Rat monoclonal) | Biolegend | 105838 RRID:AB_2616739 | (1:50) FC |
| Antibody | Brilliant Violet 650 anti-mouse CD4, Clone RM4-5 (Rat monoclonal) | Biolegend | 100546 RRID:AB_2562098 | (1:100) FC |
| Antibody | Alexa Fluor 700 anti-mouse CD8a, Clone 53–6.7 (Rat monoclonal) | Biolegend | 100730 RRID:AB_493703 | (1:100) FC |
| Antibody | PE anti-mouse/rat/human CD27, Clone LG.3A10 (Armenian Hamster monoclonal) | Biolegend | 124209 RRID:AB_1236464 | (1:100) FC |
| Antibody | PE anti-mouse TCR β chain, Clone H57-597 (Armenian Hamster monoclonal) | Biolegend | 109207 RRID:AB_313430 | (1:100) FC |
| Antibody | APC anti-mouse TCR β chain, Clone H57-598 (Armenian Hamster monoclonal) | Biolegend | 109211 RRID:AB_313434 | (1:100) FC |
| Antibody | PE/Cyanine7 anti-mouse CD24, Clone M1/69 (Rat monoclonal) | Biolegend | 101822 RRID:AB_756048 | (1:100) FC |
| Antibody | PE/Dazzle 594 anti-mouse CD3ε, Clone 145–2 C11 (Armenian Hamster monoclonal) | Biolegend | 100348 RRID:AB_2564029 | (1:100) FC |
| Antibody | Pacific Blue anti-mouse/human CD45R/B220, Clone RA3-6B2 (Rat monoclonal) | Biolegend | 103230 RRID:AB_492877 | (1:100) FC |
| Antibody | FITC anti-mouse NK-1.1, Clone PK136 (Mouse monoclonal) | Biolegend | 108706 RRID:AB_313393 | (1:100) FC |
| Antibody | APC Anti-mouse TCR γ/δ, Clone GL3 (Armenian Hamster monoclonal) | Biolegend | 118115 RRID:AB_1731824 | (1:100) FC |
| Antibody | PE Anti-mouse TCR γ/δ, Clone GL3 (Mouse monoclonal) | Biolegend | 118108 RRID:AB_313832 | (1:100) FC |
| Antibody | PE anti-mouse Notch 1, Clone HMN1-12 (Armenian Hamster monoclonal) | Biolegend | 130607 RRID:AB_1227719 | 5 µL/test FC |
| Antibody | violetFluor 450 Anti-Mouse CD45, Clone 30-F11 (Rat monoclonal) | TONBO | 75–0451 U100 RRID:AB_2621947 | (1:100) FC |
| Antibody | PE anti-mouse CD150 (SLAM), Clone TC15-12F12.2 (Rat monoclonal) | BioLegend | 115904 RRID:AB_313683 | (1:100) FC |
| Antibody | TruStain FcX (anti-mouse CD16/32), Clone 93 (Rat monoclonal) | BioLegend | 101320 RRID:AB_1574975 | (1:100) FC |
| Antibody | APC anti-mouse Ly-6A/E (Sca-1), Clone D7 (Rat monoclonal) | BioLegend | 108112 RRID:AB_313349 | (1:100) FC |
| Antibody | PE/Cyanine7 Streptavidin | BioLegend | 405206 | (1:100) FC |
| Antibody | FITC anti-mouse CD48, Clone HM48-1 (Armenian Hamster monoclonal) | BioLegend | 103404 RRID:AB_313019 | (1:100) FC |
| Antibody | Biotin anti-mouse CD3ε, Clone 145–2 C11 (Armenian Hamster monoclonal) | Biolegend | 100304 RRID:AB_312669 | (1:100) FC |
| Antibody | Biotin anti-mouse/human CD45R/B220, Clone RA3-6B2 (Rat monoclonal) | Biolegend | 103204 RRID:AB_312989 | (1:100) FC |
| Antibody | Biotin anti-mouse TER-119, Clone TER-119 (Rat monoclonal) | Biolegend | 116204 RRID:AB_313705 | (1:100) FC |
| Antibody | Biotin anti-mouse CD49b (pan-NK cells), Clone DX5 (Rat monoclonal) | BioLegend | 108904 RRID:AB_313411 | (1:100) FC |
| Antibody | Biotin anti-mouse/human CD11b, Clone M1/70 (Rat monoclonal) | Biolegend | 101204 RRID:AB_312787 | (1:100) FC |
| Antibody | Biotin anti-mouse CD11c, Clone N418 (Armenian Hamster monoclonal) | Biolegend | 117303 RRID:AB_313772 | (1:100) FC |
| Antibody | Biotin anti-mouse Ly-6G/Ly-6C (Gr-1), Clone RB6-8C5 (Rat monoclonal) | BioLegend | 108404 RRID:AB_313369 | (1:100) FC |
| Antibody | FITC Mouse IgG1, κ Isotype Ctrl, Clone MOPC-21 (Mouse monoclonal) | Biolegend | 400108 RRID:AB_326429 | (1:20) FC |
| Antibody | PE Mouse IgG2a, κ Isotype Ctrl, Clone MOPC-173 (Mouse monoclonal) | Biolegend | 400213 RRID:AB_2800438 | (1:20) FC |
| Antibody | PERK (D11A8) (Rabbit monoclonal) | Cell Signaling | 5683S RRID:AB_10841299 | (1:200) WB |
| Antibody | Phospho-PERK (Thr980) (16F8) (Rabbit monoclonal) | Cell Signaling | 3179S RRID:AB_2095853 | (1:100) WB |
| Antibody | IRE1α (14C10) (Rabbit monoclonal) | Cell Signaling | 3294S RRID:AB_823545 | (1:200) WB |
| Antibody | eIF2α Antibody (FL-315) (Rabbit polyclonal) | Santa Cruz | sc-11386 RRID:AB_640075 | (1:200) WB |
| Antibody | Phospho-eIF2α (Ser51) (Rabbit polyclonal) | Cell Signaling | 9721S RRID:AB_330951 | (1:100) WB |
| Antibody | Phospho-Lck (Tyr505) (Rabbit polyclonal) | Cell Signaling | 2751 RRID:AB_330446 | (1:100) WB |
| Antibody | Phospho-Zap-70 (Tyr319)/Syk (Tyr352) (65E4) (Rabbit monoclonal) | Cell Signaling | 2717 RRID:AB_2218658 | (1:100) WB |
| Antibody | Zap-70 (D1C10E) XP (Rabbit monoclonal) | Cell Signaling | 3165 RRID:AB_2218656 | (1:200) WB |
| Antibody | CREB-2 (Rabbit polyclonal) | Santa Cruz | sc-200 RRID:AB_2058752 | (1:200) WB |
| Antibody | BiP (C50B12) (Rabbit monoclonal) | Cell Signaling | 3177 RRID:AB_2119845 | (1:200) WB |
| Antibody | Anti-SEL1L (ab78298) (Rabbit polyclonal) | Abcam | ab78298 RRID:AB_2285813 | (1:200) WB |
| Antibody | β-Actin (13E5) (Rabbit monoclonal) | Cell Signaling | 4970S RRID:AB_2223172 | (1:1000) WB |
| Antibody | Anti-Notch 1 (ab27526) (Rabbit polyclonal) | Abcam | ab27526 RRID:AB_471013 | (1:20) ChIP |
| Antibody | RBPSUH (D10A4) XP (Rabbit monoclonal) | Cell Signaling | 5315 RRID:AB_2665555 | (1:50) ChIP |
| Antibody | Normal Rabbit IgG (Rabbit polyclonal) | Cell Signaling | 2729 s RRID:AB_1031062 | (1:250) ChIP |
| Antibody | Cleaved Caspase-3 (Asp175) (Rabbit polyclonal) | Cell Signaling | 9661 RRID:AB_2341188 | (1:50) IHC |
| Sequence-based reagent | hCD2-iCre | Jackson Laboratory Stock No. 008520 | 5' primer | AGATGCCAGGACATCAGGAACCTG |
| Sequence-based reagent | hCD2-iCre | Jackson Laboratory Stock No. 008520 | 3' primer | ATCAGCCACACCAGACACAGAGATC |
| Sequence-based reagent | Vav1-iCre | Jackson Laboratory Stock No. 008610 | 5' primer | AGATGCCAGGACATCAGGAACCTG |
| Sequence-based reagent | Vav1-iCre | Jackson Laboratory Stock No. 008610 | 3' primer | ATCAGCCACACCAGACACAGAGATC |
| Sequence-based reagent | Sel1l f/f | PMID:24453213 | 5' primer | TTATGTCTGCTTAATTTCTGCTGG |
| Sequence-based reagent | Sel1l f/f | PMID:18556558 | 3' primer | TGAATGAGAAATCCAAGTAGTAGG |
| Sequence-based reagent | Xbp1 f/f | PMID:18556558 | 5' primer | ACTTGCACCAACACTTGCCATTTC |
| Sequence-based reagent | Xbp1 f/f | PMID:18556558 | 3' primer | CAAGGTGGTTCACTGCCTGTAATG |
| Sequence-based reagent | Perk f/f | Jackson Laboratory Stock No. 023066 | 5' primer | TTGCACTCTGGCTTTCACTC |
| Sequence-based reagent | Perk f/f | Jackson Laboratory Stock No. 023066 | 3' primer | AGGAGGAAGGTGGAATTTGG |
| Sequence-based reagent | Atf6 f/f | Jackson Laboratory Stock No. 028253 | Common Forward | TGCATCTGGGAAGAGAACCA |
| Sequence-based reagent | Atf6 f/f | Jackson Laboratory Stock No. 028253 | Wild type Reverse | TGCCATGAACTACCATGTCAC |
| Sequence-based reagent | Atf6 f/f | Jackson Laboratory Stock No. 028253 | Mutant Reverse | AGACTGCCTTGGGAAAAGCG |
| Sequence-based reagent | CD4-iCre | Jackson Laboratory Stock No. 022071 | Common Forward | GTT CTT TGT ATA TAT TGA ATG TTA GCC |
| Sequence-based reagent | CD4-iCre | Jackson Laboratory Stock No. 022071 | Wild type Reverse | TAT GCT CTA AGG ACA AGA ATT GAC A |
| Sequence-based reagent | CD4-iCre | Jackson Laboratory Stock No. 022071 | Mutant Reverse | CTT TGC AGA GGG CTA ACA GC |
| Sequence-based reagent | OTII transgenic | Jackson Laboratory Stock No. 004194 | Transgene Forward | GCT GCT GCA CAG ACC TAC T |
| Sequence-based reagent | OTII transgenic | Jackson Laboratory Stock No. 004194 | Transgene Reverse | CAG CTC ACC TAA CAC GAG GA |
| Sequence-based reagent | Mouse Sel1l | this paper | 5' primer | TGAATCACACCAAAGCCCTG |
| Sequence-based reagent | Mouse Sel1l | this paper | 3' primer | GCGTAGAGAAAGCCAAGACC |
| Sequence-based reagent | Mouse Xbp1 | this paper | 5' primer | CTGAGCCCGGAGGAGAAAG |
| Sequence-based reagent | Mouse Xbp1 | this paper | 3' primer | CTTCCAAATCCACCACTTGC |
| Sequence-based reagent | Mouse Xbp1s | this paper | 5' primer | CTGAGTCCGCAGCAGGTG |
| Sequence-based reagent | Mouse Xbp1s | this paper | 3' primer | TCCAACTTGTCCAGAATGCC |
| Sequence-based reagent | Mouse Ddit3(Chop) | this paper | 5' primer | GTCCCTAGCTTGGCTGACAGA |
| Sequence-based reagent | Mouse Ddit3(Chop) | this paper | 3' primer | TGGAGAGCGAGGGCTTTG |
| Sequence-based reagent | Mouse Erdj4 | this paper | 5' primer | CACAAATTAGCCATGAAGTACC |
| Sequence-based reagent | Mouse Erdj4 | this paper | 3' primer | TTTCATACGCTTCTGCAATCTC |
| Sequence-based reagent | Mouse Atf4 | this paper | 5' primer | CCACCATGGCGTATTAGAGG |
| Sequence-based reagent | Mouse Atf4 | this paper | 3' primer | GTCCGTTACAGCAACACTGC |
| Sequence-based reagent | Mouse Hrd1 | this paper | 5' primer | CAAGGTCCTGCTGTACATGG |
| Sequence-based reagent | Mouse Hrd1 | this paper | 3' primer | GTGTTCATGTTGCGGATGGC |
| Sequence-based reagent | Mouse Atf6 | this paper | 5' primer | AGGGAGAGGTGTCTGTTTCG |
| Sequence-based reagent | Mouse Atf6 | this paper | 3' primer | CTGCATCAAAGTGCACATCA |
| Sequence-based reagent | Mouse OS9 | this paper | 5' primer | GGTGTCGGGAGCCTGAATTT |
| Sequence-based reagent | Mouse OS9 | this paper | 3' primer | CCTCTCTTTCACGTTGGAAGTG |
| Sequence-based reagent | Mouse Edem1 | this paper | 5' primer | GGGGCATGTTCGTCTTCGG |
| Sequence-based reagent | Mouse Edem1 | this paper | 3' primer | CGGCAGTAGATGGGGTTGAG |
| Sequence-based reagent | Mouse Calreticulin | this paper | 5' primer | CCTGCCATCTATTTCAAAGAGCA |
| Sequence-based reagent | Mouse Calreticulin | this paper | 3' primer | GCATCTTGGCTTGTCTGCAA |
| Sequence-based reagent | Mouse Hyou1 | this paper | 5' primer | TGCGCTTCCAGATCAGTCC |
| Sequence-based reagent | Mouse Hyou1 | this paper | 3' primer | GGAGTAGTTCAGAACCATGCC |
| Sequence-based reagent | Mouse Canx | this paper | 5' primer | ATGGAAGGGAAGTGGTTACTGT |
| Sequence-based reagent | Mouse Canx | this paper | 3' primer | GCTTTGTAGGTGACCTTTGGAG |
| Sequence-based reagent | Mouse GRP94 | this paper | 5' primer | TCGTCAGAGCTGATGATGAAGT |
| Sequence-based reagent | Mouse GRP94 | this paper | 3' primer | GCGTTTAACCCATCCAACTGAAT |
| Sequence-based reagent | Mouse Hes1 | this paper | 5' primer | CCAGCCAGTGTCAACACGA |
| Sequence-based reagent | Mouse Hes1 | this paper | 3' primer | AATGCCGGGAGCTATCTTTCT |
| Sequence-based reagent | Mouse Deltex | this paper | 5' primer | ATCAGTTCCGGCAAGACACAG |
| Sequence-based reagent | Mouse Deltex | this paper | 3' primer | CGATGAGAGGTCGAGCCAC |
| Sequence-based reagent | Mouse preTCRa | this paper | 5' primer | TCACACTGCTGGTAGATGGA |
| Sequence-based reagent | Mouse preTCRa | this paper | 3' primer | TAGGCTCAGCCACAGTACCT |
| Sequence-based reagent | Mouse Notch1 | this paper | 5' primer | ACACTGACCAACAAATGGAGG |
| Sequence-based reagent | Mouse Notch1 | this paper | 3' primer | GTGCTGAGGCAAGGATTGGA |
| Sequence-based reagent | Mouse Actin | this paper | 5' primer | TACCACCATGTACCCAGGCA |
| Sequence-based reagent | Mouse Actin | this paper | 3' primer | CTCAGGAGGAGCAATGATCTTGAT |
| Sequence-based reagent | Vβ5 Forward | this paper | 5' primer | 5' CCCAGCAGATTCTCAGTCCAACAG 3' |
| Sequence-based reagent | Vβ8 Forward | this paper | 3' primer | 5' GCATGGGCTGAGGCTGATCCATTA 3' |
| Sequence-based reagent | Vβ11 Forward | this paper | 5' primer | 5' TGCTGGTGTCATCCAAACACCTAG 3' |
| Sequence-based reagent | Jβ2 Reverse | this paper | 3' primer | 5' TGAGAGCTGTCTCCTACTATCGATT 3' |
| Sequence-based reagent | eF-la Forward | this paper | 5' primer | 5'CTGCTGAGATGGGAAAGGGCT-3' |
| Sequence-based reagent | eF-la Reverse | this paper | 3' primer | 5' TTCAGGATAATCACCTGAGCA 3' |
| Sequence-based reagent | Sel1l promoter reporter wildtype | this paper | 5' primer | TAGCACGCGTGGGAAATGACAAGCGGCATTGTCTTGTAC |
| Sequence-based reagent | Sel1l promoter reporter wildtype | this paper | 3' primer | ATGCCTCGAGCCTGCTCTCGAAGGTCGAGAGCC |
| Sequence-based reagent | Sel1l promoter reporter mutated left_arm | this paper | 5' primer | CAGTTCAGGTATAGCTTATGGATCCGCGTTCATATCATGTCCAGTTCAAGGGATCCAAATAATTAAAAAGAAATACTTAGC |
| Sequence-based reagent | Sel1l promoter reporter mutated left_arm | this paper | 3' primer | GCTAAGTATTTCTTTTTAATTATTTGGATCCCTTGAACTGGACATGATATGAACGCGGATCCATAAGCTATACCTGAACTG |
| Sequence-based reagent | Sel1l promoter reporter mutated right-arm | this paper | 5' primer | TCTGGGCCAGGGAGGCCGTAAGGGGGGCGAAGAAGGAACC |
| Sequence-based reagent | Sel1l promoter reporter mutated right-arm | this paper | 3' primer | TCTGGGCCAGGGAGGCCGTAAGGGGGGCGAAGAAGGAACC |
| Sequence-based reagent | Hrd1 promoter reporter wildtype | this paper | 5' primer | TAGCACGCGTGTGACCCCTGTGTAACGGTTTGATTCC |
| Sequence-based reagent | Hrd1 promoter reporter wildtype | this paper | 3' primer | ATGCAAGCTTGAAAACAGATATAGGTCTTCC |
| Sequence-based reagent | Hrd1 promoter reporter mutated left arm | this paper | 5' primer | CCCCGGCCTATGGACTGCGCTGCATACGCTGGCATCCAGCTGCCTTGGCA |
| Sequence-based reagent | Hrd1 promoter reporter mutated left arm | this paper | 3' primer | TGCCAAGGCAGCTGGATGCCAGCGTATGCAGCGCAGTCCATAGGCCGGGG |
| Sequence-based reagent | Hrd1 promoter reporter mutated middle arm | this paper | 5' primer | CCAGAAATTTTTCCTTTCTTGCATACTTGGTCCGCGTAACTTT |
| Sequence-based reagent | Hrd1 promoter reporter mutated middle arm | this paper | 3' primer | AAAGTTACGCGGACCAAGTATGCAAGAAAGGAAAAATTTCTGG |
| Sequence-based reagent | Hrd1 promoter reporter mutated right arm | this paper | 5' primer | TAGCACGCGTGTGACCCCTGTGTAACGGTTTGATTCC |
| Sequence-based reagent | Hrd1 promoter reporter mutated right arm | this paper | 3' primer | ATGCAAGCTTGAAAACAGATATAGGTCCCTTACGGTTACCTCCCCCCAAC |
| Sequence-based reagent | ChIP-qPCR, Sel1l promoter P1 | this paper | 5' primer | TTCAGTTCAGGTATAGCTTATTTCTCAGCG |
| Sequence-based reagent | ChIP-qPCR, Sel1l promoter P1 | this paper | 3' primer | CGGTTAAGAACTTGCAAGGTTGCTAAG |
| Sequence-based reagent | ChIP-qPCR, Sel1l promoter P2 | this paper | 5' primer | CCTTATGCCCTCAGCCACCTGCGGC |
| Sequence-based reagent | ChIP-qPCR, Sel1l promoter P2 | this paper | 3' primer | GGGAACCCTCATCCAGGACTAC |
| Sequence-based reagent | ChIP-qPCR, Sel1l promoter P3 | this paper | 5' primer | CGCTTAACAAGACAGCTGTTGGG |
| Sequence-based reagent | ChIP-qPCR, Sel1l promoter P3 | this paper | 3' primer | TCTGGGGATTCAAATAACCATCTGGG |
| Sequence-based reagent | ChIP-qPCR, Hrd1 promoter P1 | this paper | 5' primer | GCTAGTTATGAATTGTAAGTAAACGTCTG |
| Sequence-based reagent | ChIP-qPCR, Hrd1 promoter P1 | this paper | 3' primer | CTGATTCTAGACGACTTTAAGGCAG |
| Sequence-based reagent | ChIP-qPCR, Hrd1 promoter P2 | this paper | 5' primer | AACCAATCGGCGGTAGCCACGG |
| Sequence-based reagent | ChIP-qPCR, Hrd1 promoter P2 | this paper | 3' primer | GGATAGCTACGACACGGTAAGAAG |
| Sequence-based reagent | ChIP-qPCR, Hrd1 promoter P3 | this paper | 5' primer | TGCCCAGGTTTCACAGTGCAGC |
| Sequence-based reagent | ChIP-qPCR, Hrd1 promoter P3 | this paper | 3' primer | ACCGAGACGCAGGAGAACACC |
| Sequence-based reagent | ChIP-qPCR, Os9 promoter P1 | this paper | 5' primer | GCTAGAGATGTCCCTTCCGC |
| Sequence-based reagent | ChIP-qPCR, Os9 promoter P1 | this paper | 3' primer | CAGCCAATGAAAGCTTGGGG |
| Sequence-based reagent | ChIP-qPCR, Os9 promoter P2 | this paper | 5' primer | GGAGGATAGCCGTGCTTTGA |
| Sequence-based reagent | ChIP-qPCR, Os9 promoter P2 | this paper | 3' primer | ATCATAGCTAAGGAGTGAGAATGAG |
| Sequence-based reagent | ChIP-qPCR, Edem1 promoter P1 | this paper | 5' primer | CTACTCCATACCTGGACGGG |
| Sequence-based reagent | ChIP-qPCR, Edem1 promoter P1 | this paper | 3' primer | GCCCTAGCCCGGGTAAATG |
| Sequence-based reagent | ChIP-qPCR, Edem1 promoter P2 | this paper | 5' primer | CCCTGGTGAGTTGCTGATGT |
| Sequence-based reagent | ChIP-qPCR, Edem1 promoter P2 | this paper | 3' primer | TGCTGTGAGTGTGTATGCGT |
| Sequence-based reagent | Mouse Xbp1 splicing | PMID:29480818 | 5' primer | ACACGCTTGGGAATGGACAC |
| Sequence-based reagent | Mouse Xbp1 splicing | PMID:29480818 | 3' primer | CCATGGGAAGATGTTCTGGG |
| Sequence-based reagent | Mouse Actin | PMID:29480818 | 5' primer | TACCACCATGTACCCAGGCA |
| Sequence-based reagent | Mouse Actin | PMID:29480818 | 3' primer | CTCAGGAGGAGCAATGATCTTGAT |
| peptide, recombinant protein | Recombinant Murine Flt3-Ligand, 2 ug | 250–31L | peprotech | |
| peptide, recombinant protein | Recombinant Murine IL7, 2 ug | 217–17 | peprotech | |
| peptide, recombinant protein | Recombinant Mouse DLL4 | 776702 | Biolegend | |
| commercial assay or kit | High-Capacity cDNA Reverse Transcription Kit | 4368813 | Thermo Fisher | |
| commercial assay or kit | Power SYBR Green PCR Master Mix | A25778 | Thermo Fisher | |
| commercial assay or kit | In Situ Cell Death Detection Kit, Fluorescein | 11684795910 | Roche | |
| commercial assay or kit | FITC BrdU Flow Kit | 559619 | BD Bioscience | |
| commercial assay or kit | eBioscience Foxp3 / Transcription Factor Staining Buffer Set | 00-5523-00 | Thermo Fisher | |
| commercial assay or kit | ER-Tracker Green (BODIPY FL Glibenclamide), for live-cell imaging | E34251 | Thermo Fisher | |
| commercial assay or kit | ProteoStat (R) Aggresome detect Kit | ENZ-51035-K100 | ENZO | |
| commercial assay or kit | Click-iT Plus OPP Alexa Fluor 647 Protein Synthesis Assay Kit | C10458 | Thermo Fisher | |
| commercial assay or kit | Genomic DNA Mini Kit | K182002 | Thermo Fisher | |
| commercial assay or kit | Truseq Stranded mRNA Kit | # 20020594 | Illumina | |
| Chemical compound, drug | DAPT | HY-13027 | MedChemExpress | |
| Chemical compound, drug | ISRIB (trans-isomer) | HY-12495 | MedChemExpress | |
| Chemical compound, drug | Tunicamycin | 76102–666 | VWR | |
| Chemical compound, drug | Tetraphenylethene maleimide (TMI) | PMID:31914399 | Custom Synthesized | |
| Software, algorithm | STAR | Version 2.5.2b | ||
| Software, algorithm | DESeq2 | R 3.6.1 | Version 1.26.0 | |
| Software, algorithm | fgsea | R 3.6.1 | Version 1.11.2 | |
| Software, algorithm | pheatmap | R 3.6.1 | Version 1.0.12 | |
| Software, algorithm | Enrichr | https://maayanlab.cloud/Enrichr/ | ||
| Software, algorithm | Graphpad Prism 8.4 | Graphpad (graphpad.com) | RRID:SCR_002798 | |
| Software, algorithm | Fiji | http://imagej.net/Fiji | RRID:SCR_003070 | |
| Software, algorithm | FlowJo 10 | Tree Star | RRID:SCR_008520 | |
| Software, algorithm | Biorender | https://biorender.com/ | Biorender was utilized to make the schematic diagrams used in this study. | |
| Other | LD Columns | 130-042-901 | Miltenyi Biotec | |
| Other | CD4 (L3T4) MicroBeads, mouse 1 x 2 mL | 130-117-043 | Miltenyi Biotec | |
| Other | CD8a (Ly-2) MicroBeads, mouse | 130-117-044 | Miltenyi Biotec | |
| Other | DAPI (4',6-Diamidino-2-Phenylindole, Dihydrochloride) | D1306 | Thermo Fisher | |
| Other | Precision Count Beads | 424902 | Biolegend | |
| Other | RBC Lysis Buffer (10X) | 420301 | Biolegend | |
| Other | Liquid DAB+ | K3468 | Dako |
Additional files
Download links
A two-part list of links to download the article, or parts of the article, in various formats.
Downloads (link to download the article as PDF)
Open citations (links to open the citations from this article in various online reference manager services)
Cite this article (links to download the citations from this article in formats compatible with various reference manager tools)
Notch-induced endoplasmic reticulum-associated degradation governs mouse thymocyte β−selection
eLife 10:e69975.
https://doi.org/10.7554/eLife.69975


