A genome-phenome association study in native microbiomes identifies a mechanism for cytosine modification in DNA and RNA
- New England Biolabs, United States
- School of Dentistry, National Yang Ming Chiao Tung University, Taiwan
Figures
Figure 1 with 1 supplement
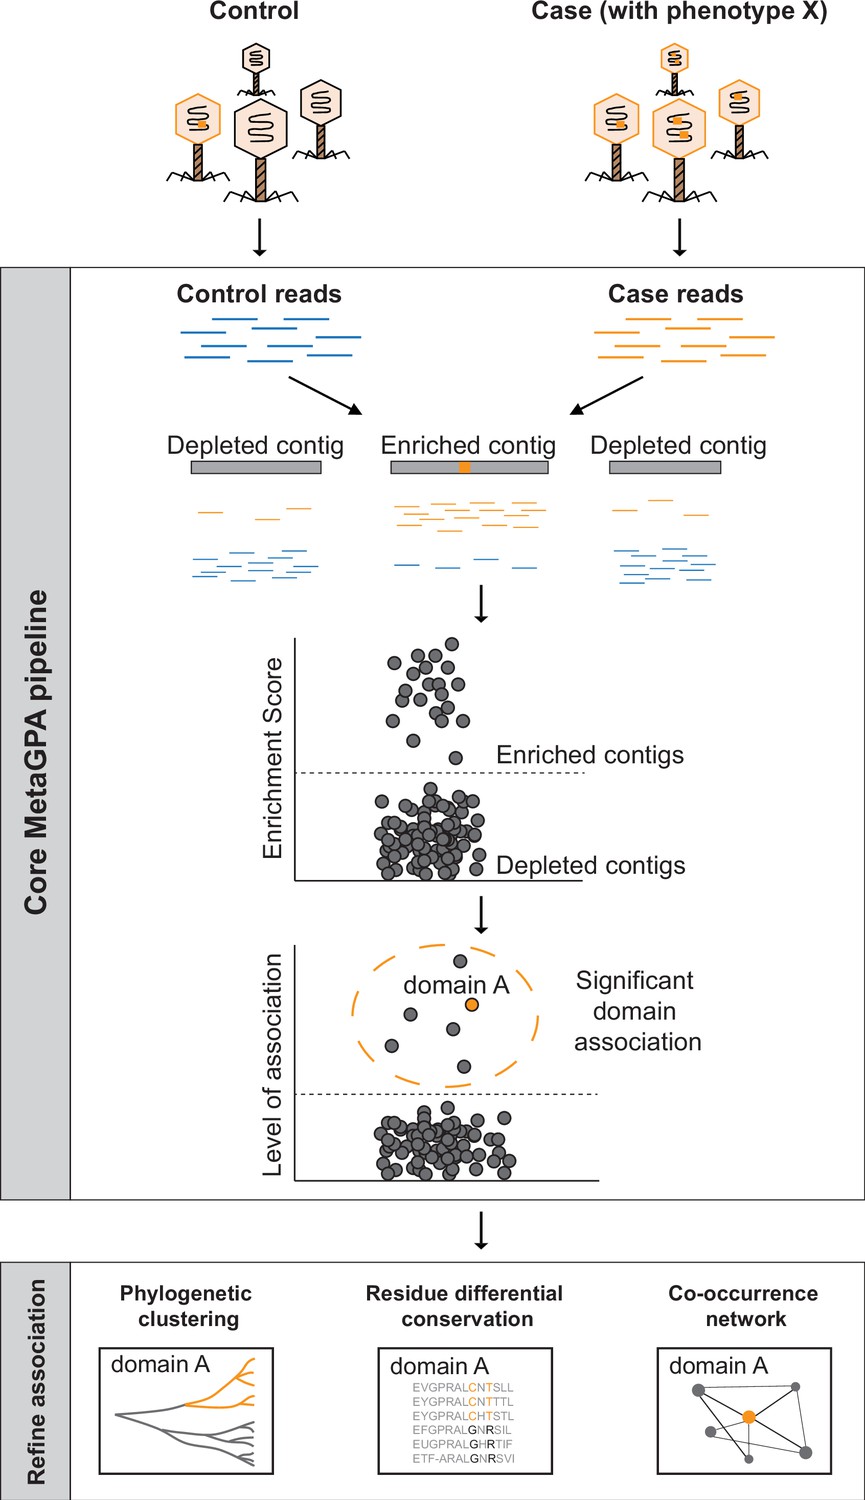
Schematic overview of Metagenomics Genome-Phenome Association (MetaGPA).
The core MetaGPA pipeline is applied to identify protein domains that are significantly associated with a given phenotype. The pipeline takes high-throughput sequencing datasets from two libraries representing (1) the total microbiome (control reads) and (2) a subset of the microbiome resulting from a given treatment that selects for the studied phenotype (case reads). Control and case reads are assembled into contigs and contigs are classified as enriched or depleted based on the ratio between the number of reads mapping to the contigs from the case versus control. Contigs are annotated based on homology with known protein domains and each domain is evaluated for its association with the studied phenotype based on the number of hits in the enriched compared to control contigs. In this theoretical example, the orange bar represents a protein domain that is associated with phenotype X (e.g., DNA cytosine modification, see below). We then apply additional metrics such as phylogenetic clustering, differential conservation, and co-occurrence network to refine this association and identify candidate genes for experimental validation. More details about the workflow are provided in Figure 1—figure supplement 1.
Figure 1—figure supplement 1
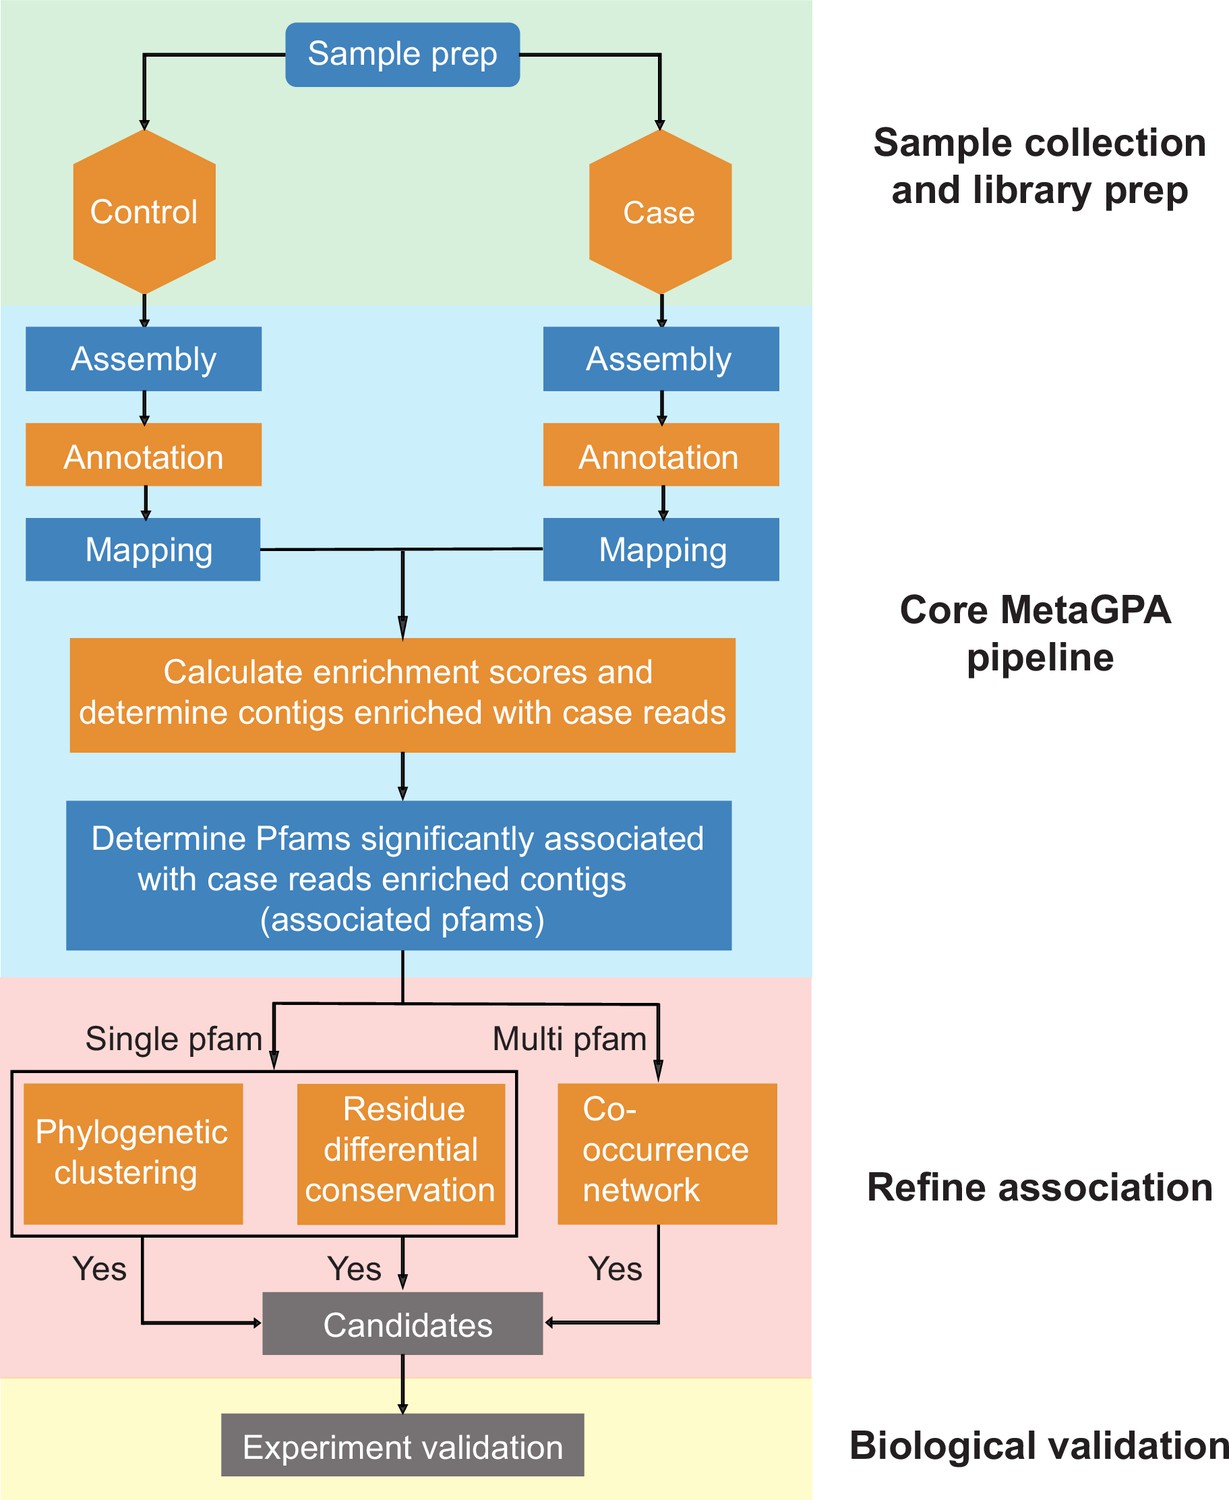
Detailed workflow of Metagenomics Genome-Phenome Association (MetaGPA).
An environmental sample is subjected to a defined selection to retain only the genetic material from microorganisms that harbor the desired phenotype (case). The same environmental sample with no selection is also needed (control). The case and control cohorts are processed by the MetaGPA main pipeline through the following steps: First, reads from the case and control libraries are assembled into contigs. Second, predictive proteins encoded by these contigs are annotated using Pfam. Next, reads are aligned to these contigs to allow calculation of enrichment scores. With a chosen enrichment score cutoff, the pipeline determines which contigs are enriched with case reads. Moreover, statistical analyses are applied to identify Pfams with significant association to these enriched contigs. Once the associated Pfams are determined, we can perform further association analyses to study if any Pfam (or candidate gene) can be prioritized for further experimental validation. The criteria for a good candidate Pfam are: members of this Pfam on case contigs exhibit phylogenetic clustering and differential residue conservation pattern; this Pfam is within the multi-component co-occurring network built by the most significantly associated Pfams.
Figure 2

Selective sequencing of DNA containing modified cytosines.
(A), Schematic of enzymatic selection. With enzymatic selection treatment, adaptor ligated products were first incubated with ten-eleven translocation dioxygenase 2 (TET2) and T4 phage β-glucosyltransferase (T4-BGT) so that 5-methyl-2'-deoxycytidine (5mdC) (m) and 5-hydroxymethyl-2'-deoxycytidine (5hmdC) (hm) in these sequences may be oxidized to 5-carboxy-2’-deoxycytidine (ca) or glucosylated to 5-β-glucosyloxymethyl-2’-deoxycytidine (gm) (Materials and methods). Unmodified cytosines were deaminated by APOBEC3A into uracils and then cut by uracil-specific excision reagent (USER), so that DNA with modified cytosines is enriched after the selection. This method is predicted to also preserve unknown forms of cytosine modification (denoted ‘x’) provided that they block C-to-U deamination. Whereas in the untreated control, only USER is added to clear up damaged DNAs generated in the previous library prep step. (B) Enrichment of modified DNA with serial dilutions. A total of 250 ng genomic DNA (from Escherichia coli) and cytosine-modified genomic DNA (from T4gt) were used for enzymatic selection or control per assay. Bar graphs show average recovery of DNA from three independent experiments ± SEM.
Figure 3 with 1 supplement

Screening of contigs associated with DNA modification.
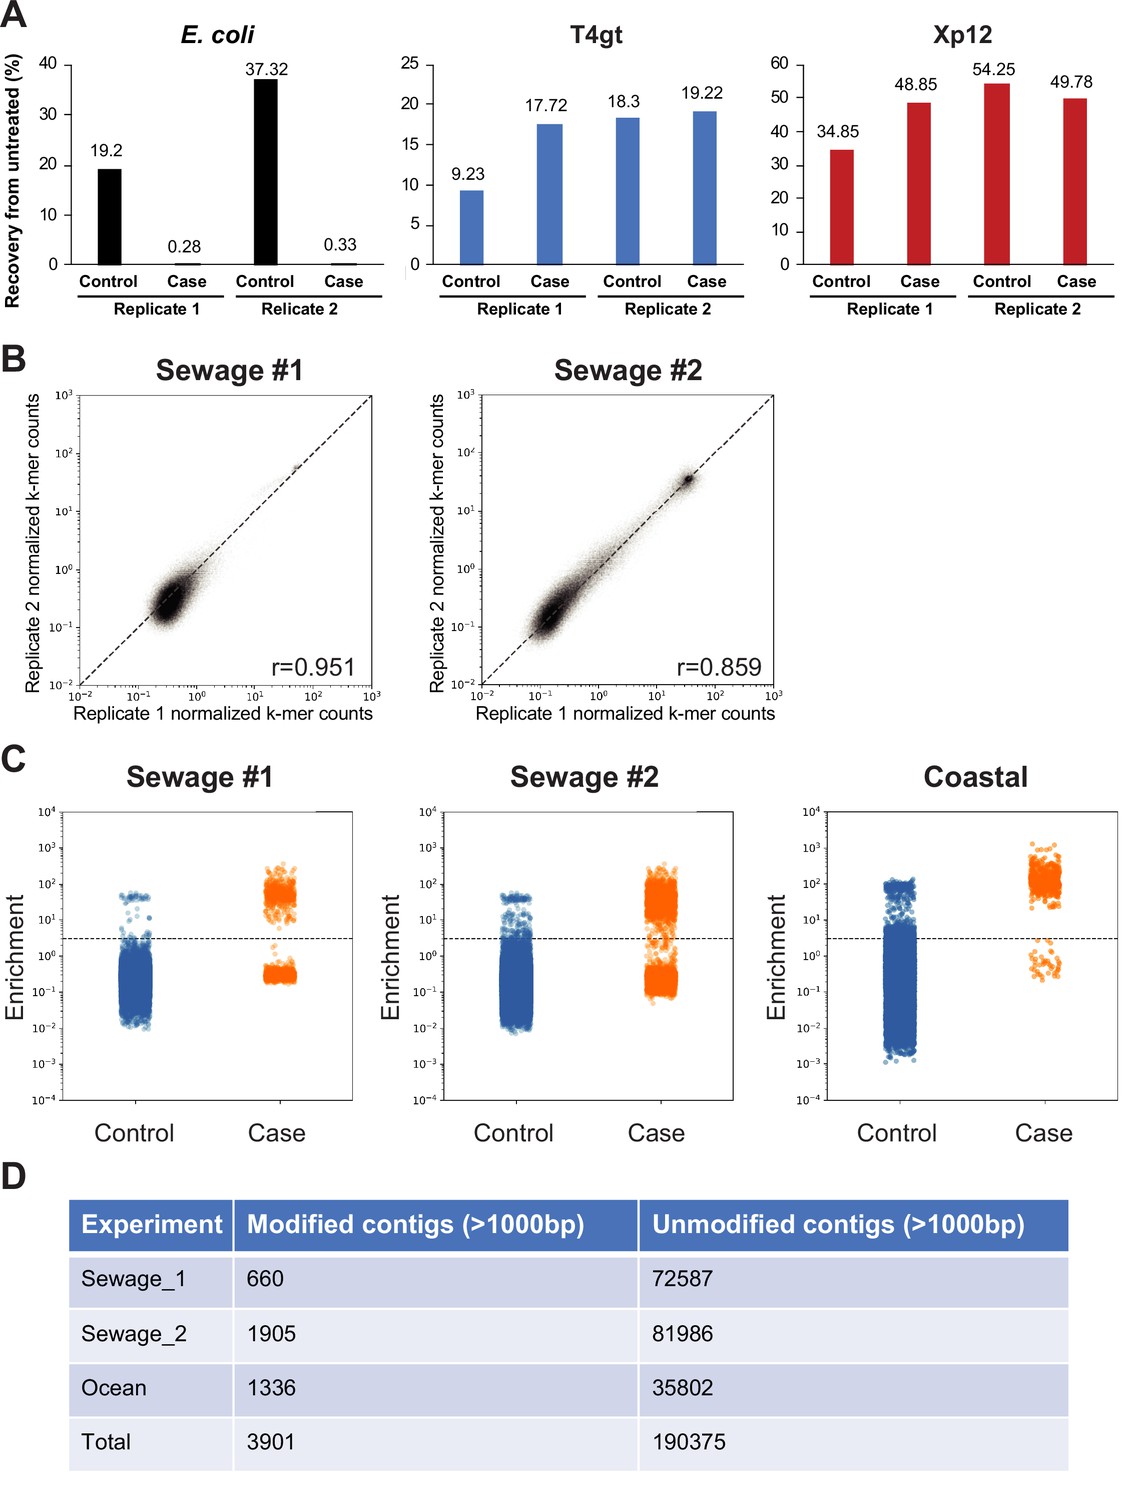
( A) Overview of the environmental samples and analysis used in this study. Three independent sequencing experiments were performed on three samples, two sewage samples (same sampling location at different times #1 and #2) and one coastal sample (Beverly, MA). Phage DNA was collected and extracted and for the sewage samples, two technical replicates (Rep 1 and 2) were performed. Analyses performed with separate or composite datasets were indicated in below blocks. (B) Normalized frequency of k-mer in sequencing reads from control (x-axis) compared to case (y-axis) groups. Each dot represents a unique 16-mer and is colored according to the resulting contig category it belonged to. The origin of the k-mer sequences were identified by exact search on the contigs or reverse complement of the contigs. K-mers found in the modified contigs were colored in orange; k-mers found in unmodified contigs were colored in blue; k-mers not found in contigs were marked as gray. See C below for definition of modified/unmodified contigs. Subsamples of randomly selected 0.1% of all possible k-mers were used for plotting. (C) Dotplot represents the enrichment scores for each non-redundant contig in the control (left) and case/enzymatic selection (right) cohorts. Dashed line separates modified from unmodified contigs based on a threshold enrichment score equaled to 3 (enrichment score = RPKM(selection) / RPKM(control)). The plot shows every contig from all three environmental samples. (D) Distributions of modified (orange) and unmodified (blue) contigs length (in kilobases, kb).
Figure 3—figure supplement 1
Validation of the selection method for DNA cytosine modification.
(A) Recoveries of various spiked-in DNA measured using quantitative PCR (qPCR) quantification. Genomic DNA from Escherichia coli (dC), XP12 (5mdC), and T4gt (5hmdC) were mixed at 1:1:1 ratio by molarity and a total of 100 ng DNA were spiked in the sequencing libraries from sewage #2. Recovery percentages of control (uracil-specific excision reagent [USER]) and selection (TET2/BGT + APOBEC3A + USER) were normalized to untreated DNA. (B) Correlation between two replicates from sewage samples #1 and #2. Each dot represents a unique k-mer. Scatter plots show normalized k-mer counts in each replicate. Pearson correlation coefficients (r) were calculated for each comparison. (C) Strip plot showing the distribution of enrichment scores for each non-redundant contig larger than 1 kb in sewage #1 (left) sewage #2 (center) and coastal samples (right). Dots represent the enrichment scores of individual non-redundant contigs. Enrichment score ≥ 3 defines modified contigs while enrichment score <3 defines unmodified contigs. (D) Summary tables showing the number of modified and unmodified non-redundant contigs larger than 1 kb in each sample.
Figure 4 with 2 supplements
Metagenomics Genome-Phenome Association (MetaGPA) study at domain level.
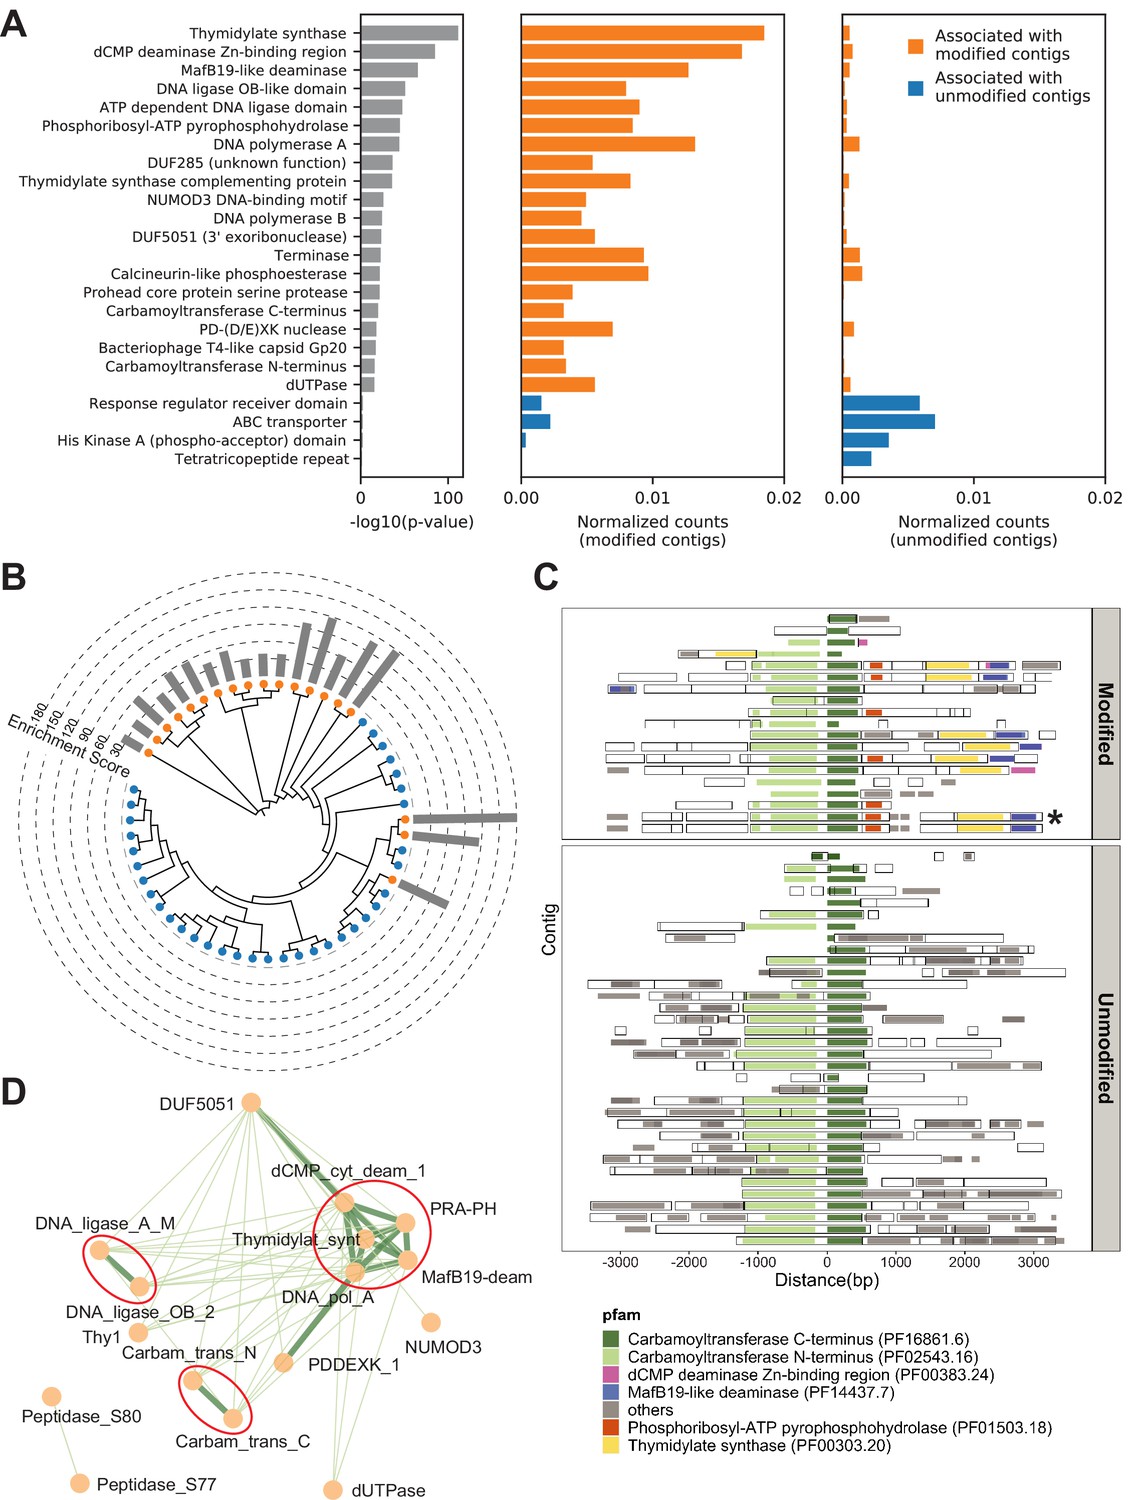
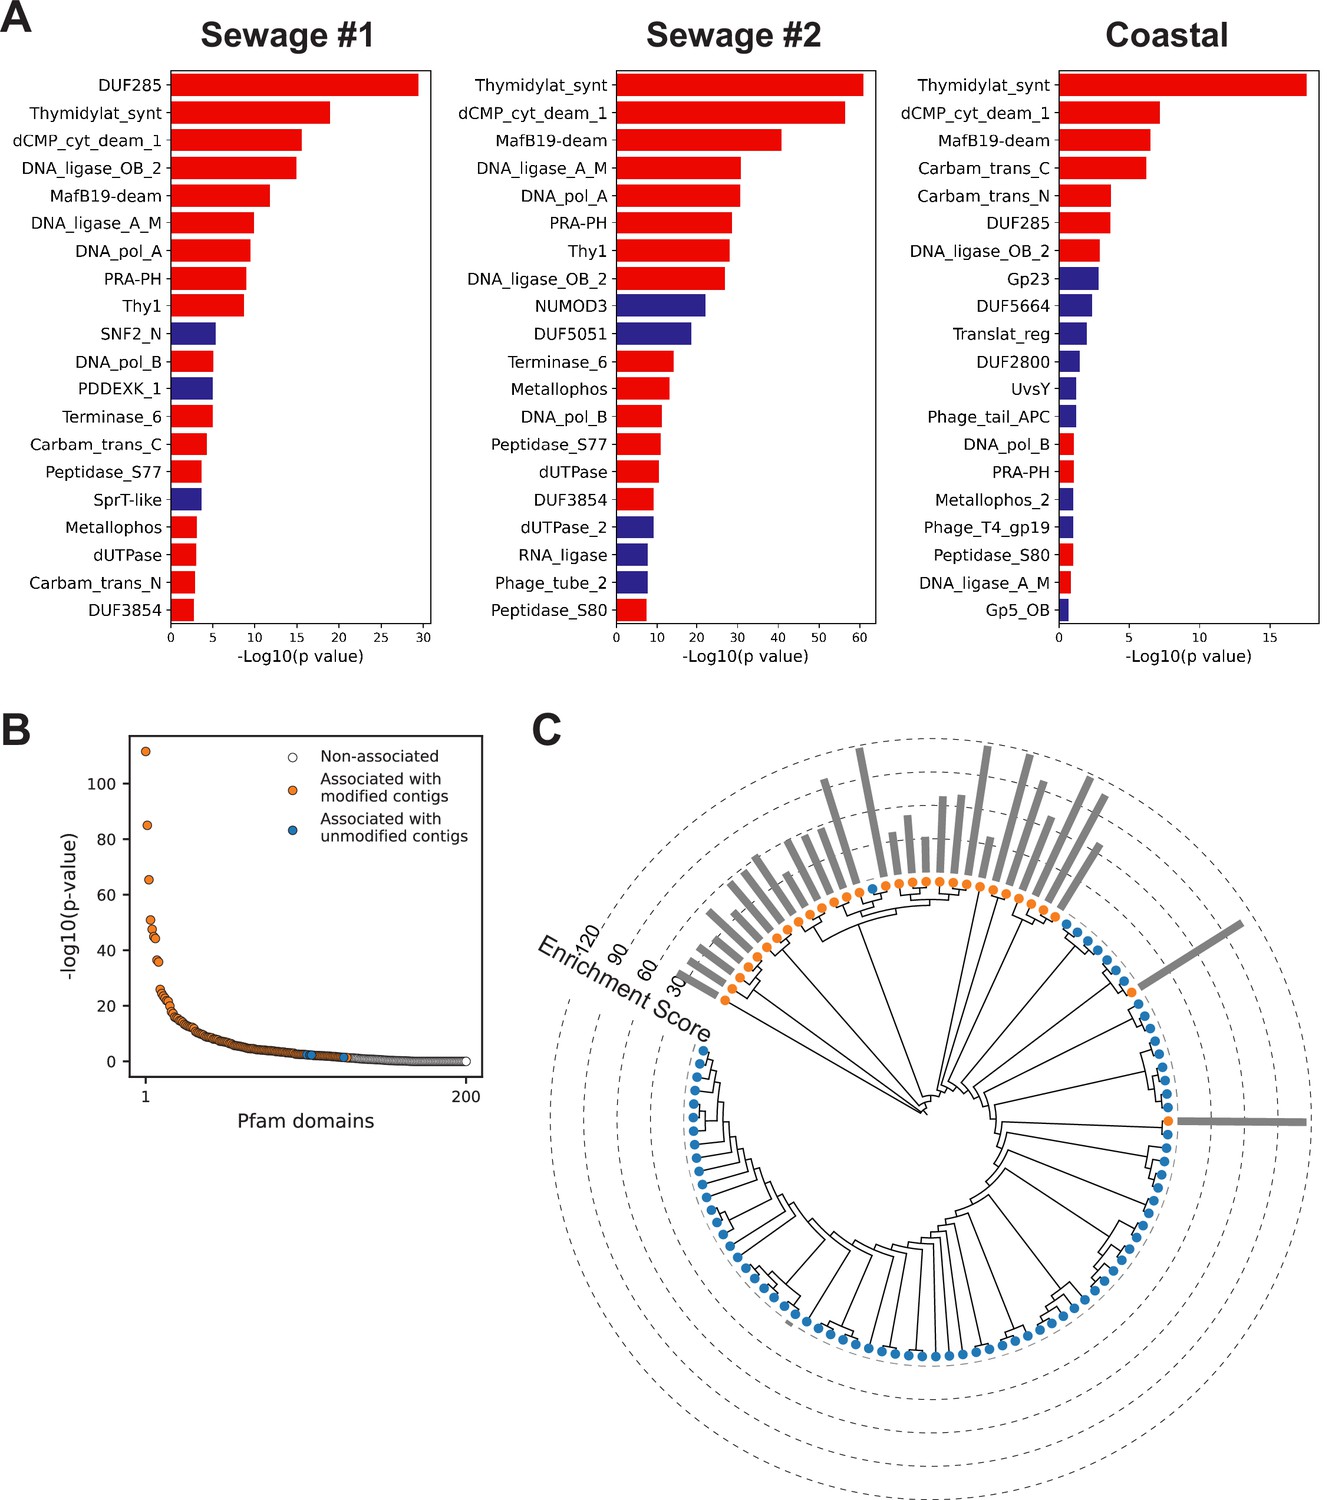
(A) Identification of associated Pfam protein domains. Left, lists of domains ranked by p-values. Middle and right panels represent the normalized counts of each domain for modified or unmodified contigs, respectively. The top 20 domains significantly associated with modified contigs were colored in orange and the four domains significantly associated with unmodified contigs were colored in blue (Bonferroni-corrected p-value < 0.01). Data were normalized to total counts in each category (sums of all domain counts in modified or unmodified contigs), respectively. Domains occurring multiple times on the same contigs were counted only once. (B) Phylogenetic tree of carbamoyltransferase C-terminus domain. Orange and blue dots represent modified and unmodified contigs, respectively. Gray bars in the outer ring represent the enrichment scores of each contig with dashed lines showing the scales. Most of the carbamoyltransferase C-terminus domains from modified contigs form a distinctive phylogenetic branch. (C) Pfam neighborhood association for carbamoyltransferase C-terminus. Carbamoyltransferase C-terminus is centered in the middle and neighboring Pfams spanning 3 kb upstream and downstream are displayed as solid squares. Colored squares mark the top five Pfams co-occurred with carbamoyltransferase C-terminus in modified contigs. Predicted open reading frames (ORFs) on each contig are marked as hollow squares. Asterisk marks the contig containing the enzyme expressed and purified in Figure 6. (D) Correlation networks between the top 20 associated Pfams with modified contigs. Each node represents a Pfam. The thickness and length of edges were based on the p-values between each two nodes with thick and short edges corresponding to more significant relationships (small p-values). Only positive correlations with p-values < 0.05 are shown. The three interaction cores are circled in red.
Figure 4—figure supplement 1
Metagenomics Genome-Phenome Association (MetaGPA) study reveals significantly associated Pfam domain.
(A) Top Pfam domains significantly associated with modified contigs (Bonferroni-corrected p-value < 0.01) in each environment samples (two sewage and one coastal communities). Domains found significantly associated with modified contigs in at least two experiments were marked in red, blue denotes Pfam domains found significantly associated with modified contigs only in a single experiment. (B) p-Value ranking of all Pfam domains in the composite dataset. (C) Phylogenetic tree of carbamoyltransferase N-terminus. Orange and blue dots represent modified and unmodified contigs accordingly. Gray bars in the outer ring represent the enrichment scores of each contig with dashed lines showing the scales. Most of the carbamoyltransferase N-terminus domains from modified contigs form a distinctive phylogenetic branch.
Figure 4—figure supplement 2

Metagenomics Genome-Phenome Association (MetaGPA) study reveals significantly associated Pfam domain.
Genomic contexts of (A) carbamoyltransferase N-terminus, (B) thymidylate synthase, and (C) phosphoribosyl-ATP pyrophosphohydrolase (PRA-PH) reveal commonly co-occurring Pfam domains in modified contigs. Neighboring Pfam domains spanning 3 kb upstream and downstream of the Pfam domain are displayed as solid lines. Top five co-occurring domains in modified contigs are colored and labeled. These co-occurring domains in modified contigs are, for the most part, absent in the unmodified contigs.
Figure 5 with 1 supplement
Key residues in the thymidylate synthase associated with DNA modification.
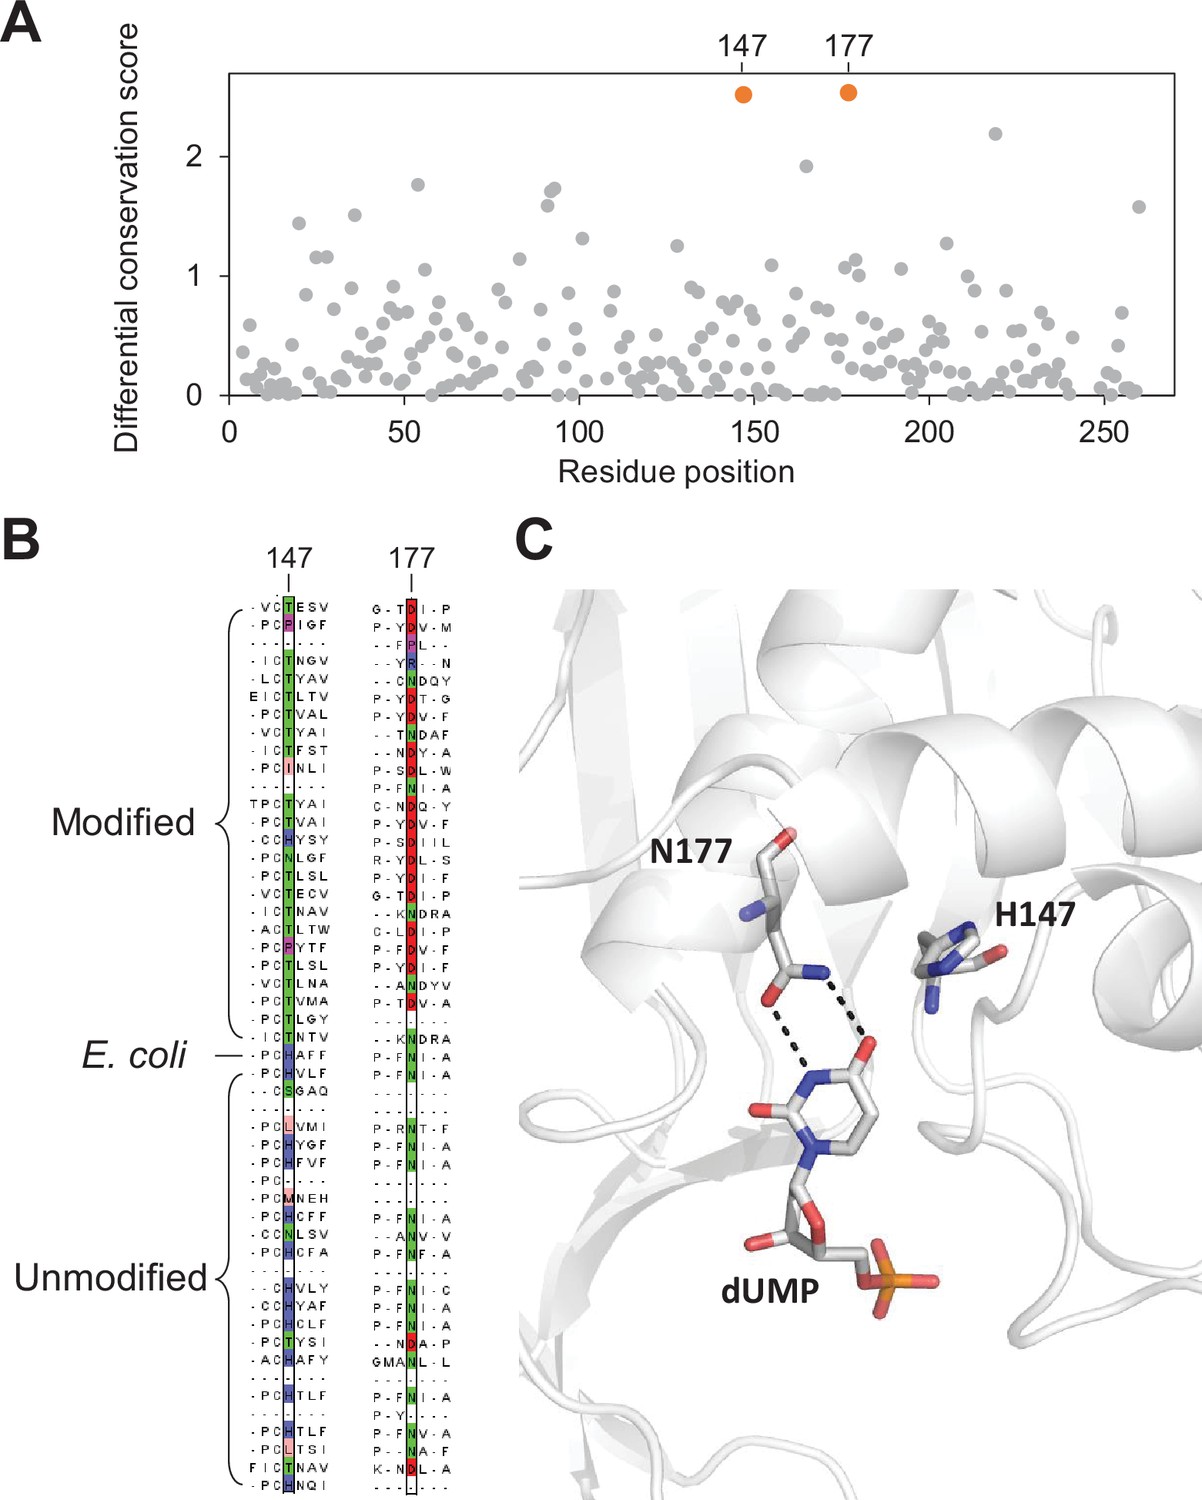
(A) Differential conservation score for each position in the thymidylate synthase alignment. Positions are relative to the Escherichia coli thymidylate synthase. (B) Multiple sequence alignment of 25 and 24 randomly selected thymidylate synthase sequences from the modified and unmodified contigs respectively together with the E. coli thymidylate synthase. Aligned residues at positions 147 and 177 (relative to E. coli thymidylate synthase) are colored according to the physicochemical properties of the amino acids. (C) Structure of the active site of E. coli thymidylate synthase (PDB 1BID) highlighting the H147 and N177 residues and the dUMP substrate.
Figure 5—figure supplement 1
Association between key residues in the carbamoyltransferase C-terminus domains and DNA modification.
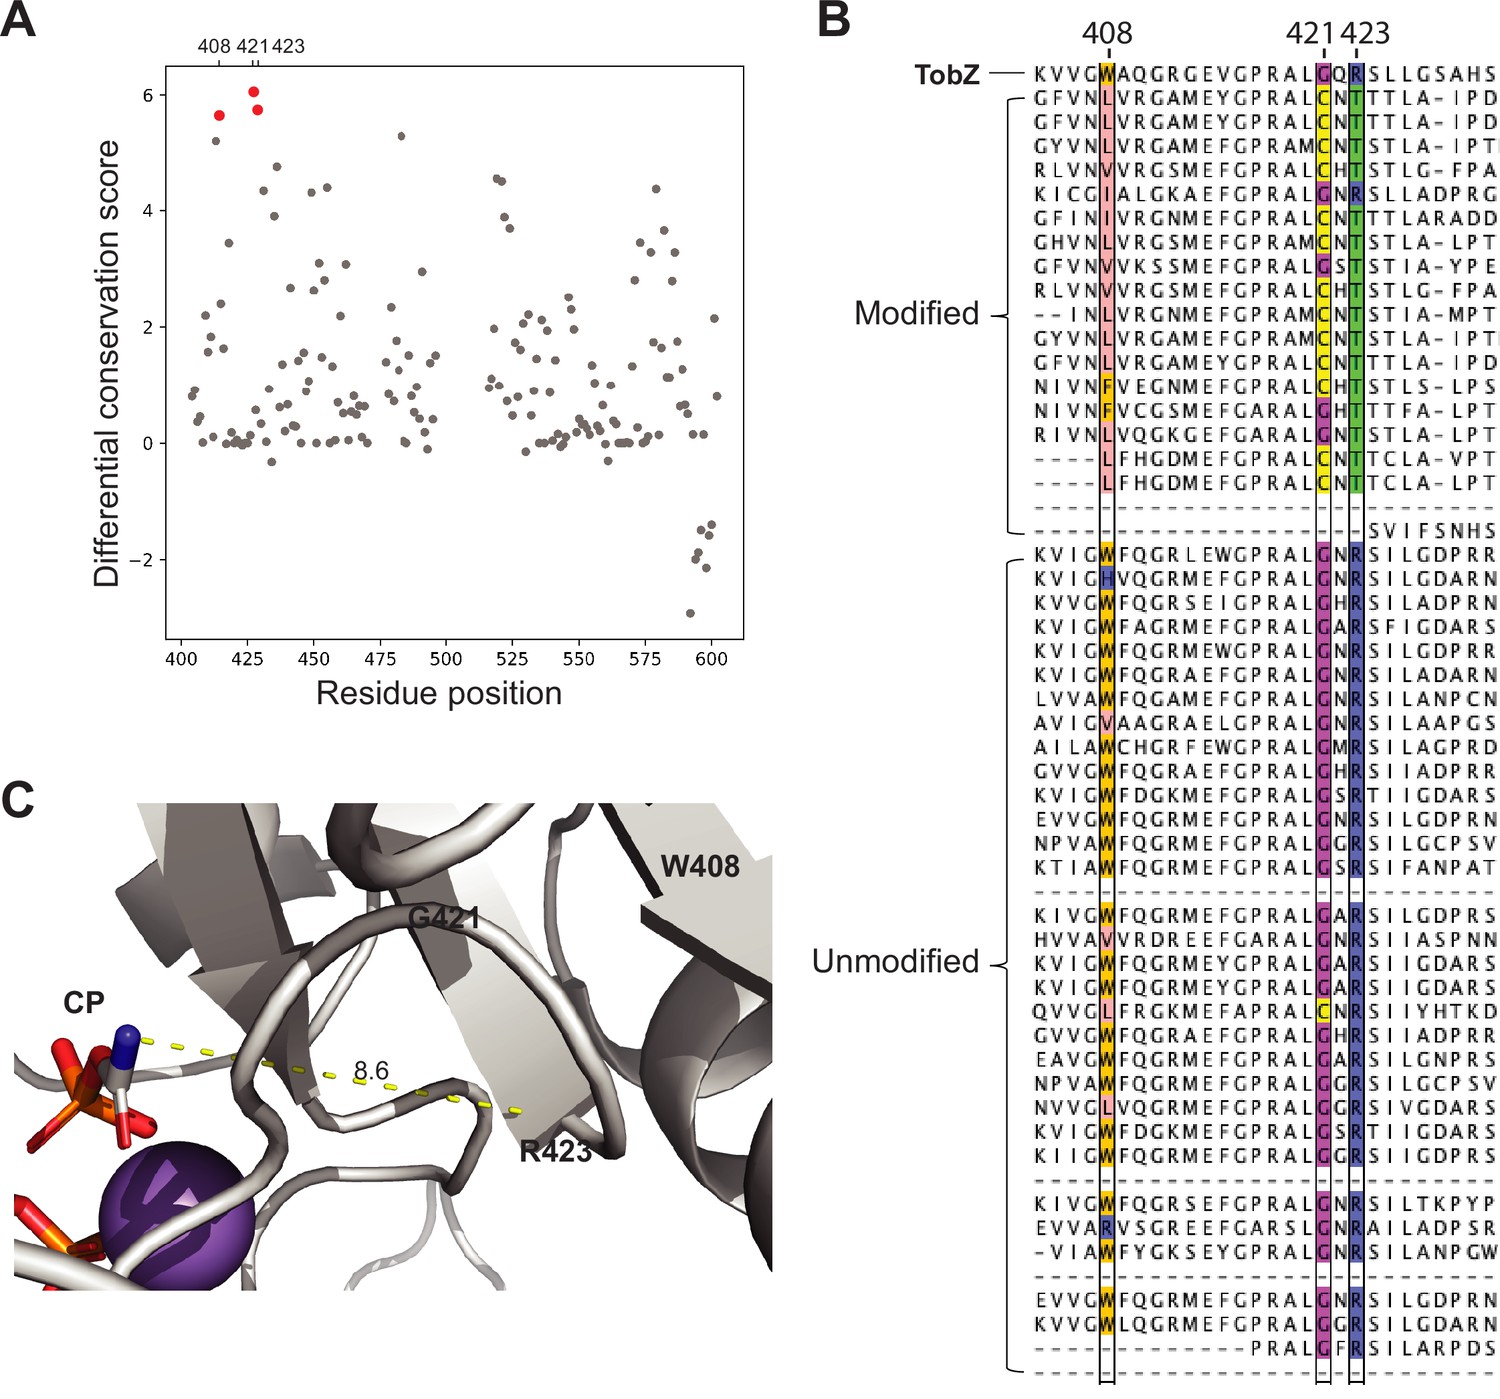
(A) Differential conservation score plotted against residue positions of the O-carbamoyltransferase TobZ. (B) Multiple sequence alignment of 19 and 35 carbamoyltransferases from the modified and unmodified contigs respectively together with Tobz. Only part of the carbamoyltransferase C-terminus domain containing key residues are shown. TobZ residues W408, G421, and R423 have been substituted for the most part with L, C, and T in carbamoyltransferases found in modified contigs. These key residues are colored according to the type of amino acid. (C) Structure of TobZ (PDB 3VET) highlighting M408, G421, and R423. Distance between R423 and carbamoyl phosphate (CP) is indicated in the picture (unit = Å).
Figure 6 with 3 supplements
Validation of the novel 5-hydroxymethylcytosine (5hmC) carbamoyltransferase.
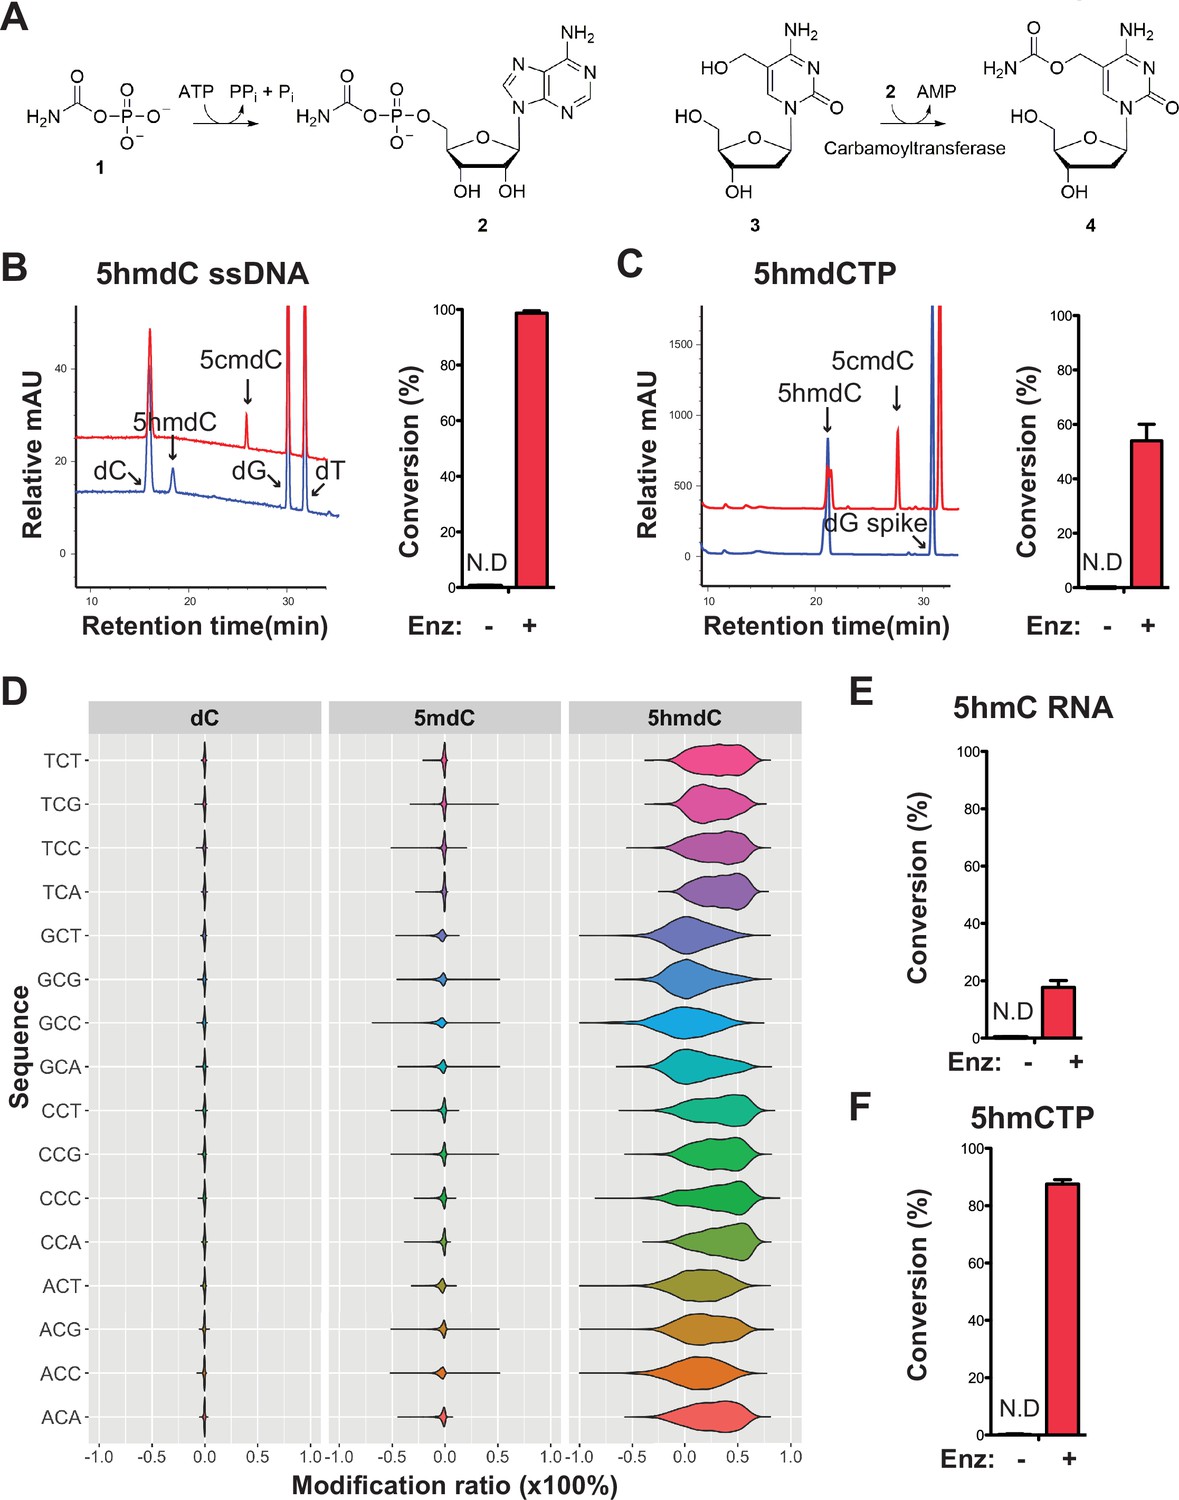
(A) Predicted reactions. 1, carbamoylphosphate; 2, carbamoyladenylate intermediate; 3, 5-hydroxymethylcytidine; 4, 5-carbamoyloxymethylcytidine. (B) Liquid chromatography-mass spectrometry (LC-MS) trace and quantification for enzymatic reaction with a single-stranded DNA oligo containing an internal 5-hydroxymethyl-2'-deoxycytidine (5hmdC). Bar graph represents average conversion rates ± SEM from three independent experiments using three different DNA oligos. ND, not detected. (C) LC-MS trace and quantification for enzymatic reaction with 5-hydroxymethyl-2’-deoxycytidine triphosphate (5hmdCTP) . Bar graph shows average conversion rates ± SEM from three independent experiments. (D) Enzyme preference on NCN sequences. Genomic DNA from lambda (dC), XP12 (5mdC), and T4gt (5hmdC) were mixed at 1:1:1 ratio by molarity before being subjected to enzymatic selection. Modified ratio of each C in NCN motifs (with N being A, T, C, or G) was normalized to the no-enzyme control. (E) LC-MS quantification for enzymatic reaction with a single-stranded RNA oligo containing an internal 5hmC. Bar graph shows average conversion rates ± SEM from three independent experiments. (F) Quantification for enzymatic reaction with 5-hydroxymethylcytidine triphosphate (5hmCTP). Bar graph shows average conversion rates ± SEM from three independent experiments. Oligonucleotides and nucleoside triphosphate were converted to nucleosides before LC-MS analysis. A dG spike was added as internal reference for quantification of nucleoside triphosphates.
Figure 6—figure supplement 1

Validation of the novel 5-hydroxymethylcytosine carbamoyltransferase.
(A) Native gene content of the cloned carbamoyltransferase locus. (B) SDS-PAGE gel showing purification of the carbamoyltransferase after two column purifications. Left, after HisTrap column purification; right, after HisTrap and Q column purification. (C) Characterization of enzymatic reaction by liquid chromatography-mass spectrometry (LC-MS). The arrow indicates the product peak 5-carbamoyloxymethylcytosine (5cmdC). (D) Quantification of enzymatic reactions from (C). T4gt genomic DNA was used as a source of 5-hydroxymethyl-2'-deoxycytidine (5hmdC) DNA. Bar graph represents average conversion rates ± SEM from three independent experiments (ND, not detected).
Figure 6—figure supplement 2
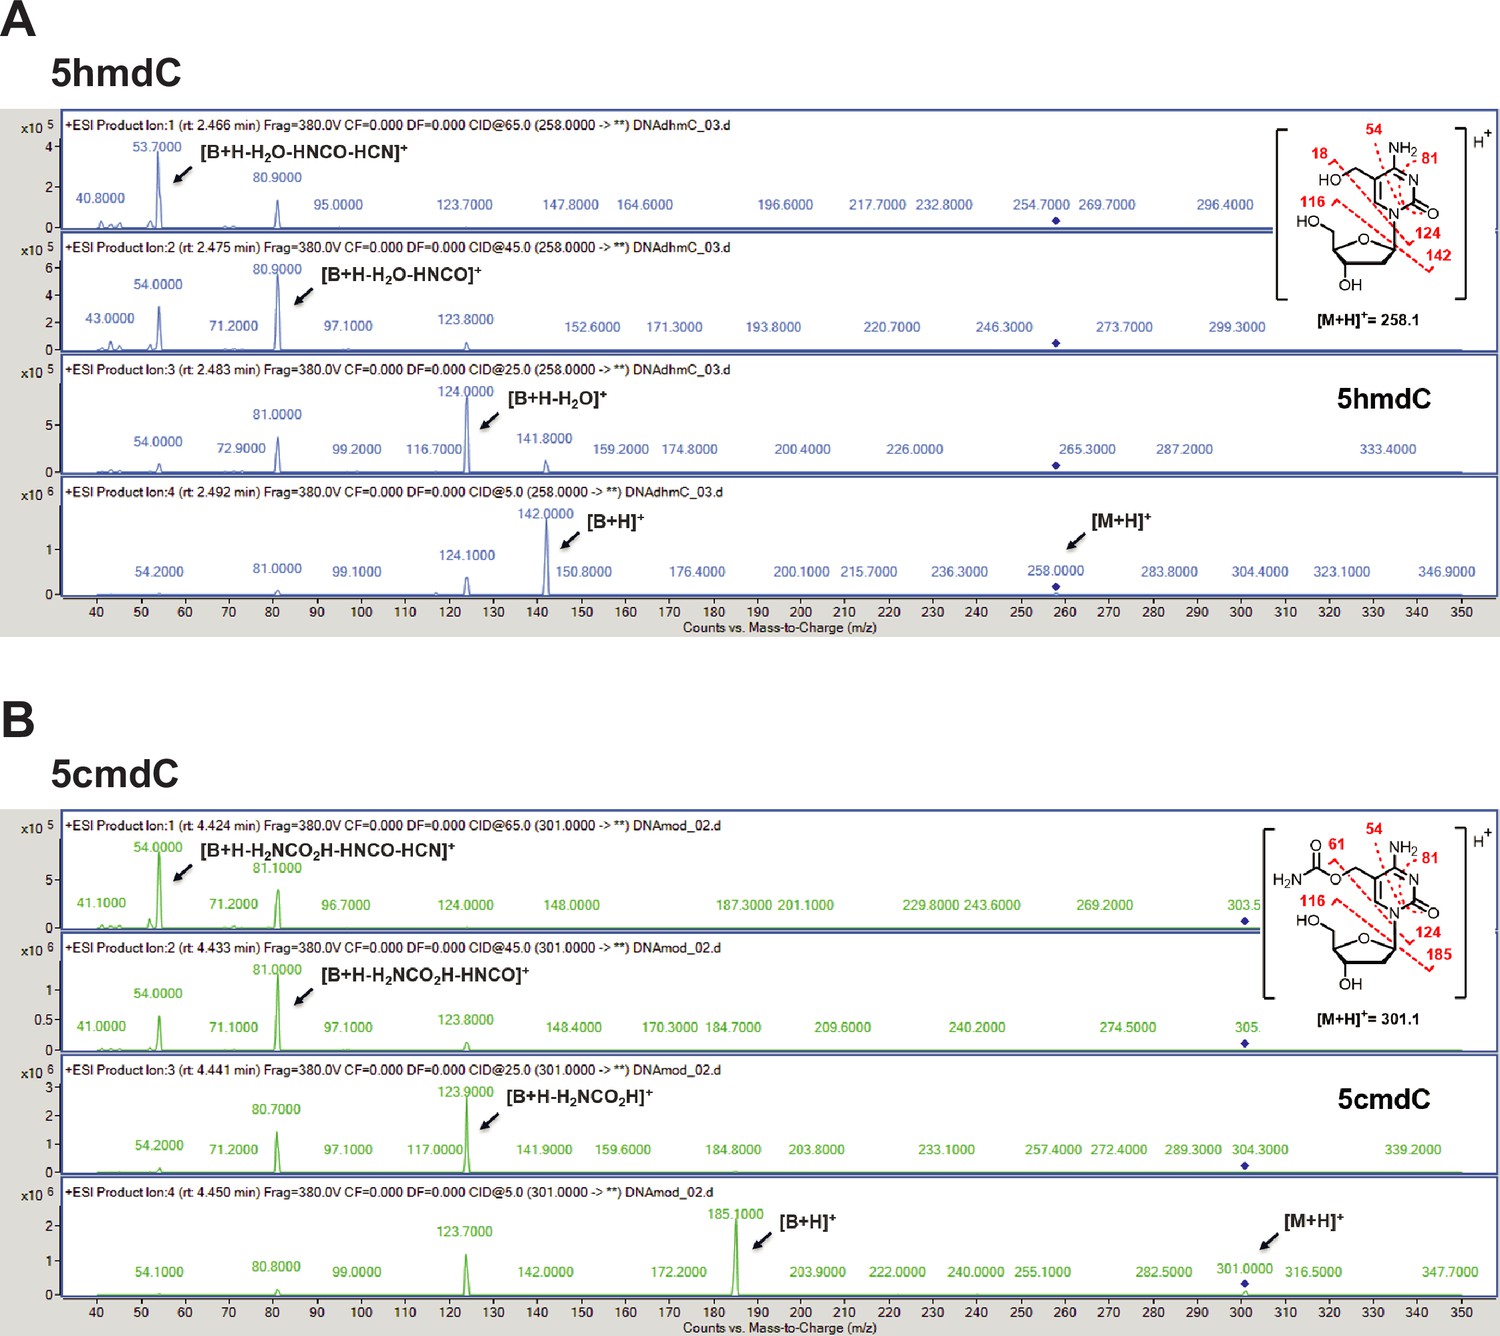
Validation of the novel 5-hydroxymethylcytosine carbamoyltransferase.
(A) +ESI MS/MS fragmentation spectra of 5-hydroxymethyl-2'-deoxycytidine (5hmdC). (B) +ESI MS/MS fragmentation spectra of 5-carbamoyloxymethylcytosine (5cmdC).
Figure 6—figure supplement 3
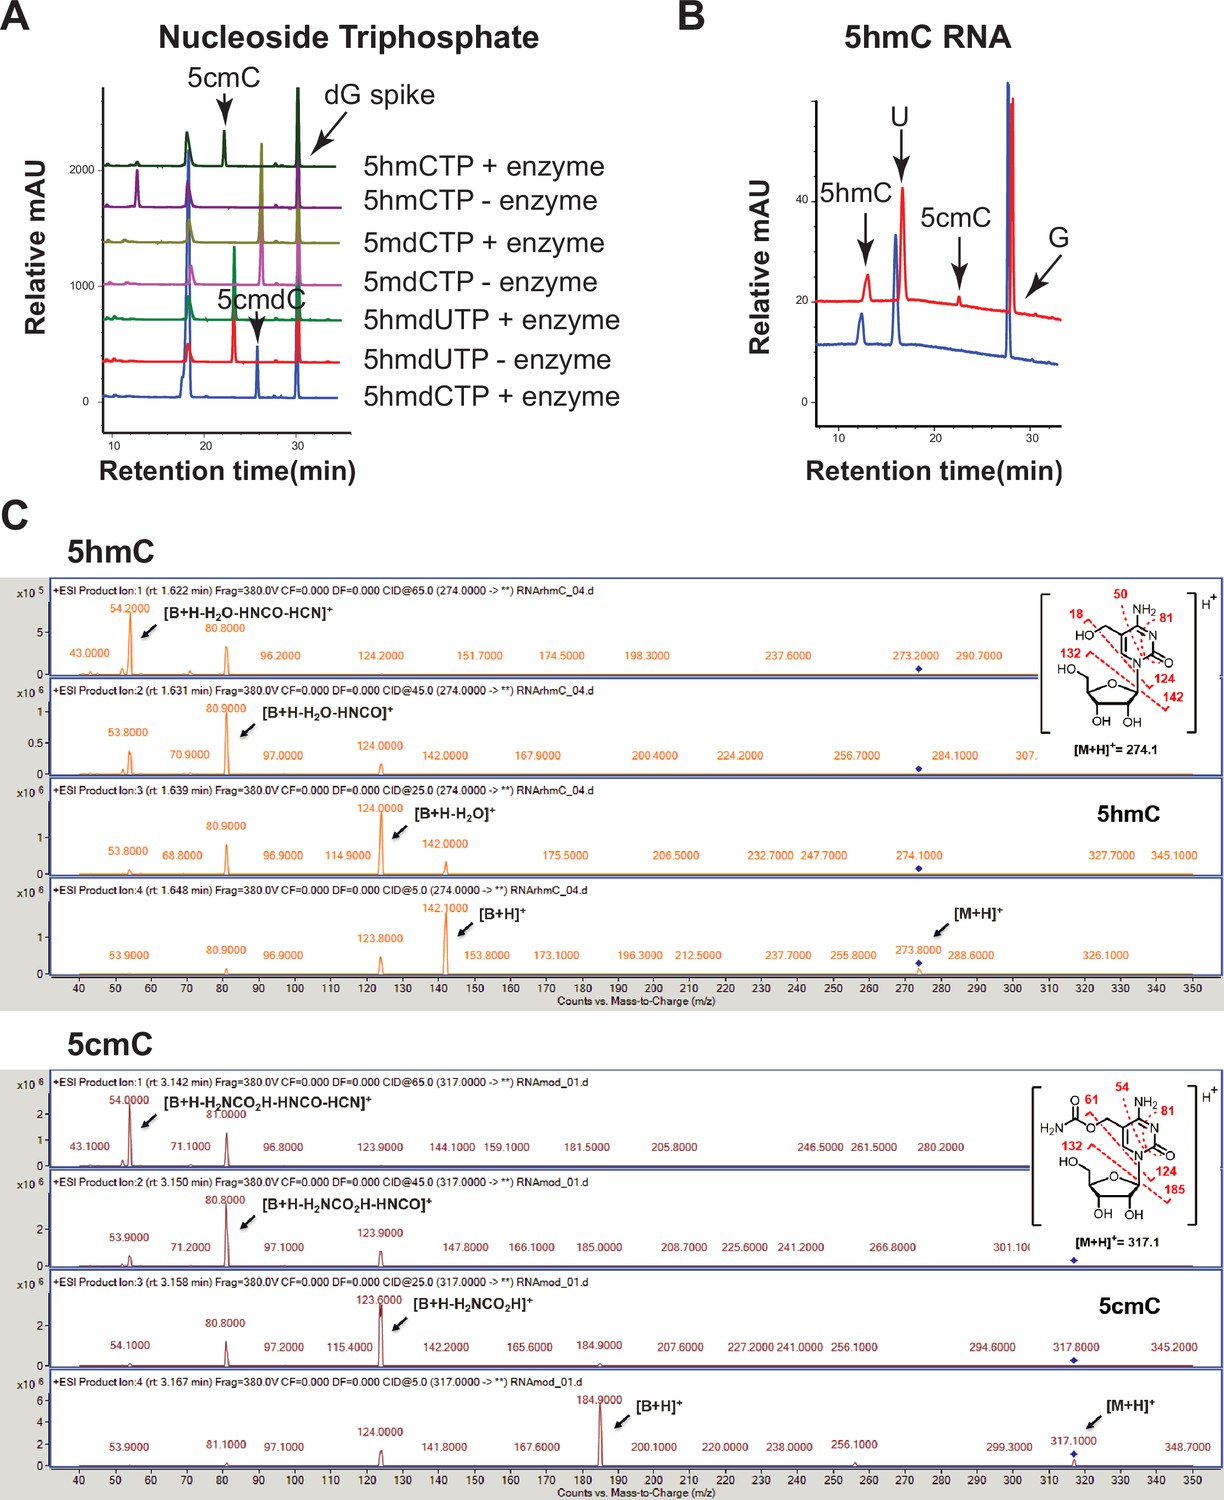
Validation of the novel 5-hydroxymethylcytosine carbamoyltransferase.
(A) Substrate selectivity. Enzymatic assays were performed with the following nucleoside triphosphates: 5-hydroxymethyl-2’-deoxycytidine triphosphate (5hmdCTP), 5-hydroxymethyl-2’-deoxyuridine triphosphate (5hmdUTP), 5-methyl-2’-deoxycytidine triphosphate (5mdCTP), and 5-hydroxymethylcytidine triphosphate (5hmCTP). Carbamoylation was observed with 5hmdCTP and 5hmCTP (arrows). (B) Liquid chromatography-mass spectrometry (LC-MS) trace for enzymatic reaction with a single-stranded RNA containing an internal 5hmC. (C) +ESI MS/MS fragmentation spectra of 5hmC (top panel) and 5cmC (bottom panel). Oligonucleotides and nucleoside triphosphate were converted to nucleosides before LC-MS analysis. A dG spike was added as internal reference for quantification of nucleoside triphosphates.
Additional files
-
Supplementary file 1
Amounts of DNA used for enzymatic selection sensitivity test.
- https://cdn.elifesciences.org/articles/70021/elife-70021-supp1-v2.xlsx
-
Supplementary file 2
Pfam associations with DNA modification.
- https://cdn.elifesciences.org/articles/70021/elife-70021-supp2-v2.xlsx
-
Transparent reporting form
- https://cdn.elifesciences.org/articles/70021/elife-70021-transrepform1-v2.pdf
-
Source data 1
Supplemental source data.
- https://cdn.elifesciences.org/articles/70021/elife-70021-supp3-v2.zip
Download links
A two-part list of links to download the article, or parts of the article, in various formats.
Downloads (link to download the article as PDF)
Open citations (links to open the citations from this article in various online reference manager services)
Cite this article (links to download the citations from this article in formats compatible with various reference manager tools)
A genome-phenome association study in native microbiomes identifies a mechanism for cytosine modification in DNA and RNA
eLife 10:e70021.
https://doi.org/10.7554/eLife.70021


