Reversal of the adipostat control of torpor during migration in hummingbirds
- Department of Biological Sciences, University of Toronto Scarborough, Canada
- Department of Ecological and Evolutionary Biology, University of Toronto, Canada
- Department of Biology, Advanced Facility for Avian Research, University of Western, Canada
Figures
Figure 1
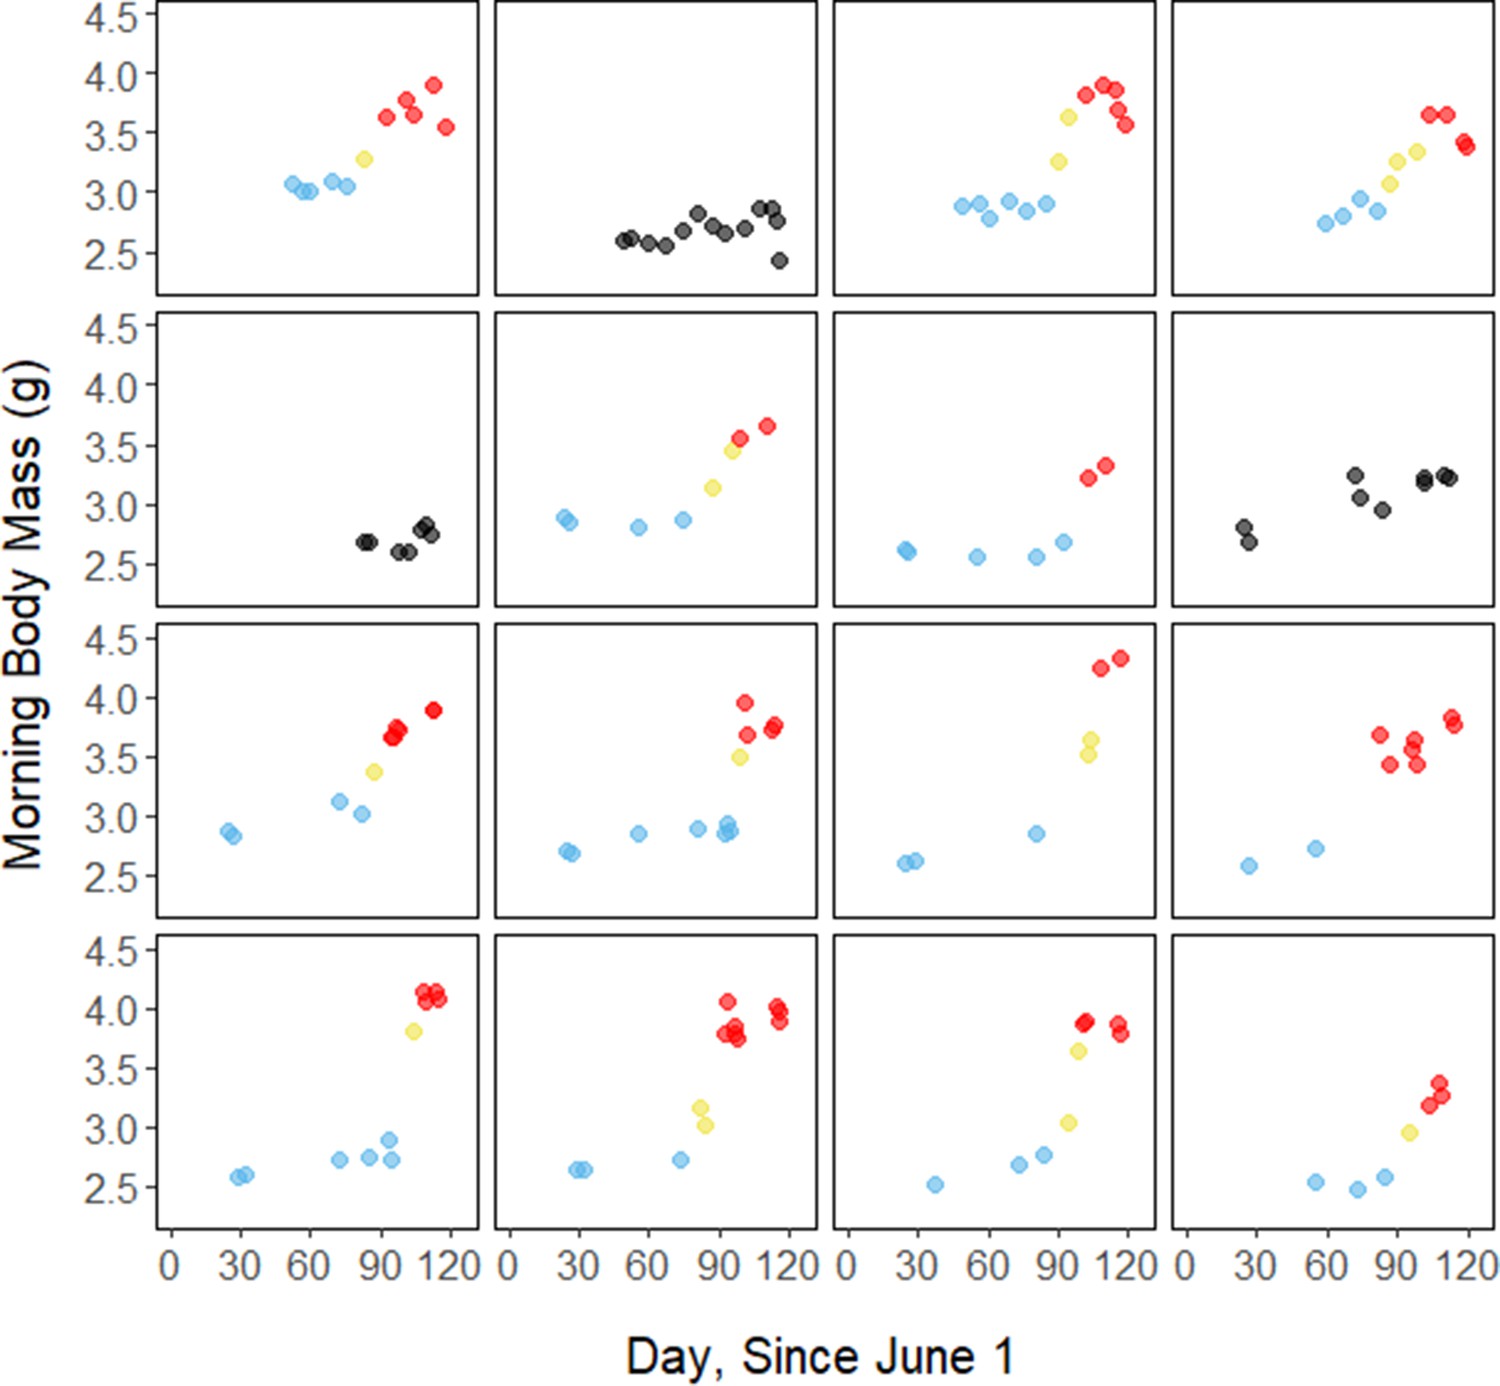
Morning body masses following focal observation nights for each individual bird throughout the study period, with points colored by period.
Figure 2
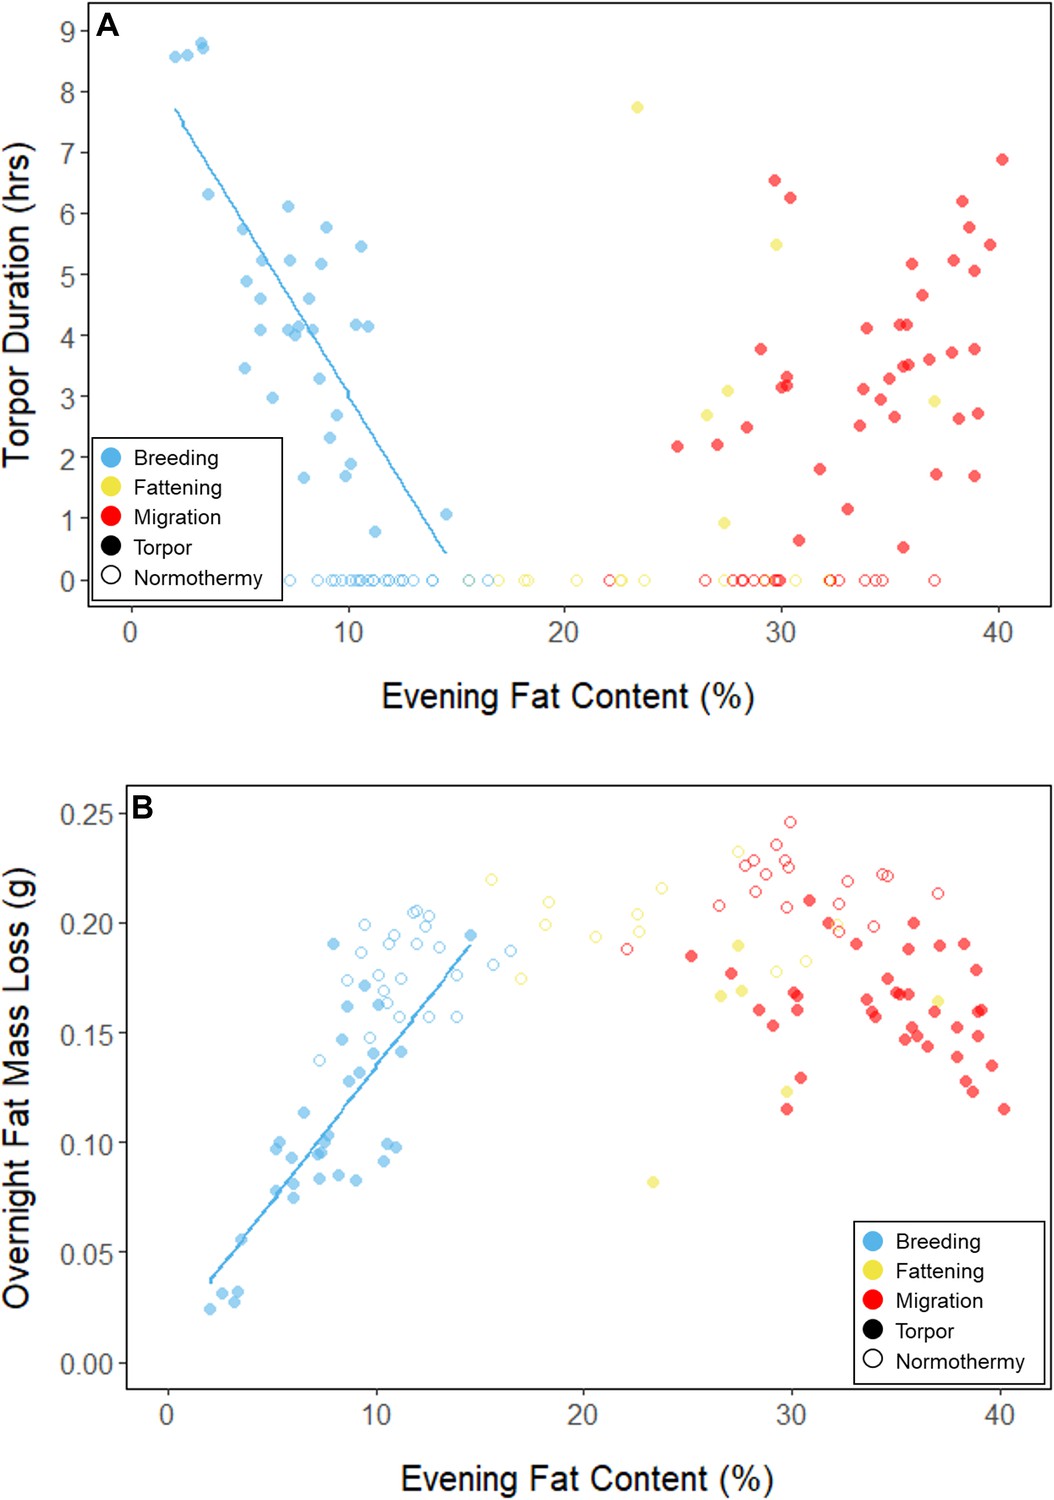
Relationships between evening fat content and (A) torpor duration, and (B) overnight fat mass loss, within each period, with points and significant trendlines colored by period and shaped by torpor use.
Figure 3
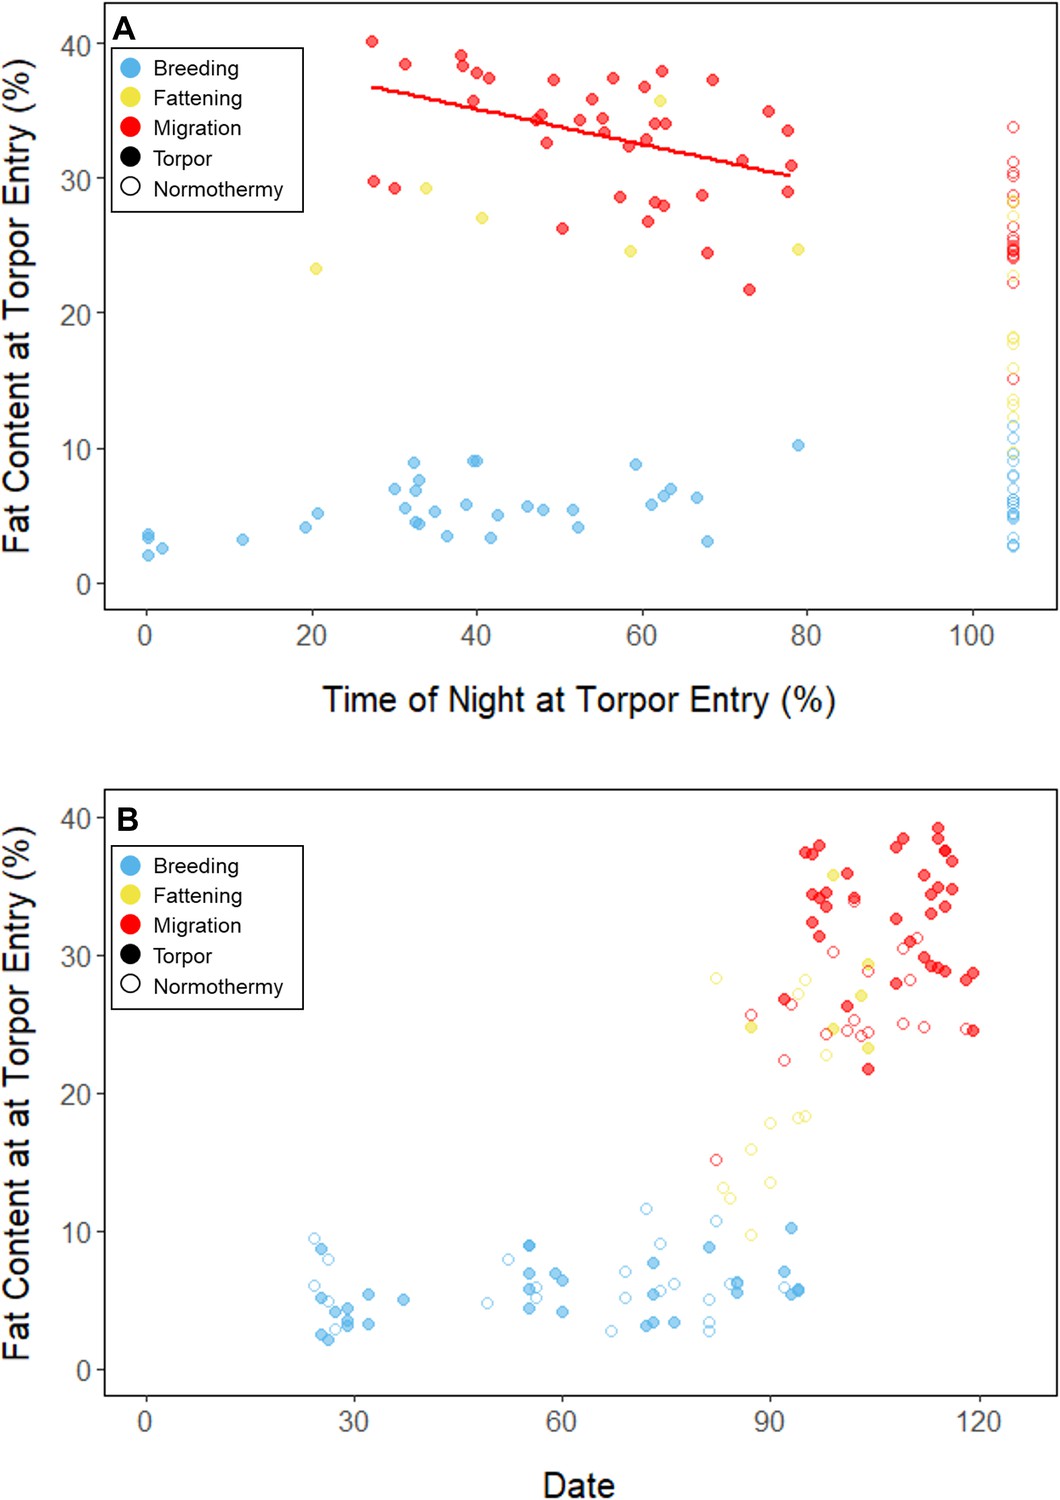
Relationship between fat content at the time of torpor entry (%) and (A) the time of torpor entry (as % of night), and (B) date, with points and significant trendlines colored by period and shaped by torpor use.
Figure 4
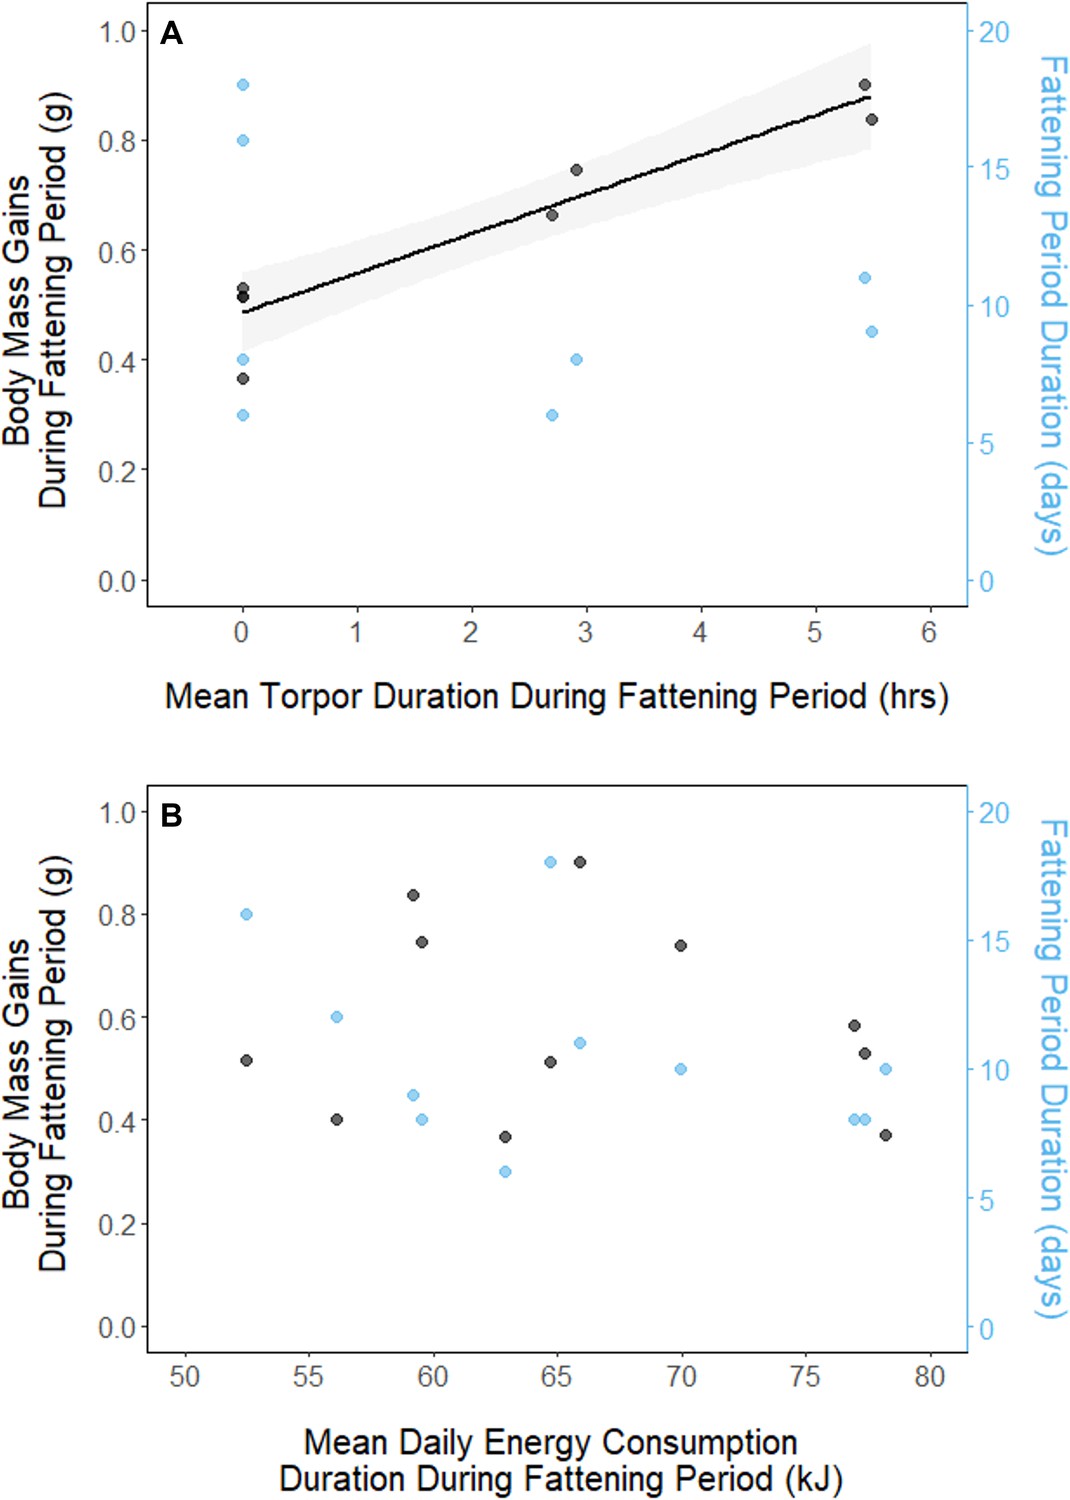
Relationships between magnitude of increases in body mass (black, left axis) and fattening period duration (blue, right axis), and (A) mean torpor duration, and (B) mean daily energy consumption, within the fattening period.
Trendlines are shown for significant slopes and the shaded area represents 95% confidence intervals.
Appendix 1—figure 1
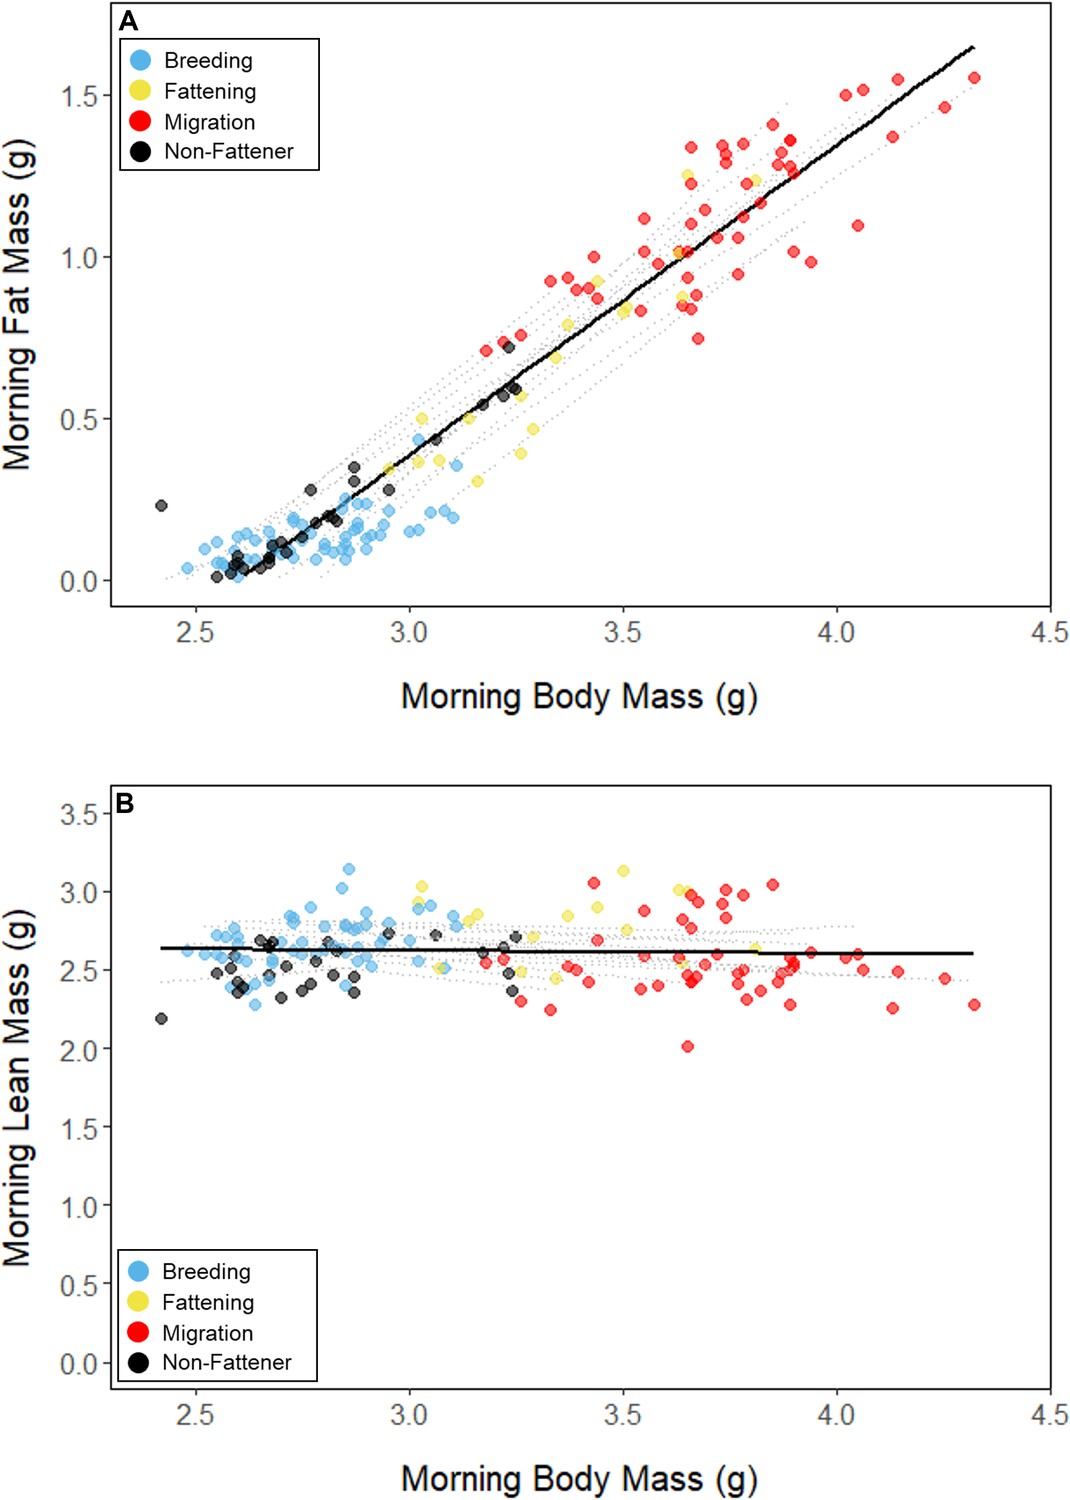
Relationships between body mass and (A) fat mass, and (B) lean mass, with points colored by period.
Black lines represent the overall linear relationship during the entire study period and dashed lines represent bird-specific regressions.
Appendix 1—figure 2
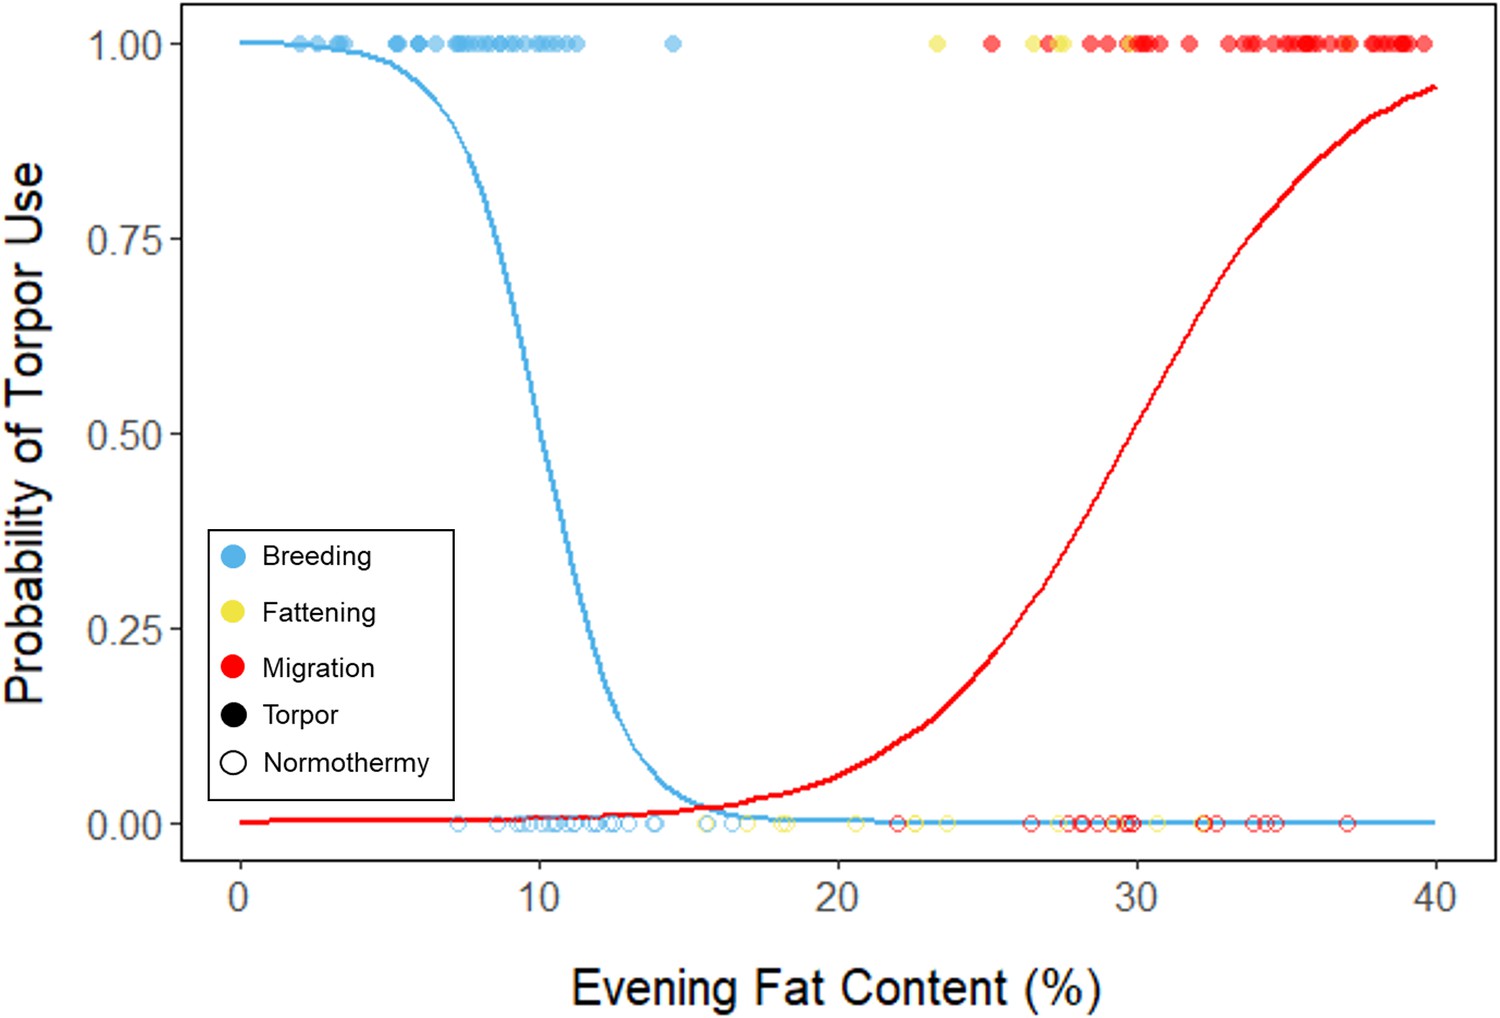
Logistic regression of torpor use as a function of evening fat content, with points and significant trendlines colored by period and shaped by torpor use.
Lines are predicted logistic curves estimating the probability of torpor use with respect to evening fat mass.
Appendix 1—figure 3
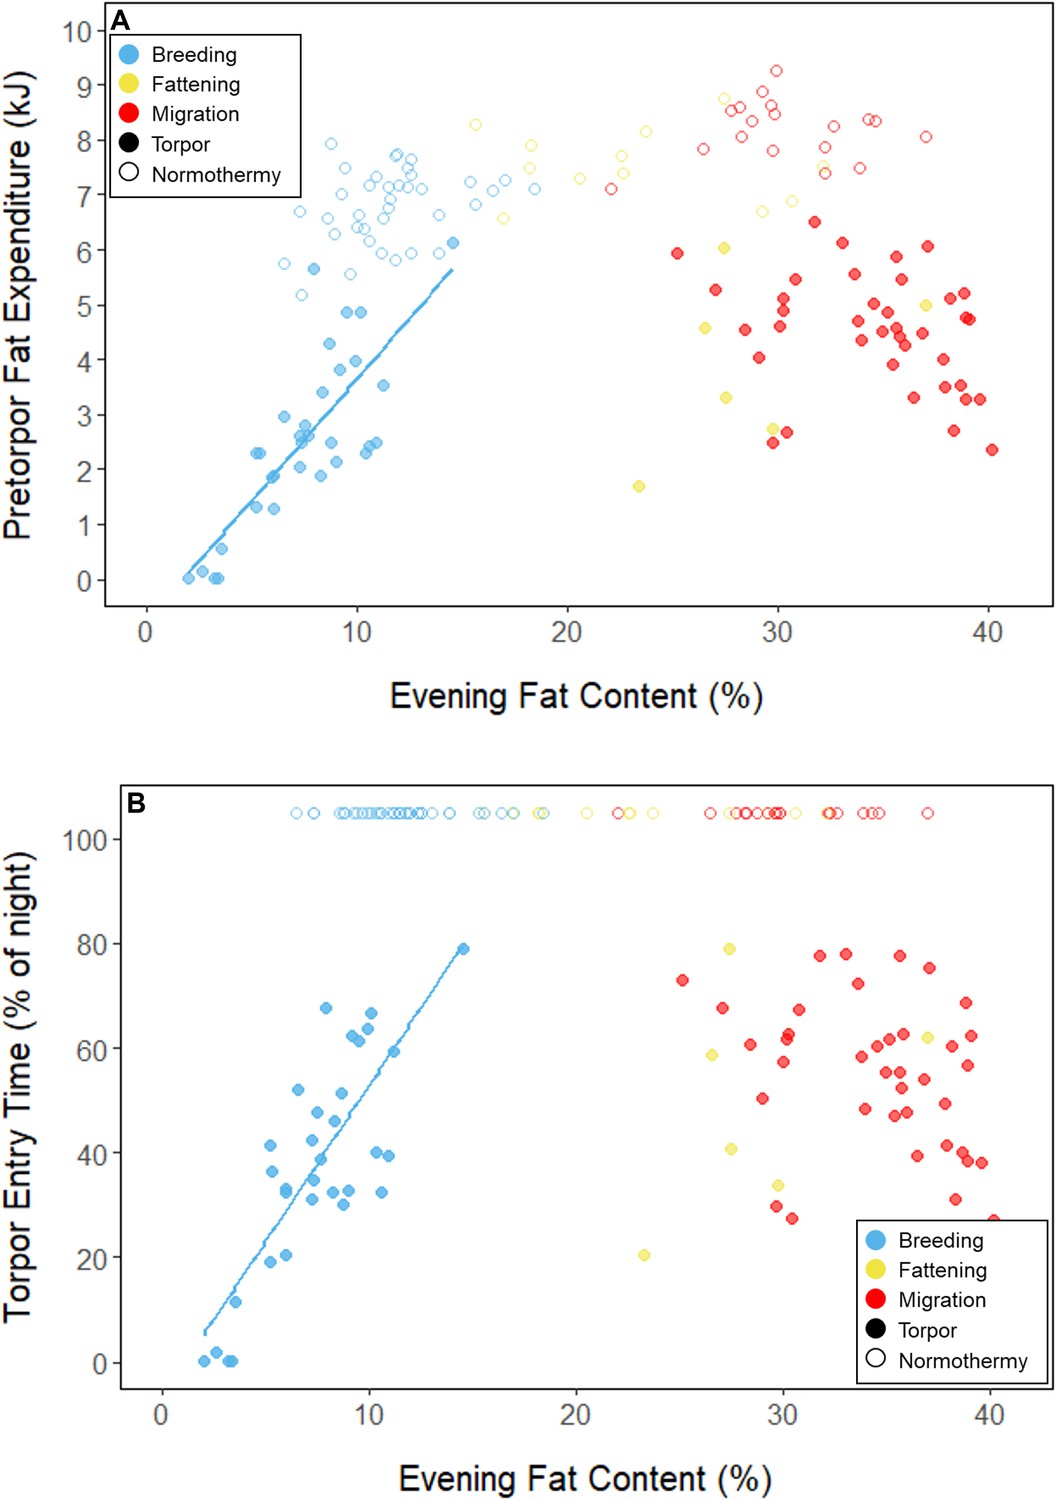
Relationships between evening fat content and (A) energy expenditure before torpor entry, and (B) time of torpor entry, within each period, with points and significant trendlines colored by period and shaped by torpor use.
Appendix 1—figure 4
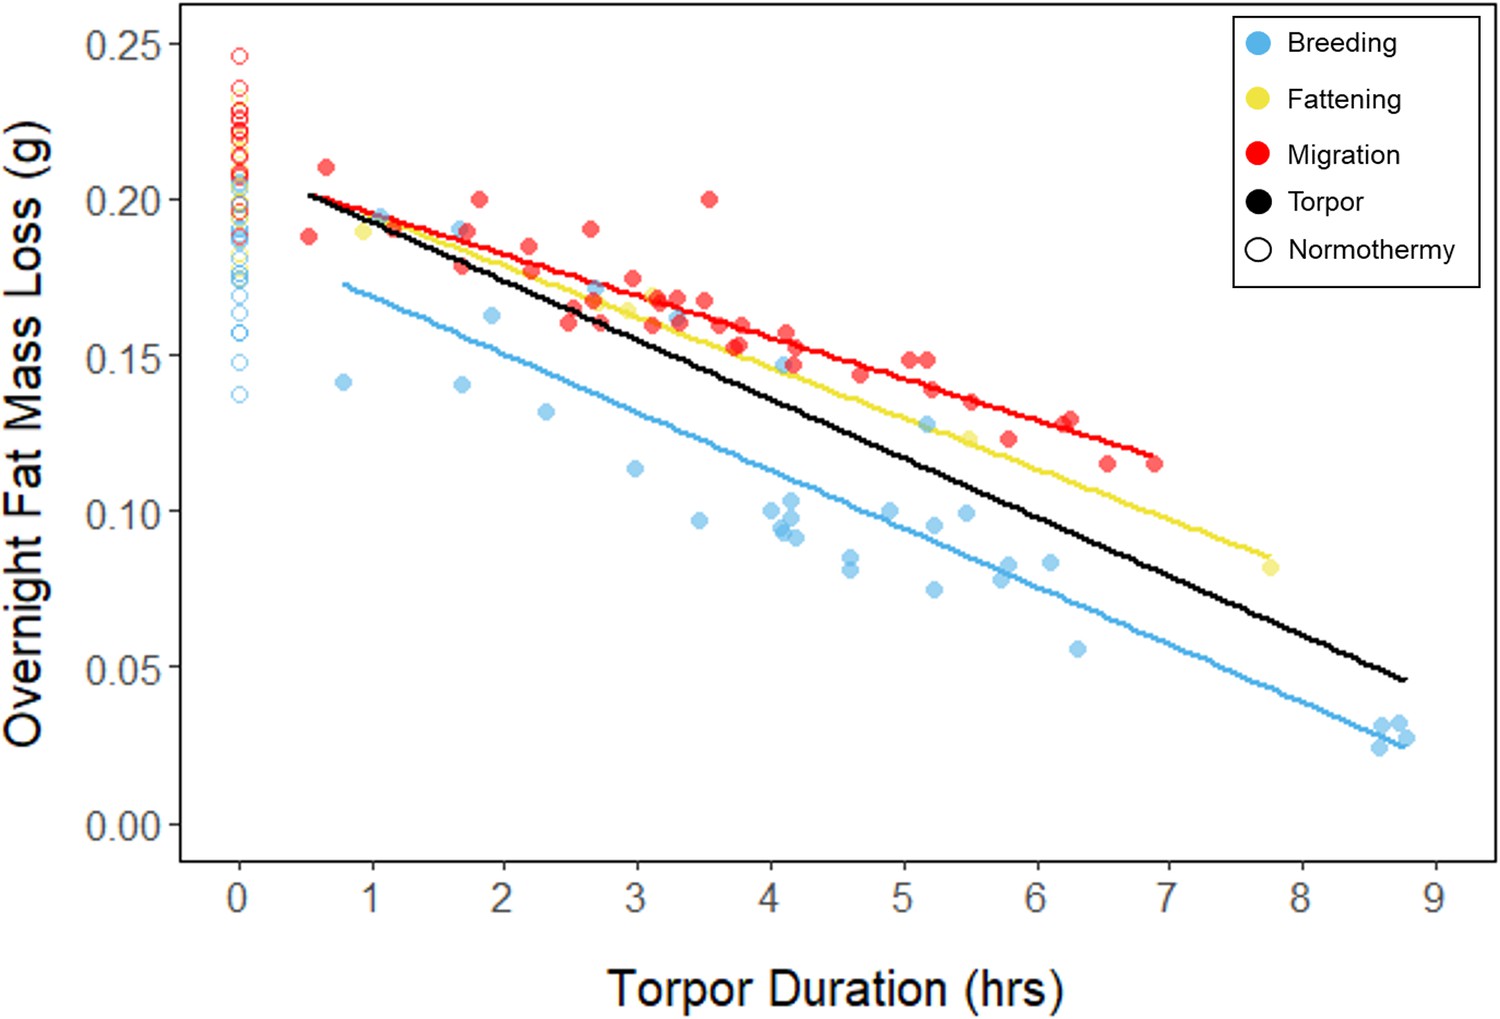
Relationships between torpor duration and overnight fat mass loss, within each period, with points and significant trendlines colored by period and shaped by torpor use.
Black line indicates overall linear relationship irrespective of period.
Appendix 1—figure 5

Body mass (A), fat content (B), lean mass (C), on the mornings following focal observation nights, and daily energy consumption throughout the study period (D), with points and significant trendlines colored by period.
Appendix 1—figure 6
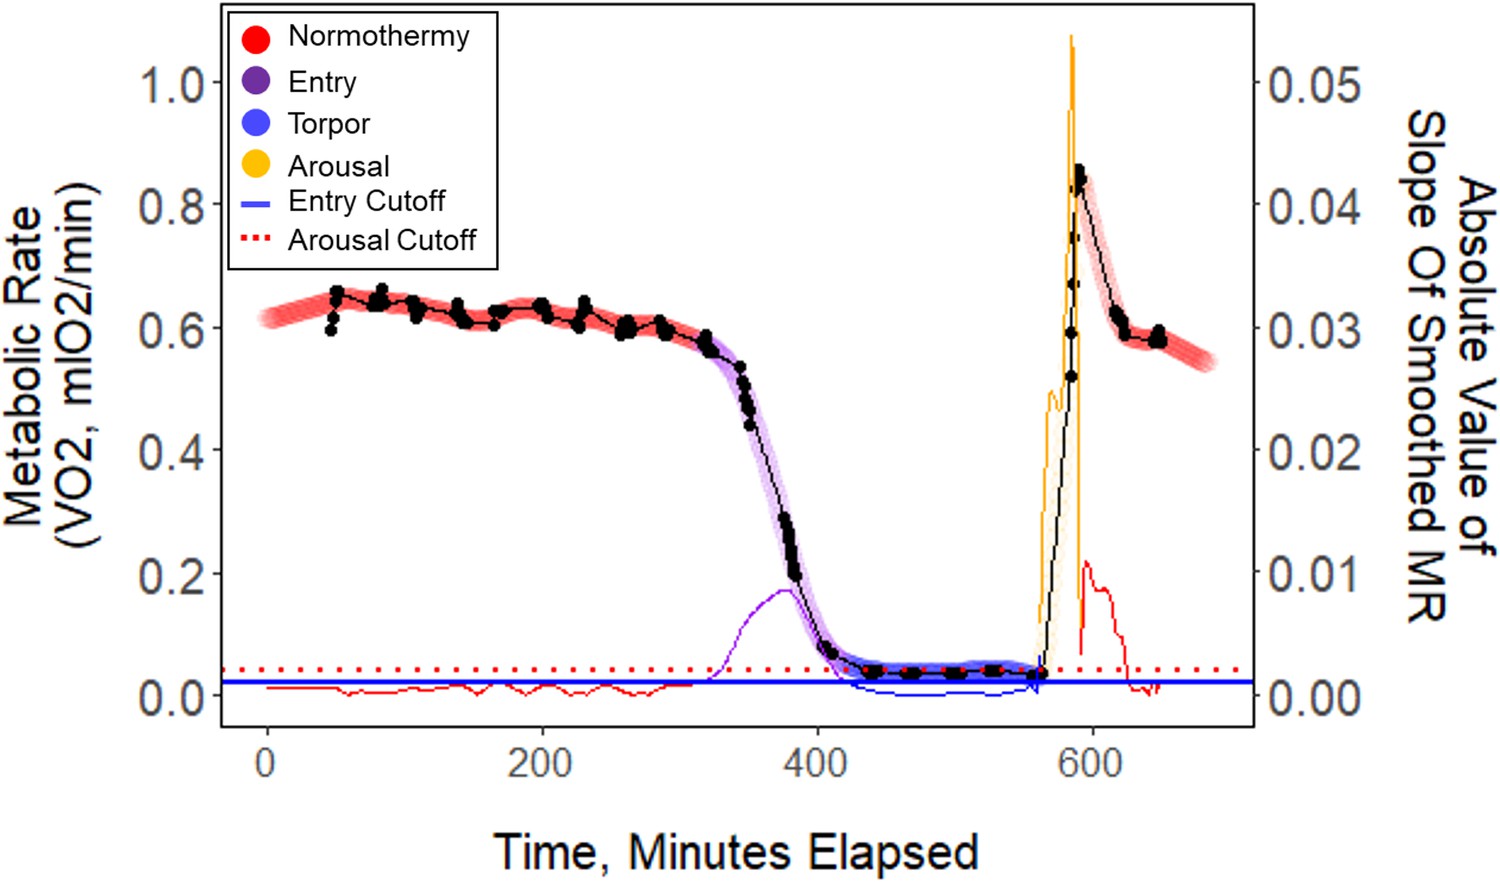
Raw data (black points) plotted every minute throughout one exemplar night of torpor (B13_9.2.19).
These data points were smoothed (thick colored line), and the slope of these points (thin colored line) was used to determine metabolic state. Horizontal lines represent entry (blue) and arousal (red) cut-off slopes which were used to distinguish metabolic states of each minute.
Tables
Table 1
Key seasonal differences in morning body mass, fat content at torpor entry, and torpor use with respect to evening fat content and night length.
Signs in parentheses denote the direction of the effect, or where there was no significant relationship this is denoted as ‘neither’.
| Breeding | Migration | |
|---|---|---|
| Morning body mass | Low(2.77 ± 0.05 g) | High(3.73 ± 0.05 g) |
| Fat content at torpor entry | Low, consistent (5.56% ± 0.79%) | High, variable (32.94% ± 0.77%) |
| Torpor propensity | Evening fat content (-) | Evening fat content (+) and night length (+) |
| Torpor entry time | Evening fat content (+) | Neither |
| Torpor duration | Evening fat content (-) | Night length (+) |
| Pre-torpor energy expenditure | Evening fat content (+) and night length (+) | Neither |
| Overnight fat mass loss | Evening fat content (+) and night length (+) | Night length (+) |
Additional files
-
Transparent reporting form
- https://cdn.elifesciences.org/articles/70062/elife-70062-transrepform1-v3.docx
-
Supplementary file 1
Supplementary results tables.
(A) Estimated marginal means and slopes of body composition and food consumption variables, descriptions of the statistical models, and statistical comparisons within and among periods. (B) Absolute and relative increases in body mass, fat mass, and fat content during the fattening period. (C) Correlations between body mass gains and duration of the fattening period, with mean torpor duration in the fattening period and food consumption in the fattening period. (D) Estimated marginal means and slopes of torpor use variables, descriptions of the statistical models, and statistical comparisons within and among periods.
- https://cdn.elifesciences.org/articles/70062/elife-70062-supp1-v3.docx
-
Supplementary file 2
Instantaneous percent fat content over time (as % of night) throughout each summer, fattening, and migration period, as well as during the whole study period for non-fatteners.
Red lines represent normothermic nights and blue lines represent torpid nights. The average breeding threshold ±1 standard error is indicated by horizontal dashed black and greay lines, respectively.
- https://cdn.elifesciences.org/articles/70062/elife-70062-supp2-v3.pdf
-
Supplementary file 3
Morning body mass (black points) following focal nights across the entire study period, starting at the date of capture.
These data points were smoothed (greay line), and the slope of these points was used to define breeding, fattening, and migration periods for each bird, which are shaded blue, yellow, and red, respectively. Non-fatteners are also included and shaded dark red. The first panel shows night length throughout the study period.
- https://cdn.elifesciences.org/articles/70062/elife-70062-supp3-v3.pdf
Download links
A two-part list of links to download the article, or parts of the article, in various formats.
Downloads (link to download the article as PDF)
Open citations (links to open the citations from this article in various online reference manager services)
Cite this article (links to download the citations from this article in formats compatible with various reference manager tools)
Reversal of the adipostat control of torpor during migration in hummingbirds
eLife 10:e70062.
https://doi.org/10.7554/eLife.70062


