Allosteric ligands control the activation of a class C GPCR heterodimer by acting at the transmembrane interface
- Cellular Signaling Laboratory, International Research Center for Sensory Biology and Technology of MOST, Key Laboratory of Molecular Biophysics of MOE, and College of Life Science and Technology, Huazhong University of Science and Technology, China
- Institut de Génomique Fonctionnelle, Université de Montpellier, CNRS, INSERM, France
- MCS, Laboratory of Medicinal Chemistry, Institute for Advanced Chemistry of Catalonia (IQAC-CSIC), Spain
Figures
Figure 1
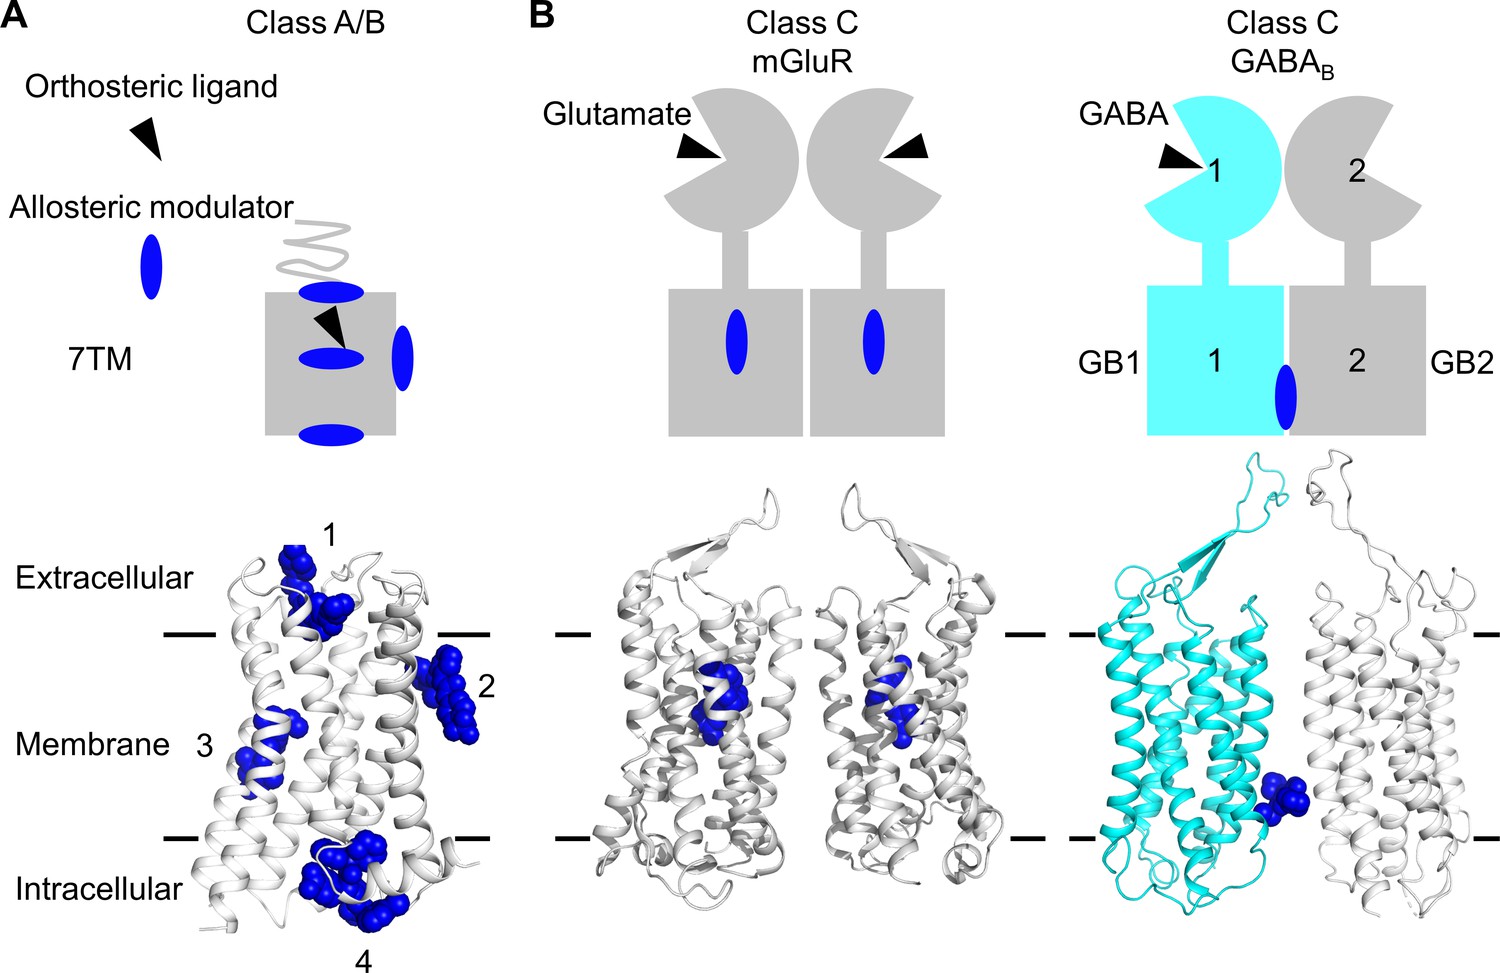
Allosteric binding sites in the different classes of G protein-coupled receptors (GPCRs).
(A, B) Scheme and structure of the transmembrane domain (TMD) representative of the diversity of the binding sites for allosteric modulators (filled blue circles or blue spheres) in selected human class A and B GPCRs (muscarinic M2 receptor PDB 4MQT [1], purinergic P2Y1 receptor PDB 4XNV [2], corticotropin-releasing factor receptor 1 PDB 4K5Y [3], and β2 adrenergic receptor PDB 5X7D [4]) (A), as well as in the class C homodimer mGluR5 (PDB 6N51) bound to a NAM (PDB 4OO9) and the heterodimer GABABR bound to GS39783 (PDB 6UO8) (B). In classes A and B, the allosteric modulators were shown to bind to different sites within and outside of the TM bundle, in contrast to the orthosteric ligand (black triangle).
Figure 2 with 1 supplement
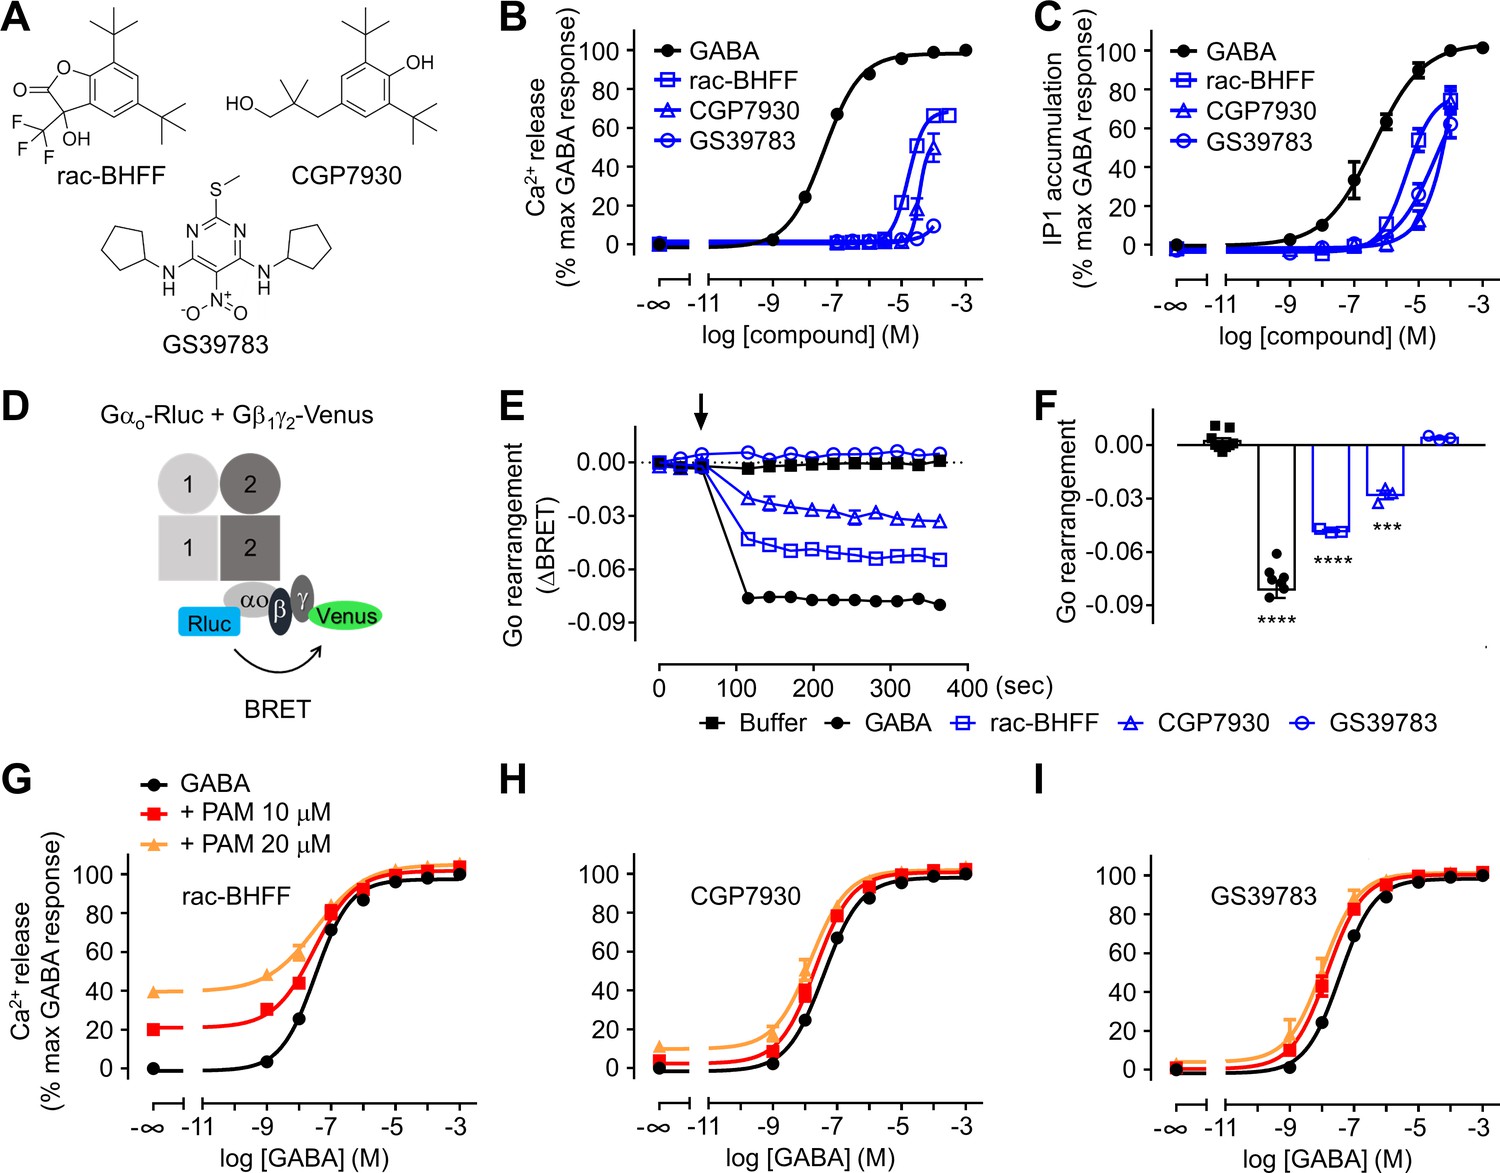
Different functional properties of the positive allosteric modulators (PAMs) for GABAB receptor.
(A) Chemical structures of the three PAMs of GABAB receptor used in the study and commercially available. (B, C) Intracellular Ca2+ responses (B) and inositol-phosphate-1 (IP1) accumulation (C) mediated by the indicated compounds. (D) Schematic representation of the Go protein BRET sensor. (E, F) Kinetics of BRET ratio changes of this sensor (E) upon addition (arrow) of buffer (control condition), 100 μM GABA or 100 μM of the indicated PAMs (blue). Data are from a typical experiment performed three times independently. Changes in BRET ratio (F) were measured 150 s after drug application. Data are shown as means ± SEM of three biologically independent experiments. Data are analyzed using one-way ANOVA test followed by a Dunnett’s multiple comparison test to determine significance (compared with the buffer condition) with ***p<0.0005, ****p<0.0001. (G–I) Intracellular Ca2+ responses mediated by GABA in the absence or presence of the indicated concentrations of rac-BHFF (G), CGP7930 (H), or GS39783 (I). Data are normalized by the response of 1 mM GABA and shown as means ± SEM of 4–15 biologically independent experiments.
-
Figure 2—source data 1
Source data for Figure 2B–C and F–I, Figure 2—figure supplement 1, and Supplementary files 1 and 2.
- https://cdn.elifesciences.org/articles/70188/elife-70188-fig2-data1-v3.xlsx
Figure 2—figure supplement 1
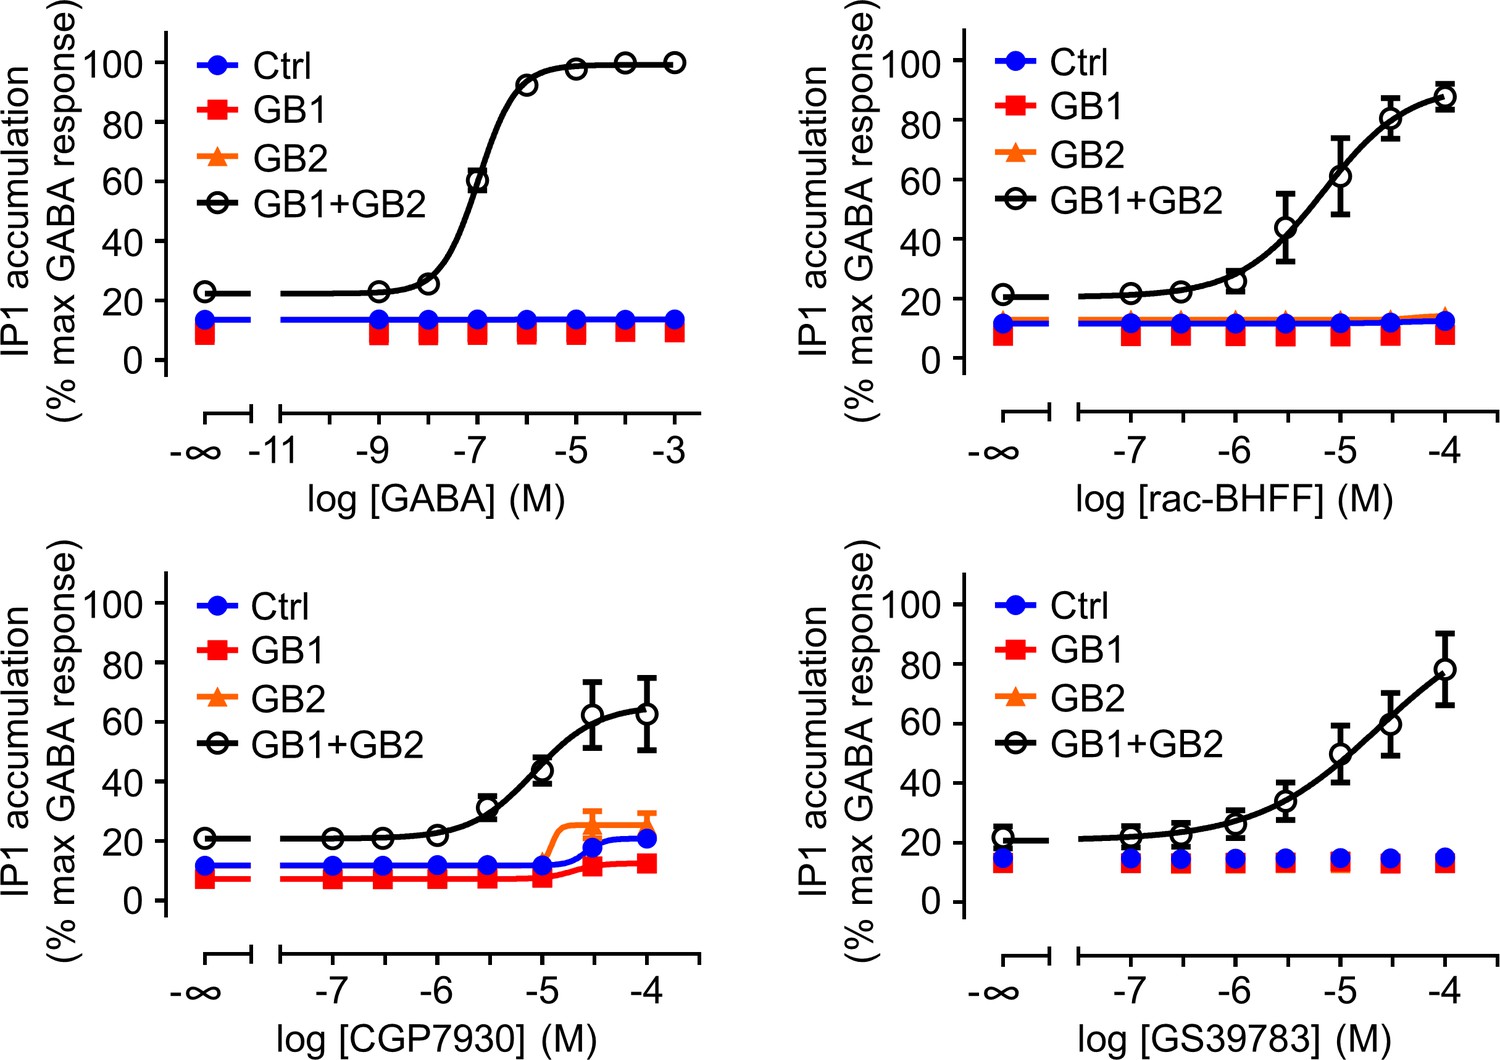
The three positive allosteric modulators (PAMs) show an intrinsic agonist activity on the GABAB receptor in the inositol-phosphate-1 (IP1) accumulation assay.
IP1 accumulation mediated by the indicated subunit composition upon stimulation with GABA or the indicated PAM. Data are normalized by using the response of 1 mM GABA on wild-type GABAB receptor (GB1 + GB2) and shown as means ± SEM of three biologically independent experiments. Negative controls (Ctrl) are HEK293 cells co-transfected with the empty vector and Gαqi9 cDNA.
Figure 3 with 2 supplements

Both GB1 and GB2 transmembrane domains (TMDs) are sufficient for the agonist activity of the positive allosteric modulators (PAMs).
(A–F) Intracellular Ca2+ responses mediated by the indicated subunit compositions (pictograms) upon stimulation with rac-BHFF. The inserted graphs correspond to the responses upon stimulation with GABA. Data are normalized by using the response of 100 μM rac-BHFF or 1 mM GABA, for rac-BHFF and GABA treatment, respectively, on wild-type GABAB receptor and shown as means ± SEM of 3–8 biologically independent experiments. The dotted lines in the main and inserted graphs indicate the dose–responses of the wild-type receptor determined in panel (A).
-
Figure 3—source data 1
Source data for Figure 3, Figure 3—figure supplement 1, Figure 3—figure supplement 2, and Supplementary file 3.
- https://cdn.elifesciences.org/articles/70188/elife-70188-fig3-data1-v3.xlsx
Figure 3—figure supplement 1
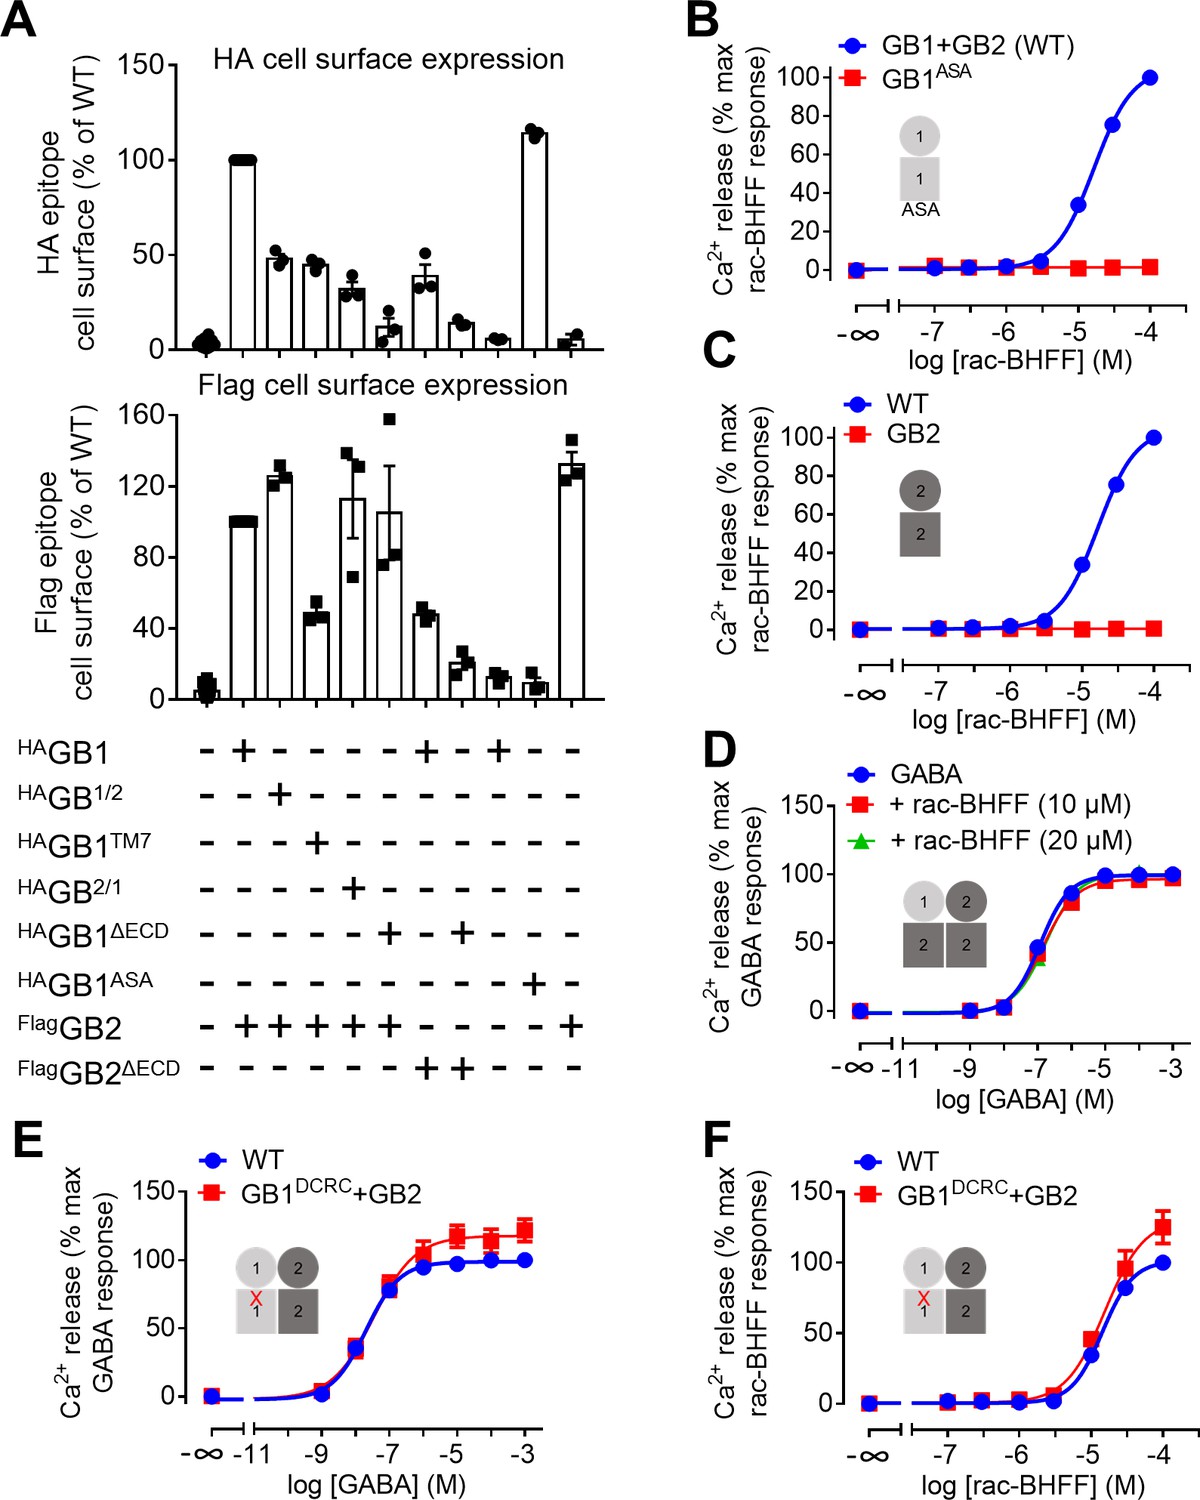
GB1 transmembrane domain (TMD) is required for agonist activity of rac-BHFF.
(A) Quantification of cell surface expression of the indicated HA-tagged GB1 and Flag-tagged GB2 constructs by ELISA in transfected HEK293 cells. Data are normalized by the WT receptor and shown as means ± SEM of 3–18 biologically independent experiments. GB1/2 corresponds to the chimeric subunit made of GB1 ECD and GB2 TMD, and GB2/1 to the chimeric subunit composed of GB2 ECD and GB1 TMD. GB1TM7 stands for the GB1 subunit that is deleted of most of its TMD leaving the seventh helix only. DECD indicates the deletion of the ECD domain. (B–F) Intracellular Ca2+ responses mediated by the indicated constructs upon stimulation with rac-BHFF (B, C, F) or GABA (D, E). Data are normalized by WT response of 100 μM rac-BHFF (B, C, F) or 1 mM GABA (D, E) and shown as means ± SEM of 3–6 biologically independent experiments. Cartoons illustrate the subunit compositions corresponding to the red curves. ASA corresponds to the mutated GB1 subunit in which the endoplasmic reticulum retention signal RSR has been mutated to ASA to allow its efficient trafficking to the cell surface in the absence of GB2. DCRC corresponds to the GB1 mutant in which D6492.59 and R6653.32 in TMD were replaced by cysteines. This mutation is shown as a red cross in panels (E) and (F).
Figure 3—figure supplement 2
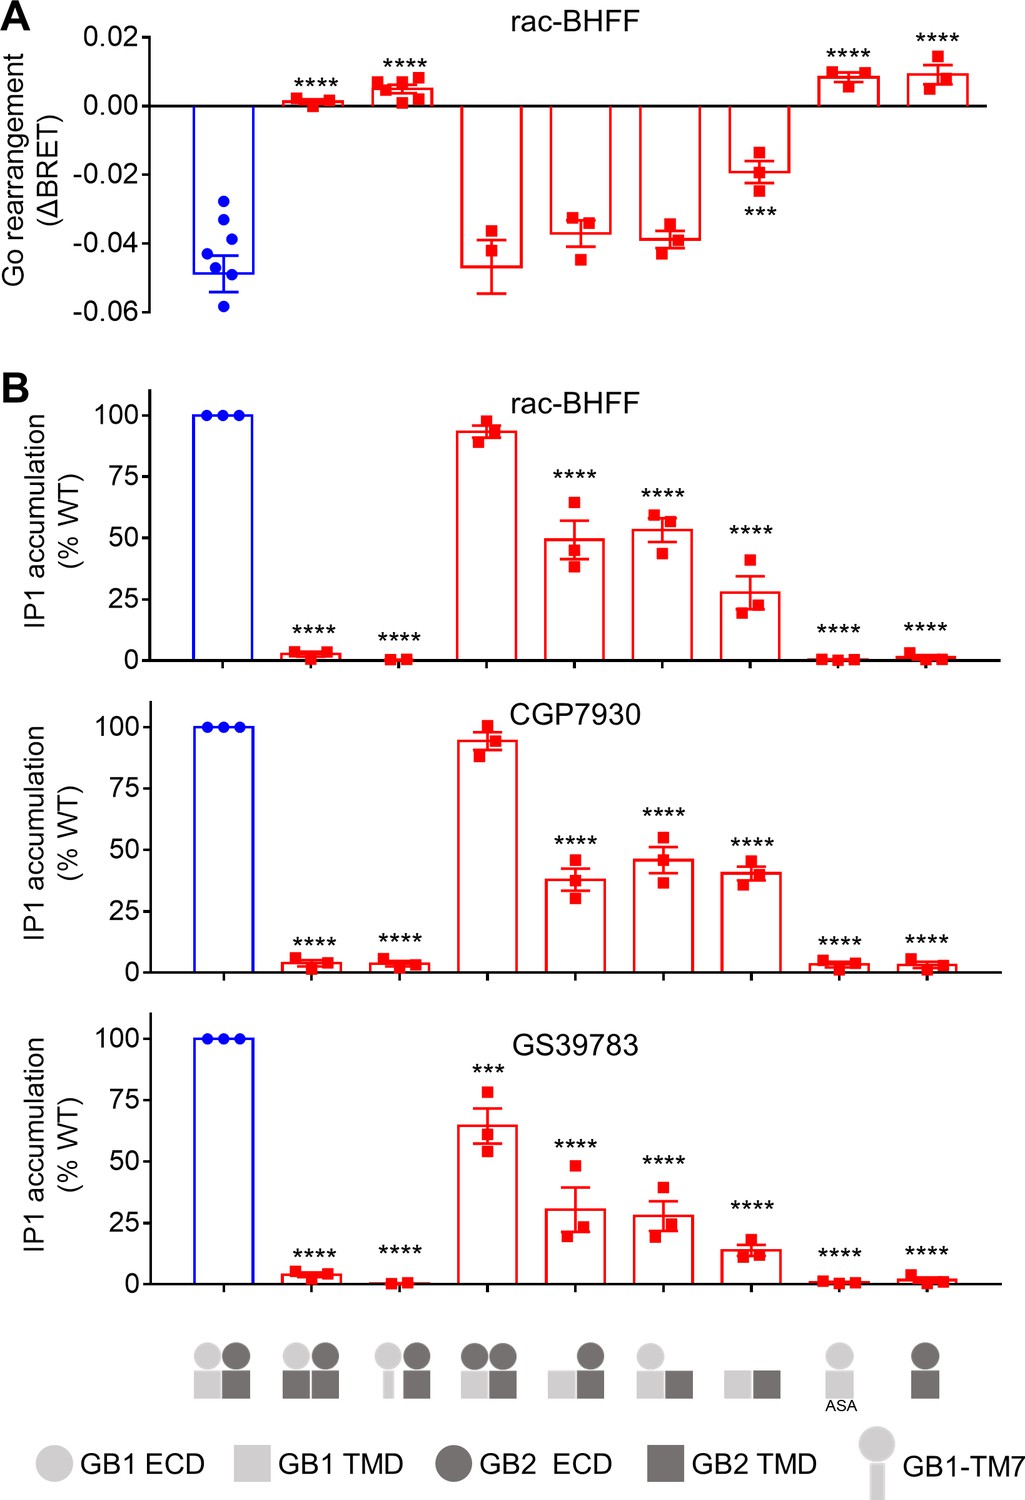
GB1 transmembrane domain (TMD) is required for agonist activity of the ago-positive allosteric modulators (ago-PAMs).
(A) BRET ratio changes mediated by the WT (in blue) and indicated constructs upon stimulation with 100 μM rac-BHFF. Data are shown as means ± SEM of 3–7 biologically independent experiments. (B) Inositol-phosphate-1 (IP1) accumulation mediated by the indicated constructs in the presence of 30 μM of the indicated PAM. Data are normalized to the WT response and shown as means ± SEM of three biologically independent experiments. In (A) and (B), data are analyzed using one-way ANOVA test followed by a Dunnett’s multiple comparison test to determine significance (compared with the WT) with ***p<0.0005 and ****p<0.0001.
Figure 4 with 2 supplements
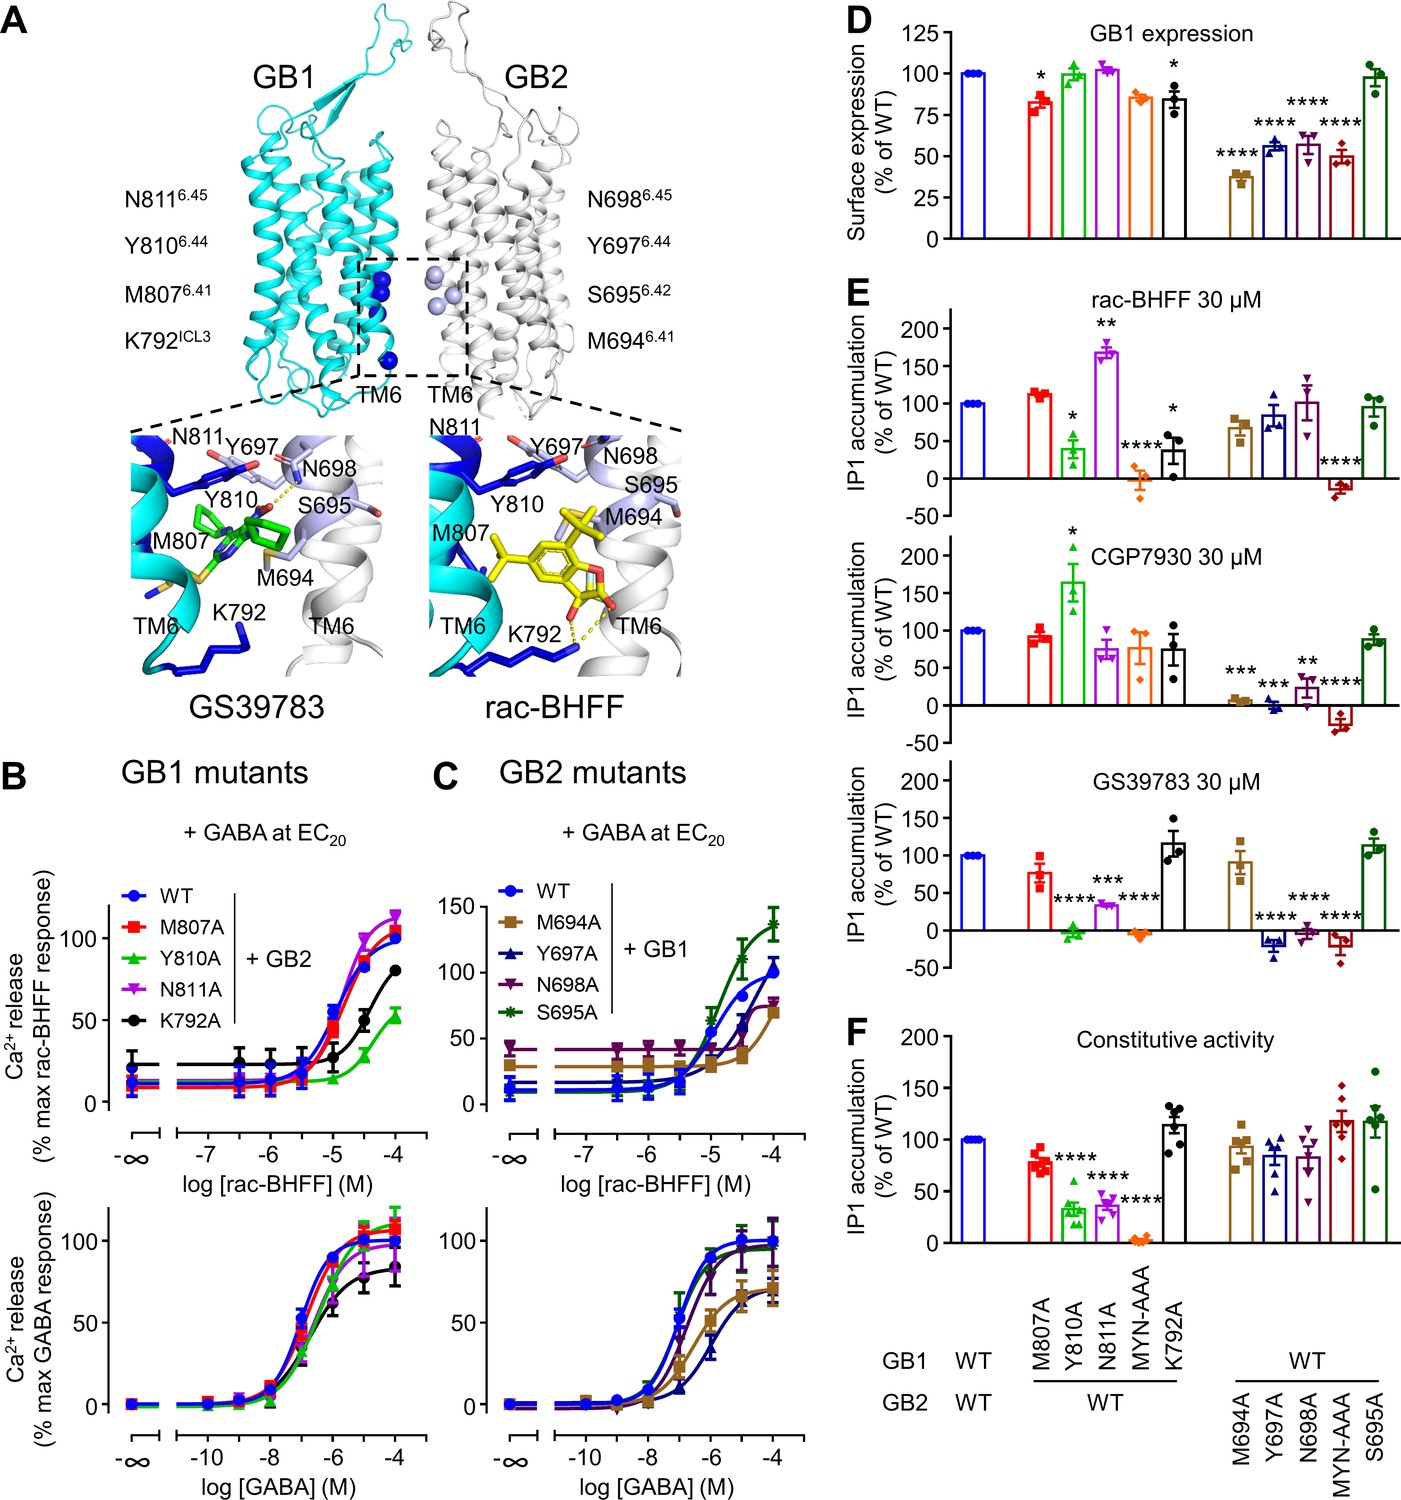
GB1 and GB2 TM6s interface is the binding site for the different positive allosteric modulators (PAMs).
(A) Structure of the GABAB receptor (PDB 6UO8) where the binding site of GS39783 (PDB 6UO8) and rac-BHFF (PDB 7C7Q) in the receptor is highlighted, and close-up view of the molecules bound (PAMs shown as sticks, and hydrogen bonds between PAMs and receptor are depicted as dashed yellow lines). The α-carbon of the main residues involving in the binding site for these PAMs is highlighted as a sphere in GB1 (blue) and GB2 (light blue). (B, C) Intracellular Ca2+ responses mediated by the indicated constructs upon stimulation with rac-BHFF in the presence of EC20 GABA, or GABA alone. Data are normalized by wild-type response of 100 μM rac-BHFF + EC20 GABA or 100 μM GABA, for rac-BHFF and GABA treatment, respectively, and shown as means ± SEM of 4–5 biologically independent experiments. (D) Quantification of cell surface-expressed GB1 in HEK293 cells transfected with the indicated HALO-tagged GB1 and SNAP-tagged GB2 constructs after labeling with HALO-Lumi4-Tb. Data are normalized by wild-type receptor and expressed as means ± SEM. (E, F) Inositol-phosphate-1 (IP1) production induced by the indicated PAMs (E) or basal IP1 accumulation (F) in intact HEK293 cells expressing the indicated subunit combinations. Data are normalized by wild-type response and shown as means ± SEM of 4–5 biologically independent experiments. Data are analyzed using one-way ANOVA test followed by a Dunnett’s multiple comparison test to determine significance (compared with the WT) with *p<0.05, **p<0.005, ***p<0.0005, ****p<0.0001.
-
Figure 4—source data 1
Source data for Figure 4B–F, Figure 4—figure supplement 1, and Figure 4—figure supplement 2.
- https://cdn.elifesciences.org/articles/70188/elife-70188-fig4-data1-v3.xlsx
Figure 4—figure supplement 1
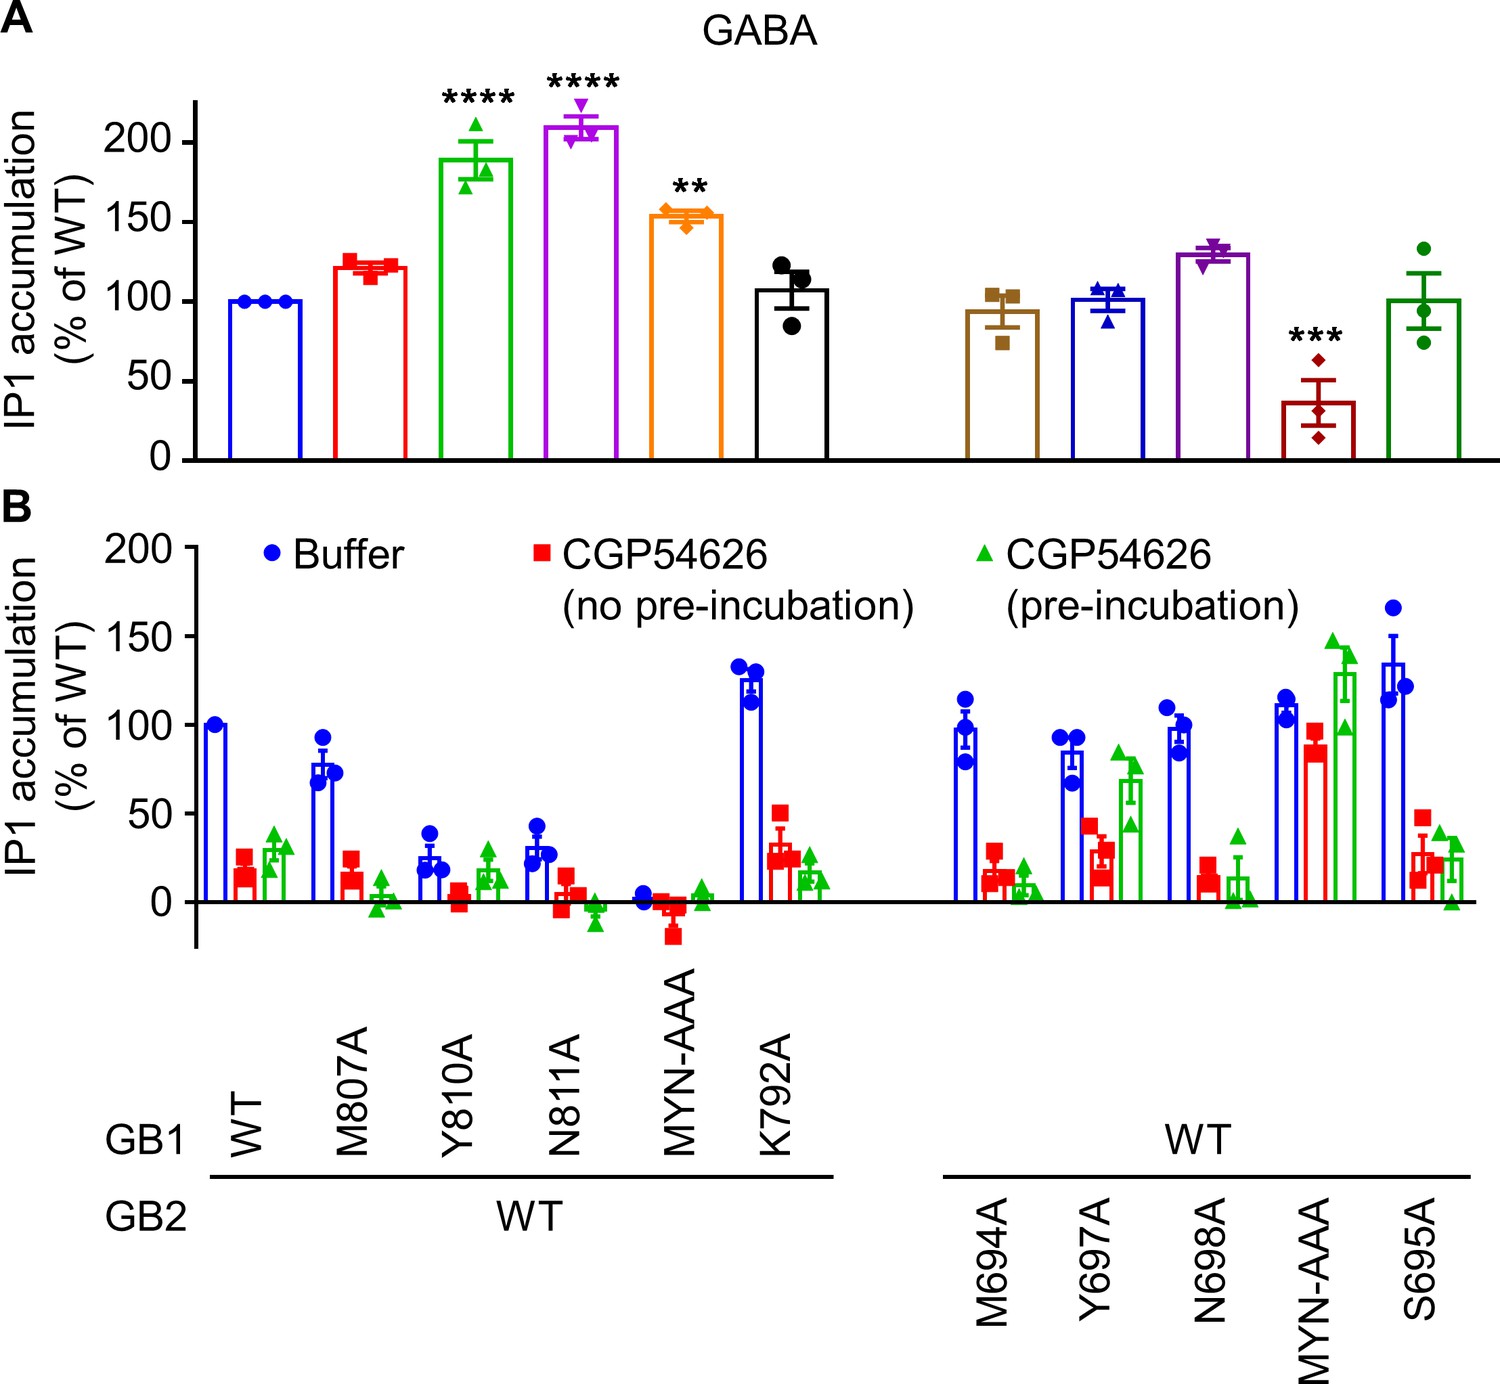
GB1 and GB2 TM6s interface is the binding site for the different positive allosteric modulators (PAMs).
(A, B) Inositol-phosphate-1 (IP1) production induced by 100 μM GABA (A) and buffer or 10 μM CGP54626 with or without pre-incubation for 24 hr (B) in HEK293 cells expressing the indicated subunit combinations. Data are normalized by GABA (A) or buffer (B) response on the WT receptor, and shown as means ± SEM of three biologically independent experiments. Data are analyzed using one-way ANOVA test followed by a Dunnett’s multiple comparisons to WT for (A) with **p<0.005, ***p<0.0005, ****p<0.0001.
Figure 4—figure supplement 2
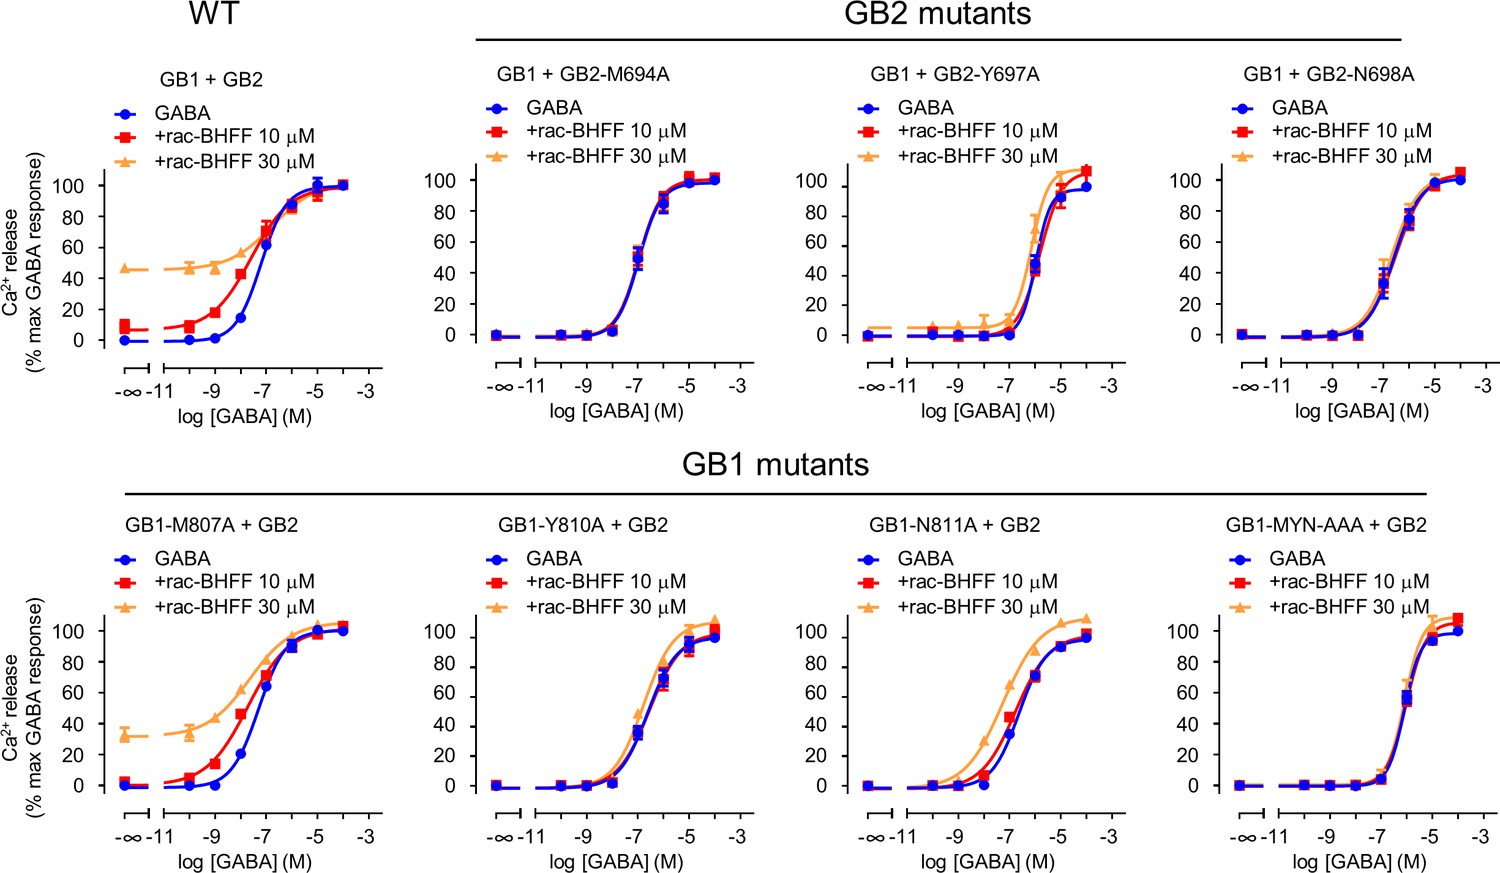
GB1 and GB2 TM6s interface is the binding site for rac-BHFF.
Intracellular Ca2+ responses mediated by the indicated constructs upon stimulation with GABA in the absence or presence of the indicated concentrations of rac-BHFF. Data are normalized by the response of 100 μM GABA and shown as means ± SEM of 2–3 biologically independent experiments.
Figure 5 with 6 supplements
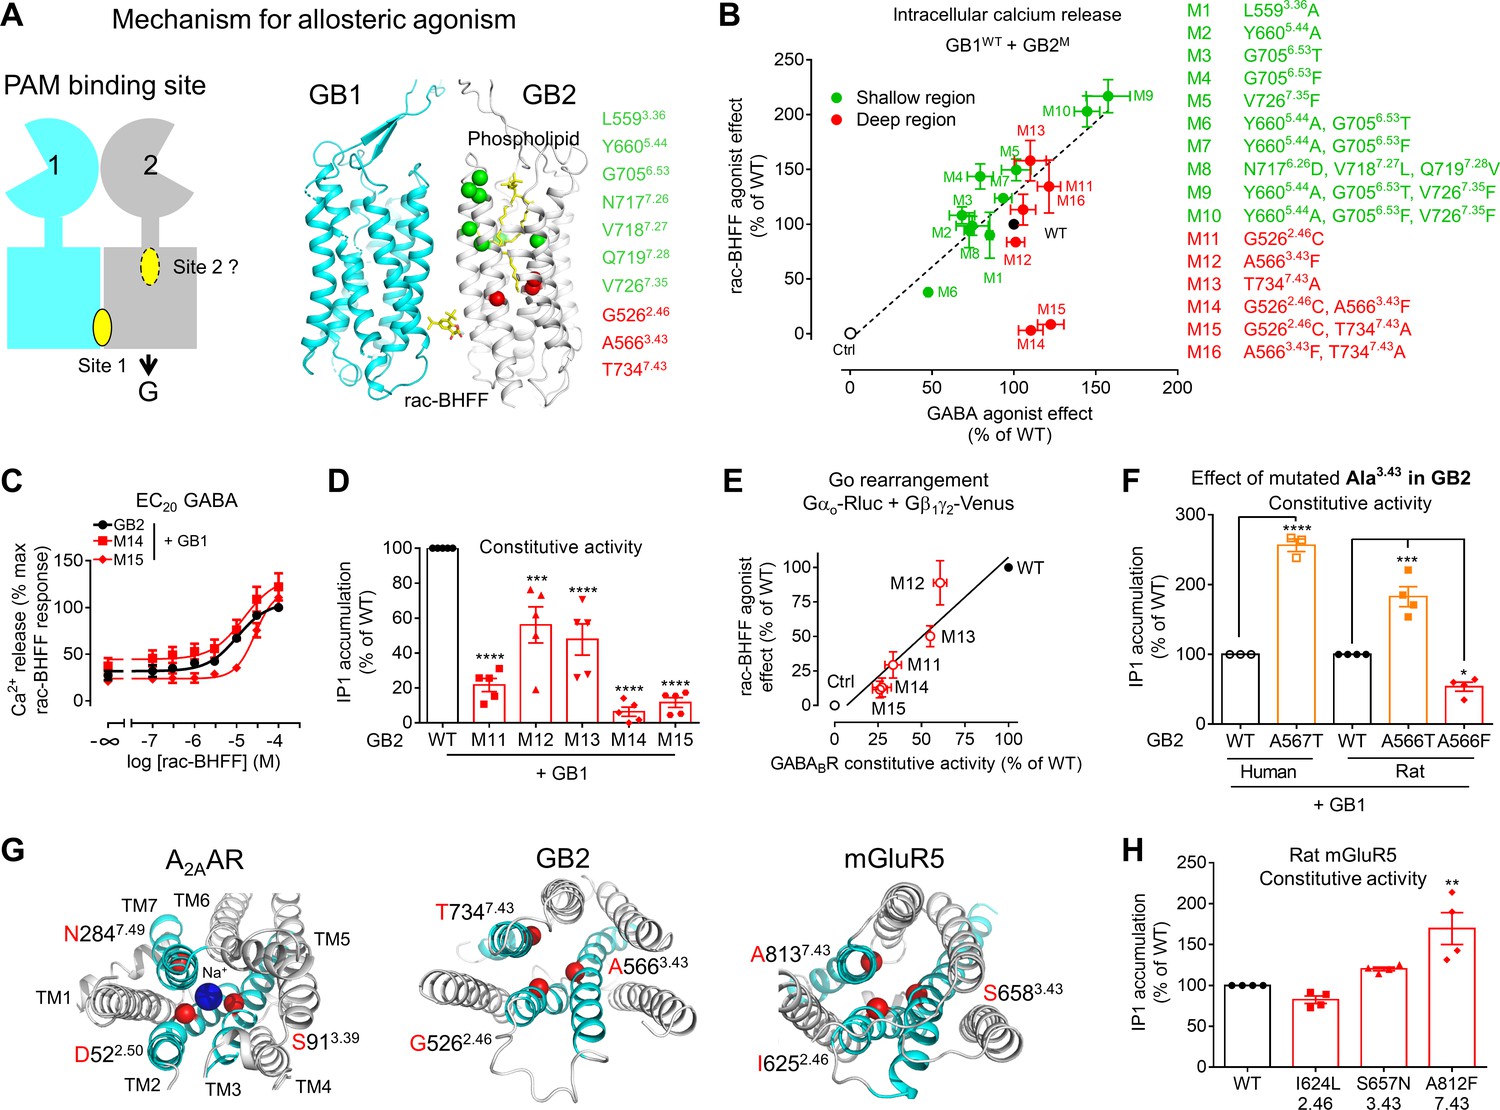
A deep region in GB2 transmembrane domain (TMD) is responsible for agonist activity of the positive allosteric modulator (PAM).
(A) Cartoon highlighting a possible second binding site (dotted oval) for the PAMs in the ancestral ligand binding pocket of the GB2 TMD. In the structure of the inactive state, this pocket is occupied by one molecule of phospholipid (shown as yellow sticks). The residues (α-carbon) of this phospholipid binding pocket (green) and the residues underneath (red) were changed to evaluate their importance in the agonist activity of rac-BHFF. The highly conserved residues L3.36 and Y5.44 were mutated into Ala; G6.53 conserved in GB2 were changed to Thr conserved at this position in GB1, or Phe conserved at this position for other class C GPCRs such as mGlu and CaSR; in Mut 8, the non-conserved residues 7.26NVQ7.28 were mutated in their equivalent in GB2 Drosophila; V7.35 conserved in GB2 (Val or Phe) was changed to Phe. (B) Intracellular Ca2+ responses mediated by the indicated GB2 mutants (M1 to M16) coexpressed with the wild-type GB1 subunit upon stimulation with 30 μM rac-BHFF or 1 mM GABA. Data are normalized by wild-type response and expressed as means ± SEM of three biologically independent experiments. (C) Intracellular Ca2+ responses mediated by the indicated constructs upon stimulation with rac-BHFF in the presence of EC20 GABA of each combination. Data are normalized by wild-type response of 100 μM rac-BHFF + EC20 GABA and shown as means ± SEM. (D) Basal inositol-phosphate-1 (IP1) accumulation mediated by the indicated constructs. Data are normalized by the response of the wild-type and shown as means ± SEM of five biologically independent experiments. Data are analyzed using one-way ANOVA test followed by a Dunnett’s multiple comparison test to determine significance (compared with the WT) with ***p<0.0005, ****p<0.0001. (E) Correlation between the GABAB constitutive activity measured using the Go protein BRET sensor and the rac-BHFF agonist effect for the WT GB1 subunit coexpressed with the indicated GB2 mutants. Data are normalized by the response of the wild-type and shown as means ± SEM. (F) Basal IP1 accumulation mediated by the indicated constructs, including the genetic mutation A567T identified in human GB2 that is equivalent to the mutation A566T in rat. Data are normalized by the response of the WT and shown as means ± SEM of 3–4 biologically independent experiments. Data are analyzed using an unpaired t-test for human, and one-way ANOVA test followed by a Dunnett’s multiple comparison test to determine significance (compared with the WT) for the rat, with *p<0.05, ***p<0.0005, ****p<0.0001. (G) Top view of the sodium binding pocket within the structure of human A2A adenosine receptor (PDB 4EIY) where the three residues important for Na+ interactions are highlighted (Cα in red), the equivalent residues identified in human GB2 TMD (PDB 6UO8), and human mGluR5 TMD (PDB 4OO9); the X.50 numbers shown for A2AAR are equivalent to the numbers in mGluR5 on the basis of X.50 residues defined in Doré et al., 2014; TM2, TM3, and TM7 that contain the residues involving the identified region are highlighted in cyan. (H) Basal IP1 accumulation mediated by the indicated WT and mutated mGlu5 receptors in the presence of the co-transfected glutamate transporter EAAT3. Data are normalized by the response of the WT and shown as means ± SEM of four biologically independent experiments. Data are analyzed using one-way ANOVA test followed by a Dunnett’s multiple comparison test to determine significance (compared with the WT), with **p<0.005. For clarity, the residue numbers for GB2 subunit are based on the sequence of rat GB2. Negative controls (Ctrl) are HEK293 cells co-transfected with the empty vector and Gαqi9 cDNA (B), or Gαo-Rluc and Gβ1γ2-Venus cDNAs in the absence of receptor (E).
-
Figure 5—source data 1
Source data for Figure 5B–F and H, Figure 5—figure supplement 2, Figure 5—figure supplement 3, Figure 5—figure supplement 4A and B, Figure 5—figure supplement 4E and F, and Supplementary file 2.
- https://cdn.elifesciences.org/articles/70188/elife-70188-fig5-data1-v3.xlsx
Figure 5—figure supplement 1
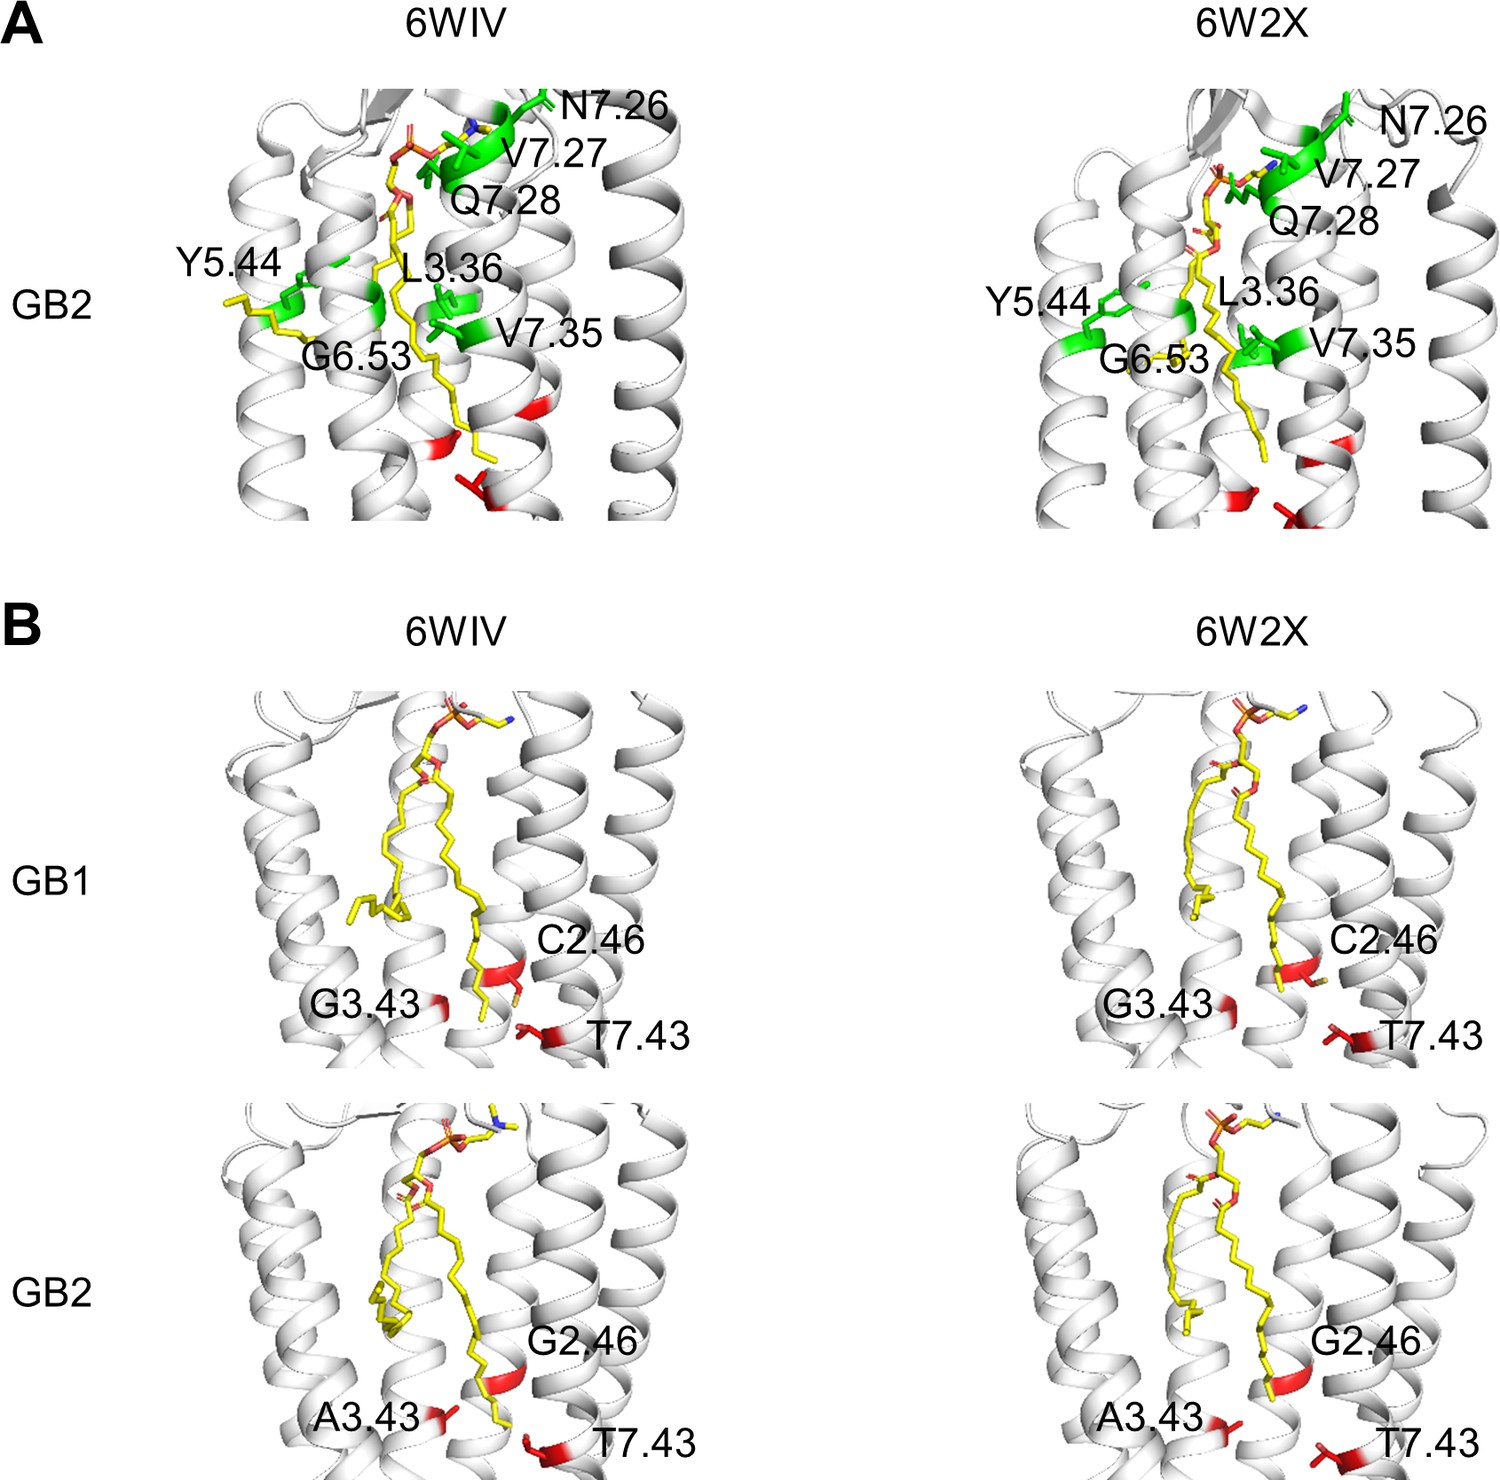
Phospholipid binding site in the inactive state of GB1 and GB2 transmembrane domain (TMDs).
(A) The residues changed in the phospholipid (shown as yellow sticks) pocket are highlighted (green) in the two inactive structures of GB2 (PDB 6WIV and 6W2X). The three residues of the deep region investigated in this study are shown in red (only carbon α). (B) The molecule of phospholipid bound (yellow sticks) in both GB1 and GB2 TMDs in the inactive conformations of the GABAB receptor (6WIV and 6W2X) reached the deep region (in red) both in GB1 and GB2 TMDs. The three residues from these deep regions are highlighted (red sticks). To clearly show the bound phospholipid, the TM6 helix is hidden in all structures in (B).
Figure 5—figure supplement 2
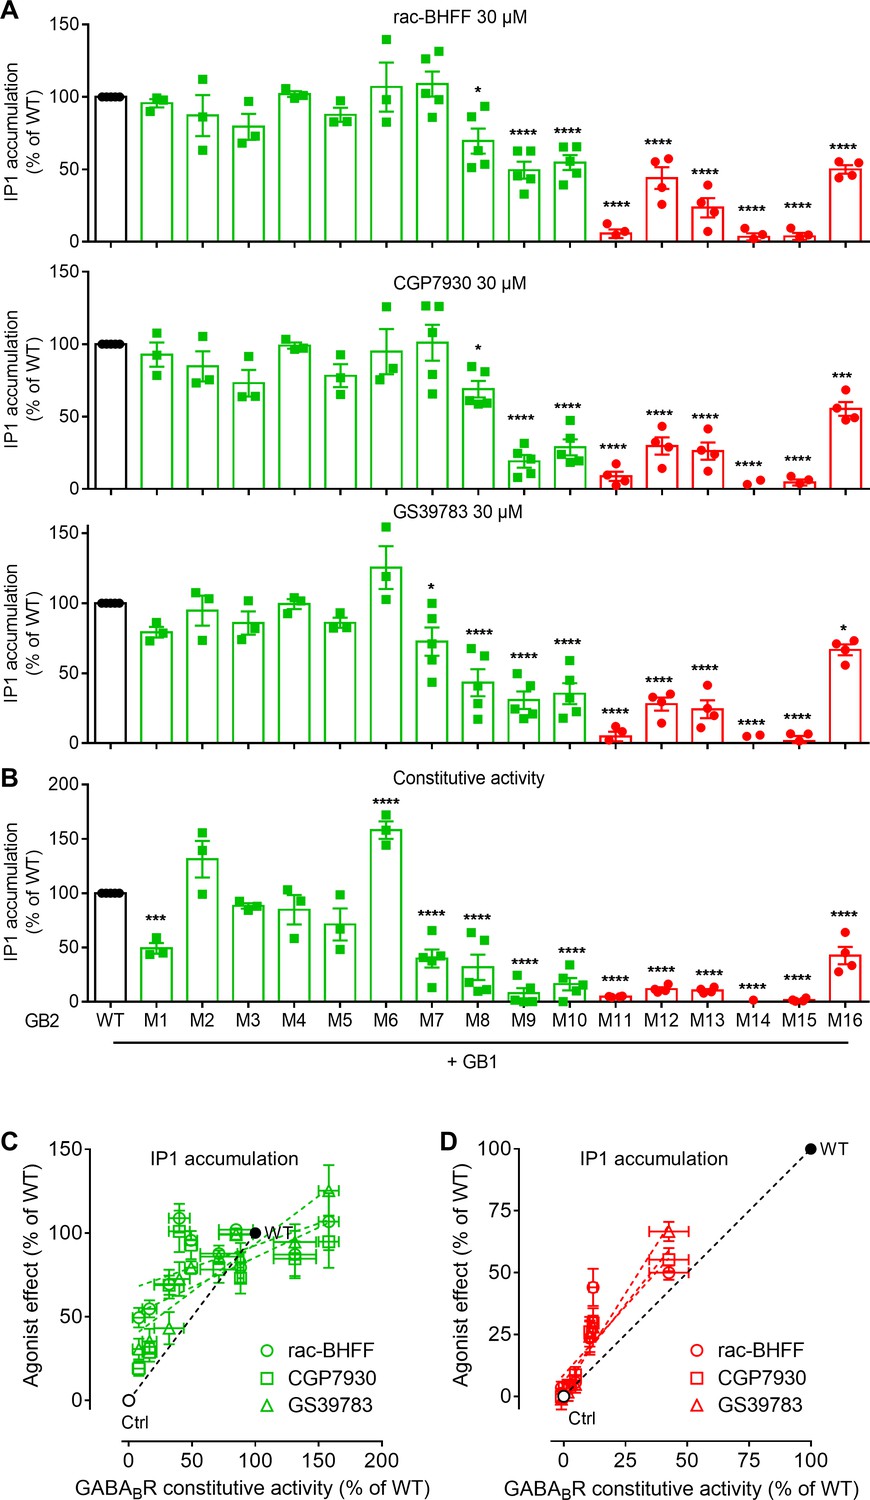
Functional characterization of the GB2 subunit mutants in the transmembrane domain (TMD) core.
(A, B) Inositol-phosphate-1 (IP1) production induced by the indicated positive allosteric modulators (PAMs) (A) or basal IP1 accumulation (B) in HEK293 cells expressing the indicated subunit combinations. Data are normalized by wild-type response and shown as means ± SEM of 3–5 biologically independent experiments. Data are analyzed using one-way ANOVA test followed by a Dunnett’s multiple comparison test to determine significance (compared with the WT) with *p<0.05, ***p<0.0005, ****p<0.0001. (C, D) Correlation between the GABAB constitutive activity and the agonist effect of the PAM for the mutants analyzed in panel (A) and for the three PAMs. Negative controls (Ctrl) are HEK293 cells co-transfected with the empty vector and Gαqi9 cDNA.
Figure 5—figure supplement 3
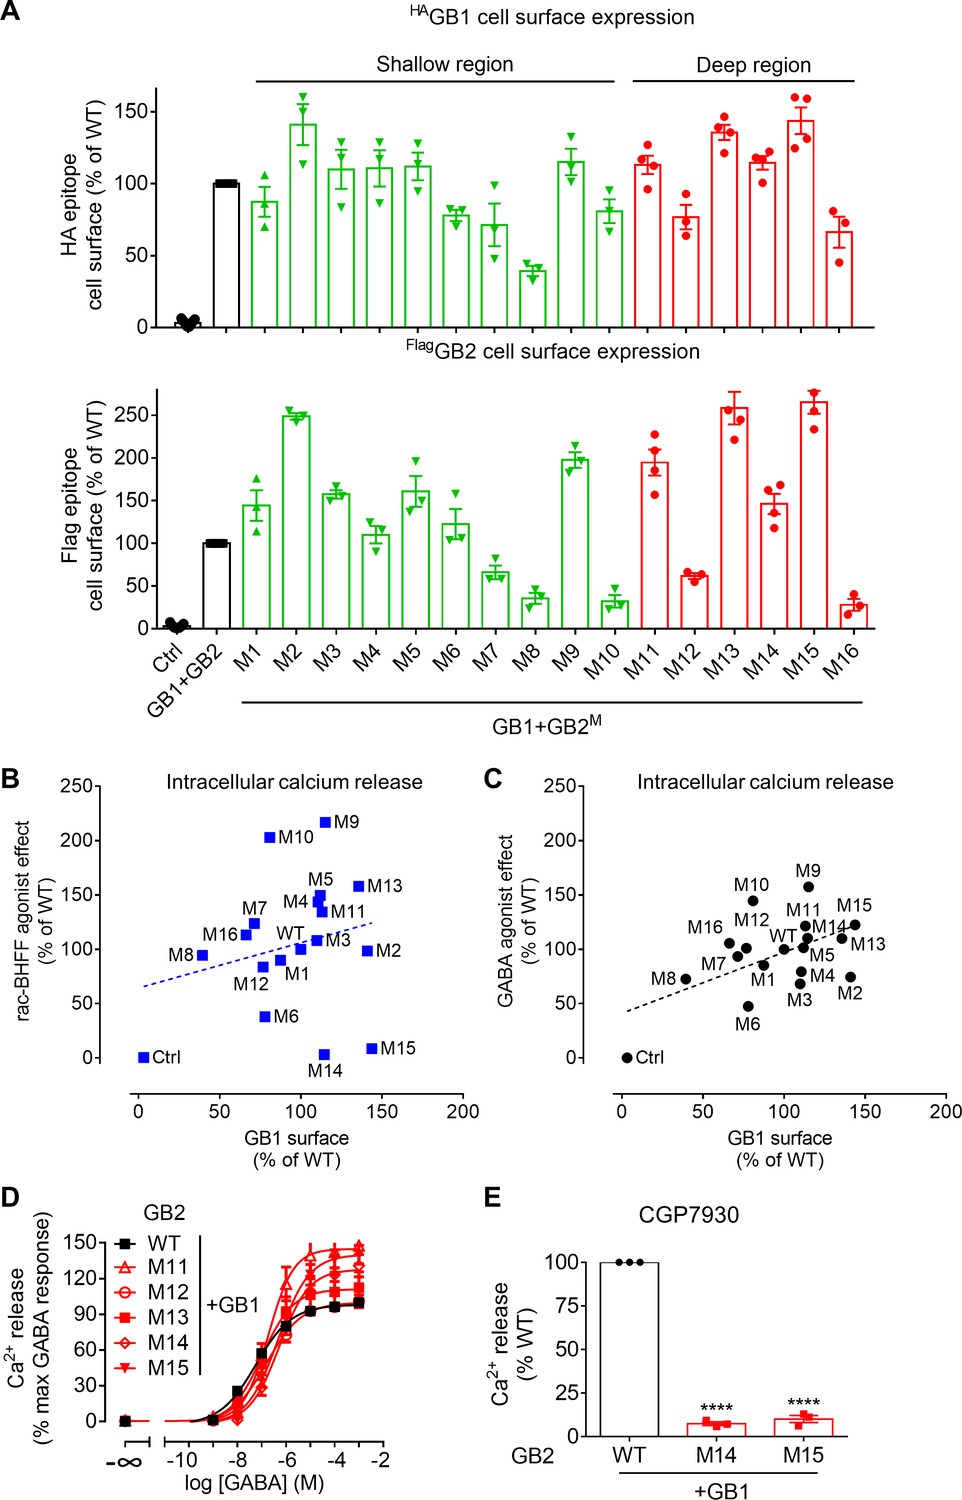
Characterization of the GB2 subunit mutants in the transmembrane domain (TMD) core.
(A) Quantification of cell surface-expressed WT HA-tagged GB1 (top panel) and Flag-tagged GB2 WT or mutants (M; lower panel) by ELISA on intact HEK293 cells co-transfected with the indicated constructs. Data are normalized by the WT receptor and shown as means ± SEM of 3–21 biologically independent experiments. (B, C) Intracellular Ca2+ responses mediated by the indicated GB2 mutants (M1 to M16) coexpressed with the wild-type GB1 subunit upon stimulation with 30 μM rac-BHFF (B) or 1 mM GABA (C). Data are normalized by wild-type receptor and expressed as means ± SEM. Negative controls (Ctrl) are HEK293 cells co-transfected with the empty vector and Gαqi9 cDNA. (D, E) Intracellular Ca2+ responses mediated by the indicated GB2 mutants coexpressed with the WT GB1 subunit upon stimulation with GABA (D) or 30 μM CGP7930 (E). Data are normalized by the WT receptor and shown as means ± SEM of 3–9 biologically independent experiments. Data are analyzed using one-way ANOVA test followed by a Dunnett’s multiple comparison test to determine significance (compared with the WT), with ****p<0.0001.
Figure 5—figure supplement 4
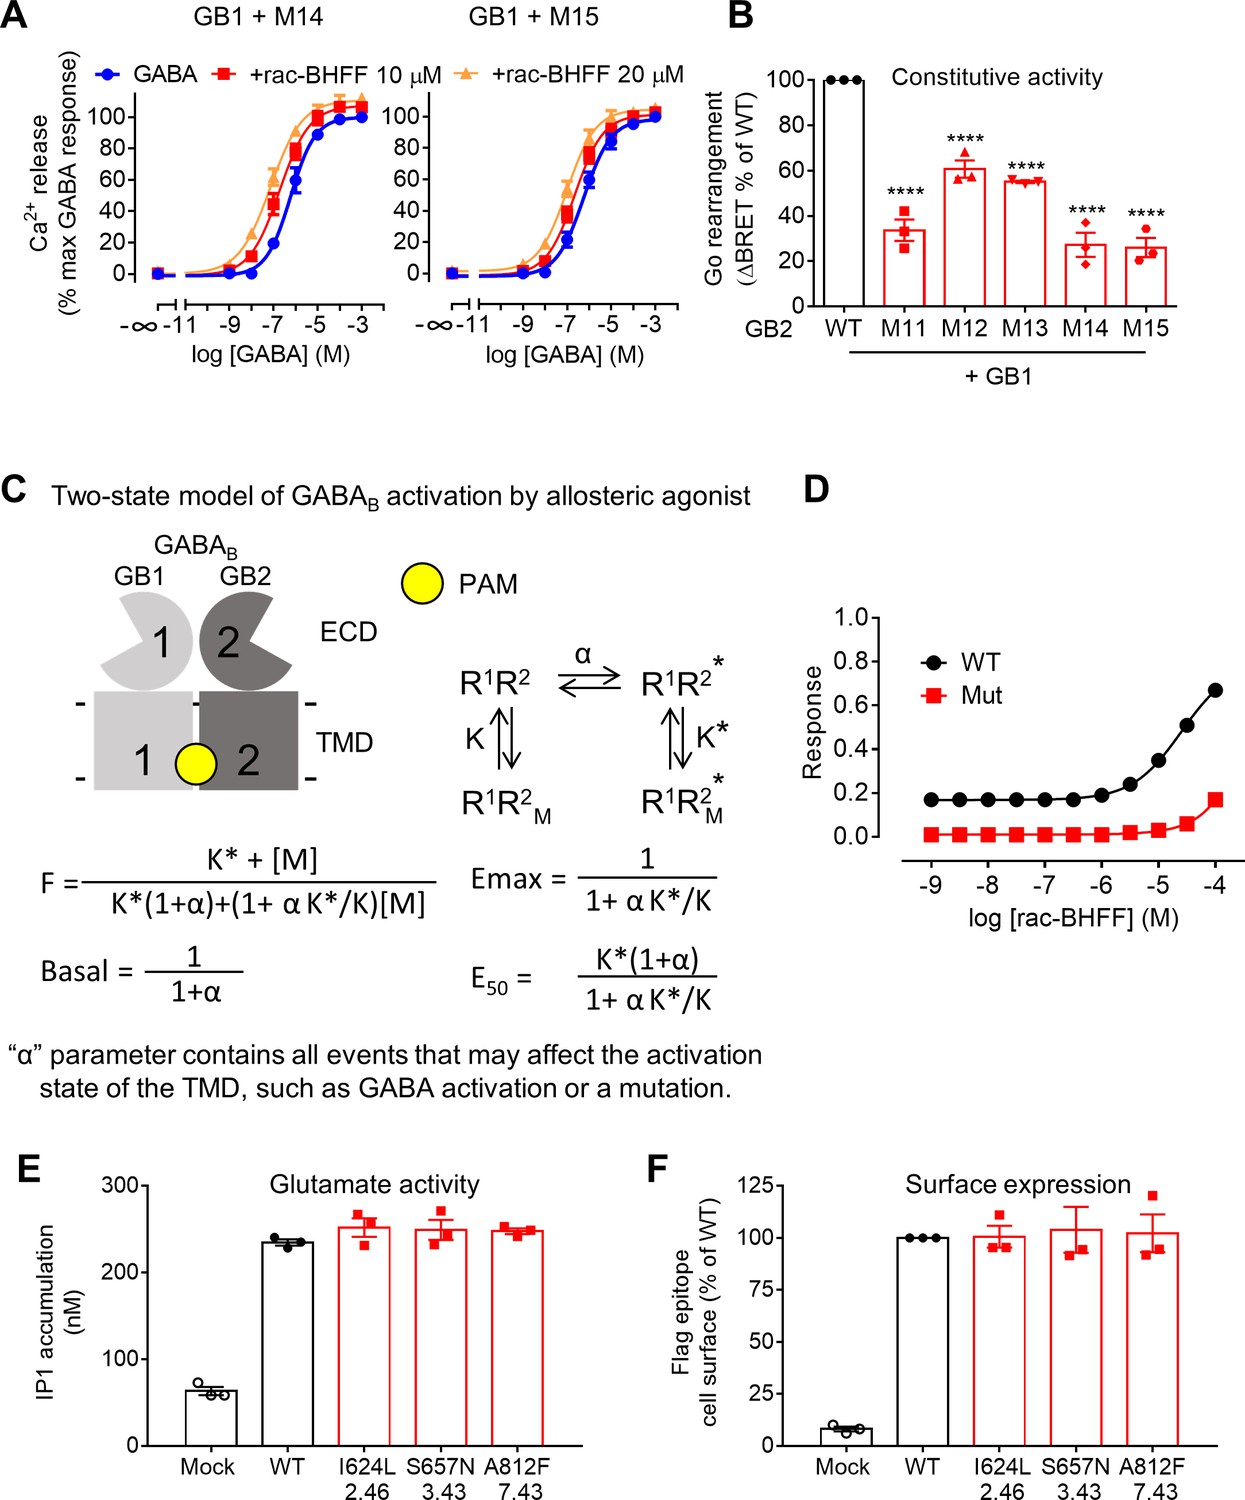
A deep region in GB2 transmembrane domain (TMD) is critical for allosteric agonism.
(A) Intracellular Ca2+ responses mediated by the indicated GB2 mutants upon stimulation with GABA in the absence or presence of 10 μM or 20 μM rac-BHFF. Data are normalized by the response of 1 mM GABA and shown as means ± SEM of six biologically independent experiments. (B) Basal Go BRET ratio mediated by the indicated constructs. Data are normalized by WT response and shown as means ± SEM of three biologically independent experiments. Data are analyzed using one-way ANOVA test followed by a Dunnett’s multiple comparison test to determine significance (compared with the WT), with ****p<0.0001. (C) A simplified mathematical model for the activation of the GABAB receptor by allosteric modulators. Asymmetric arrangement of GB1 and GB2 TMDs for the inactive (R1R2) and active (R1R2*) states free or bound to an allosteric modulator (M). These relative populations are governed by equilibrium constants, α for the basal state, and K and K* for the inactive and active states, respectively. (D) Simulated dose–response curves of rac-BHFF on the WT GABAB receptor (WT) and the mutated receptor (Mut 14 or Mut 15) that has low constitutive activity (α = 100), but its binding parameters for the active (K*) and inactive (K) states are not changed. (E) Inositol-phosphate-1 (IP1) accumulation mediated by the WT and mutant mGlu5 receptors in the presence of the co-transfected glutamate transporter EAAT3 upon stimulation with 100 μM glutamate from a typical experiment that has been repeated three times. Data are expressed as means ± SEM. (F) Quantification of cell surface-expressed Flag-tagged WT and mutant mGlu5 receptors by ELISA after transient transfection of HEK293 cells. Data are normalized by WT response and shown as means ± SEM of three biologically independent experiments.
Figure 5—figure supplement 5
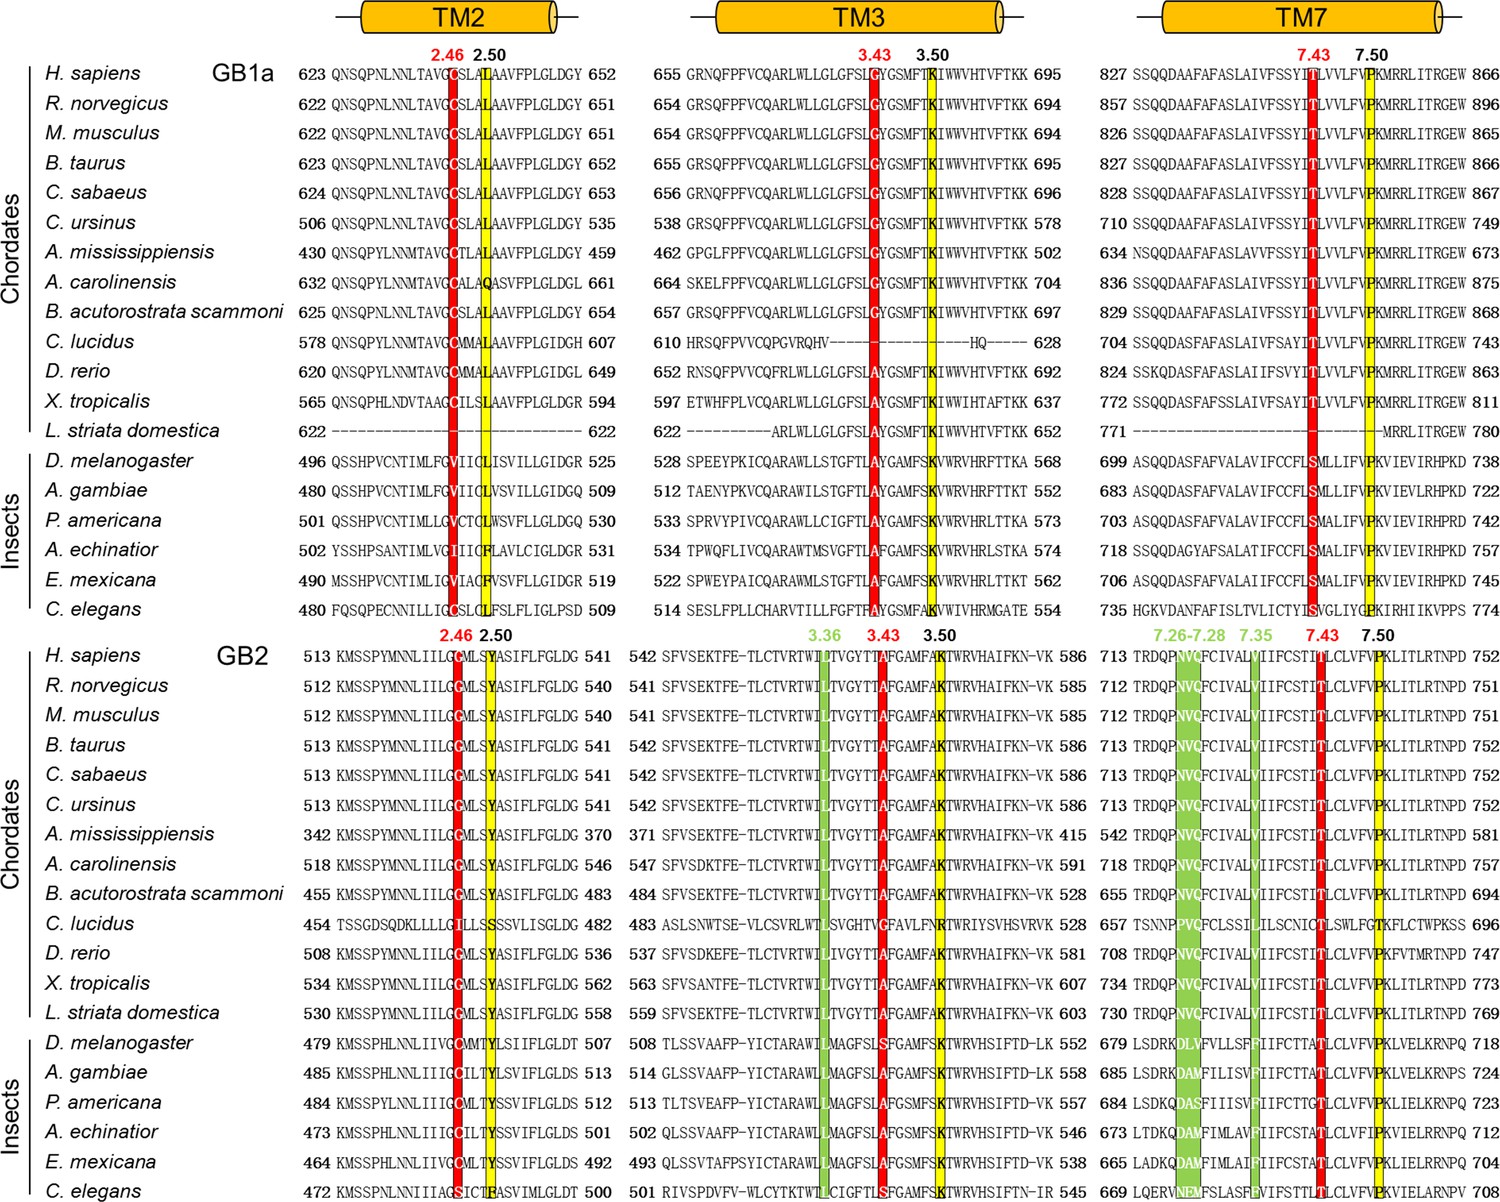
Amino acid sequences alignment of the deep region for both GB1 and GB2.
Sequences are from the National Center for Biotechnology Information Protein database (http://www.ncbi.nlm.nih.gov). The alignment is according to full-length GABAB receptor sequence and generated with ClustalW. The three residues from the deep region are highlighted in red background. The species abbreviations are as follows: H. sapiens, Homo sapiens; R. norvegicus, Rattus norvegicus; M. musculus, Mus musculus; B. taurus, Bos taurus; C. sabaeus, Chlorocebus sabaeus; C. ursinus, Callorhinus ursinus; A. mississippiensis, Alligator mississippiensis; A. carolinensis, Anolis carolinensis; B. acutorostrata scammoni, Balaenoptera acutorostrata scammoni; C. lucidus, Collichthys lucidus; D. rerio, Danio rerio; X. tropicalis, Xenopus tropicalis; L. striata domestica, Lonchura striata domestica; D. melanogaster, Drosophila melanogaster; A. gambiae, Anopheles gambiae; P. americana, Periplaneta americana; A. echinatior, Acromyrmex echinatior; E. mexicana, Eufriesea mexicana; C. elegans, Caenorhabditis elegans. The most conserved residue of each transmembrane (TM) (position X.50) is indicated in yellow.
Figure 5—figure supplement 6
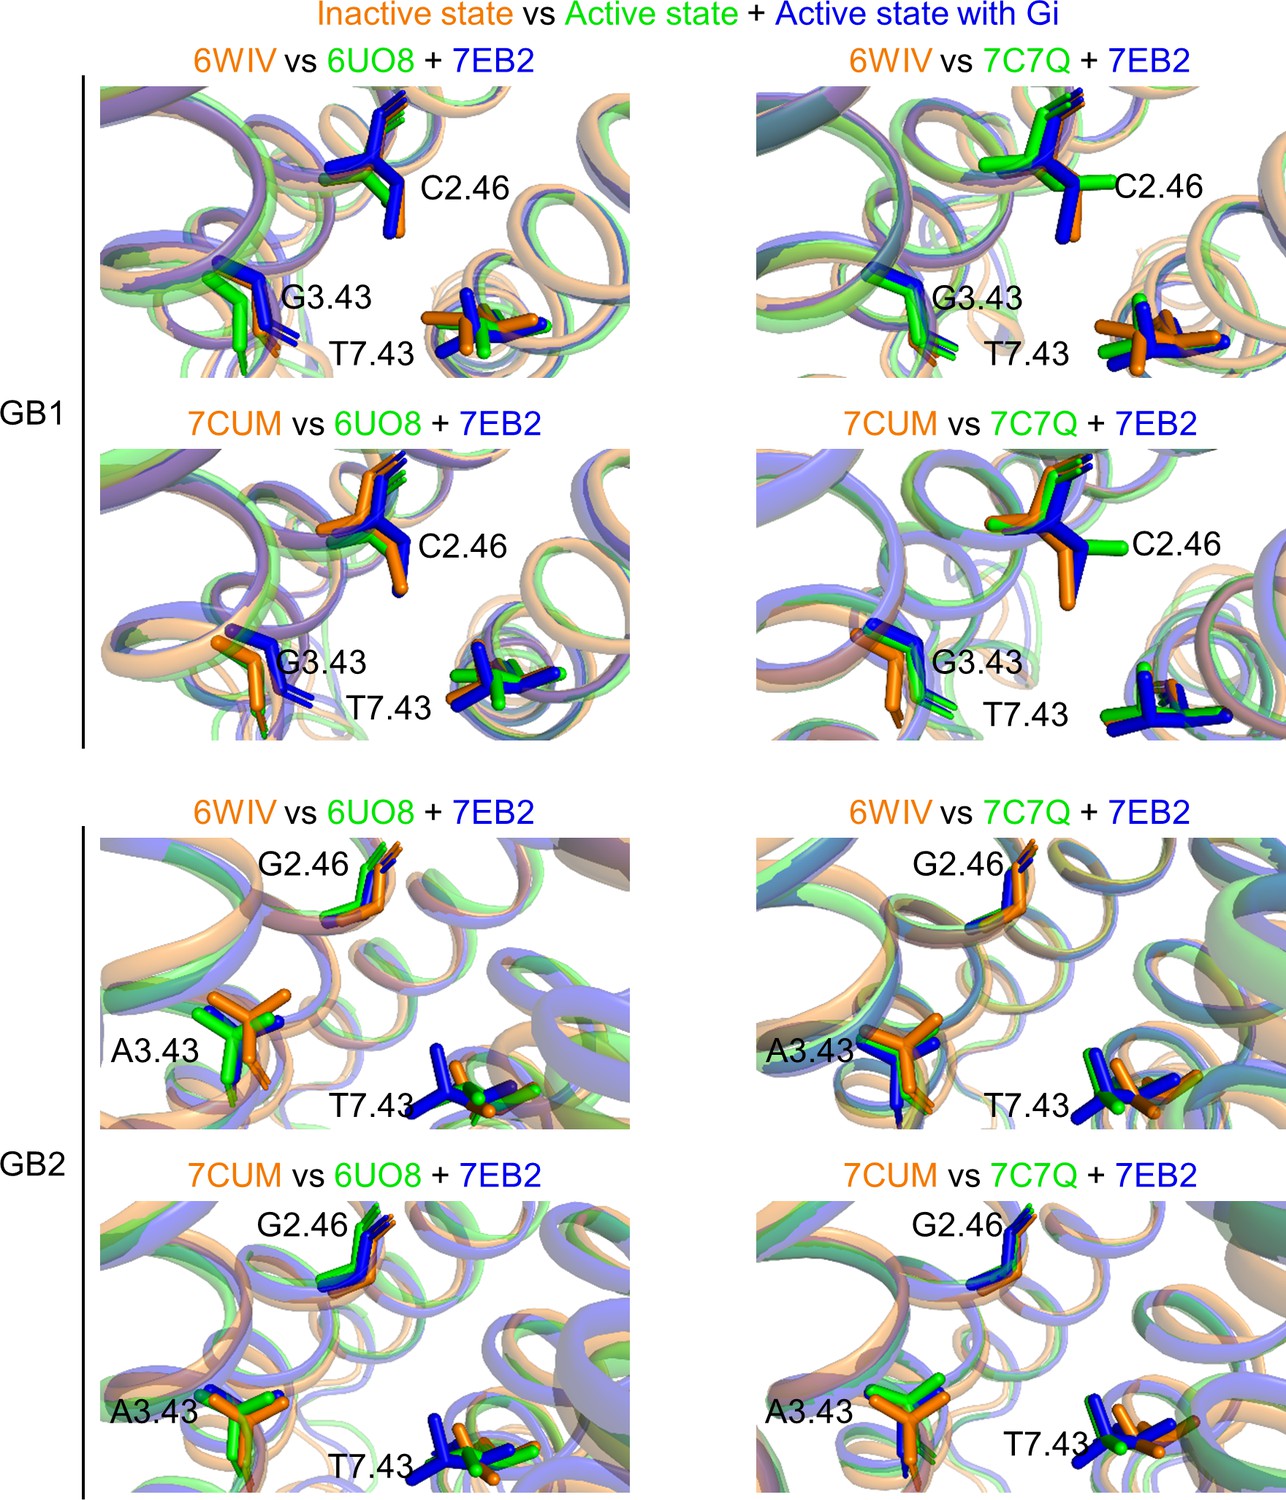
Rearrangements of the deep regions between the inactive and active states of the GABAB receptor.
The two inactive structures (6WIV and 7CUM, in orange) are superposed with the three active ones (6UO8 and 7C7Q in green, 7EB2 in blue) for GB1 TMD (top panel) and GB2 TMD (lower panel).
Figure 6
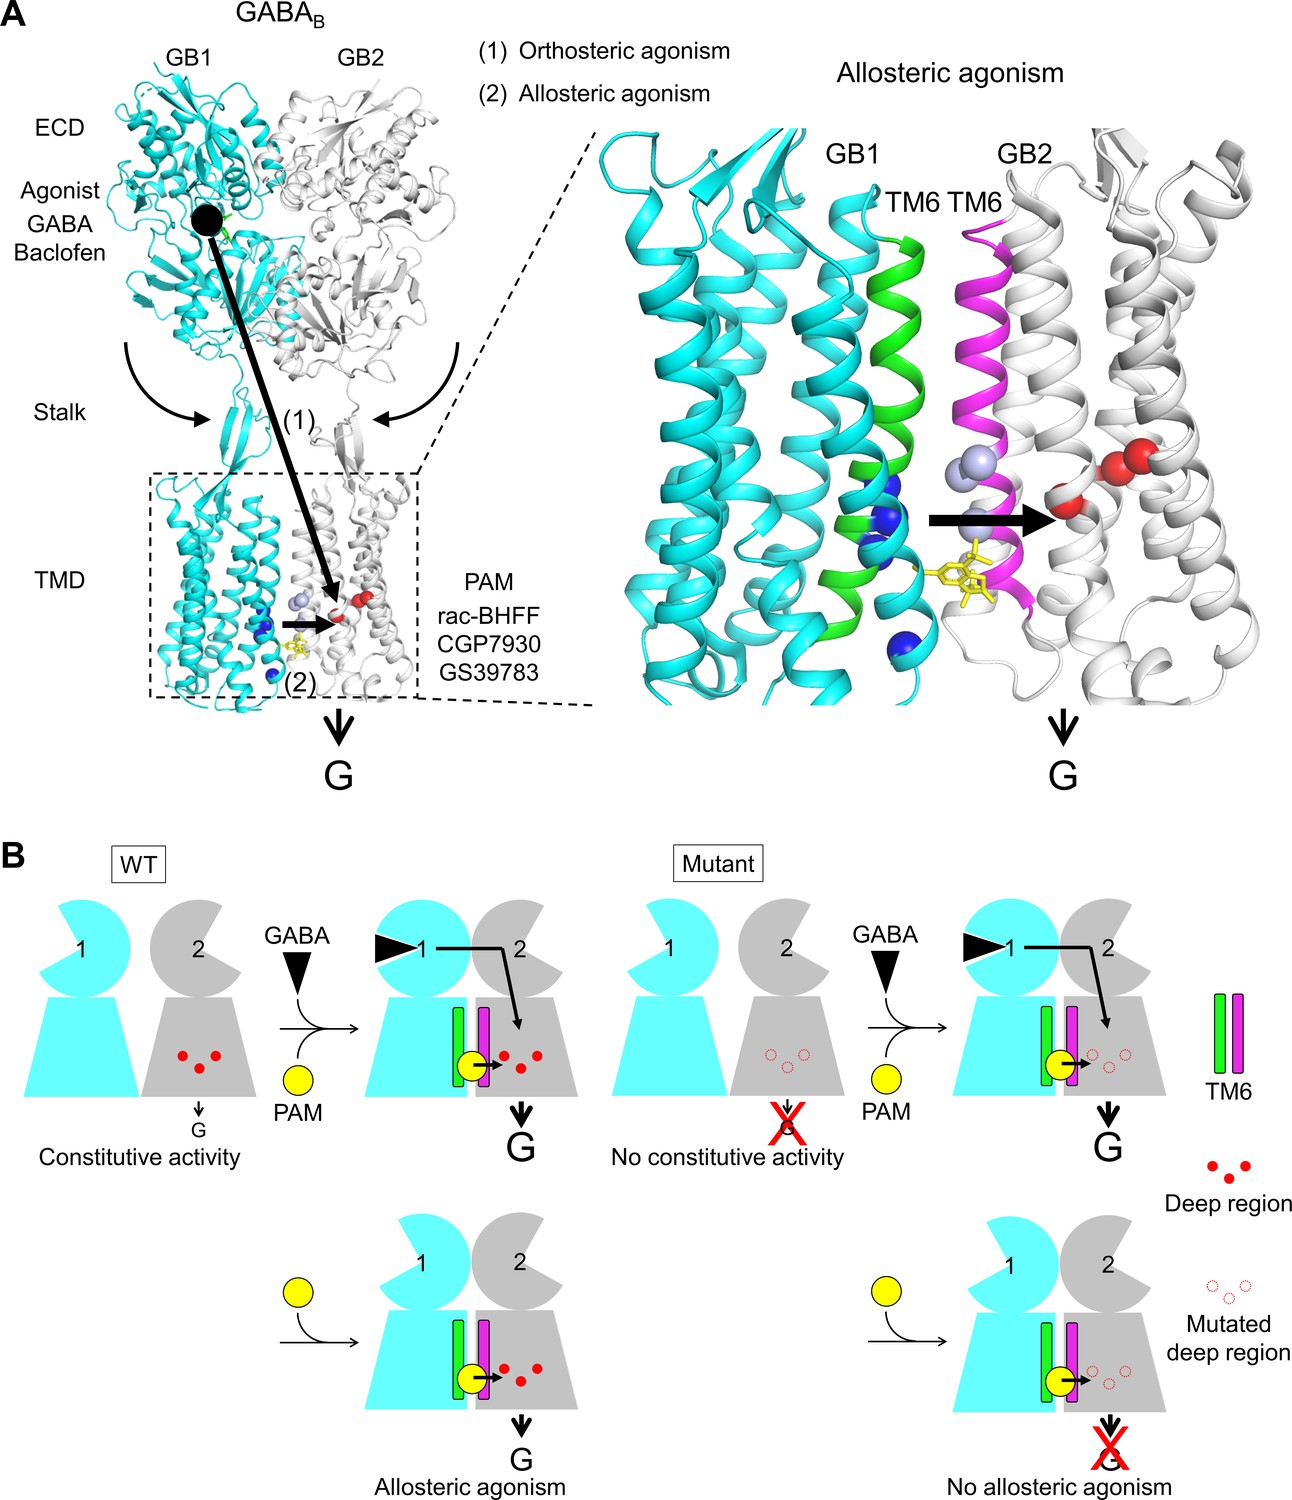
Molecular mechanism of GABAB receptor activation and allosteric modulation.
(A) The orthosteric agonists bind within the GB1 VFT and induce a rearrangement of ECD dimer. This conformational change stabilizes the active state of GB2 transmembrane domain (TMD) via both the stalk of GB2 and the interactions between the two TMDs through the TM6 dimer interface. This interface in the active state is further stabilized by the positive allosteric modulators (PAMs), then enhancing the potency and affinity of the orthosteric agonists. In the present study, we show that allosteric agonism requires a region (residues in red) responsible for basal activity of the receptor. (B) This molecular mechanism is further illustrated by pictograms with the WT receptor and with the mutated GB2 TMD deep region. These cartoons further highlight the GB1 TMD that is proposed to serve as a lever for the activation of the receptor both by orthosteric agonists and PAMs.
Additional files
-
Supplementary file 1
Allosteric agonist activity of the positive allosteric modulators (PAMs) on the wild-type GABAB receptor.
Data represent the means ± SEM of (n) independent experiments. ****p<0.0001 (one-way ANOVA test); N.A., not applicable; nH, Hill slope.
- https://cdn.elifesciences.org/articles/70188/elife-70188-supp1-v3.docx
-
Supplementary file 2
Allosteric modulation of the positive allosteric modulators (PAMs) on the indicated GABAB receptor constructs.
Intracellular Ca2+ responses mediated by the indicated constructs upon stimulation with GABA in the absence or presence of the indicated concentrations of a PAM. Data represent the means ± SEM of (n) independent experiments. *p<0.05, **p<0.005, ***p<0.0005, ****p<0.0001 (one-way ANOVA test); nH, Hill slope.
- https://cdn.elifesciences.org/articles/70188/elife-70188-supp2-v3.docx
-
Supplementary file 3
Allosteric agonist activity of rac-BHFF on the indicated 984 GABAB receptor constructs.
Intracellular Ca2+ responses mediated by the indicated constructs upon stimulation with rac-BHFF. Data represent the means ± SEM of (n) independent experiments. ***p<0.0005, ****p<0.0001 (one-way ANOVA test); N.A., not applicable; nH, Hill slope.
- https://cdn.elifesciences.org/articles/70188/elife-70188-supp3-v3.docx
-
Transparent reporting form
- https://cdn.elifesciences.org/articles/70188/elife-70188-transrepform1-v3.docx
Download links
A two-part list of links to download the article, or parts of the article, in various formats.
Downloads (link to download the article as PDF)
Open citations (links to open the citations from this article in various online reference manager services)
Cite this article (links to download the citations from this article in formats compatible with various reference manager tools)
Allosteric ligands control the activation of a class C GPCR heterodimer by acting at the transmembrane interface
eLife 10:e70188.
https://doi.org/10.7554/eLife.70188


