A novel and accurate full-length HTT mouse model for Huntington’s disease
- Department of Neuroscience, Weill Cornell Graduate School of Medical Sciences, United States
- The MOE Key Laboratory of Cell Proliferation and Differentiation, School of Life Sciences, Peking University, China
- The Russell H. Morgan Department of Radiology and Radiological Sciences, Johns Hopkins University School of Medicine, United States
- Innovation Center for Neurological Disorders, Department of Neurology, Xuanwu Hospital Capital Medical University, National Center for Neurological Disorders, China
- Department of Computer Science, New York Institute of Technology, United States
- Division of Neurobiology, Department of Psychiatry and Behavioral Sciences; Solomon H.Snyder Department of Neuroscience, Johns Hopkins University School of medicine, United States
Figures
Figure 1

Generation of BAC226Q transgenic mice.
(A) Schematic diagram of the insertion of the full-length human mutant HTT BAC into mouse genome. The human HTT BAC contains 170 kb genomic DNA of complete HTT genomic locus plus approximately 20 kb 5′ and 50 kb 3′ flanking region with endogenous regulatory elements. A mixed CAA-CAG repeat encoding 226 polyQ was engineered in exon 1. By whole-genome sequencing, two copies of the human mHTT BAC had been detected and inserted into the mouse genome at Chr8:46084002. (B) Western blot analysis of Htt protein expression levels in BAC226Q, non-transgenic littermate and BACHD (97Q) mice with antibody 1C2. The whole-brain lysates are from 2- to 11-month BAC226Q, 11-month non-transgenic littermate and BACHD mice. Western blots were repeated in three independent cohorts of mice. The upper panel: arrows indicate that 1C2, an antibody specific for mutant Htt, detects mHtt in BAC226Q and BACHD (97Q) mice but not non-transgenic littermate. In the second lane from the left, mHtt-97Q from BACHD (97Q) mouse appeared at the expected molecular weight. In the right two lanes, mHtt-226Q from 2- to 11-month BAC226Q mice are detected at a molecular weight higher than that of mHtt-97Q. Lower panel: the same blot was probed with anti-β-actin antibody for the loading control. (C) Reconfirmation by Western blot with the S830 antibody specific for mHtt in 4-month non-transgenic control, BAC226Q and BACHD (97Q) mice. S830 antibody detected mHtt-97Q in BACHD (97Q) mouse (right lane) and mHtt-226Q (middle lane) at expected molecular weights but not in non-transgenic control (left lane).
Figure 2
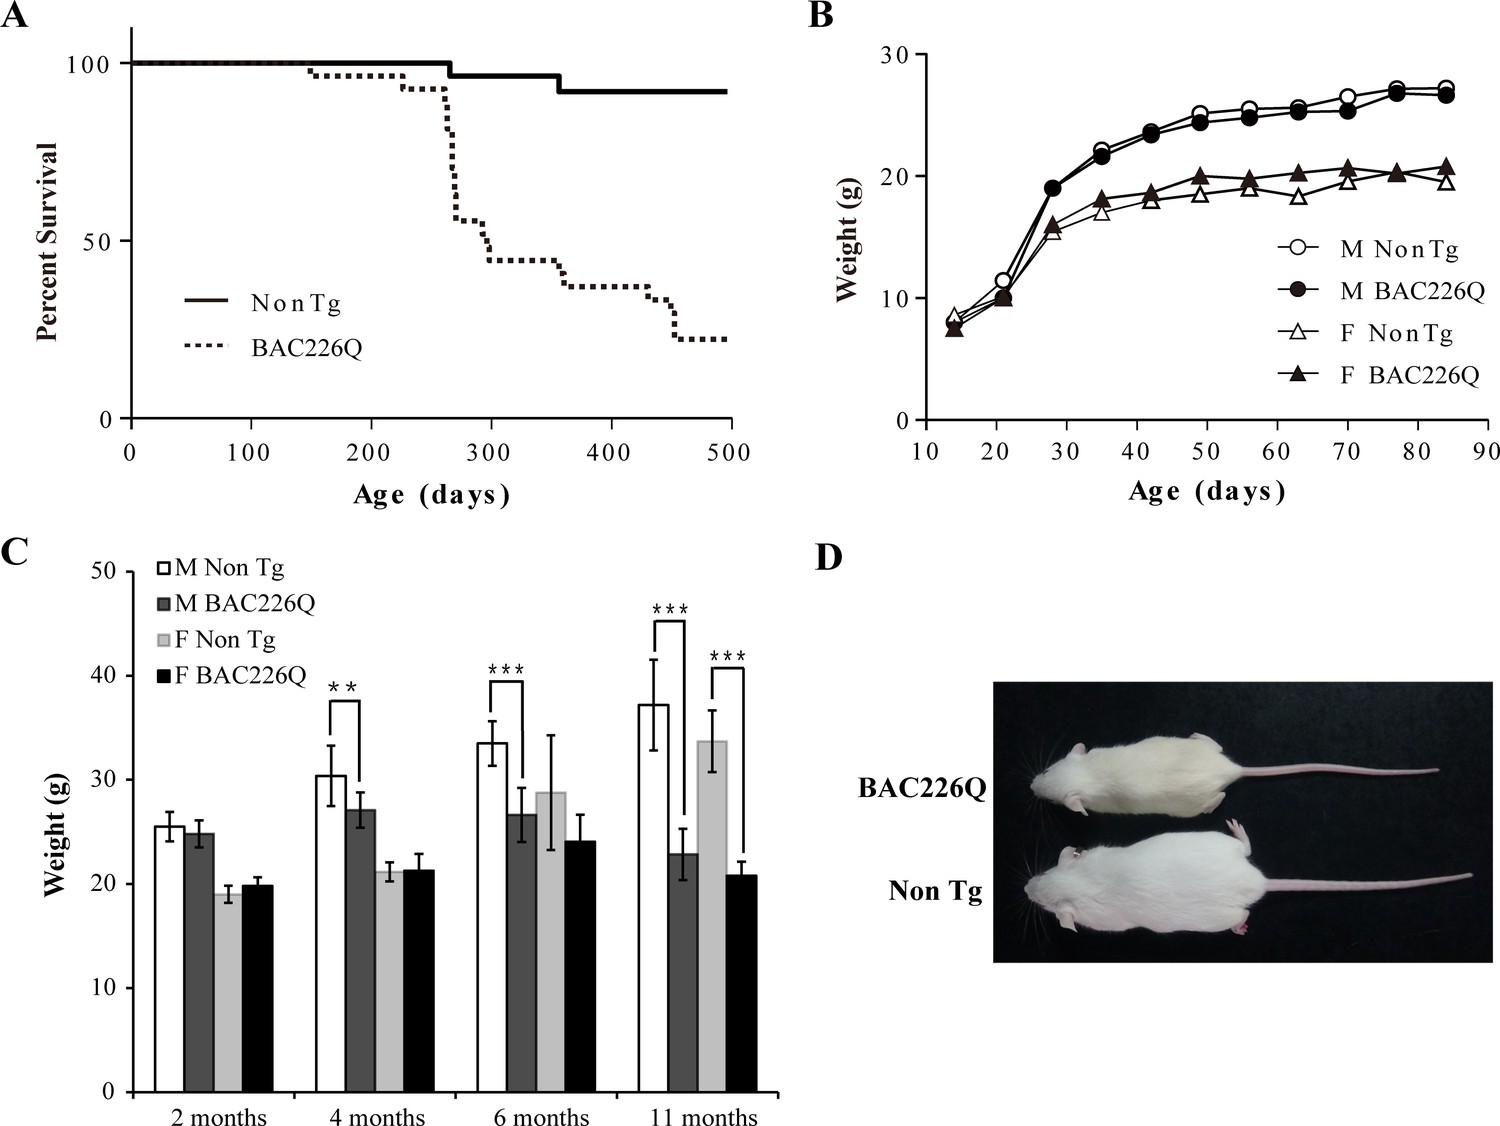
Shortened life span and weight loss in BAC226Q mice.
(A) Kaplan-Meier survival curves indicate a median life span of less than 1 year for BAC226Q mice (male BAC226Q n=16; female BAC226Q n=11; male Non Tg n=19; female Non Tg n=19). (B) In the developmental stage, male and female BAC226Q mice gained weights at the same rate as their non-transgenic littermates (male BAC226Q n=8; male Non Tg n=10; female BAC226Q n=8; female Non Tg n=7). Fit a growth curve model to the mice, BAC226Q and non-transgenic littermates gained weights at the same rate (male 0.381±0.060 g/day, p=0.7123; female 0.156±0.035 g/day, p=0.09). (C) Progressive and age-dependent weight loss in BAC226Q mice. After normal development, BAC226Q mice had progressive weight loss compared to non-transgenic littermate controls: at 2 months (male BAC226Q n=8; male Non Tg n=10; p=0.3910; female BAC226Q n=8; female Non Tg n=7, p=0.1930); at 4 months (male BAC226Q n=10; male Non Tg n=13; p=0.0046; female BAC226Q n=8; female Non Tg n=6, p=0.8988); at 6 months (male BAC226Q n=22; male Non Tg n=20; p=1.6061e−11; female BAC226Q n=10; female Non Tg n=11, p=0.0884); at 11 months (male BAC226Q n=22; male Non Tg n=22; p=1.4608e−17; female BAC226Q n=6; female Non Tg n=8, p=1.9311e−06). Student’s t-test was applied in all analyses. (D) Representative body sizes of 11-month-old male BAC226Q mouse and non-transgenic littermate. Significance is indicated by *=p<0.05, **=p<0.01, ***=p<0.001.
Figure 3

Robust, early onset, and progressive motor deficits in BAC226Q mice.
(A, B) Horizontal and vertical activities are measured by total beam breaks in 1 hr in the open field. In horizontal movement, 4-month BAC226Q mice developed robust hyperactivity (p=3.7366e−06) (A). In vertical movement, BAC226Q mice had progressively diminished activity (2 months p=0.39450; 4 months p=0.00007; 10 months p=0.0015; 15 months p=0.00072) (B). (C–E) Results of the cylinder task at 2 and 4 months. Rearing frequency, the total number of rears observed during the 5-min task, is unchanged in BAC226Q mice (2 months p=0.3889; 4 months p=0.7016) (C). Rearing time, the total time of mice in an upright rearing position, is greatly reduced in BAC226Q mice at 4 months (p=0.00002) (D). Circling frequency, the total number of clockwise and counterclockwise rotations, is obviously increased in BAC226Q mice at 4 months (p=0.0013) (E). Student’s t-test was applied in (A–E), and significance is indicated by ∗=p<0.05, ∗∗=p<0.01 and ∗∗∗=p<0.001. (F) Rotarod performance was averaged over three trials, performed once a week. BAC226Q mice showed progressive and significant deficits (13 weeks p=0.0004; 14 weeks p=0.0004; 15 weeks p<0.0001; 16 weeks p<0.0001); Two-way ANOVA with post hoc Sidak’s multiple comparisons test, with a significant genotype and age interaction (F (8, 180)=5.805, p<0.0001). All tests used 11 pairs of BAC226Q mice and non-transgenic littermates.
Figure 4
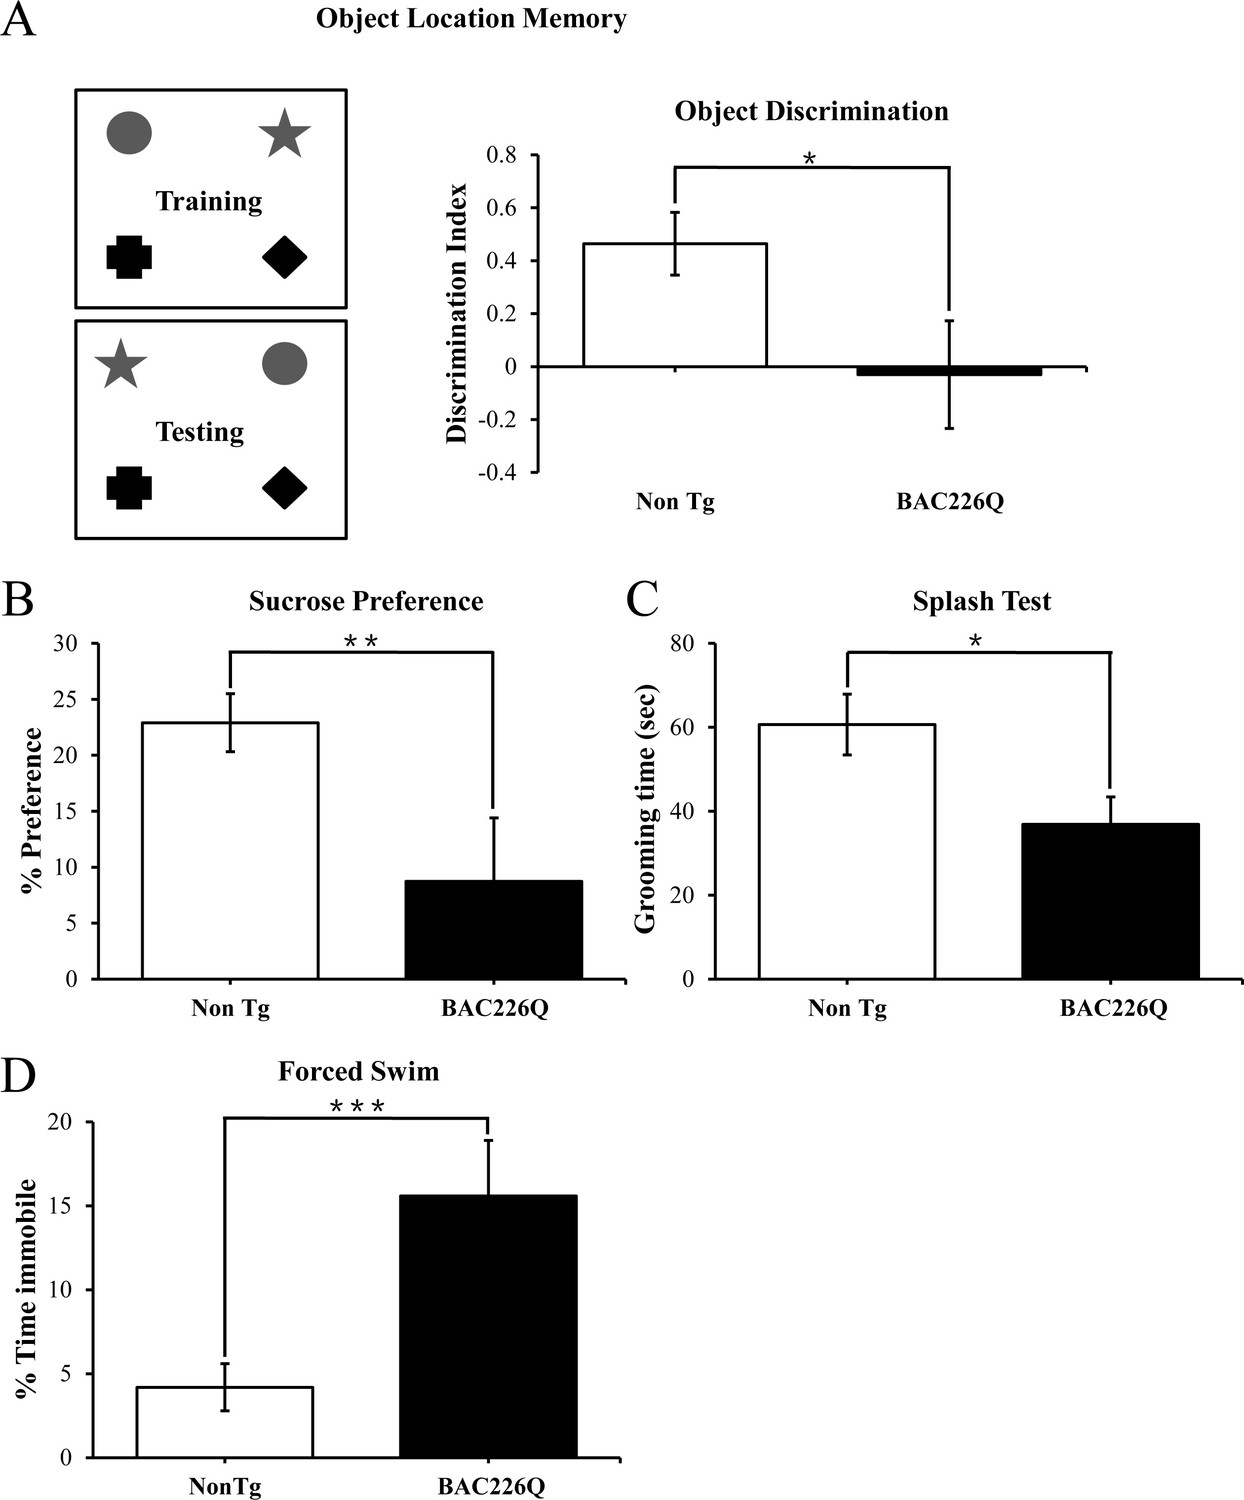
Cognitive and psychiatric disorder-like behavior in BAC226Q mice.
All tests used 12 pairs of 2-month-old male BAC226Q mice and non-transgenic littermates. BAC226Q mice showed significant deficits in (A) significant decrease in discrimination of moved objects (p=0.0485), (B) significant decrease in sucrose preference (p=0.0031), (C) significant decrease in grooming time in the splash test (p=0.035), (D) significant increase in the immobile time in the forced swim test (p=0.0007). Student’s t-test was applied in all analyses. Significance is indicated by *=p<0.05, **=p<0.01, ***=p<0.001.
Figure 5

Histopathology of striatal atrophy and neuronal loss in BAC226Q mice.
(A) Representative micrographs of NeuN stained serial brain sections for 11-month BAC226Q and non-transgenic littermates. (B) Progressive and age-dependent brain weight loss in BAC226Q mice. With the normal development, brain weights of BAC226Q mice is similar to non-transgenic littermates at 2 months (BAC226Q 0.473±0.005 g; Non Tg 0.480±0.010 g, n=3 pairs; p=0.373901). Brain weights of BAC226Q mice were significantly reduced at 11 months (BAC226Q 0.408±0.023 g, Non Tg 0.485±0.035 g, reduced by 15.9%; BAC226Q n=9, Non Tg n=15; p=0.00026), and more severe at 15 months (BAC226Q 0.495±0.013 g, Non Tg 0.341±0.007 g, reduced by 31.0%; n=4 pairs; p=0.00019). (C, D) Striatal atrophy was measured by the Cavalieri stereological estimator. Compared to the non-transgenic littermates, BAC226Q at 2 months had no defects in striatal (BAC226Q 16.556±0.007 mm3, Non Tg 16.167±1.091 mm3; n=3 pairs; p=0.84283) and ventricle volume (BAC226Q 0.345±0.014 mm3, Non Tg 0.351±0.007 mm3; n=3 pairs; p=0.81590). At 11 months, BAC226Q striatal volume was significantly decreased by 34% (BAC226Q 11.789±0.829 mm3, Non Tg 17.765±0.130 mm3; n=4 pairs; p=0.00544) (C), and lateral ventricle volume was increased by 379% (BAC226Q 1.765±0.281 mm3, Non Tg 0.369±0.067 mm3; n=4 pairs; p=0.01270) (D). (E) Total striatal neuron count was estimated by an optical dissector stereological estimator. No significant difference was detected at 2 months (BAC226Q 2,280,000±125,000, Non Tg 2,174,000±127,000; n=3 pairs), but a significant 18% decrease was detected in 11-month BAC226Q (BAC226Q 1,631,000±269,000,, Non Tg 1,988,000±193,000; BAC226Q n=6, Non Tg n=5, p=0.0002). In every subject counted, the estimated coefficient of error was less than 0.1. (F) In 11-month BAC226Q mice striatum, DARPP-32 staining of MSNs was reduced by 18.1% (n=4 pairs, p=0.0012) but no change in 2-month BAC226Q mice striatum. In all panels, Student’s t-test was applied in all analyses. Significance is indicated by ∗=p<0.05, ∗∗=p<0.01 and ∗∗∗=p<0.001.
Figure 6

MRI study of regional specific brain atrophy in BAC226Q mice.
(A) MRI images of 12-month female BAC226Q and non-transgenic littermates. (B–G) Overall brain volumes were segmented automatically into regional brain volumes by MRI volumetric analysis in BAC226Q mice (n=9) and non-transgenic littermates (n=6). The volumes are presented as the percentage of whole brain volume. BAC226Q mice have significant decreases in (B) whole brain volumes (28.5%, p=0.00022), (C) relative cortex volume (24.8%, p=0.0113) and (D) striatum (19.4%, p=0.0453), and significant increase in ventricle volume (E) (206.8%, p=0.0001). There is no significant difference between genotypes in (F) cerebellar (p=0.0618) and (G) amygdala volume (p=0.8229). (H) Total 28 brain regions were measured by MRI volumetric analysis. The changes of specific brain region volume in BAC226Q mice are presented as the percentage of the same brain area in non-transgenic littermates. In BAC226Q mice, 16 brain regions had significant volume changes (p<0.05). Student’s t-test was applied in all analyses. Significance is indicated by ∗=p<0.05, ∗∗=p<0.01 and ∗∗∗=p<0.001.
Figure 7
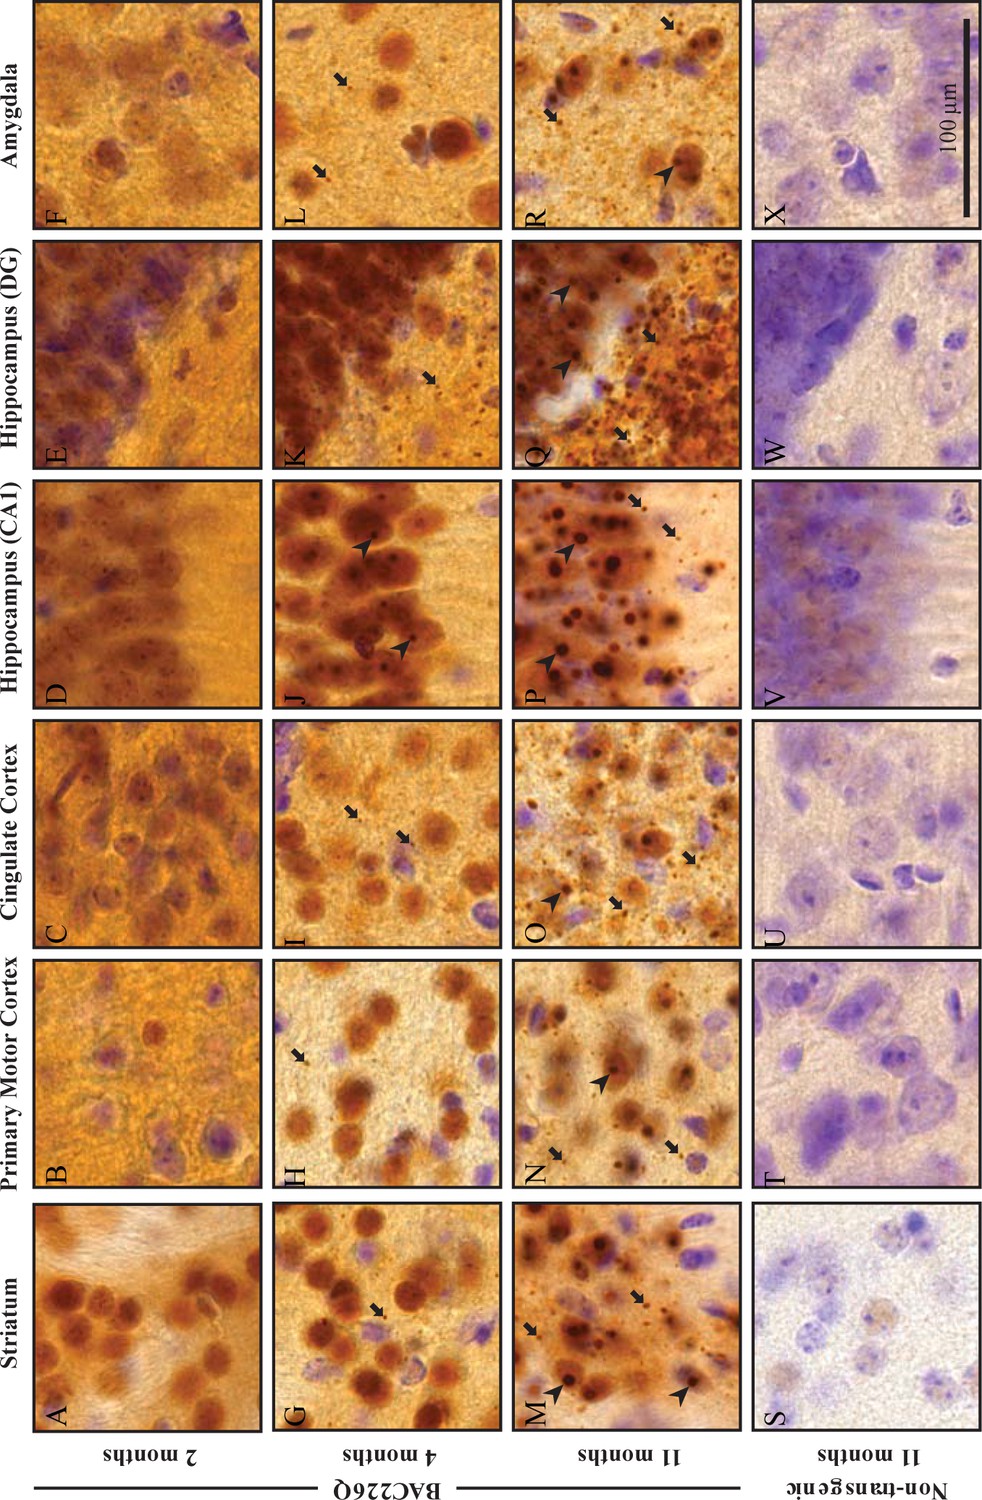
Widespread and progressive mHtt aggregate pathology in BAC226Q brain.
Huntingtin aggregates were stained by the S830 antibody. In BAC226Q, mHtt aggregates were undetectable at 2 months (A–F), detected as small aggregates (arrows) and nuclear inclusions (arrowheads) at 4 months (G–L), finally developed to large and numerous cytosolic aggregates and nuclear inclusions at 11 months (M–R). In contrast, no aggregates were detected in non-transgenic littermates (S–X). Regions shown are striatum (A, G, M, S), primary motor cortex (B, H, N, T), cingulate cortex (C, I, O, U), CA1 of hippocampus (D, J, P, V), dentate gyrus (E, K, Q, W), and amygdala (F, L, R, X). Scale bar, 100 µm.
Figure 8
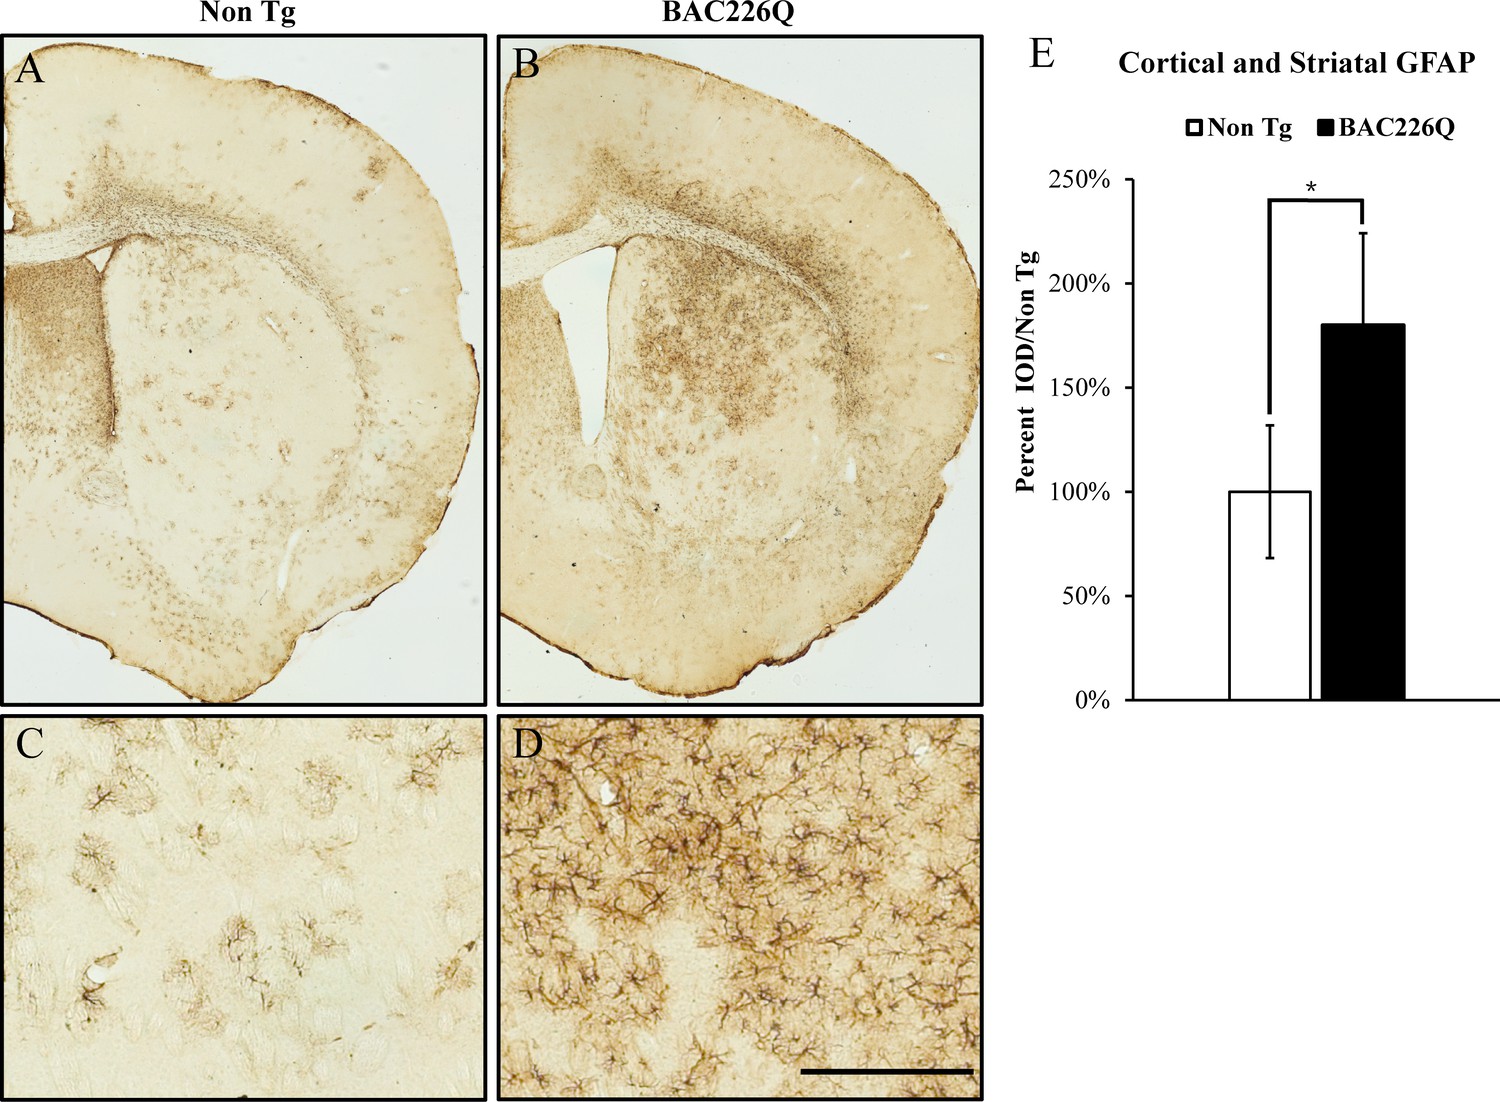
Gliosis in striatum and deep cortical layers of BAC226Q brain.
Reactive astrogliosis is analyzed by immunohistochemical staining with GFAP antibody in 11-month BAC226Q and non-transgenic littermate brains. Gliosis is prominent in BAC226Q (B, D), but not in control littermate brains (A, C) (n=4, p=0.032, Student’s t-test). Scale bar, 100 µm.
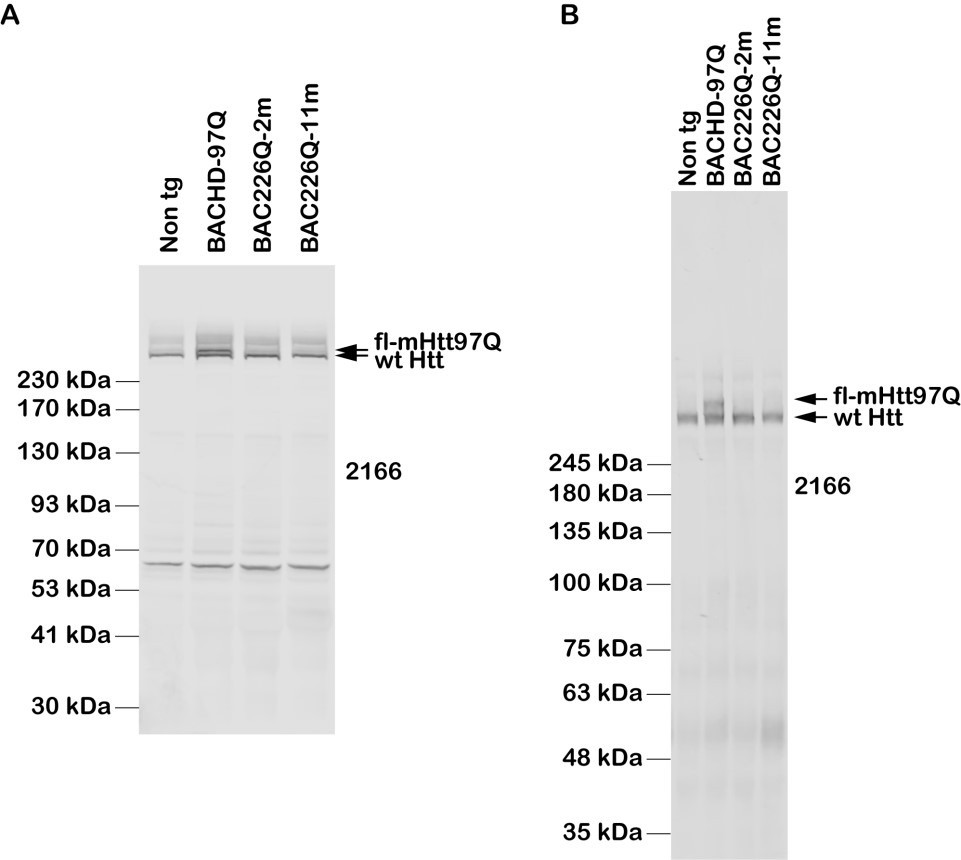
Author response image 1
Videos
Video 1
Chorea-like movement in BAC226Q mice at 14 weeks.
Video 2
Rapid circling behavior in BAC226Q mice at 16 weeks.
Video 3
Cylinder test in BAC226Q mice at 16 weeks.
Tables
Table 1
Recapitulation of cardinal HD phenotypes in BAC226Q mice.
| HD patients | BAC226Q mice | |
|---|---|---|
| Neuropathology | Brain atrophy | Yes |
| Neuron loss | Yes | |
| mHTT aggregations | Yes | |
| Reactive gliosis | Yes | |
| Progressivemotor deflclts | Chorea | Yes |
| Incoordination | Yes | |
| Dystonia | Yes | |
| Bradykinesia | Yes | |
| Non-motorsymptoms | Psychiatric symptoms | Yes |
| Cognitive deficits | Yes | |
| Reduced life span | Yes | |
| Weight loss | Yes | |
Additional files
Download links
A two-part list of links to download the article, or parts of the article, in various formats.
Downloads (link to download the article as PDF)
Open citations (links to open the citations from this article in various online reference manager services)
Cite this article (links to download the citations from this article in formats compatible with various reference manager tools)
A novel and accurate full-length HTT mouse model for Huntington’s disease
eLife 11:e70217.
https://doi.org/10.7554/eLife.70217


