Development and genetics of red coloration in the zebrafish relative Danio albolineatus
- Department of Biology, University of Virginia, United States
- Department of Biological Science, University of Tulsa, United States
- Department of Pathology and Immunology, Washington University School of Medicine, United States
- Department of Cell Biology, University of Virginia, United States
Figures
Figure 1
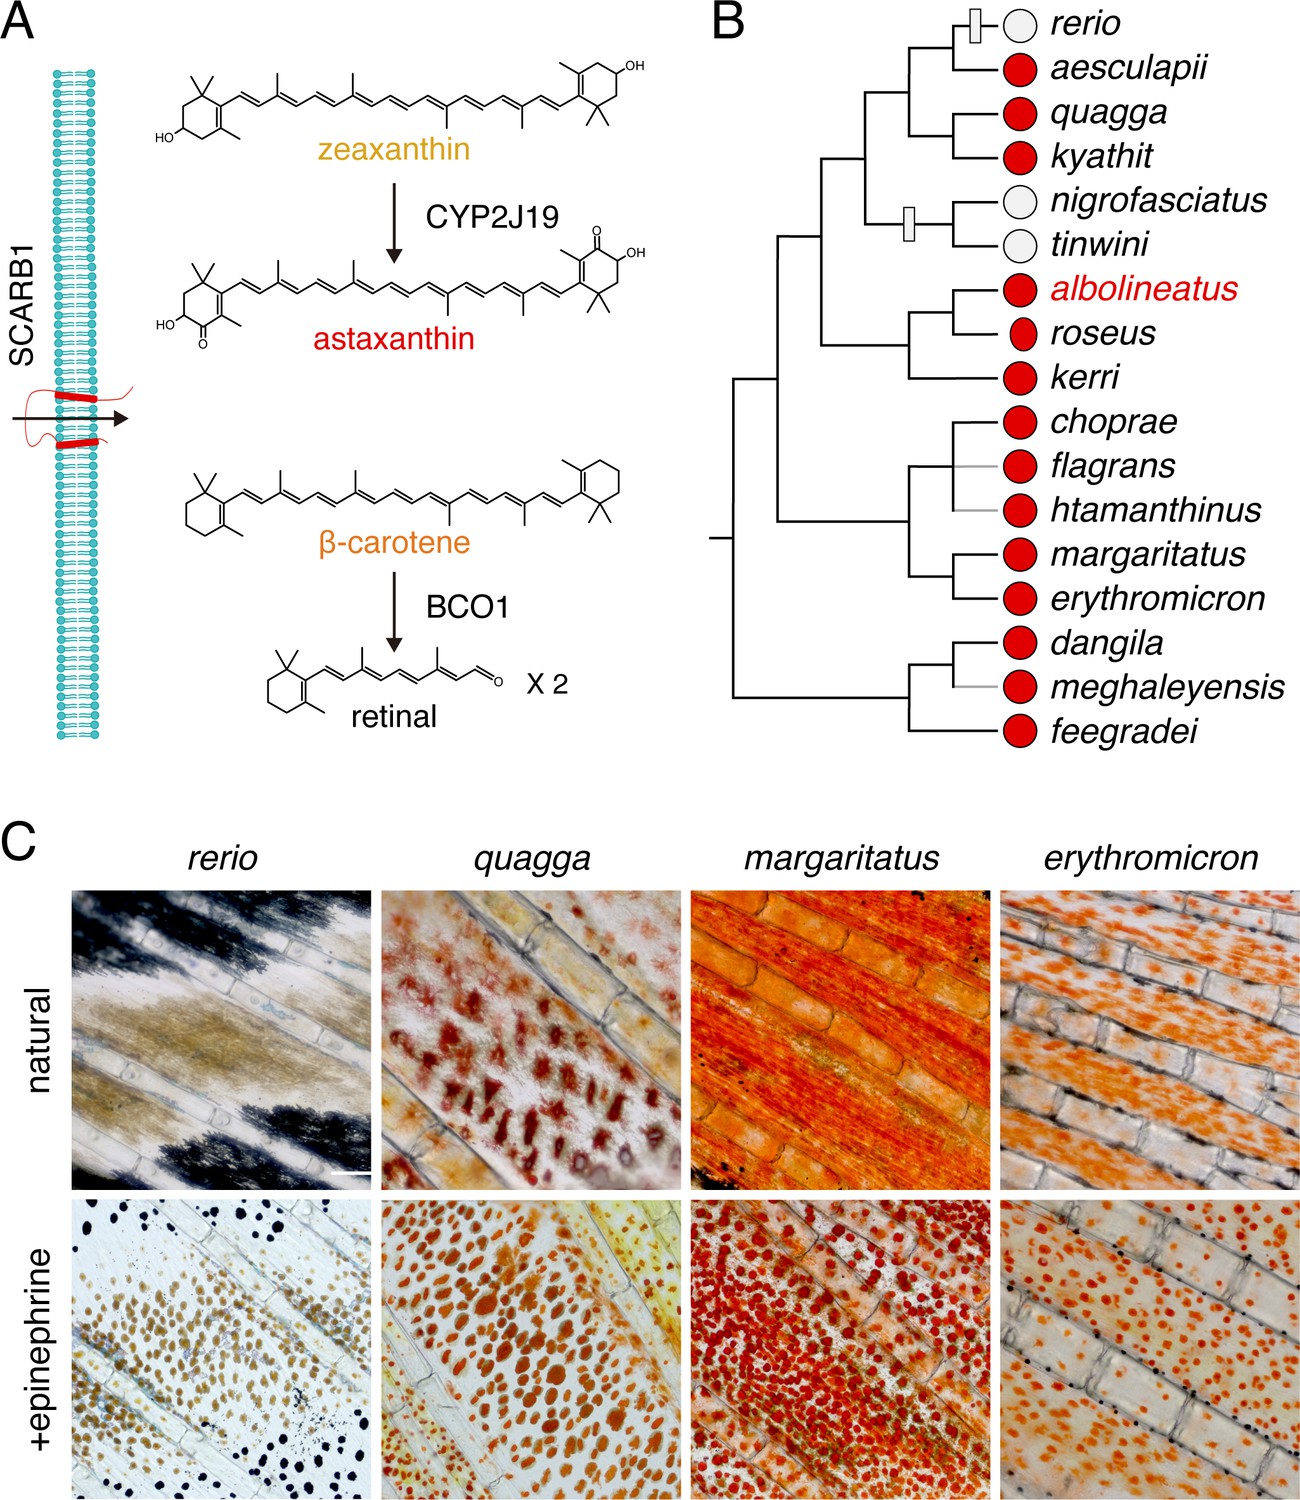
Carotenoid types and distribution of red erythrophores among Danio species.
(A) Examples of major carotenoid types including yellow zeaxanthin, red astaxanthin, and orange β-carotene, with factors required for entry into cells and chemical modification (Main text). (B) Erythrophore presence (red circles) or absence (light gray circles) indicated by direct observation or prior species descriptions (Fang and Kottelat, 2000; Quigley et al., 2005; Engeszer et al., 2007; Kullander and Fang, 2009; Kullander, 2012; Kullander and Norén, 2016; Spiewak et al., 2018; McCluskey et al., 2021). A composite phylogeny based on several molecular evolutionary studies is shown; gray branches indicate lineage placements inferred by morphology alone (Tang et al., 2010; Kullander, 2012; Kullander et al., 2015; McCluskey and Postlethwait, 2015). Gray boxes across branches indicate lineages in which erythrophores are inferred most parsimoniously to have been lost. (C) Anal fin details of zebrafish (rerio) without erythrophores and other species with erythrophores. Cells are shown in their typical native states, with pigment dispersed, and following treatment with epinephrine, which causes pigment to be contracted toward cell centers. Scale bar: 100 μm.
Figure 2 with 2 supplements
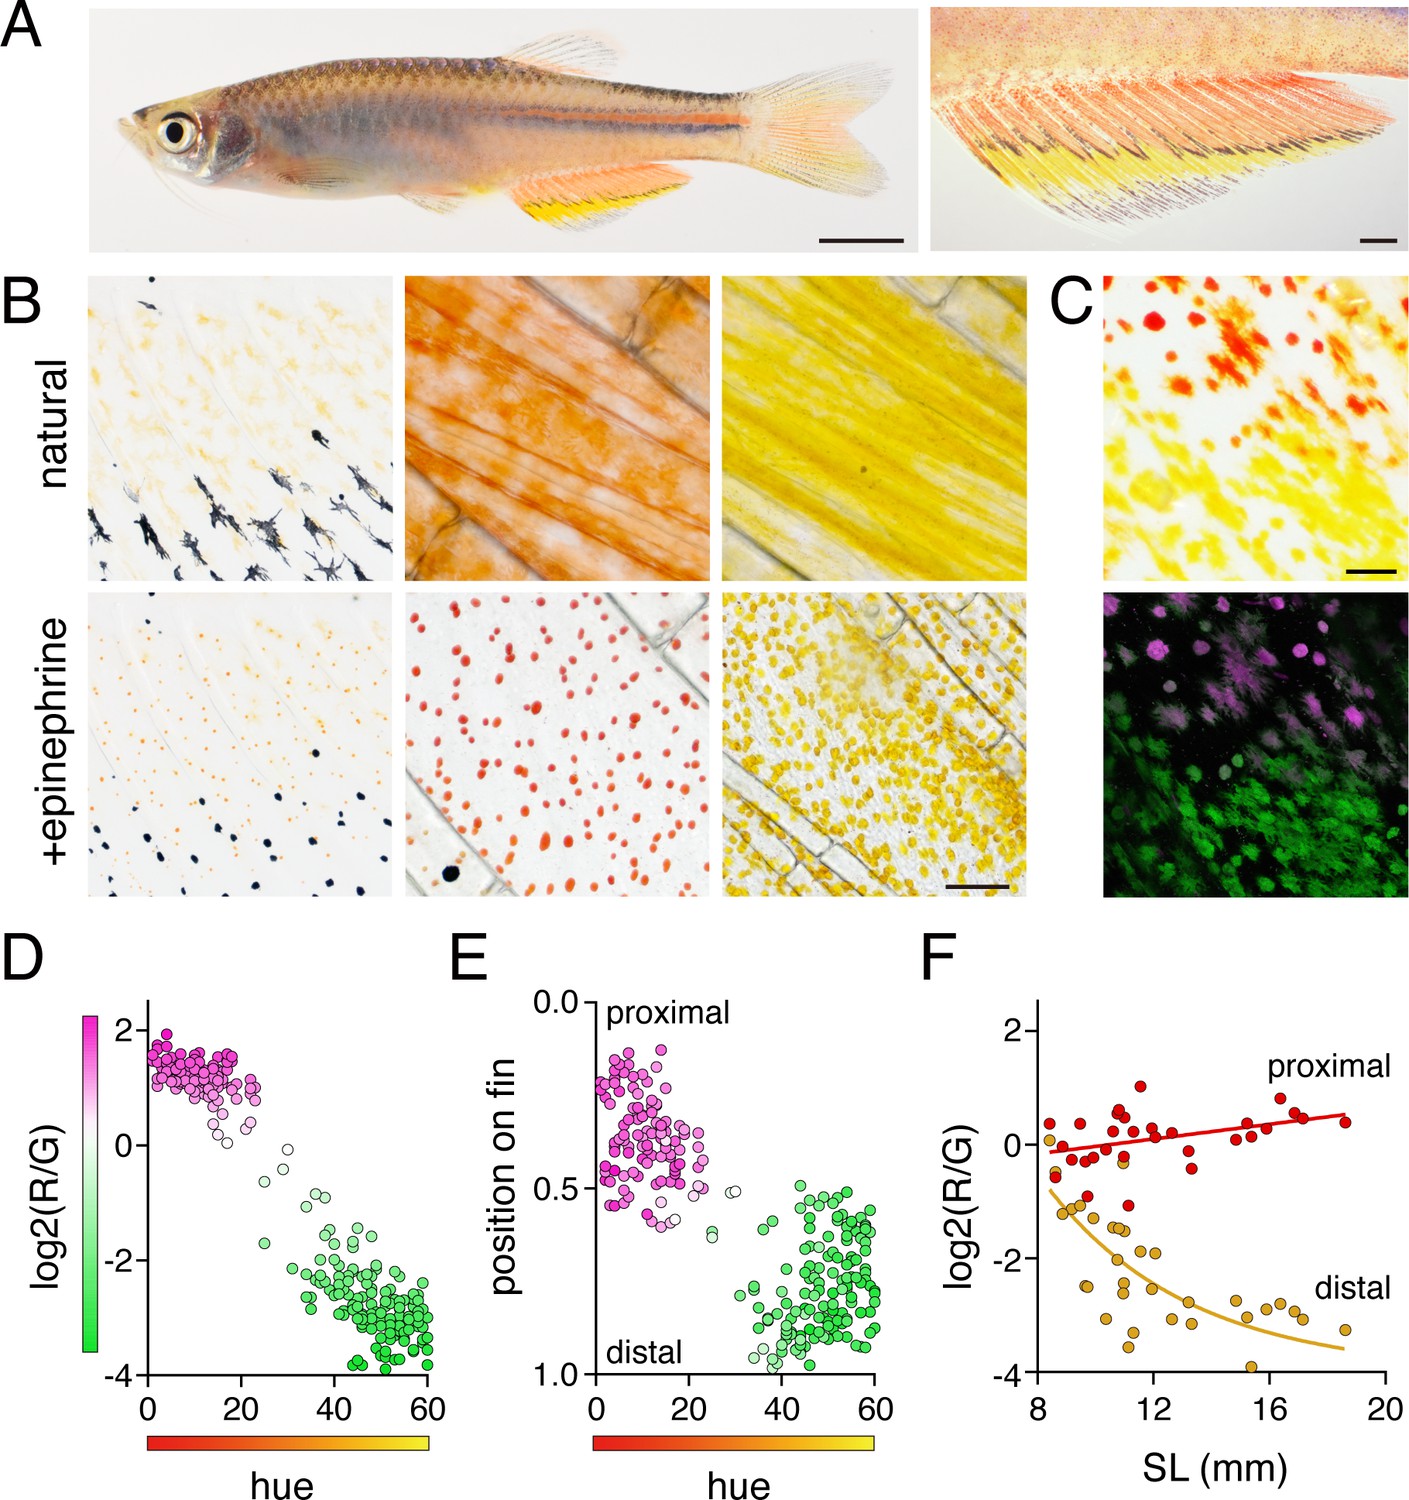
Anal fin pigment pattern of D. albolineatus and its ontogeny.
(A) Erythrophores were present on the body and were particularly evident on the anal fin (closeup at right), where these cells were found more proximally than yellow xanthophores. (B) At larval stages xanthophore-like cells with a uniform orange coloration occurred across the entire fin (left panels). Later in the adult, proximal red erythrophores and distal yellow xanthophores have distinct colors (middle and right panels). (C) Erythrophores and xanthophores had different spectra under epiflourescence. Erythrophores autofluorescenced in red (displayed in magenta) whereas xanthophores autofluoresced in green. (D) Hue values under brightfield illumination were correlated with ratios of red to green autofluorescence (R2 = 0.92, p < 0.0001). (E) Colors of cells varied across the proximodistal axis of the fin, shown as relative position with fin base at 0 and fin tip at 1. Erythrophores in proximal regions were distinct in both fluorescence ratio and visible hue from xanthophores in distal regions though some intergradation was evident in middle regions, near the melanophore stripe. N = 250 cells from five adult males in D and E. Color fills represent red to green fluorescence ratios. (F) During the larva-to-adult transformation, ratios of red to green autofluorescence diverged between prospective erythrophore and xanthophore regions. Individual red and yellow points correspond to mean values of cells in in proximal and distal regions, respectively, from each of 31 male or female fish (N = 620 cells total) imaged at a range of developmental stages represented by different standard lengths (SL). Scale bars: 5 mm (A, left), 1 mm (A, right); 25 μm (B, C).
Figure 2—figure supplement 1
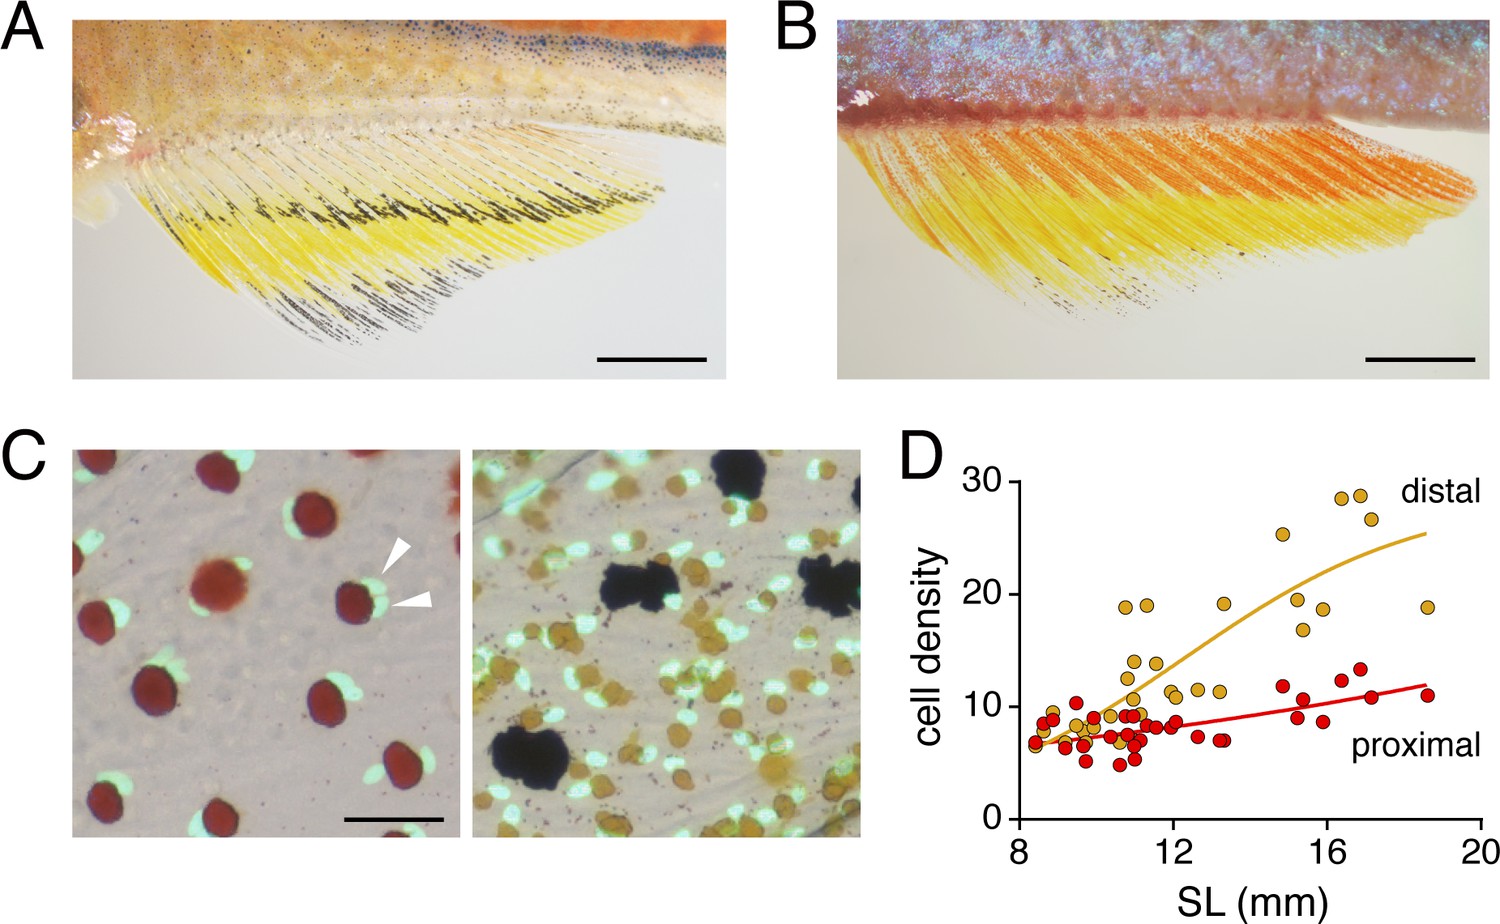
Sex and age differences in erythrophore pigmentation and occurrence of a binucleated state.
(A) Erythrophores of female fish were paler than erythrophores of male fish (compare to B and Figure 2A). (B) Melanophores stripes disappeared in older adult males (compared to Figure 2A). (C) Erythrophores (left) although not xanthophores (right) were often binucleated, here revealed by transgenic expression of nuclear-localizing aox5:nucEosFP (see Main text). Red and yellow pigments had been contracted towards cell centers by epinephrine treatment. Multiple nuclei are indicated by arrowheads. (D) Cell densities diverged in proximal and distal regions of the anal fin as fish and fins developed. SL, standard length. Shown are average of cells observed in three regions of 10–2 mm2 prospective erythrophore (proximal) or xanthophore (distal) regions of 31 fish representing a range of stages (N = 620 cells total). Scale bars: 2 mm (A, B); 50 μm (C).
Figure 2—figure supplement 2
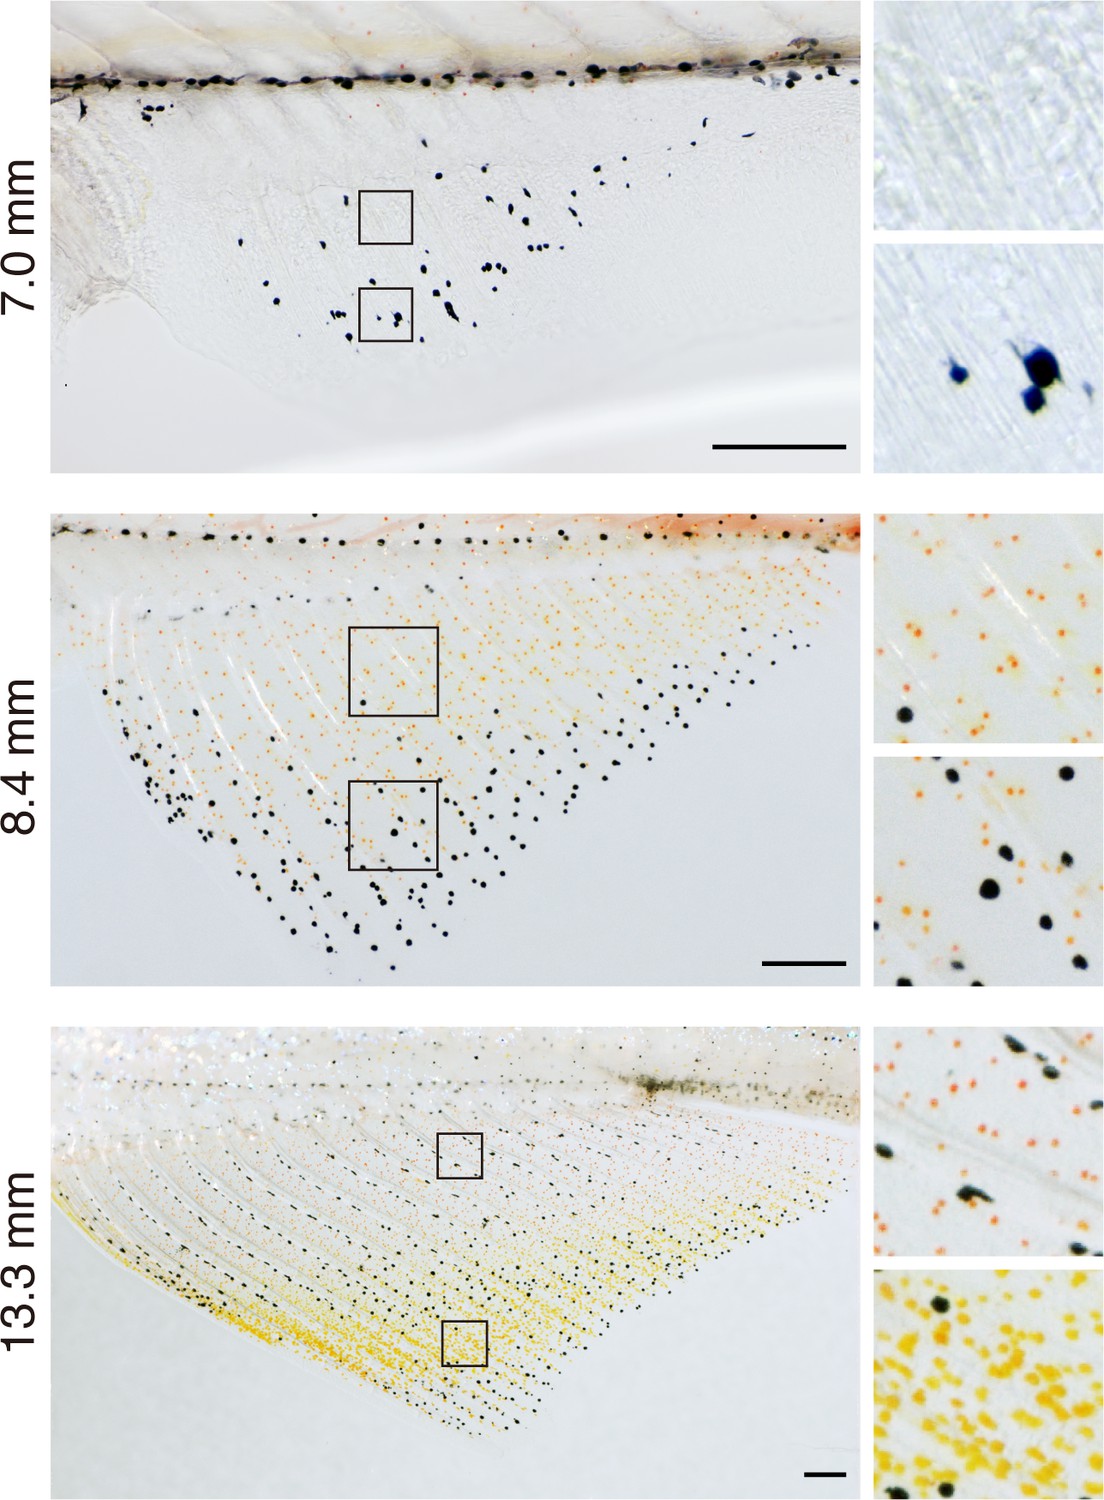
Pattern development in anal fins of larva to juvenile fish.
Melanophores were the first pigment cells evident (7.0 mm SL). Subsequently xanthophore-like cells with orange coloration were found across the fin except in distalmost regions that were enriched instead in melanophores (8.4 mm SL). With additional growth and development, proximal and distal cells diverged in cell color and density (13.3 mm SL), whereas melanophores consolidated into a stripe pattern centrally, as described previously (Goodrich and Greene, 1959). Colors of prospective erythrophores and xanthophores were indistinguishable prior to 12 mm SL. Scale bars: 200 μm .
Figure 3 with 1 supplement

Shared progenitor of fin erythrophores and xanthophores revealed by clonal analyses.
(A) In fish mosaic for somatically induced mutations in scarb1 most rare, wild-type clones consisted of both erythrophores and xanthophores (8 of 10 presumptive clones in seven fish, with remaining clones only containing one or the other cell type; an additional 56 fish derived from injected embryos either lacked wild-type cells or lacked mutant cells and were thus uninformative). (B) Clonal labeling of xanthophores and erythrophores with aox5:palmEGFP, illustrating flourescence, brightfield, and merged views of the same fields. In the clone shown here, an initial complement of several orange cells at the level of the melanophore stripe (d0, 7.5 mm SL) expanded to include more cells proximally and distally to the melanophore stripe that differentiated as erythrophores and xanthophores, respectively (d36, 15 mm SL; red arrowheads). For these analyses, limiting dilutions of aox5:palmEGFP were injected into ~500 embryos, yielding 271 embryos that exhibited some fluorescence at 3 days post-fertilization that were further sorted at 16 dpf, identifying 27 individuals with patches of expression in the anal fin. Of these 27 fish, one subsequently died and eight were found to have broad expression across the entire fin, likely representing multiple clones of uncertain boundaries, and so were excluded from analysis. The remaining 18 fish exhibited 24 spatially distinct, presumptive clones of aox5:palmEGFP-labeled cells, of which 22 presumptive clones contained both erythrophores and xanthophores as shown here [consistent with mixed clones of melanophores and xanthophores in zebrafish (Tu and Johnson, 2010; Tu and Johnson, 2011)]; one clone contained only erythrophores and one clone contained only xanthophores. (C) When aox5:nucEosFP+ cells on the body were bulk photoconverted before fin development, only unconverted aox5:nucEosFP+ cells (green nuclei) were present in the fin 4 days later (images representative of all N = 3 fish tested). (D) Successive steps in anal fin development and erythrophore/xanthophore lineage specification revealed many cells newly acquiring aox5:nucEosFP expression at daily intervals within the fin (green nuclei). Though some aox5:nucEosFP+ cells were present at the fin base these did not enter into the fin proper (white cells, arrowheads; images shown are from a single individual representative of all N = 7 fish tested in this manner over 23 days each). Scale bars: 200 μm (A, B); 100 μm (C, D).
Figure 3—figure supplement 1
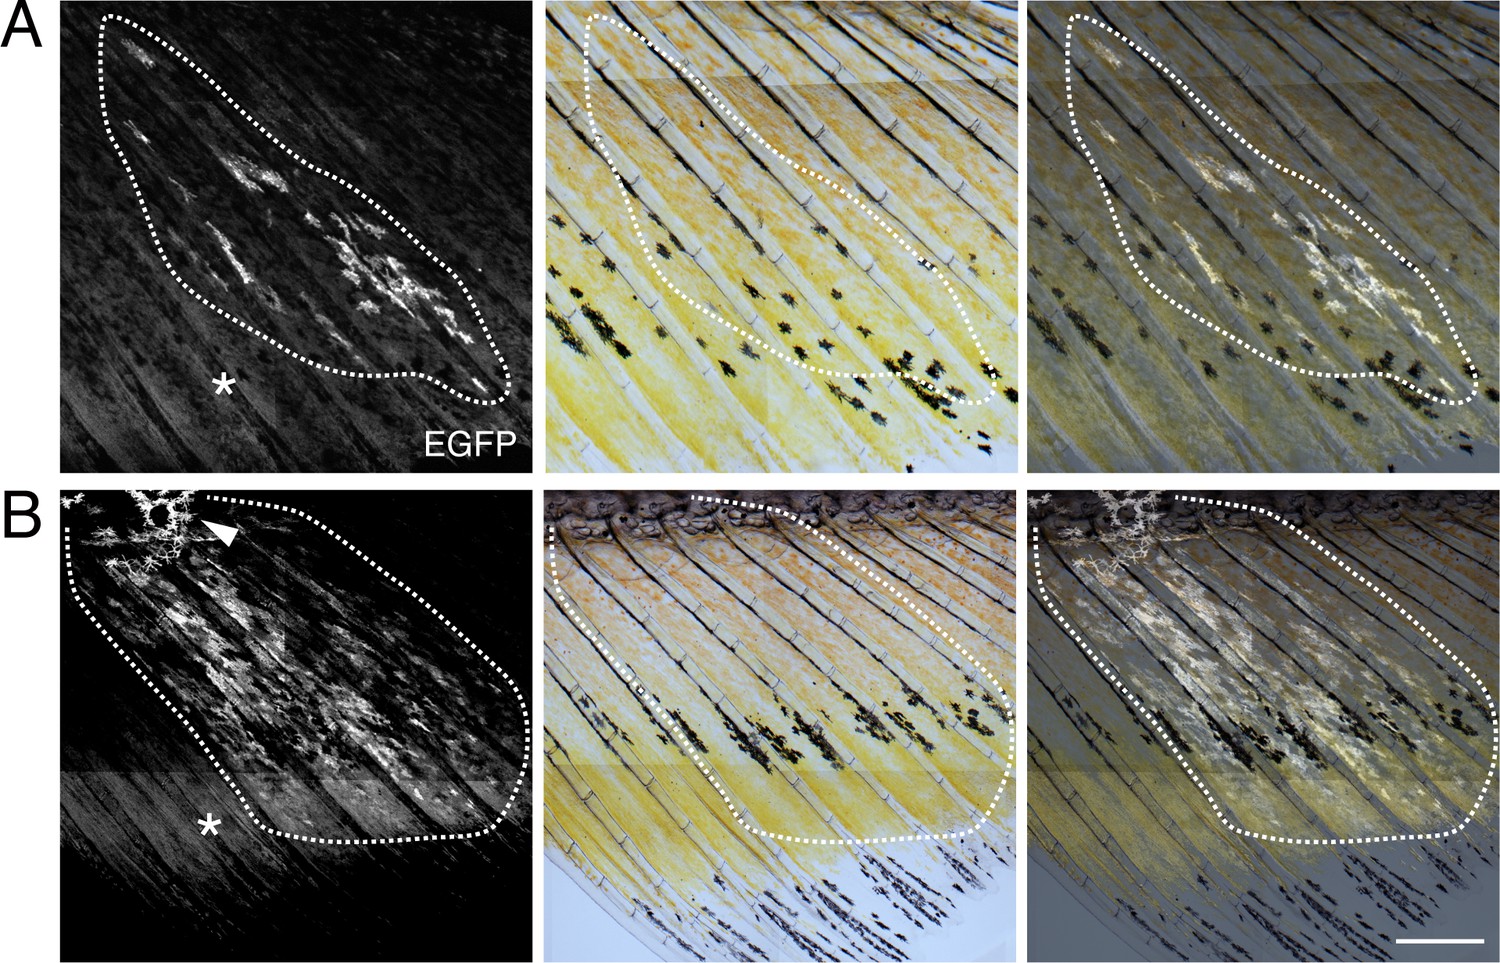
Transgene labeling of erythrophores and xanthophores.
A and B show additional examples of presumptive clones labeled by injection of limiting amounts of aox5:palmEGFP transgene. In each individual (36 days, 15 mm SL), EGFP+ cells were found across proximal to distal regions of the fin, contributing to erythrophore and xanthophore populations, respectively. Additional EGFP+ cells were evident on the body at the base of the fin (e.g. arrowhead in B). Asterisks indicate regions of xanthophore autofluorescence in EGFP channel. Images were assembled computationally from tiled acquisitions. Scale bar: 1 mm.
Figure 4 with 1 supplement
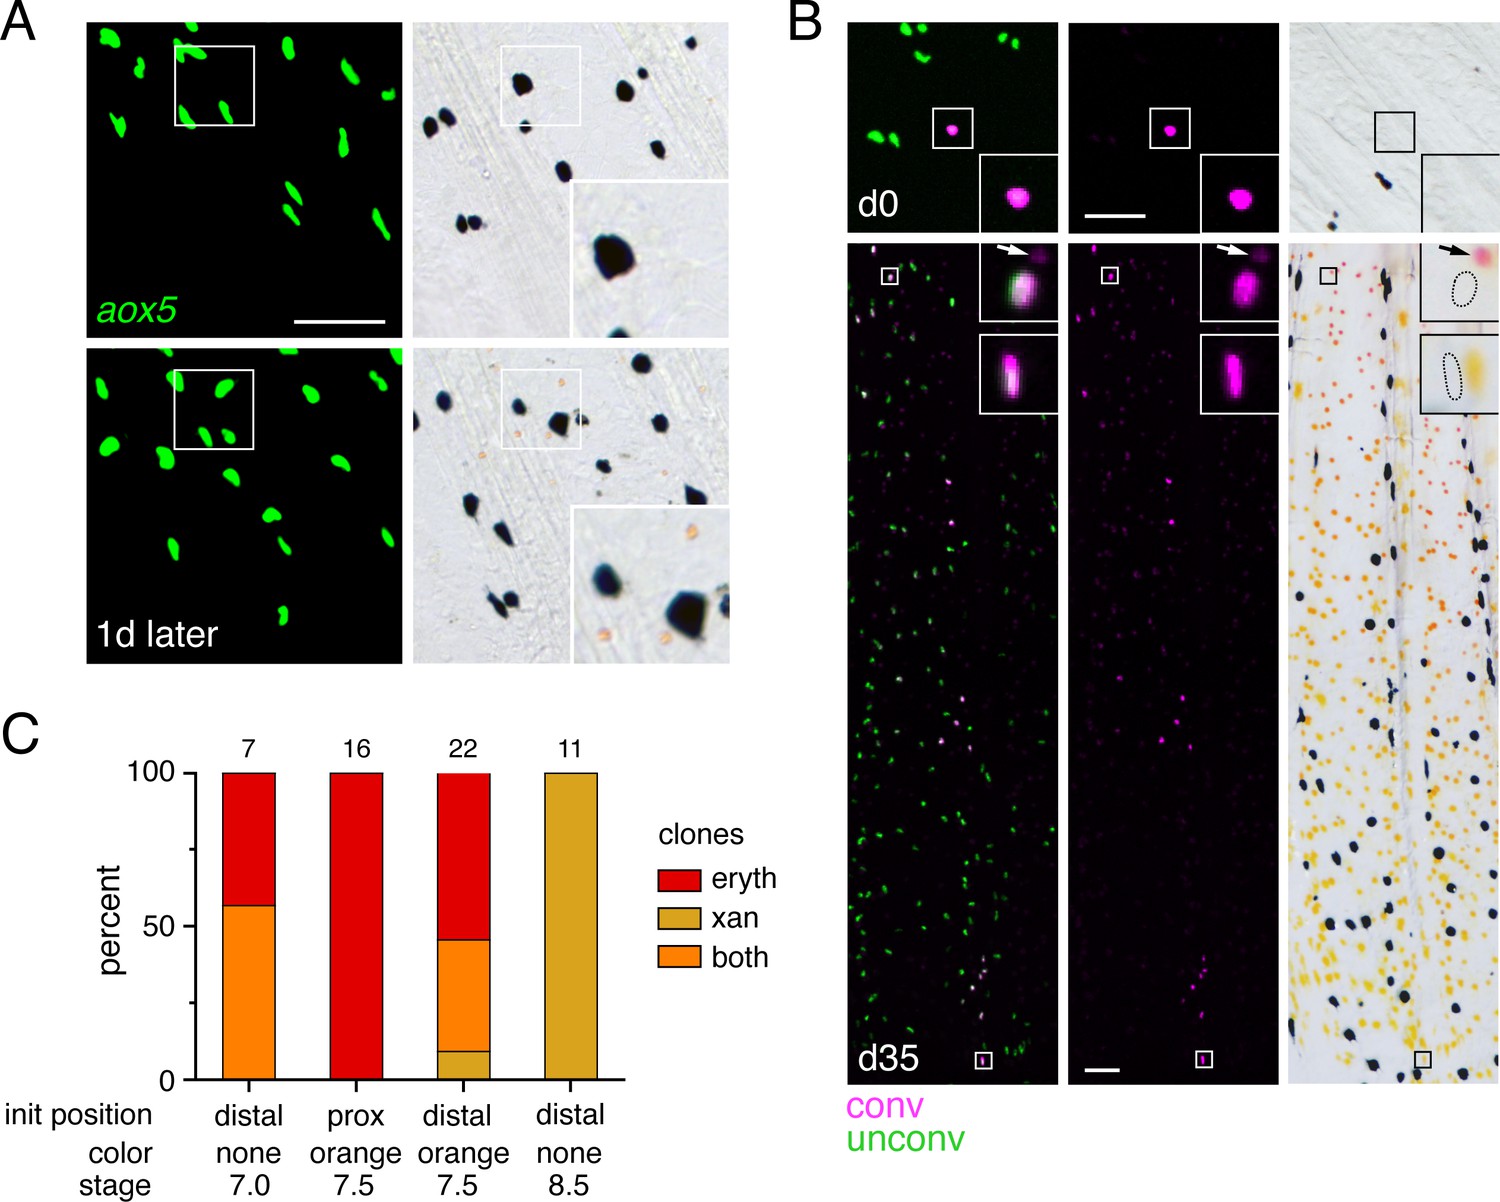
Bipotential precursor to erythrophores and xanthophores revealed in the fin by fate mapping.
(A) Unpigmented cells of the xanthophore lineage, marked by aox5:nucEosFP transgene expression (see Main text), present at 7.0 mm SL had acquired a pale orange color 1 day later. (Representative of all N = 7 fish examined by repeated imaging during larval development.) Insets show higher magnification images of a corresponding region. (B) Example of a photoconverted, initially unpigmented cell (d0, 7.0 mm SL) that yielded a clone containing both erythrophores and xanthophores (d35, 15.0 mm SL; representative of four of seven clones, with remaining clones containing erythrophores only). Fish were treated with epinephrine to contract pigment before imaging. Arrows indicate erythrophore autofluorescence from red carotenoid pigment, which accumulates adjacent to nuclei following epinephrine treatment; approximate positions of nucEosFP+ nuclei in brightfield images are shown with dashed outlines. Insets, proximal and distal cells in the clone. (C) Percentages of clones containing only erythrophores, only xanthophores, or both cell types. Numbers above bars indicate clone sample sizes examined. In these analyses pigment cells and progenitors stably expressed aox5:nucEosFP (7.5, 8.5 mm SL) or mosaically expressed a different transgene, mitfa:nucEosFP (7.0 mm SL), that had been injected into embryos at the one-cell stage. In zebrafish, mitfa (melanophore-inducing transcription factor a) is expressed by pigment cell progenitors, as well as melanophores and xanthophores (Lister et al., 1999; Budi et al., 2011; Saunders et al., 2019), and we found in D. albolineatus that mitfa:nucEosFP was expressed in these cells as well as orange cells of larvae and erythrophores of adults. mitfa:nucEosFP was used for fate mapping at early stages owing to its more robust expression in unpigmented cells. Scale bar: 50 μm.
Figure 4—figure supplement 1
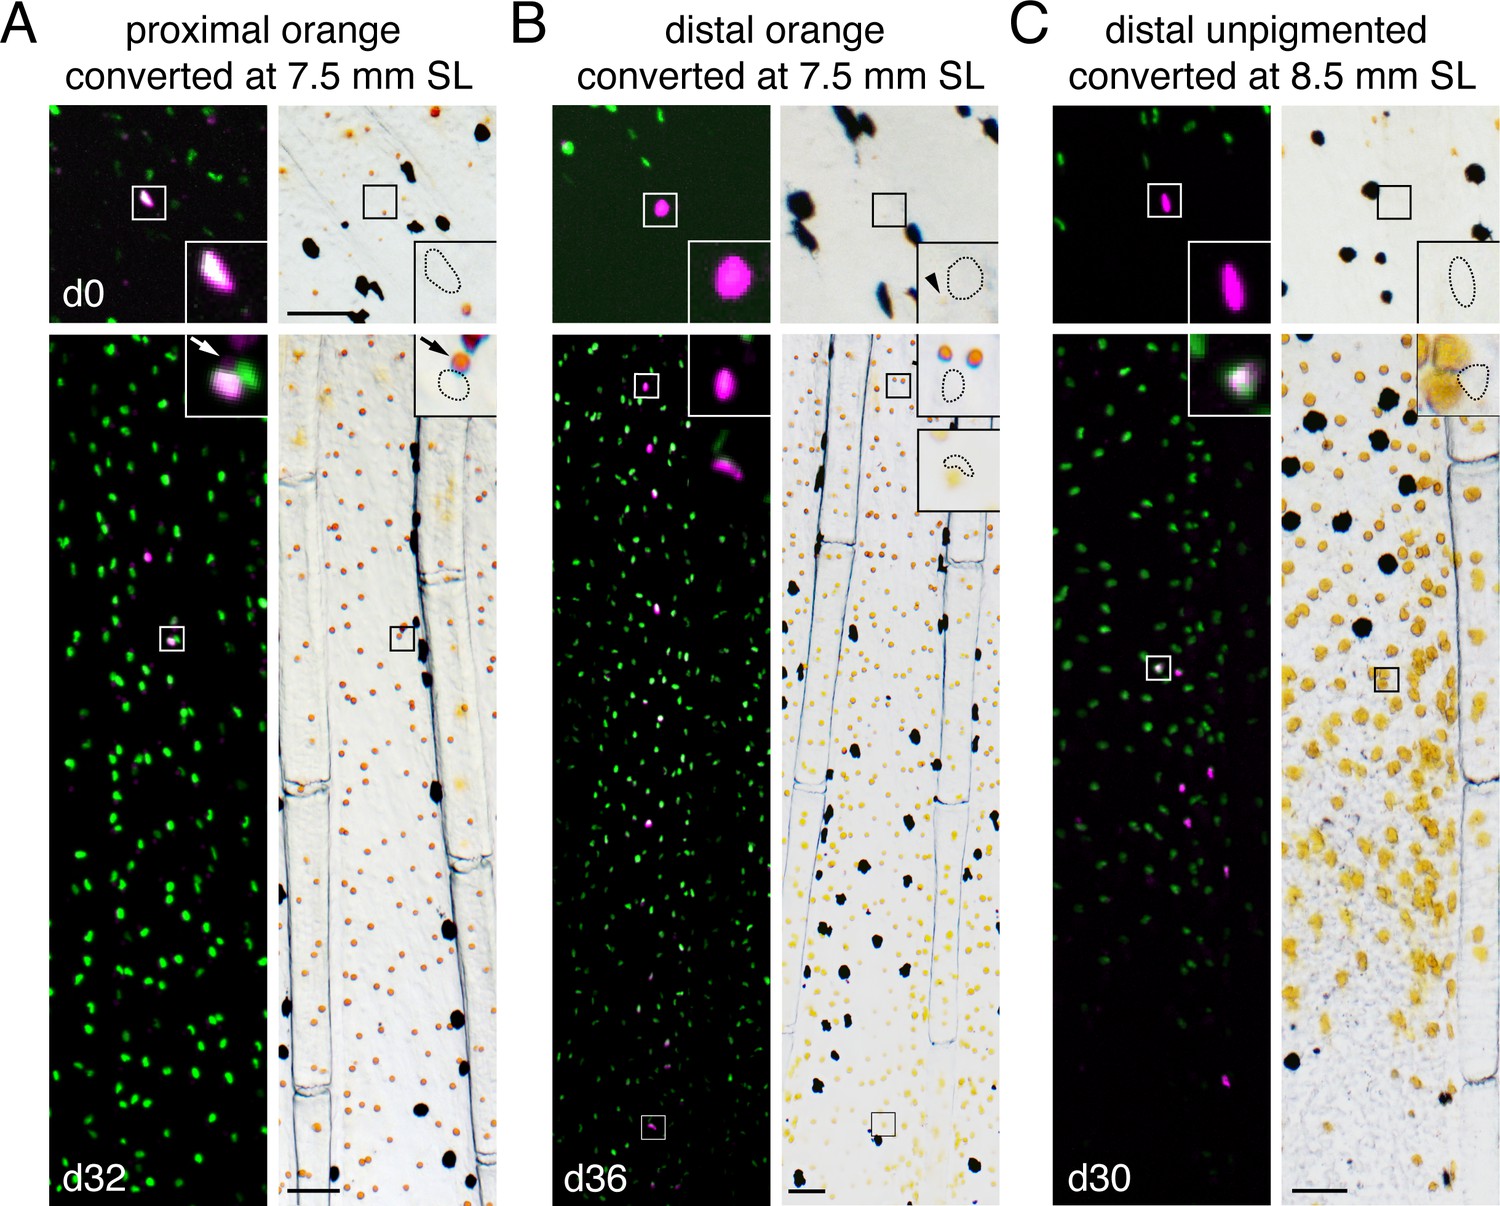
Fate mapping of single photoconverted cells at different locations and stages.
Representative examples of additional classes of clones shown in Figure 4C. (A) An orange cell initially in the proximal fin that generated daughters remaining proximally developing only as erythrophores. Arrow indicates weak autofluorescence of carotenoid pigment, adjacent to nucleus; approximate positions of nucEosFP+ nuclei in brightfield images are shown with dashed outlines. (B) An initially distal cell with pale orange pigmentation (arrowhead) that generated a clone including both proximal erythrophores and distal xanthophores. (C) An unpigmented cell at a later stage of fin development initially distal to the melanophore stripe (Figure 1A), produced only xanthophores. Scale bar: 50 μm.
Figure 5 with 3 supplements

Regeneration assays reveal fate plasticity in differentiated cells and latent stem cells competent to differentiate as erythrophores and xanthophores.
(A) Brightfield sequence of regeneration illustrating apparent conversion of erythophores to xanthophores (image series representative of all N = 3 fish examined by repeated imaging through regeneration). As fins regenerated, individual erythrophores (circled) near the amputation plane appeared to divide, with presumptive daughter cells having reduced amounts of pigment visible upon contraction with epinephrine and an increasingly yellow–orange color. (B) Schematic of regeneration experiment in C. Fins of Tg(aox5:nucEosFP) fish were photo-converted in toto prior to amputation through the erythrophore region. Fins regenerated over 15 days and pigment pattern had re-formed by 30 days, at which time a new melanophore stripe and distinct regions of erythrophores and xanthophores had developed. (C) Example of cells in regenerative tissue 36 days post-amputation (dpa). Regenerative xanthophores near the plane of amputation often contained photoconverted nucEosFP in a region of fin extending 400 μm from the distalmost red erythrophore into the regenerative xanthophore region (means ± 95% confidence interval; N = 1964 cells in four fish examined). Dashed lines indicate amputation in B and C. Scale bars: 50 μm (A); 100 μm (C).
Figure 5—figure supplement 1
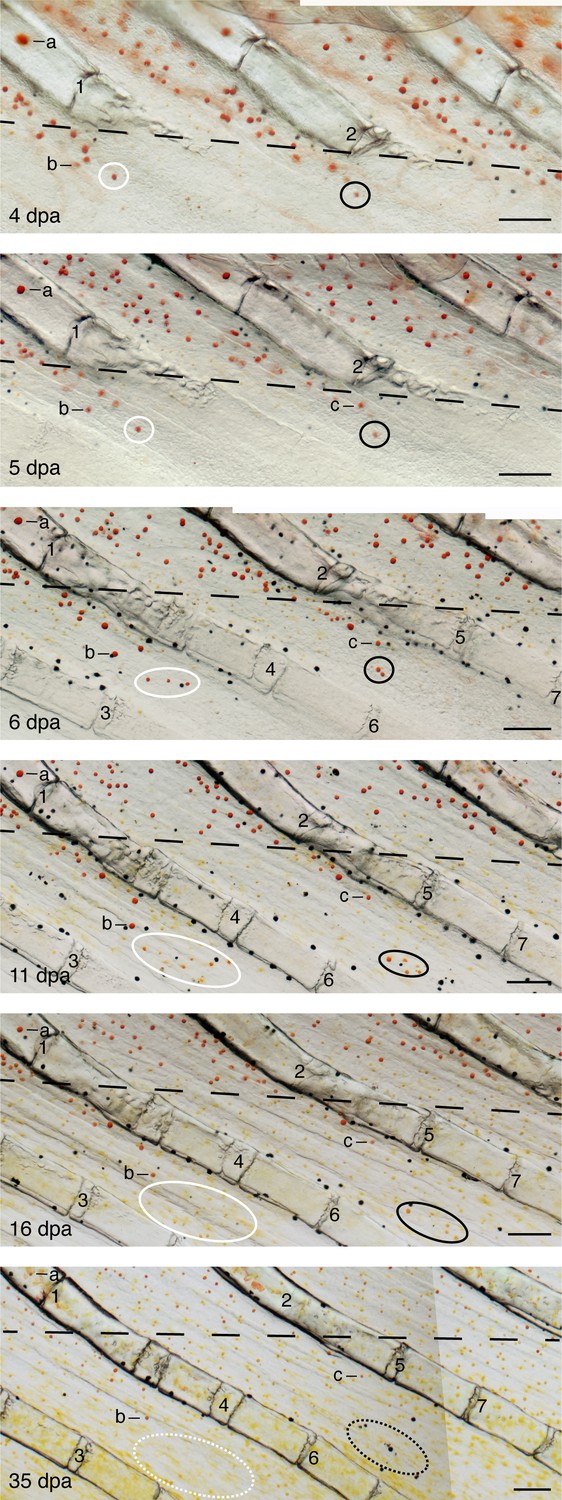
Pigment cell arrangements and colors and fin tissue context during pattern regeneration.
A region of fin is shown at selected time points between 4 and 35 days post-amputation (dpa). Positions of cells that appear to transition from red to yellow are indicated by white and black ovals; approximate positions at 35 dpa are indicated by dashed lines. Several additional erythrophores are also marked (a–c), as are morphologically distinguishable fin ray joints (1–7). The amputation plane is marked by a dashed line in each image. Cells marked by the black oval, also shown in Figure 5A, become displaced further distally relative to fin ray joints between 6 and 16 dpa. Scale bars: 100 μm.
Figure 5—figure supplement 2
Regeneration of erythrophores from newly specified unpigmented progenitors.
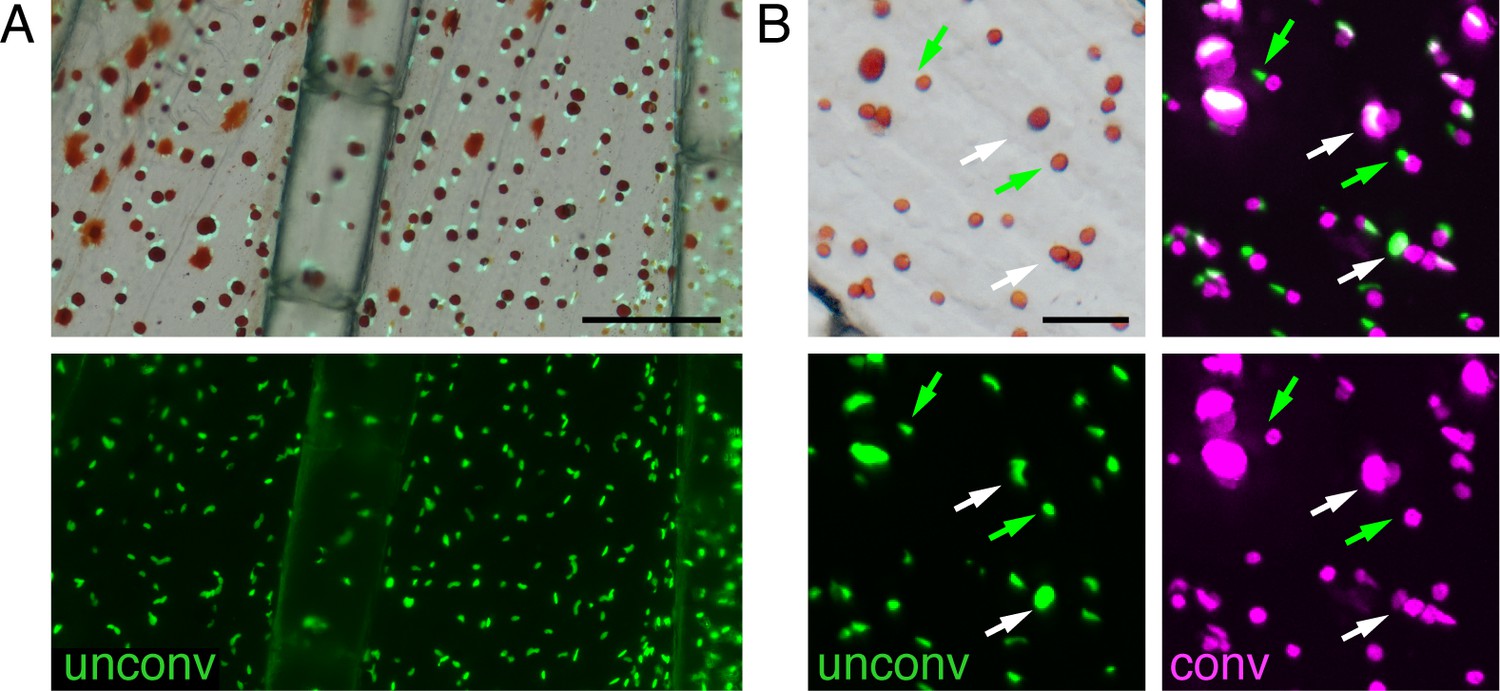
(A) Prior to regeneration, only erythrophores expressed aox5:nucEosFP in proximal regions; unpigmented aox5:nucEosFP+ cells were not evident, indicating that cells marked by photoconversion post-amputation were derived from previously differentiated erythrophores. Top, brightfield merged with bottom fluorescent image. (B) Brightfield and fluorescence (single channel at bottom, merged top right) showing erthyrophore nuclei adjacent to contracted pigment granules. Some nuclei retained photoconverted nucEosFP (magenta; white arrows), indicating cells were present prior to amputation, whereas other nuclei were labeled only with photoconverted nucEosFP (green; green arrows), indicating de novo differentiation during regeneration. Newly differentiating erythrophores were rare, however, in this example found only in 2 of 10 interray regions of the fish examined and only in relatively proximal locations. Scale bar: 200 μm (A); 50 μm (B).
Figure 5—figure supplement 3
Regeneration of central fin regions.
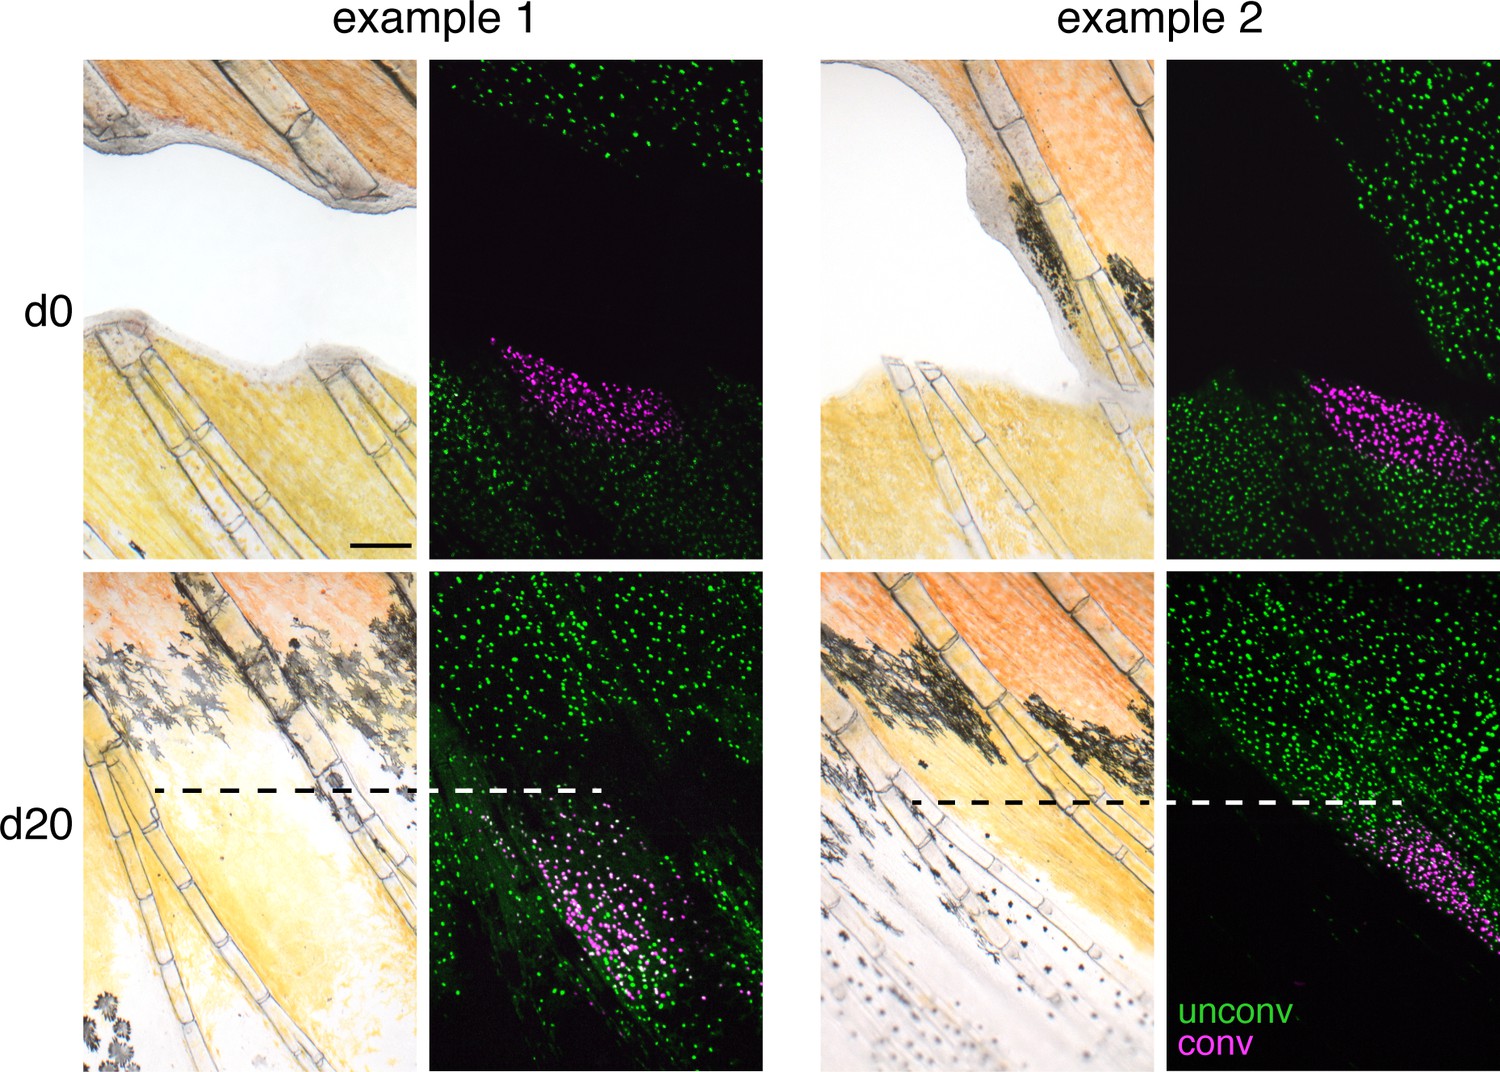
When internal sections of fin were excised and xanthophores adjacent to the wound marked by photoconversion, these cells or their progeny remained distally and failed to enter more proximal regions where erythrophores regenerated. Two examples of four total fish are shown. Dashed lines, proximal boundary of xanthophores with converted nucEosFP. Scale bar: 200 μm.
Figure 6

Differential gene expression in fin regions with erythrophores and xanthophores.
(A) Volcano plot of detected transcripts. Yellow–orange and red points indicate transcripts more abundant in xanthophore-containing and erythrophore-containing regions, respectively (q ≤ 0.05). Gray points, transcripts not significantly different in abundance between regions. (B) Heat maps illustrating differential expression of selected loci across fin regions and replicate libraries. Genes with names in bold had phenotypes affecting erythrophore pigmentation.
Figure 7 with 3 supplements
Wild-type pigment composition and mutant phenotypes.
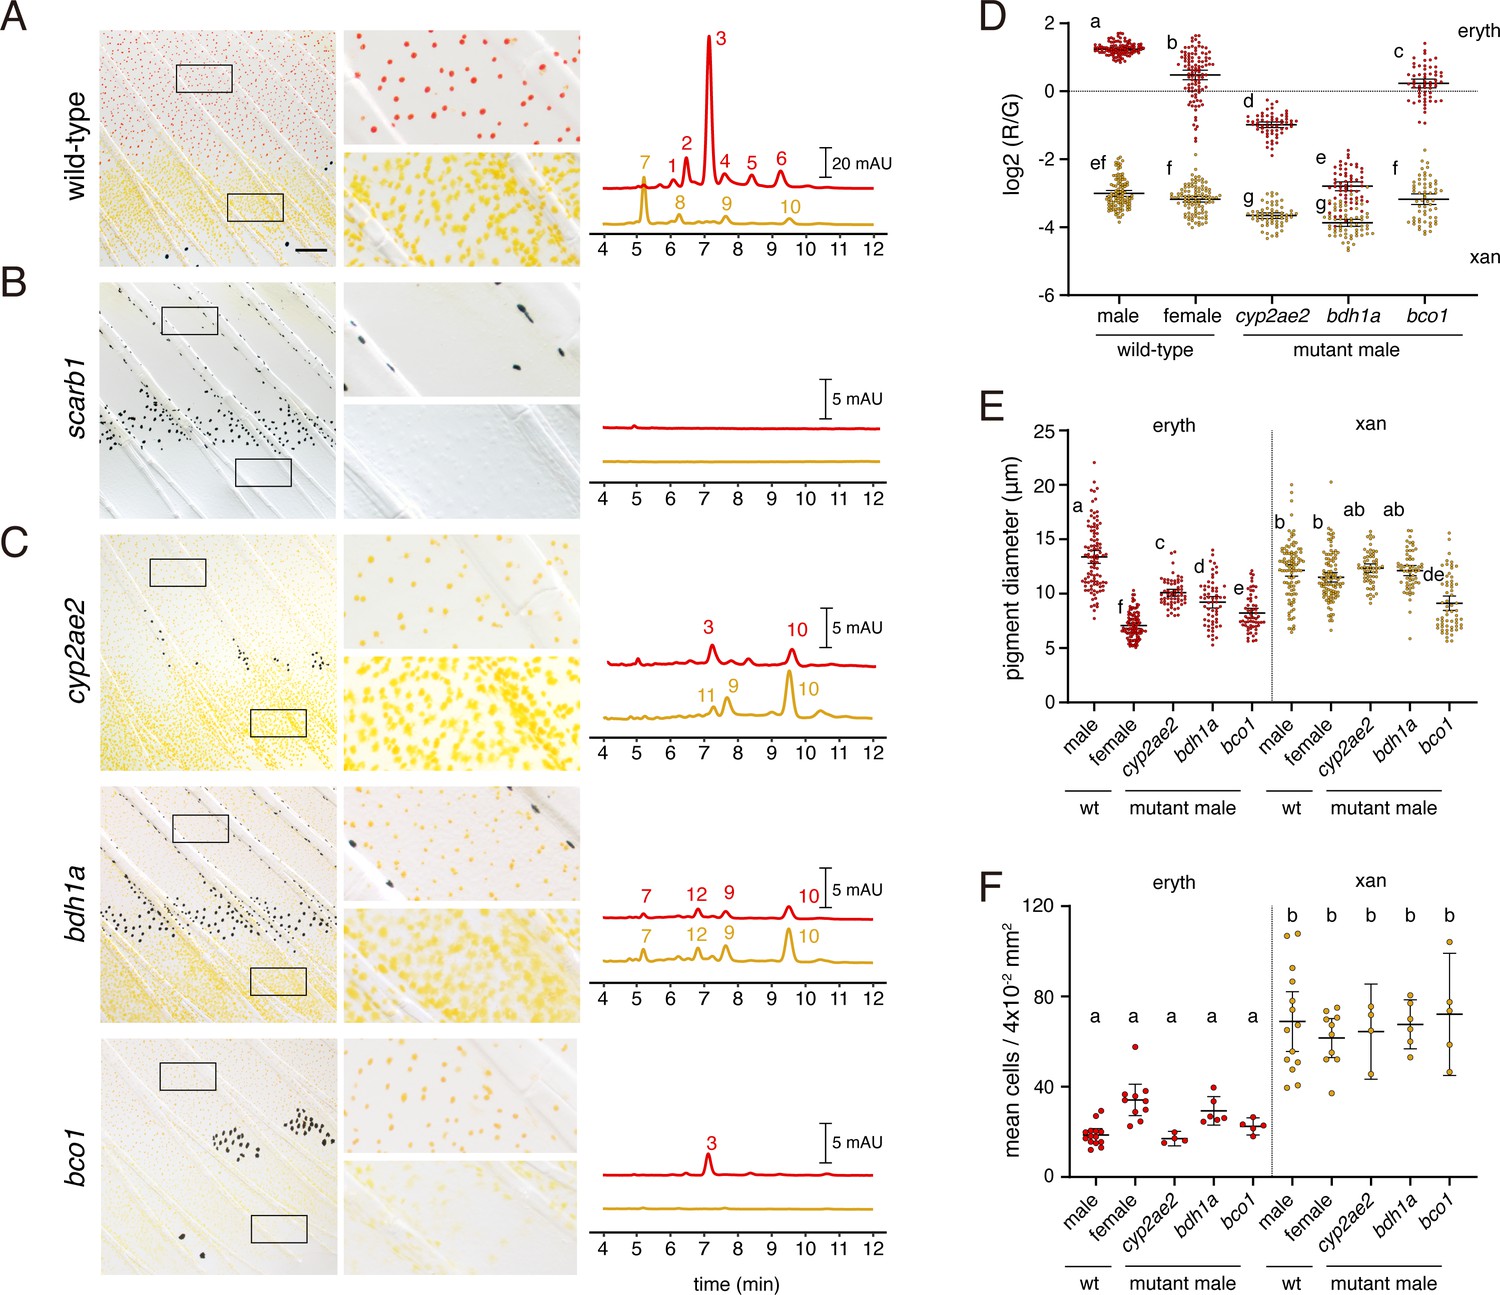
(A) Wild-type fin and carotenoid profile, showing carotenoid absorbance at 455 nm in adult male proximal tissue (red) and distal tissue (yellow). Numbers indicate different carotenoid species, with the most abundant ketocarotenoid in erythrophore-containing tissue being astaxanthin (peak 3; Figure 1A; Figure 7—figure supplement 1). (B) Homozygous scarb1 mutants lacked red and yellow coloration and carotenoids were not detectable. (C) Homozygous mutant phenotypes of genes targeted from RNA-Seq comparisons. cyp2ae2 and bdh1a mutants were deficient for red color and astaxanthin. bco1 mutants had reduced red and yellow coloration and carotenoids. (D) Ratios of red to green autofluorescence for cells found within proximal erythrophore containing regions (red filled points) and distal xanthophore containing regions (yellow filled points) of wild-type males and females compared to mutant males. In the wild-type, erythrophores and xanthophores were segregated into different populations by R/G fluorescence, although differences in females were less marked. In males of each mutant, R/G ratios of erythrophores were reduced compared to wild-type, and lesser reductions were evident in xanthophores (ANOVA, genotype x region interaction, F4,736=310.82, p < 0.0001, after controlling for significant main effects and variation among individuals; N = 760 cells total from five individuals of each background). Plots show means ±95 % confidence intervals; means of groups not sharing the same letter differed significantly from one another (p < 0.05) in Tukey-Kramer post hoc comparisons. (E) Wild-type males and females, and mutant males, differed in total visible pigment, as measured by diameters of contracted pigment granules following epinephrine treatment (Saunders et al., 2019). (ANOVA, background x region interaction, F4,736=76.25, p < 0.0001, with significant main effects and variation among individuals; diameters were ln-transformed for analysis to control for increasing residual variance with means.). (F) Densities of erythrophores and xanthophores differed across backgrounds ( ANOVA, background x region interaction, F1,35=19.01, p < 0.0001). Each point represents the mean number of cells counted in three regions of 4 × 10⁻² mm2 in proximal or distal regions with erythrophores or xanthophores, respectively, in each of 39 total fish. Scale bar: 50 μm.
Figure 7—figure supplement 1
Characterics of carotenoid absorbance spectra.
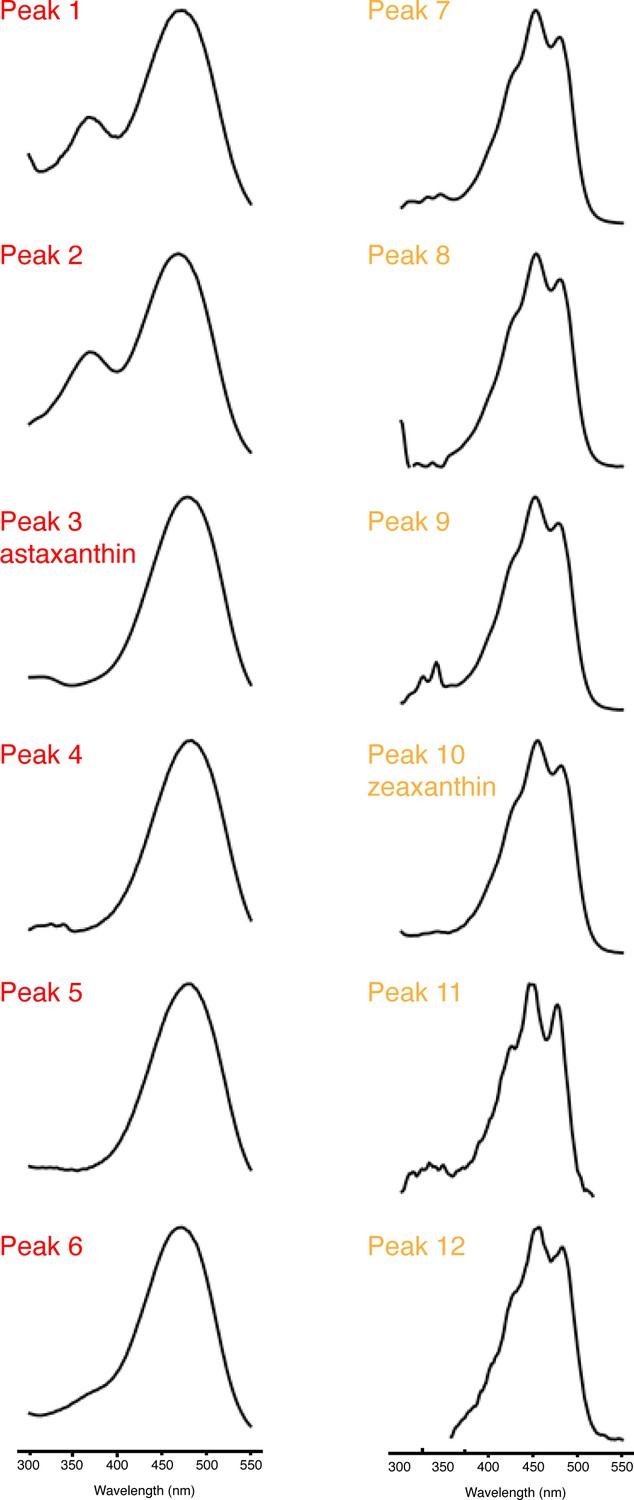
Representative normalized UV-Vis absorbance spectra of the major peaks in the carotenoid profiles of red and yellow fin portions of wild-type and various mutant D. albolineatus (Figure 7). Peaks 1–6 have a single relatively long-wavelength absorbance peak that is typical of extended conjugated system of C4-ketocarotenoids, including astaxanthin (Peak 3). Peaks 7–12 have multiple smaller peaks characteristic of xanthophyll carotenoids that do not have C4-keto groups contributing the conjugated system, including zeaxanthin (Peak 10).
Figure 7—figure supplement 2
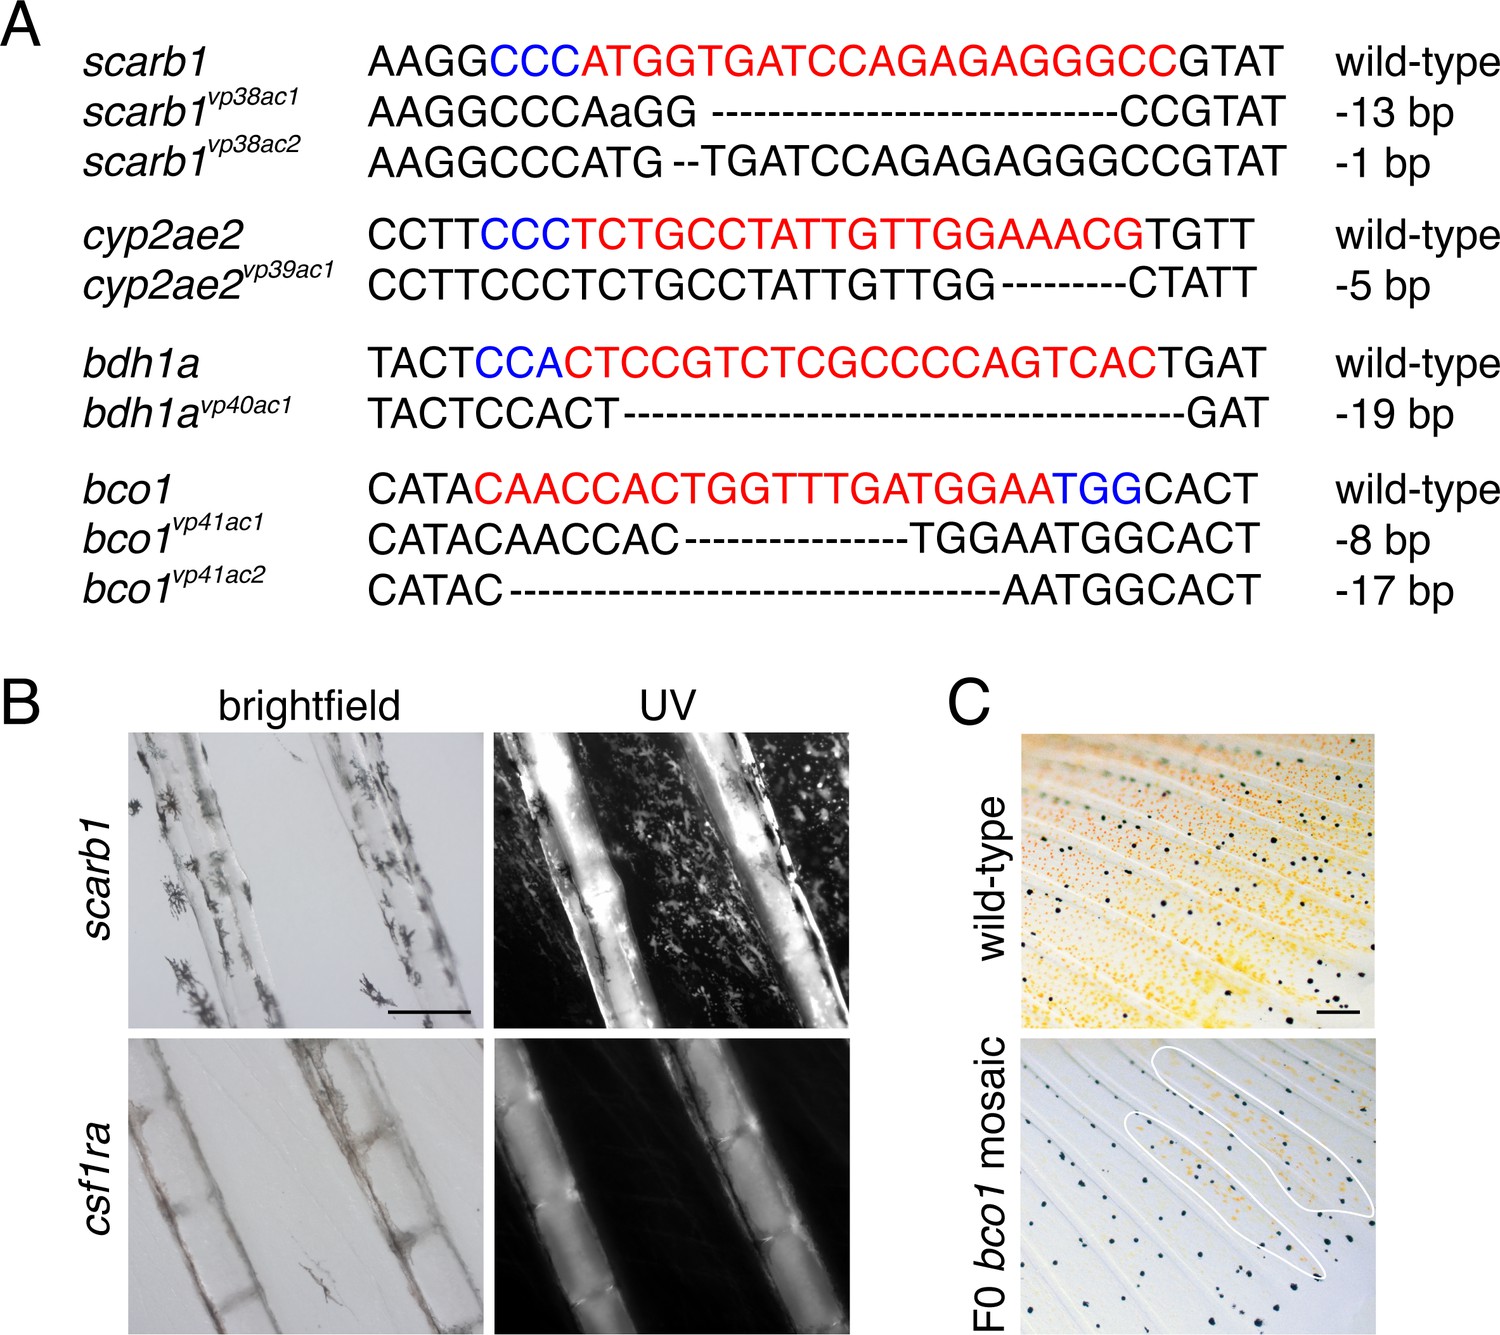
Mutant lesions recovered, presence of pteridines, and mosaic phenotype of bco1.
(A) Alleles induced by CRISPR/Cas9 targeting of candidate genes. gRNA sequences in red. PAM sequences in blue. Dashed lines indicate missing nucleotides. (B) Fish mutant for scarb1 lacked visible red or yellow color but contained pteridines detectable by autoflourescence under ultraviolet illumination following treatment with dilute ammonia (Odenthal et al., 1996). Pteridine autofluorescence was not present in a xanthophore and erythrophore deficient mutant for colony stimulating factor one receptor a (csf1ra) (Lewis et al., 2019), which functions cell-autonomously to promote xanthophore development in zebrafish (Parichy et al., 2000; Parichy and Turner, 2003). (C) Carotenoid pigments were mosaic in F0 fish injected with CRISPR/Cas9 targeting bco1. Patches of presumptively wild-type orange cells are outlined. Scale bar: 200 μm.
Figure 7—figure supplement 3
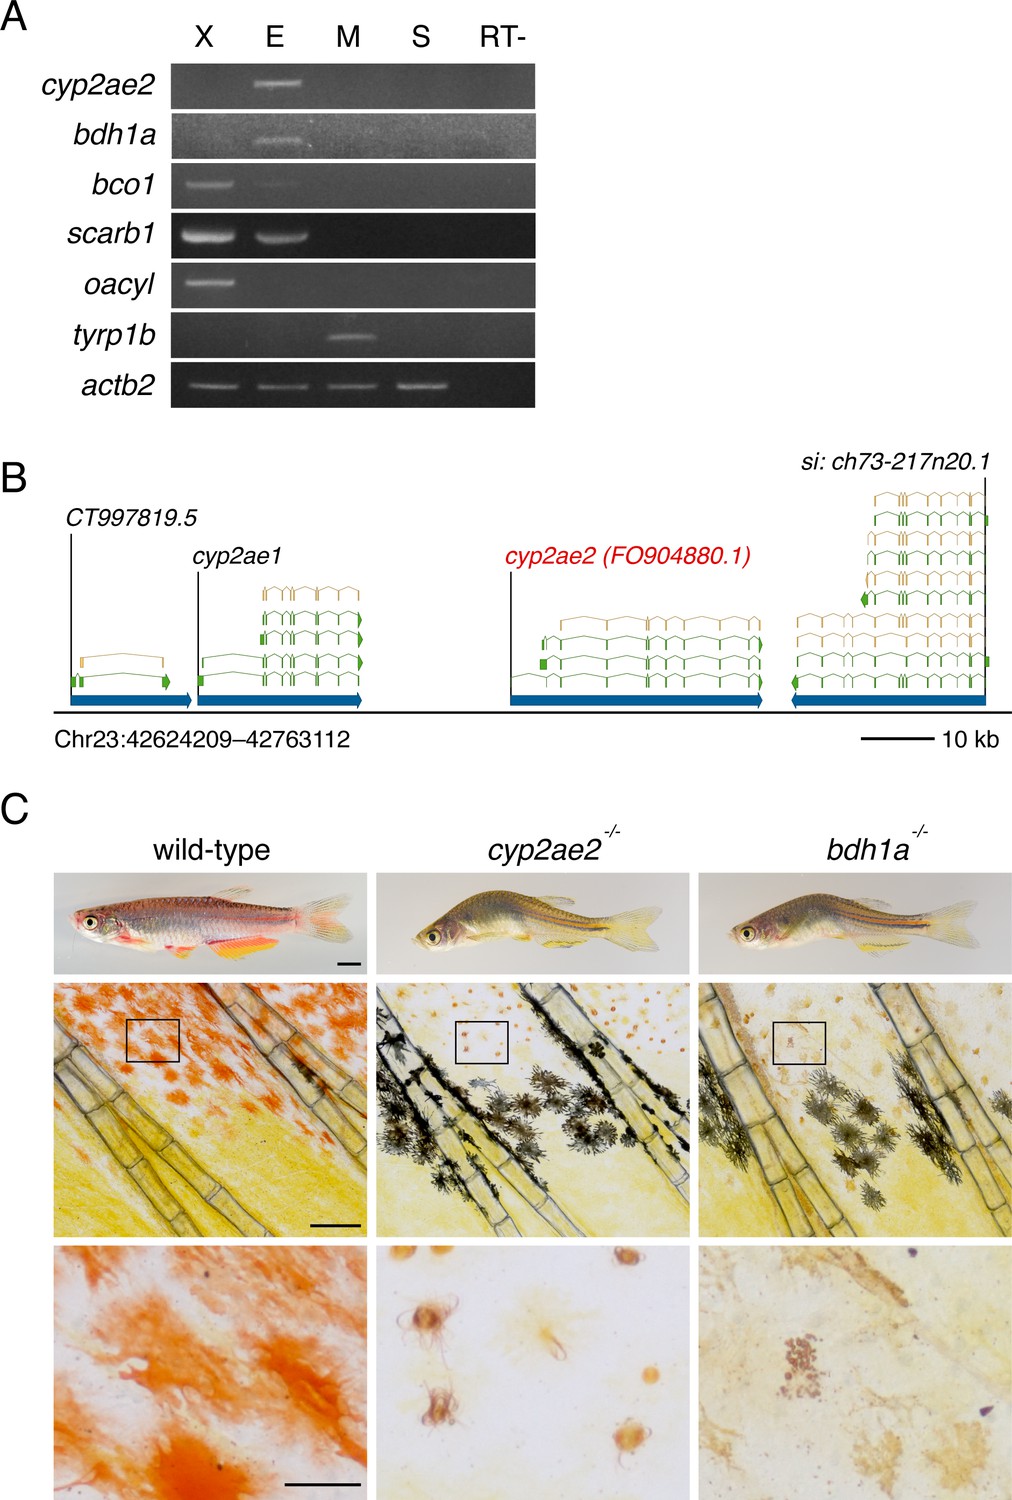
Expression, genomic location and additional phenotypes of genes contributing to red coloration.
(A) RT-PCR of isolated pigment cells confirms expression by erythrophores of cyp2ae2, bdh1, and scarb1, and at low levels, bco1 (X, xanthophores; E, erythrophores; M, melanophores; S, skin; RT-, negative control without reverse transcriptase). oacyl and tyrp1b mark xanthophores and melanophores, respectively (Saunders et al., 2019); actb2, control. (B) Genomic context of cyp2ae2 (FO904880.1) in D. rerio GRCz11 (Ensembl Release 103), showing major transcripts (green) and associated coding sequence (tan). (C) Later adult pigment cell and body phenotypes of wild-type compared to cyp2ae2 and bdh1a mutants. Scale bar: 4 mm (top); 200 μm (middle); 50 μm (bottom).
Tables
Key resources table
| Reagent type(species or resource)* | Designation | Source or reference | Identifiers | Additional information |
|---|---|---|---|---|
| Genetic reagent (D. albolineatus) | Tg(aox5:nucEos)vp37albTg | This paper | Transgenic line. Maintained in Parichy lab. Described in Materials and methods. | |
| Genetic reagent (D. albolineatus) | scarb1vp38ac1 | This paper | CRISPR-CAS9 knock-out line. Maintained in Parichy lab. Described in Materials and methods, and Figure 7—figure supplement 1. | |
| Genetic reagent (D. albolineatus) | scarb1vp38ac2 | This paper | CRISPR-CAS9 knock-out line. Maintained in Parichy lab. Described in Materials and methods, and Figure 7—figure supplement 1. | |
| Genetic reagent (D. albolineatus) | cyp2ae2vp39ac1 | This paper | CRISPR-CAS9 knock-out line. Maintained in Parichy lab. Described in Materials and methods, and Figure 7—figure supplement 1. | |
| Genetic reagent (D. albolineatus) | bdh1avp40ac1 | This paper | CRISPR-CAS9 knock-out line. Maintained in Parichy lab. Described in Materials and methods, and Figure 7—figure supplement 1. | |
| Genetic reagent (D. albolineatus) | bco1vp41ac1 | This paper | CRISPR-CAS9 knock-out line. Maintained in Parichy lab. Described in Materials and methods, and Figure 7—figure supplement 1. | |
| Genetic reagent (D. albolineatus) | bco1vp41ac2 | This paper | CRISPR-CAS9 knock-out line. Maintained in Parichy lab. Described in Materials and methods, and Figure 7—figure supplement 1. | |
| Recombinant DNA reagent | mitfa:nucEosFP | This paper | Maintained in Parichy lab. Described in Materials and methods. | |
| Recombinant DNA reagent | aox5:palmEGFP | McMenamin et al., 2014 | ||
| Software, algorithm | JMP Pro 16 | SAS Institute | ||
| Software, algorithm | GraphPad Prism | GraphPad | ||
| Software, algorithm | Fiji | Schindelin et al., 2012 | ||
| Software, algorithm | Kallisto | Bray et al., 2016 | ||
| Software, algorithm | DESeq2 | Love et al., 2014 | ||
| * Additional oligonucleotides and CRIPSR/Cas9 reagents provided in Supplementary file 1—Table 2 and 5. | ||||
Additional files
-
Supplementary file 1
Tables of RNA-Seq analyses, reagents, and HPLC retention times.
- https://cdn.elifesciences.org/articles/70253/elife-70253-supp1-v2.xlsx
-
Transparent reporting form
- https://cdn.elifesciences.org/articles/70253/elife-70253-transrepform1-v2.docx
Download links
A two-part list of links to download the article, or parts of the article, in various formats.
Downloads (link to download the article as PDF)
Open citations (links to open the citations from this article in various online reference manager services)
Cite this article (links to download the citations from this article in formats compatible with various reference manager tools)
Development and genetics of red coloration in the zebrafish relative Danio albolineatus
eLife 10:e70253.
https://doi.org/10.7554/eLife.70253


