SWI/SNF senses carbon starvation with a pH-sensitive low-complexity sequence
- Department of Molecular and Cell Biology, University of California, Berkeley, United States
- Institute for Systems Genetics, New York University Grossman School of Medicine, United States
- Program in Molecular Medicine, University of Massachusetts Medical School, United States
- Department of Cell and Molecular Biology, University of Rhode Island, United States
- Center for Science and Engineering of Living Systems (CSELS), Washington University in St. Louis, United States
- Department of Biochemistry and Molecular Biophysics, Washington University School of Medicine, United States
Figures
Figure 1 with 9 supplements
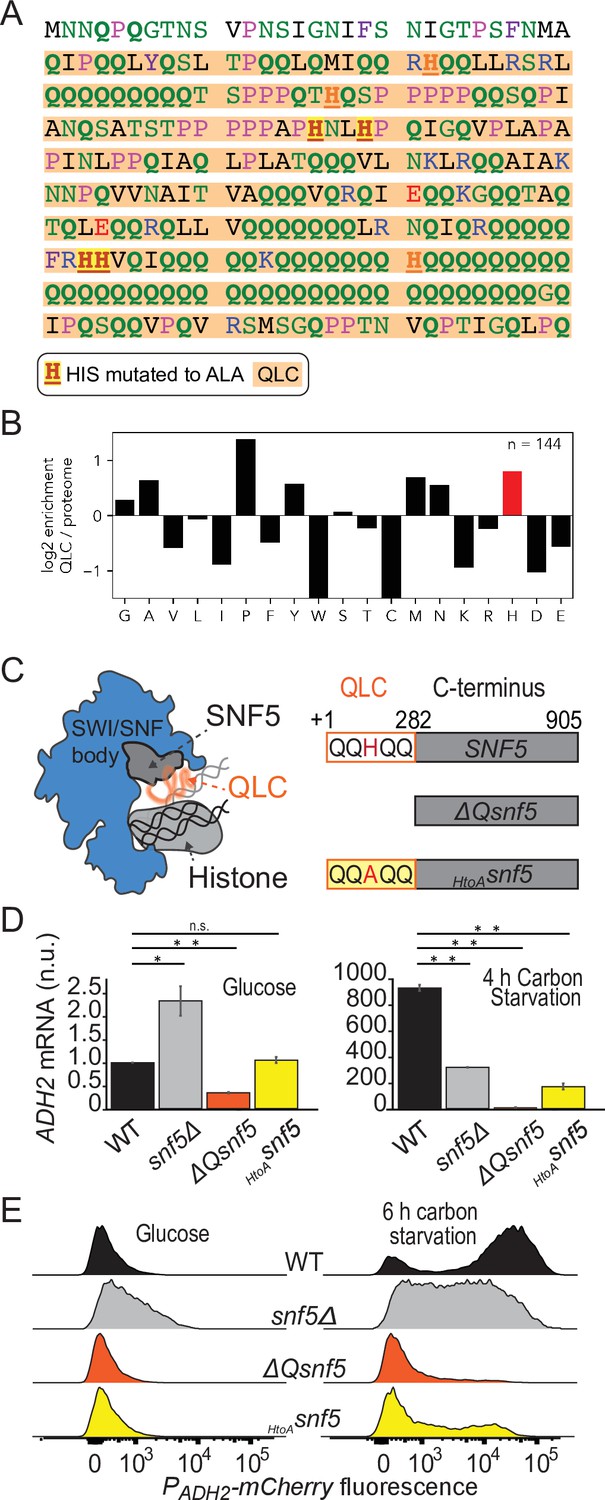
Efficient induction of ADH2 upon glucose starvation requires the SNF5 glutamine-rich low-complexity sequence with native histidines.
(A) Sequence of the N-terminal low-complexity domain of SNF5. This domain was deleted in the ΔQsnf5 strain. The glutamine-rich domain is highlighted in orange. The 4/7 histidines that were mutated to alanine in the HtoASNF5 allele are highlighted in red. (B) The log2 of the frequency of each amino acid within QLCs divided by the global frequency of each amino acid in the proteome (S. cerevisiae). Values > 0 indicate enrichment in QLCs. (C) Left: schematic of the SWI/SNF complex engaged with a nucleosome. The SNF5 C-terminus is shown in gray, while the disordered N-terminal QLC is shown in orange. Right: schematic of the three main SNF5 alleles used in this study. (D) RT-qPCR results assessing levels of endogenous ADH2 mRNA in four strains grown in glucose (left) or after 4 hr of glucose starvation (right). Note: y-axes are different for each plot. (E) Representative histograms (10,000 cells) showing the fluorescent signal from a PADH2-mCherry reporter gene for four strains grown in glucose (left) or after 6 hr of glucose starvation (right). Statistical tests are Bonferroni-corrected t-tests, *p<0.05, **p<0.01, n.s., not significant.
Figure 1—figure supplement 1
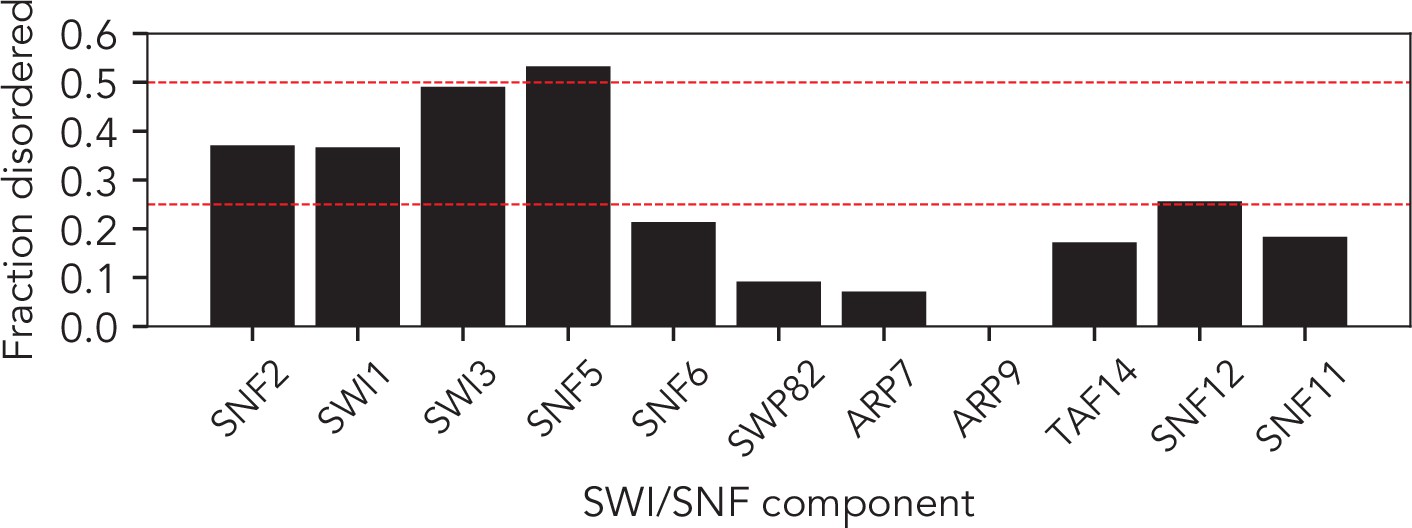
The SWI/SNF complex has 10/11 subunits with significant disorder.
Fractional disorder in each of the core 11 SWI/SNF components. Dashed red lines represent 25% and 50% disorder. 5 of the 11 components contain over 25% disorders. Disorder prediction performed using metapredict (see Materials and methods).
Figure 1—figure supplement 2
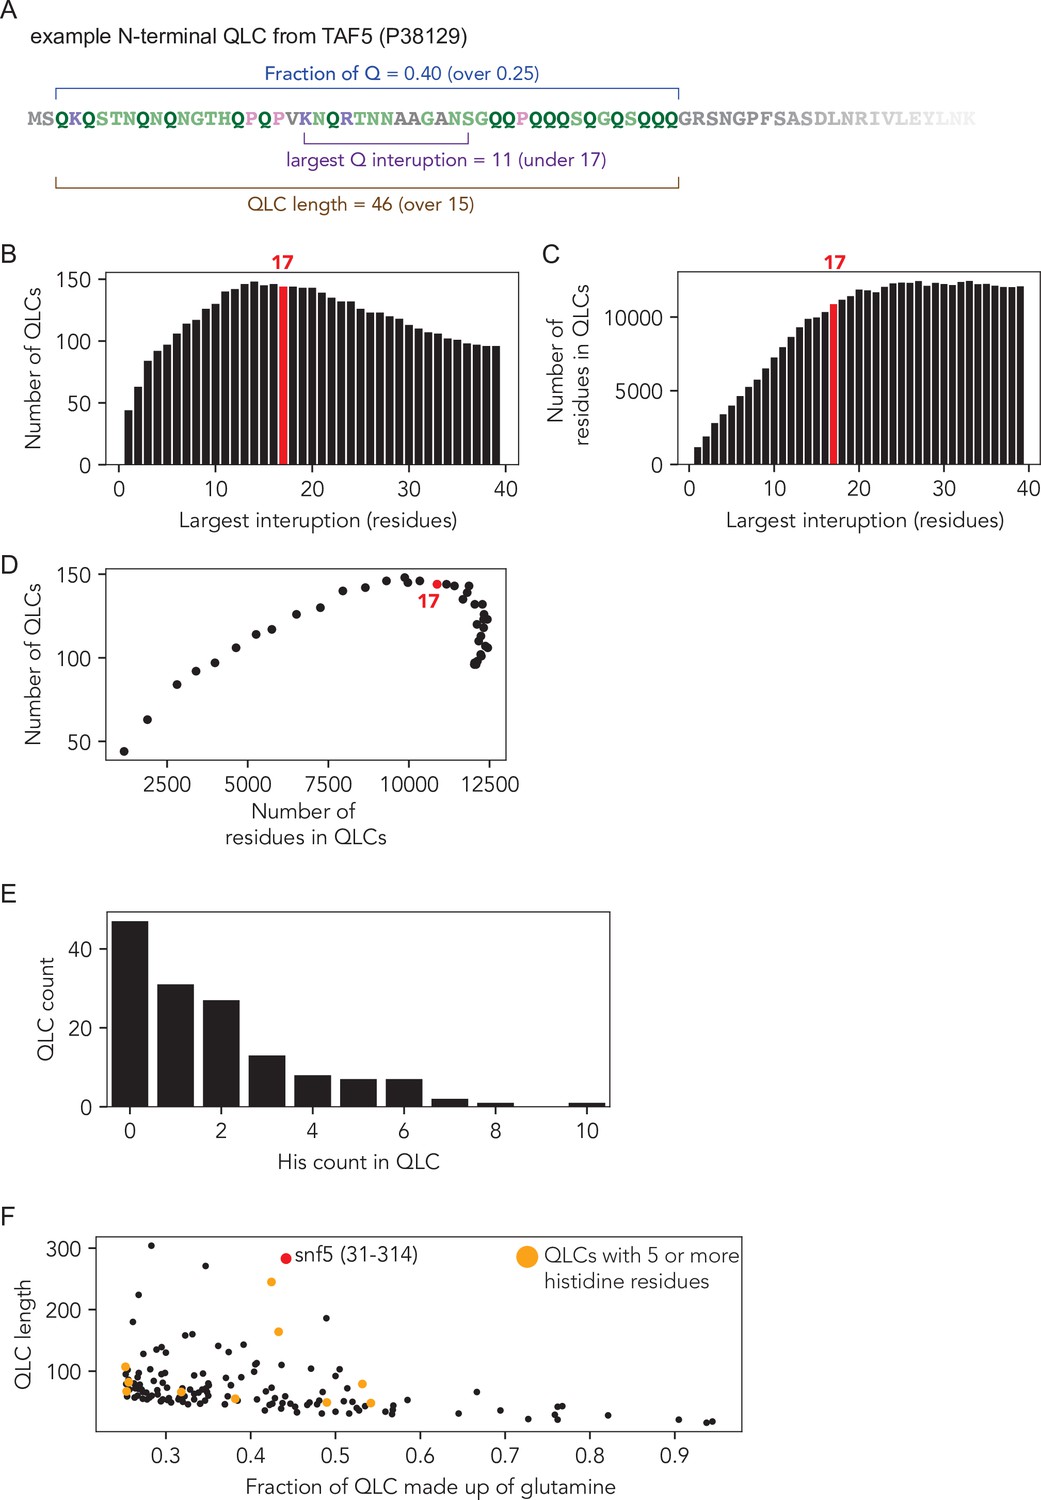
Identification and analysis of glutamine-rich low-complexity sequences (QLCs).
(A) Example of a QLC region with the criteria that define QLCs annotated: QLCs were defined as subregions of the proteome in which they have an average fraction of glutamine residues of 25% or higher (minimum fraction, e.g., here 40%), the maximum interruption between any two glutamine residues is less than 17 residues (e.g., here 11 residues), and the whole QLC is at least 15 residues in length (minimum length, e.g., here 46). (B–D) Computational analysis used to select the interruption length criterion for QLC identification. Systematic variation revealed that a maximum interruption disruption length of 17 residues optimized the number of QLCs identified (B) and the number of residues found within QLCs (C), offering an optimally permissive value under the 0.25 or greater fraction of glutamine threshold. (D) Number of residues in QLCs vs. number of QLCs shows that an interruption length of 17 sits at an optimum for both parameters. (E) Histogram of the number of histidine residues within S. cerevisiae QLCs (n = 144). (F) Most QLCs contain relatively few histidine, but a small fraction contain five or more.
Figure 1—figure supplement 3
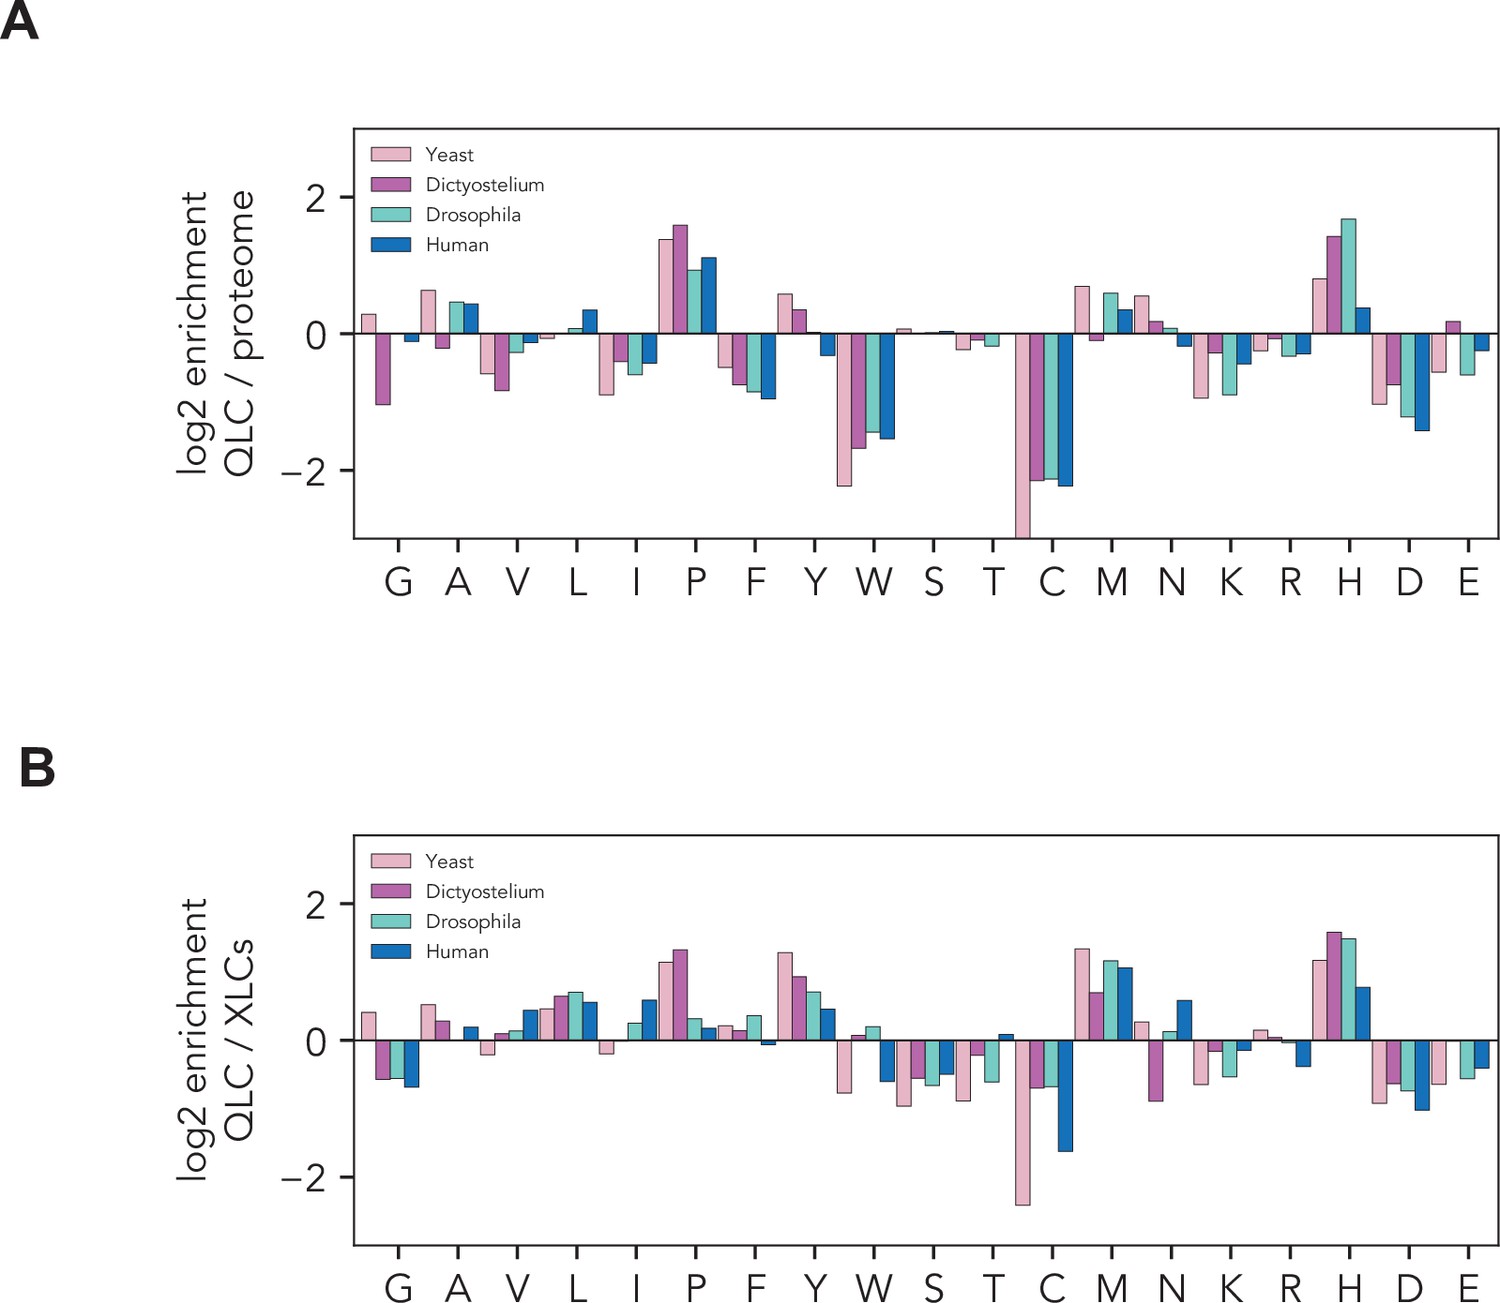
Histidines are enriched in glutamine-rich low-complexity sequences.
Amino acid frequencies within glutamine-rich low-complexity sequences (QLCs) in S. cerevisiae (yeast), Dictyostelium discoides, Drosophila melanogaster, and humans. (A) Enrichment of each amino acid in QLCs compared to global amino acid frequencies in each proteome. (B) Enrichment of each amino acid in QLCs compared to amino acid frequencies in all low-complexity sequences identified using Wootton–Federhen complexity (see Materials and methods).
Figure 1—figure supplement 4
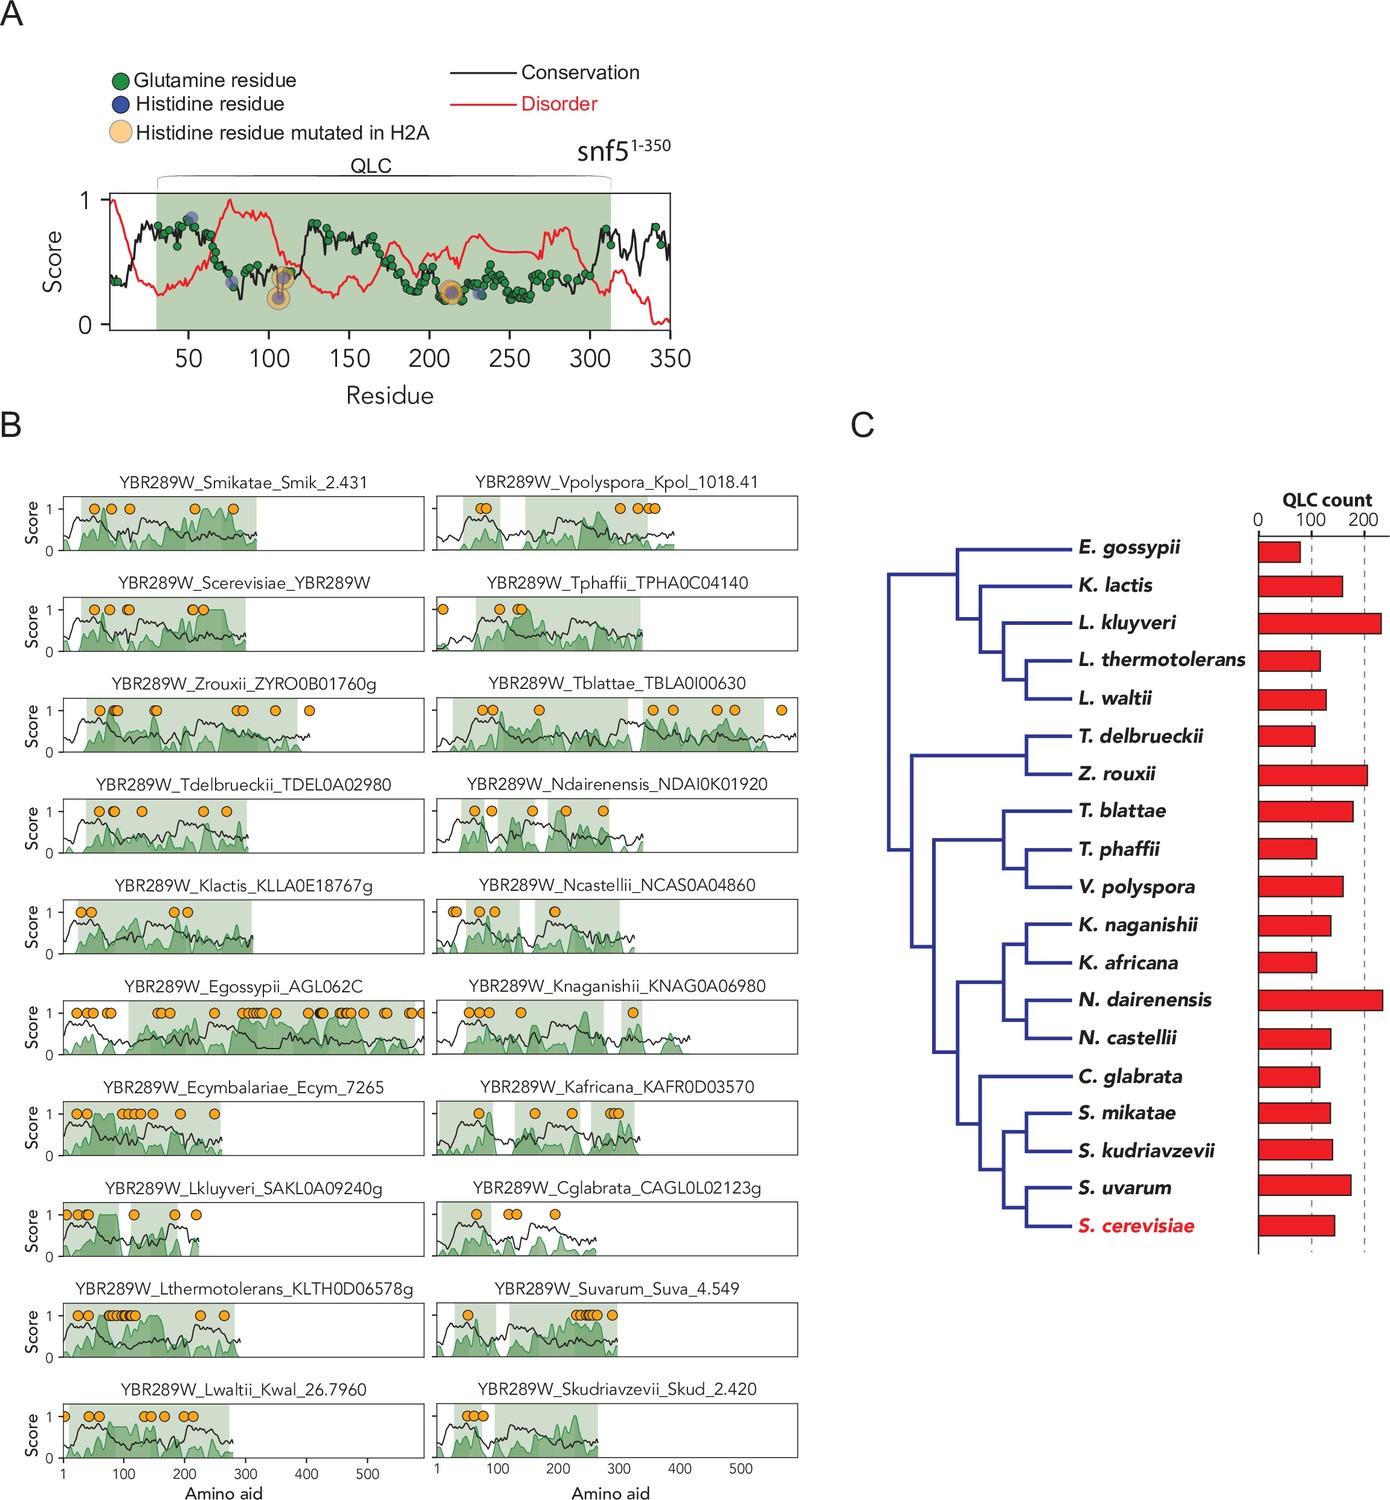
The SNF5 N-terminal glutamine-rich low-complexity domain (with embedded histidines) is broadly conserved across Ascomycota.
(A) Analysis of SNF5 N-terminal region showing conservation (black), disorder (red), glutamine positions (green), histidine positions (blue), histidines that are mutated (orange), and the QLC (shaded green area). Four histidine residues are highlighted, which, when mutated to alanine, lead to a phenotypic change. Intriguingly, these four histidines are located in highly disordered and poorly conserved subregions of the SNF5 N-terminal region. (B) The same analysis for 19 ascomycetes. (C) Phylogeny of ascomycetes analyzed above, with the total number of QLCs identified in each proteome shown to the right.
Figure 1—figure supplement 5

The SNF5 N-terminal glutamine-rich low-complexity domain was probably gained in the fungal lineage.
Broad orthologs of SNF5 were determined using the more conserved C-terminal domain. These orthologs were analyzed, and if QLCs were detected, the number of residues within is plotted in the bar graph to the right. The Ascomycota and Basidiomycota both have QLCs, possibly indicating gain of the domain in this lineage. There is no evidence of SNF5 QLCs in the Metazoa (animals) or in the closest outgroup to the Metazoa (Choanoflagellates, i.e., Monosiga brevicollis). The slime mold amoeba Dictyostelium discoideum has an SNF5 QLC, but this organism is extremely rich in glutamine repeats, and it is not clear that this QLC has the same origin as the fungal clade.
Figure 1—figure supplement 6

The SNF5 QLC is important for recovery from carbon starvation.
Growth rate was assessed in a plate reader in various conditions. (A) Comparison of growth rate of WT, ΔQsnf5, HtoAsnf5, and snf5Δ strains in synthetic complete media with glucose. (B) Cells were grown to log phase, carbon-starved for 24 hr, and then grown in 2% glucose. (C, D) Cells were immediately switched from glucose to poor carbon sources. (E, F) Cells were subjected to acute starvation for 24 hr and then switched to poor carbon sources.
Figure 1—figure supplement 7
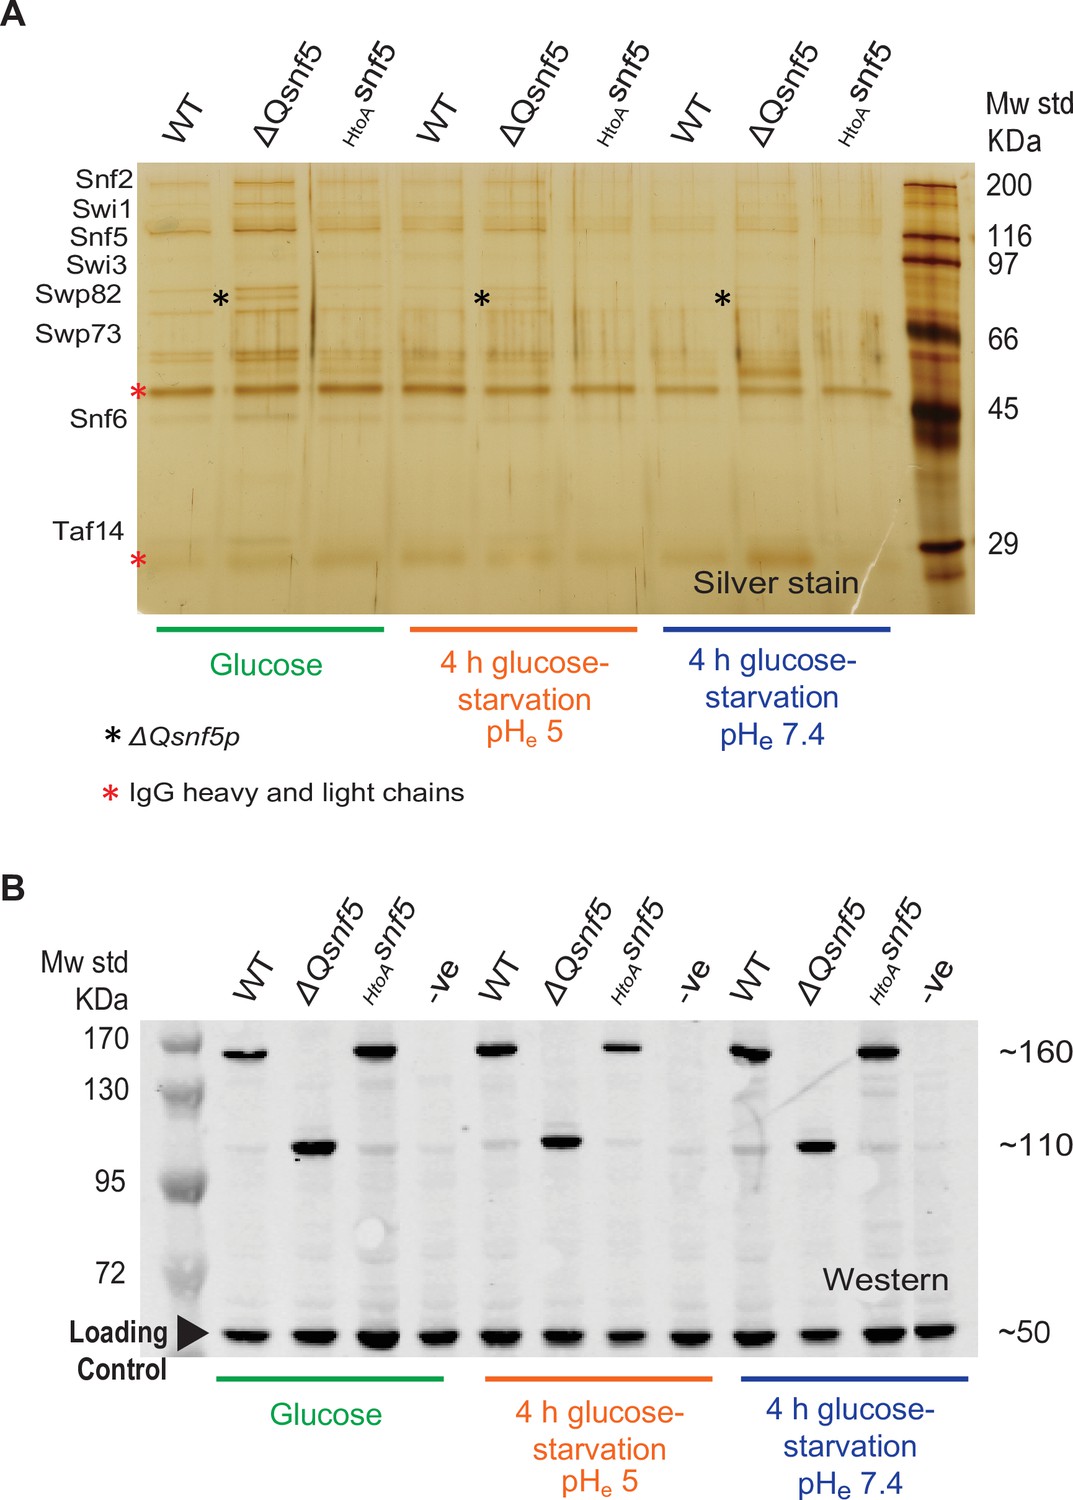
Mutation of the SNF5 QLC does not lead to protein degradation or loss of SWI/SNF complex integrity.
(A) The entire SWI/SNF complex copurifies with SNF2 in all strains and conditions. The endogenous SNF2 gene was tandem affinity purification (TAP)-tagged at the C-terminus and used to immunoprecipitate the SWI/SNF complex from WT, ΔQsnf5, or HtoAsnf5 strains either exponentially growing in glucose or after 4 hr acute carbon starvation in media titrated to pHe 5 or 7.4 (indicated at bottom). A silver stain of an SDS-PAGE analysis is shown. (B) Neither SNF5 nor its mutant alleles are degraded upon glucose starvation. Western blots of the TAP-tagged SNF5 alleles in various conditions (indicated at bottom). TAP-tagged ΔQ-snf5 runs at ~110 kDa, 288 amino acids smaller than WT (~160 kDa). An anti-glucokinase antibody was used as a loading control (bottom band at ~50 kDa).
-
Figure 1—figure supplement 7—source data 1
The entire SWI/SNF complex copurifies with SNF2 in all strains and conditions.
Figure 1—figure supplement 7A: annotated. The endogenous SNF2 gene was tandem affinity purification (TAP)-tagged at the C-terminus and used to immunoprecipitate the SWI/SNF complex from WT, ΔQsnf5, or HtoAsnf5 strains either exponentially growing in glucose or after 4 hr acute carbon starvation in media titrated to pHe 5 or 7.4 (indicated at bottom). A silver stain of an SDS-PAGE analysis is shown. Figure 1—figure supplement 7A: unannotated. Silver-stained SDS-PAGE gel with no annotation. Figure 1—figure supplement 7B: annotated. Neither SNF5 nor its mutant alleles are degraded upon glucose starvation. Western blots of the TAP-tagged SNF5 alleles in various conditions (indicated at bottom). TAP-tagged ΔQ-snf5 runs at ~110 kDa, 288 amino acids smaller than WT (~160 kDa). An anti-glucokinase antibody was used as a loading control (bottom band at ~50 kDa). The SNF5-TAP bands are indicated by red boxes. Figure 1—figure supplement 7B: unannotated. Western blot with no annotation.
- https://cdn.elifesciences.org/articles/70344/elife-70344-fig1-figsupp7-data1-v2.zip
Figure 1—figure supplement 8
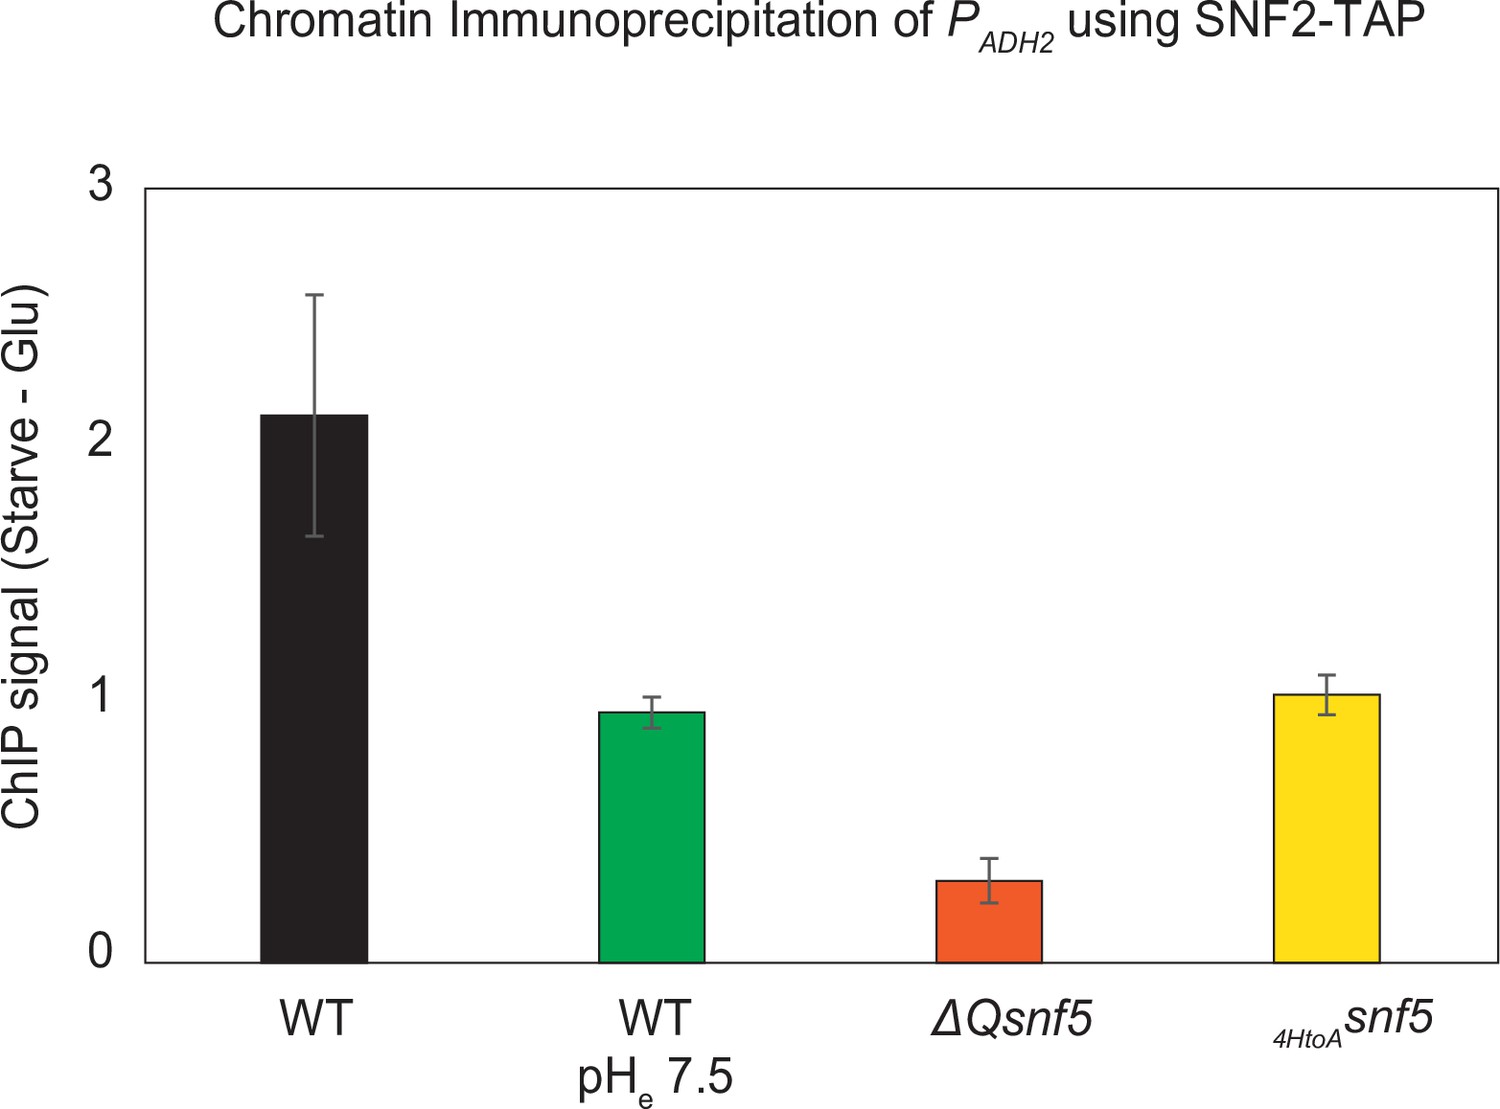
Efficient recruitment of the SWI/SNF complex to the ADH2 promoter depends upon pH, the SNF5 QLC and histidines within.
The endogenous SNF2 gene was tandem affinity purification (TAP)-tagged at the C-terminus and used to immunoprecipitate the SWI/SNF complex from WT, ΔQsnf5, or HtoAsnf5 strains. Prior to immunoprecipitation, chromatin and proteins were crosslinked with formaldehyde, enabling co-purification of chromatin associated with the SWI/SNF complex (chromatin immunoprecipitation [ChIP]). Quantitative polymerase chain reaction (qPCR) was then performed with primers specific to the ADH2 promoter. The y-axis shows the difference in qPCR signal in strains grown in glucose minus the signal after 4 hr of acute carbon starvation. Values greater than 1 indicate recruitment of SWI/SNF to the ADH2 promoter upon carbon starvation. Experiments were performed in media titrated to pHe 5 or 7.4 (indicated on the x-axis). n = 3, standard deviation is shown.
Figure 1—figure supplement 9
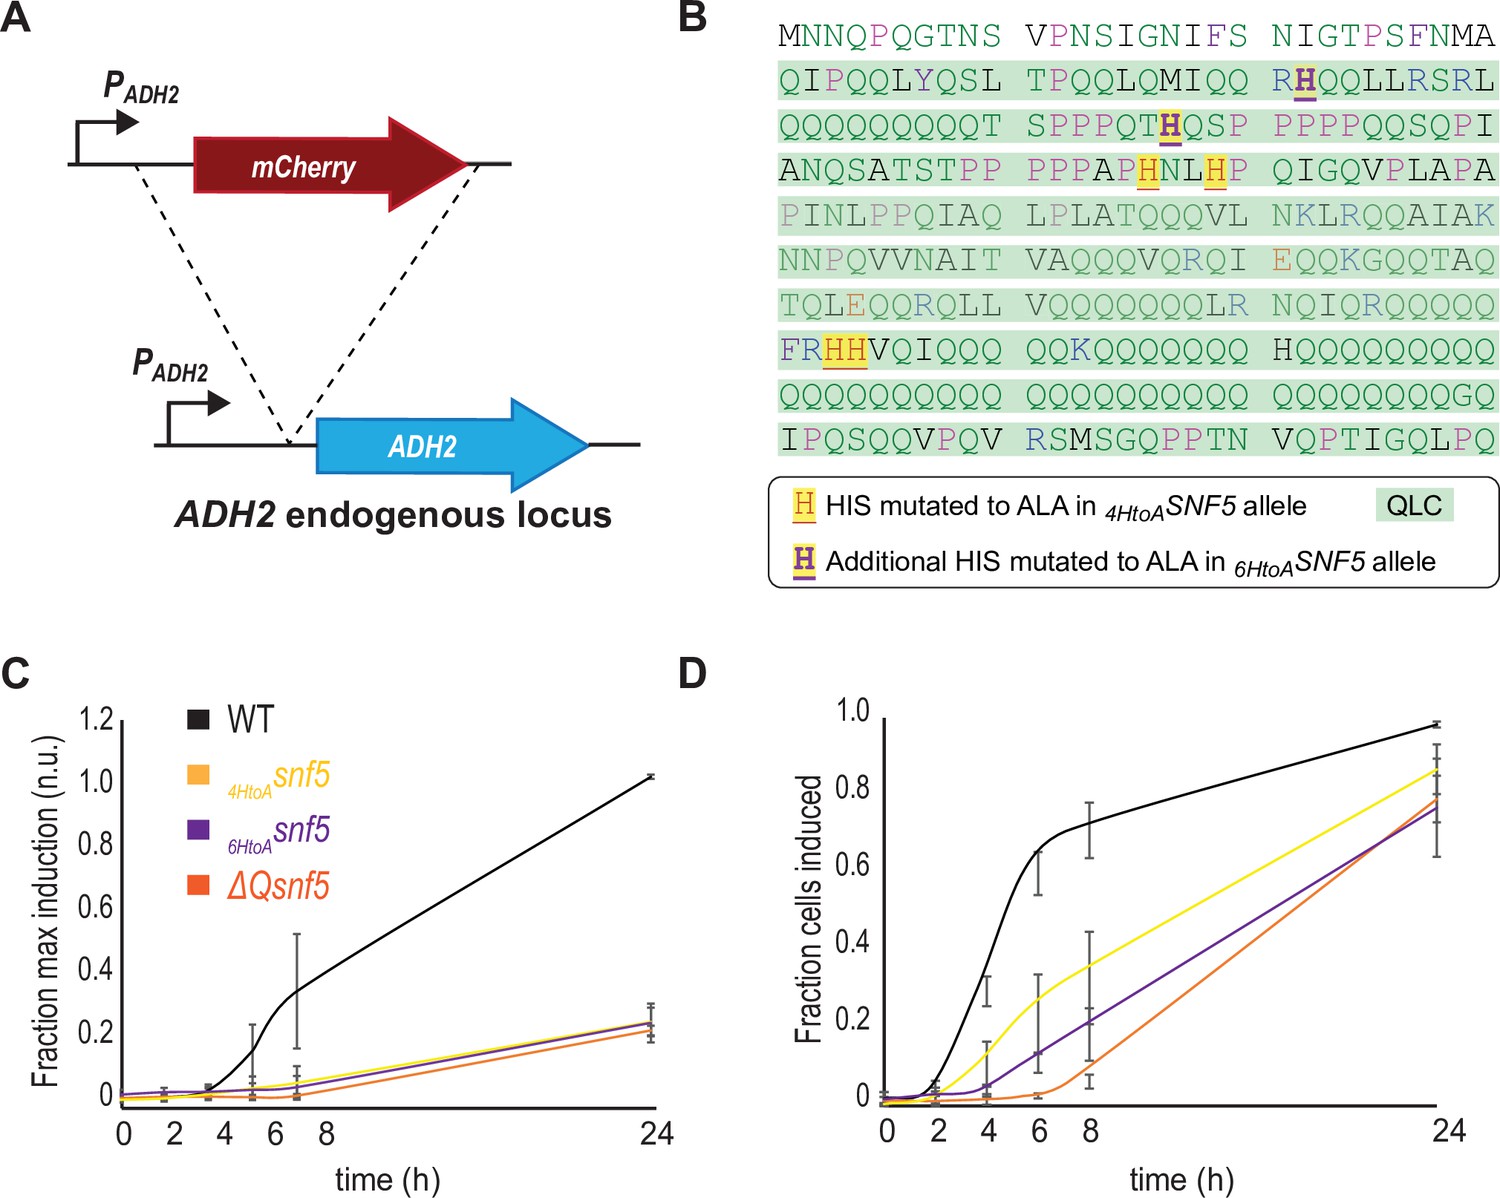
The SNF5 QLC and embedded histidines are required for efficient ADH2 induction upon carbon starvation.
(A) Schematic of the PADH2-mCherry reporter gene: the reporter construct was integrated into the endogenous ADH2 locus, resulting in a tandem repeat of the reporter gene followed and an intact ADH2 gene. (B) Sequence of the SNF5 N-terminus with the 4/7 histidines that were mutated in the 4HtoAsnf5 allele highlighted as red on yellow, and the additional two histidines that were mutated in the 6HtoAsnf5 allele highlighted as purple on yellow. (C) PADH2-mCherry induction during carbon starvation assessed by fluorescence cytometry, normalized to the maximal induction (median mCherry fluorescence at 24 hr in SNF5 WT strains). (D) The fraction of the cells that induce PADH2-mCherry induction at each time point during carbon starvation (see Materials and methods). The SNF5 alleles compared are WT, ΔQsnf5, 4HtoAsnf5 (referred to in the rest of the article as simply HtoAsnf5), and the 6HtoAsnf5 strains with an additional two histidines (6/7 total) mutated to alanine. There is no significant difference between the 4HtoAsnf5 and 6HtoAsnf5 strains in these experiments. Mean and standard deviation are shown in each plot.
Figure 2 with 5 supplements
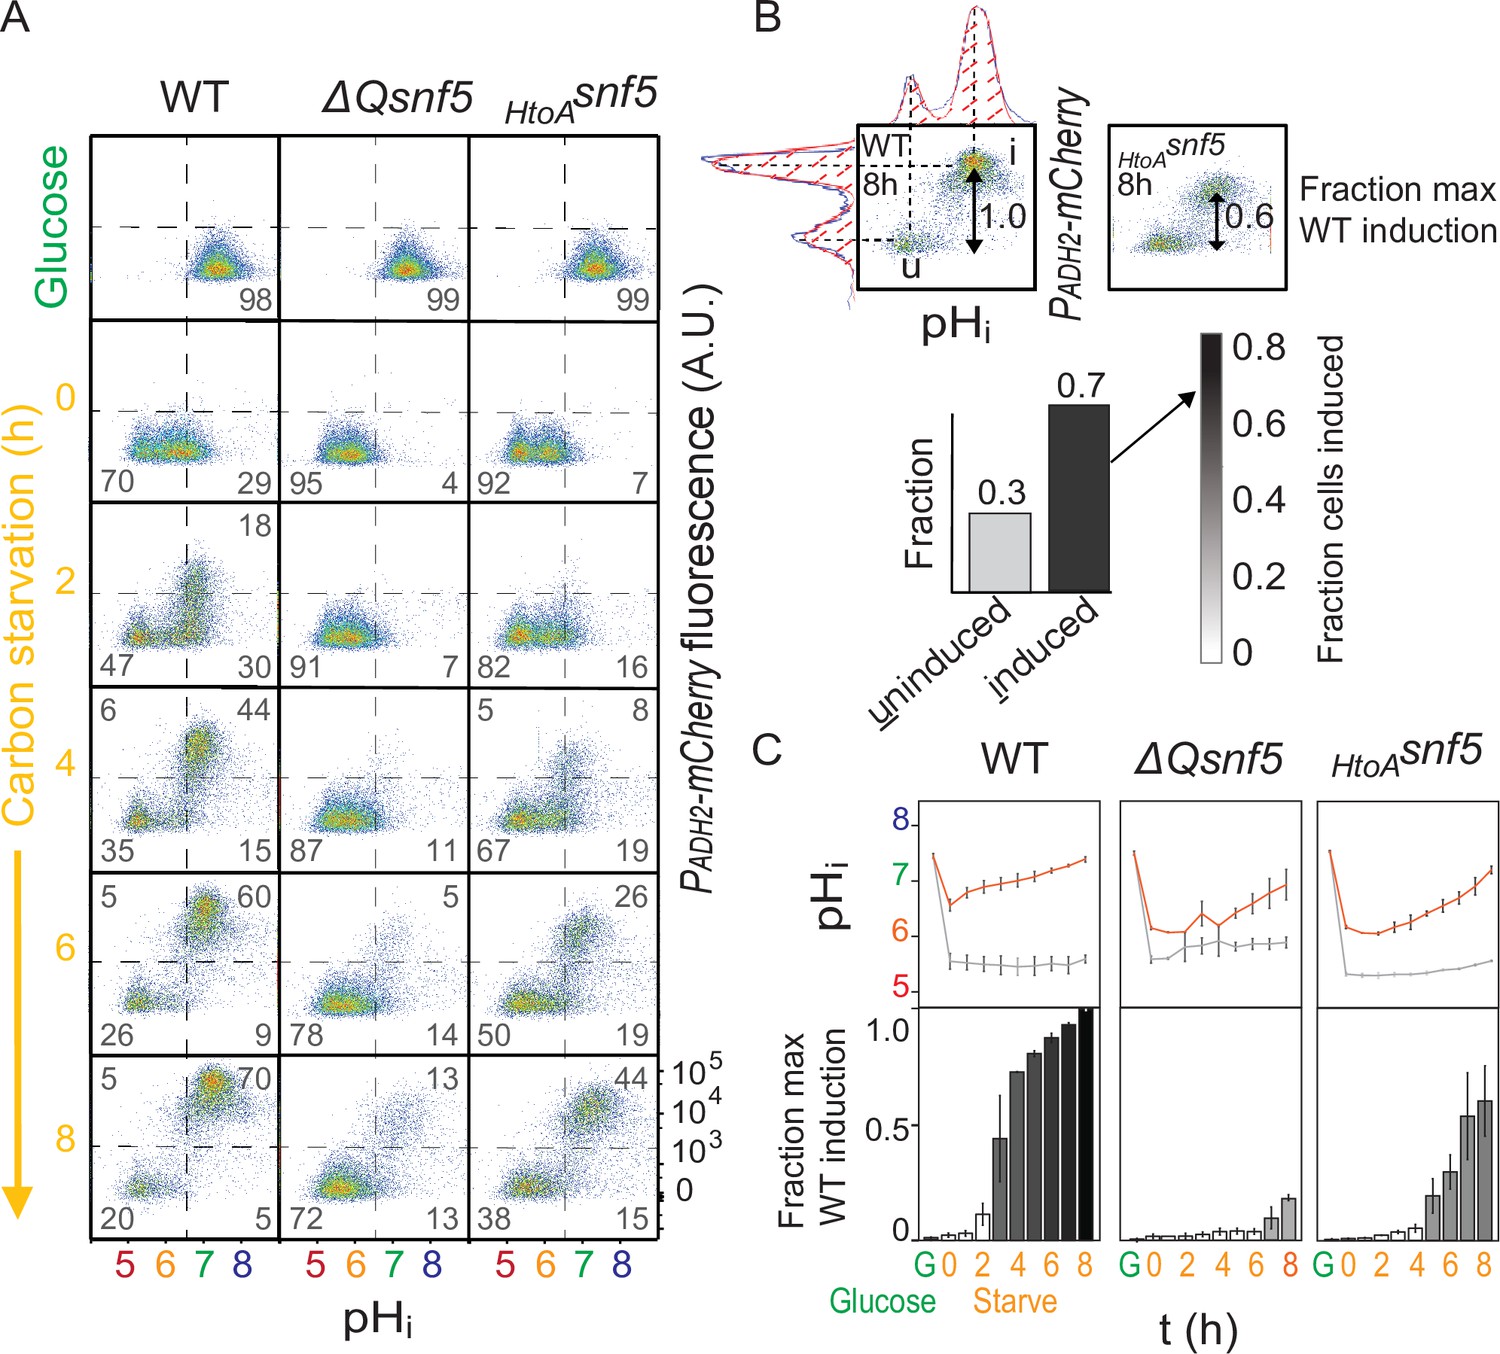
The SNF5 QLC is required for ADH2 expression and recovery of neutral pH.
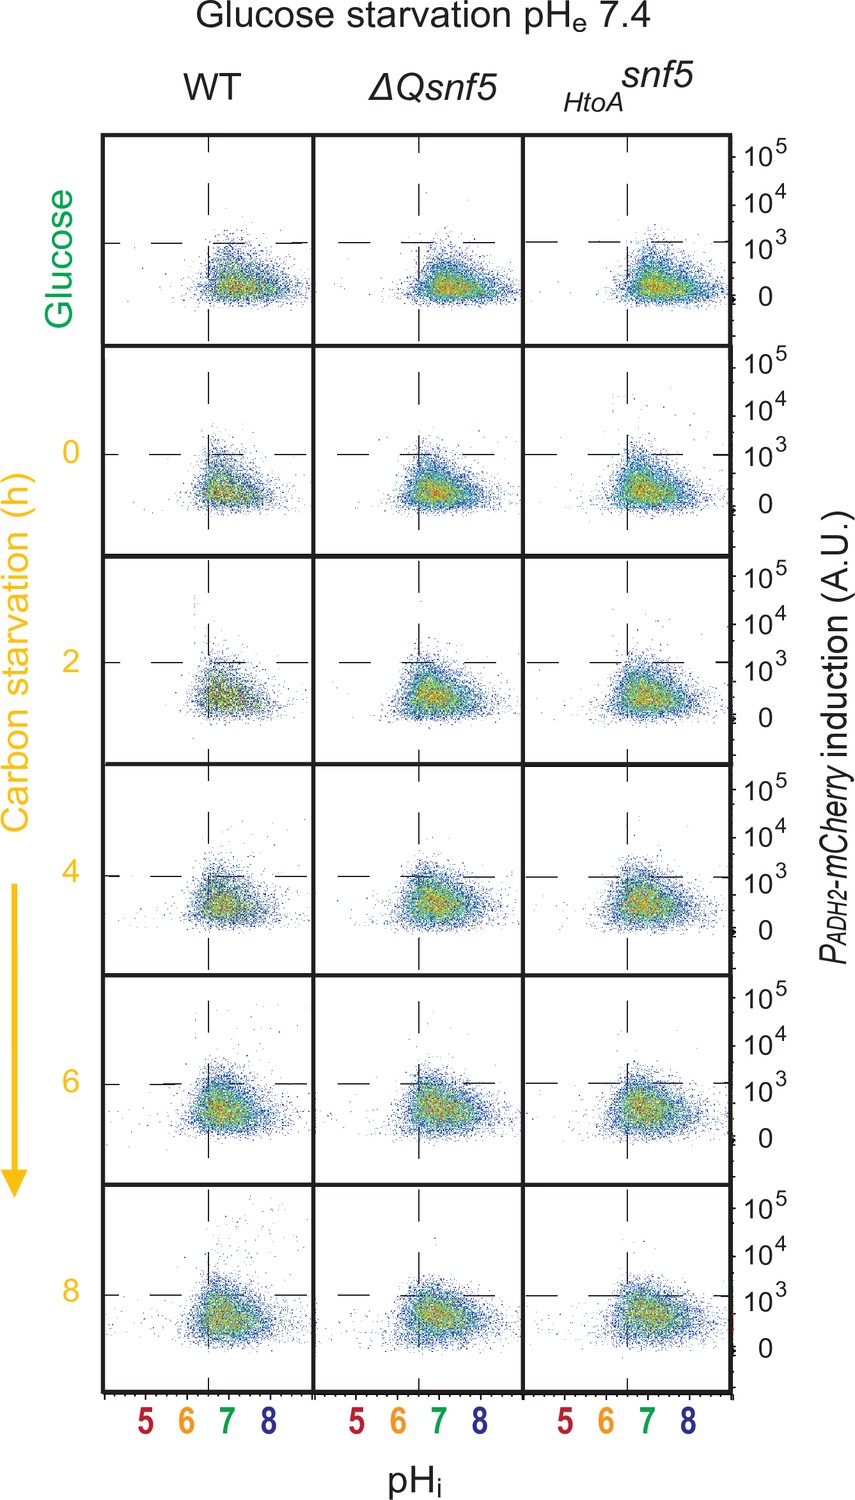
(A) Representative flow cytometry for WT, ΔQsnf5, or HtoAsnf5 strains: the x-axis shows nucleocytoplasmic pH (pHi), while the y-axis shows fluorescence from the PADH2-mCherry reporter. Panels show cells grown in glucose (top) and then (second to bottom) after 0–8 hr of acute glucose starvation. Percentage of cells in each quadrant is indicated by gray numbers. (B) Schematic of quantification scheme: raw data from (A) was fit to a single or double Gaussian curve determined by a least-residuals method. (C) Quantification of pHi and PADH2-mCherry expression during acute starvation. The median of each Gaussian for pHi is plotted in (C, top), black and gray lines are from induced and uninduced populations, respectively. The height of bars in (C, bottom) indicates the fraction of maximal PADH2-mCherry reporter gene expression (WT cells, 8 hr glucose starvation) The darkness of the bars indicates the fraction of the population in the induced versus uninduced state. Mean and standard deviation of three biological replicates are shown.
Figure 2—figure supplement 1
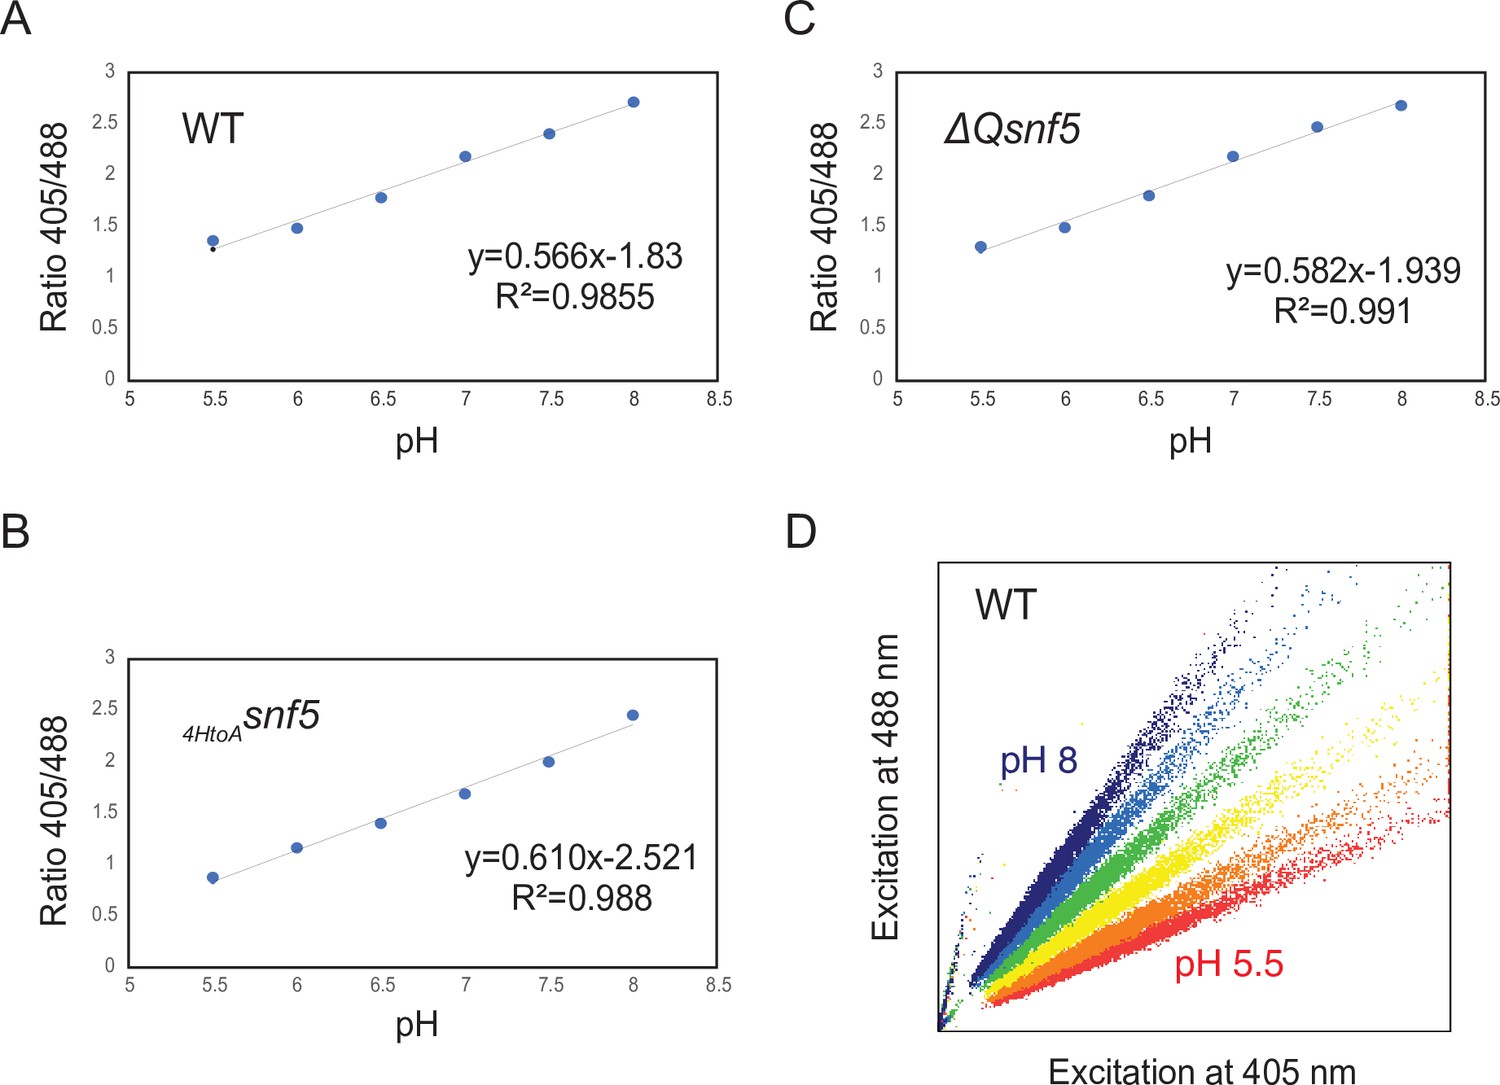
Examples of calibration curves to measure cytosolic pH using pHluorin.
(A–C) Representative calibration curves to determine the ratio of fluorescence intensities at 405 and 488 nm in cells adjusted to a known pH by ATP depletion and permeabilization in buffers. The fluorescence properties of WT and mutant strains were slightly different; therefore, calibration curves were calculated for each strain: (A) WT, (B) ΔQsnf5, and (C)HtoAsnf5. (D) Shows representative scatterplots of fluorescence intensity obtained by cytometry from the WT strain.
Figure 2—figure supplement 2
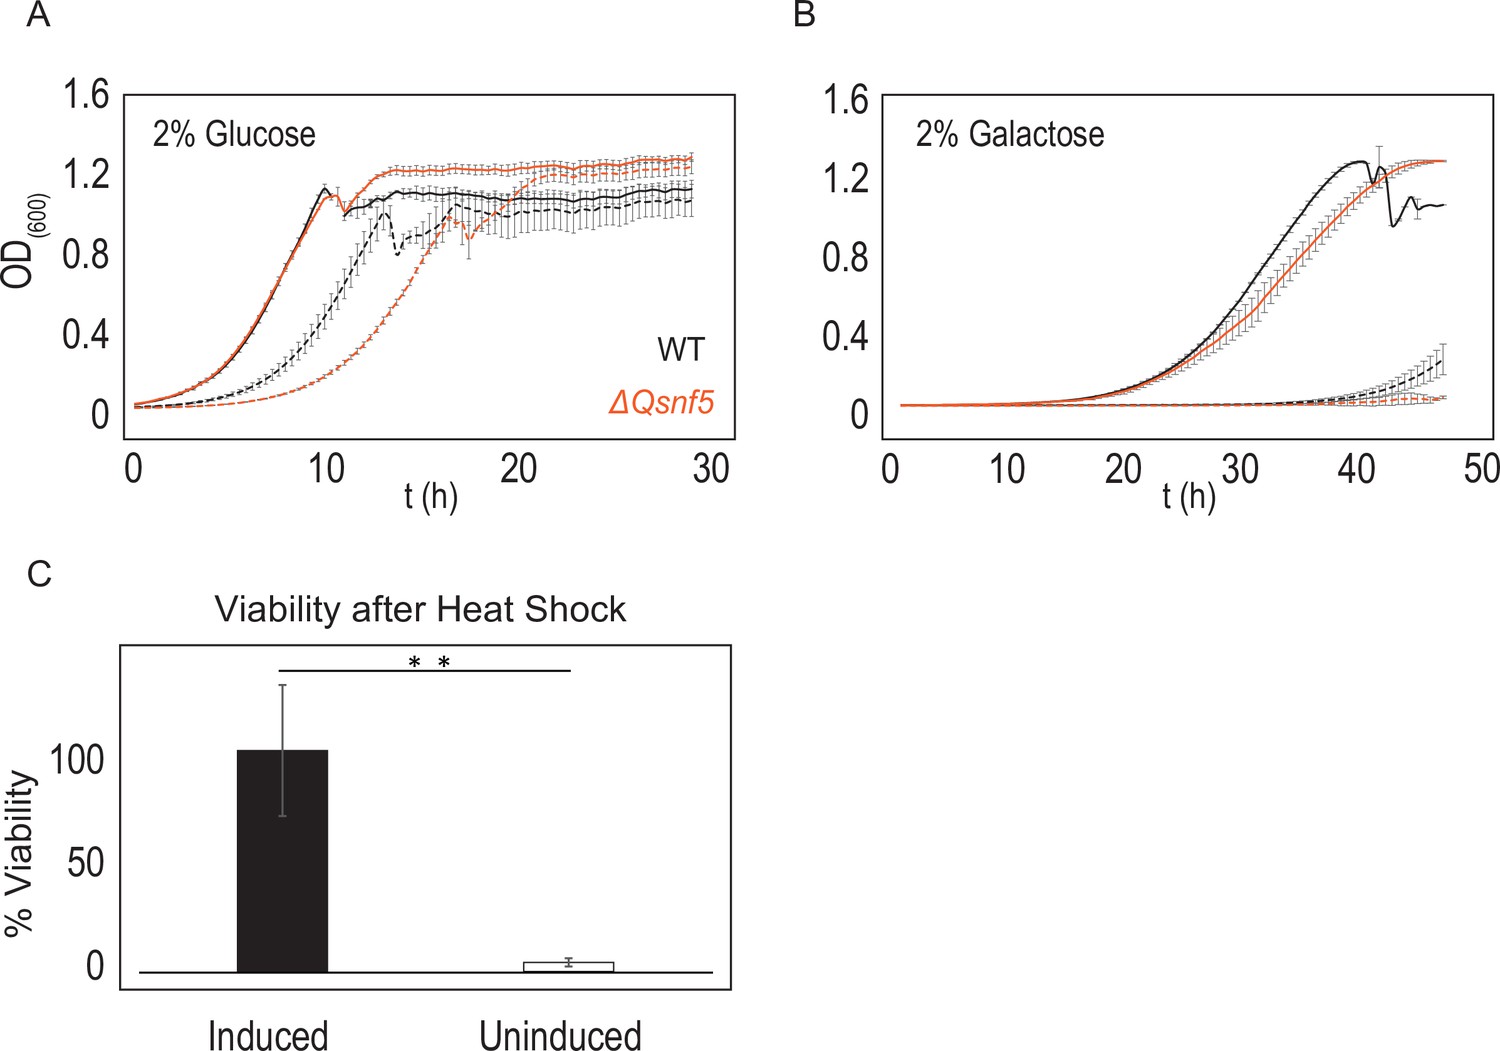
Cells that fail to induce PADH2-mCherry had lower fitness relative to the inducing population.
6 hr after acute carbon starvation, we used fluorescence-activated cell sorting (FACS) to separate equal numbers of cells with high (induced) and low (uninduced) mCherry fluorescence. (A, B) Uninduced cells (dashed lines) have lower growth rates than induced cells (solid lines). Black lines indicate WT strains, orange indicates ΔQsnf5 cells. (A) Comparison of growth rates in rich (2% glucose) media. (B) Comparison of growth rates in poor (2% galactose) media. (C) Uninduced cells have lower resistance to heat stress. Cells were subjected to heat shock for 15 min at 42°C followed by 3 min on ice, and then plated for single colonies. The number of colonies relative to unperturbed cells is plotted as % viability. Mean and standard deviation are shown, n = 3; statistical test is the Student’s t-test, **p<0.01.
Figure 2—figure supplement 3
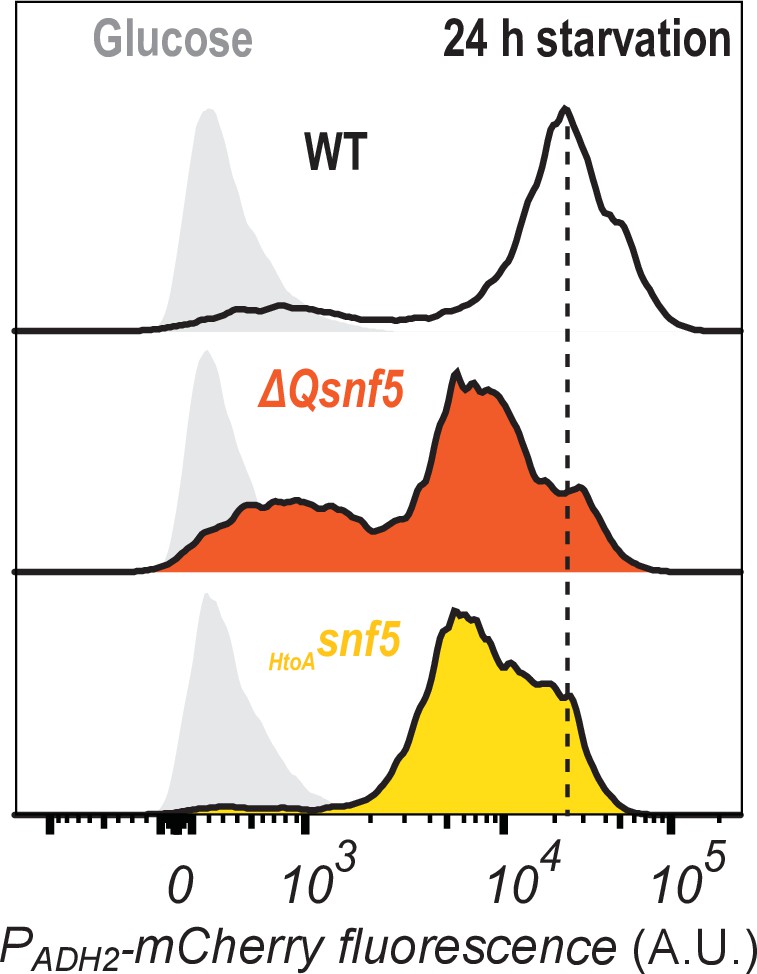
All strains ultimately express some amount of PADH2-mCherry reporter.
Cytometry data showing PADH2-mCherry induction either in glucose (light gray peaks to left) or after 24 hr of carbon starvation (dark lines, and color coded by strain).
Figure 2—figure supplement 4
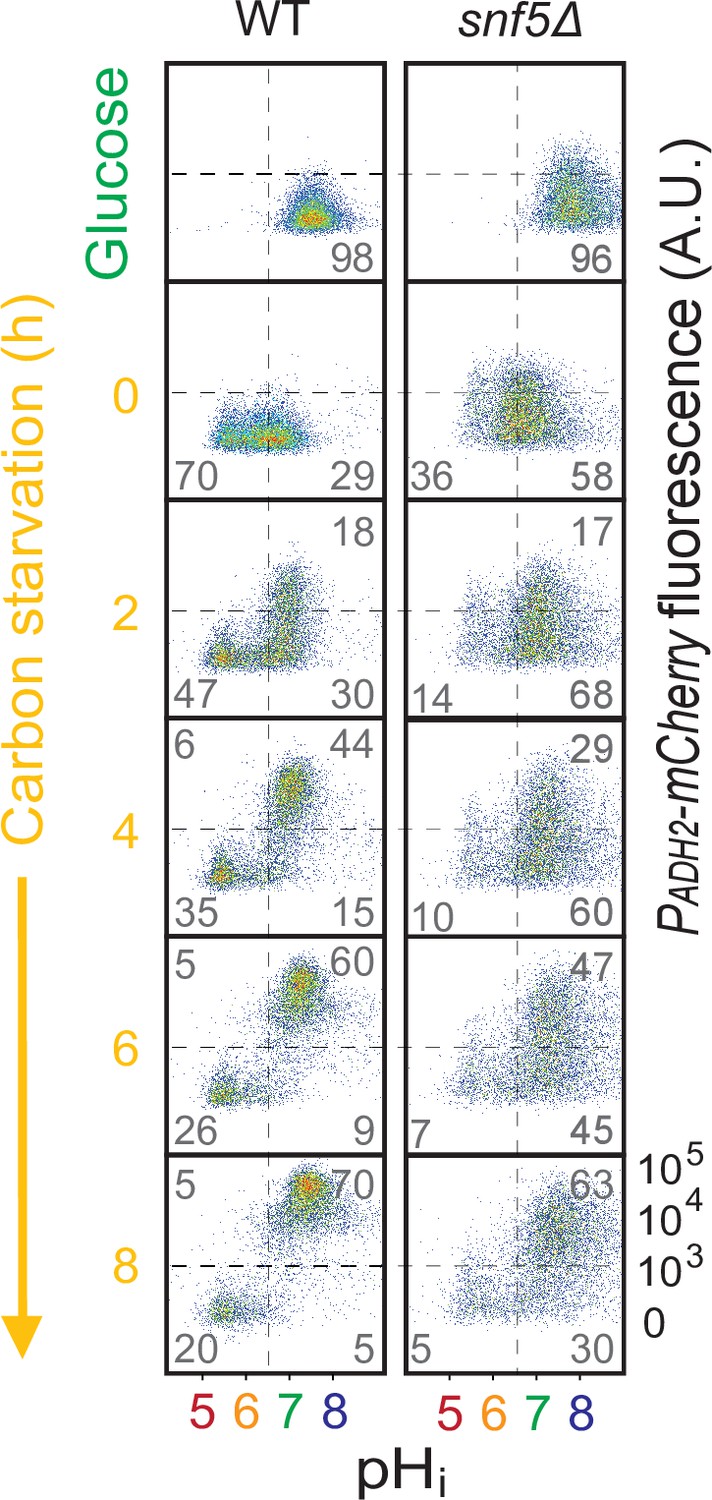
snf5∆ strains only had a slight delay in expression of the PADH2-mCherry reporter.
Cytometry data showing PADH2-mCherry induction (y-axis) and nucleocytoplasmic pH (pHi), calculated using the ratiometric pHluorin probe (x-axis), in WT (left) and snf5∆ (right) strains. Percentage of cells in each of the four quadrants is indicated.
Figure 2—figure supplement 5
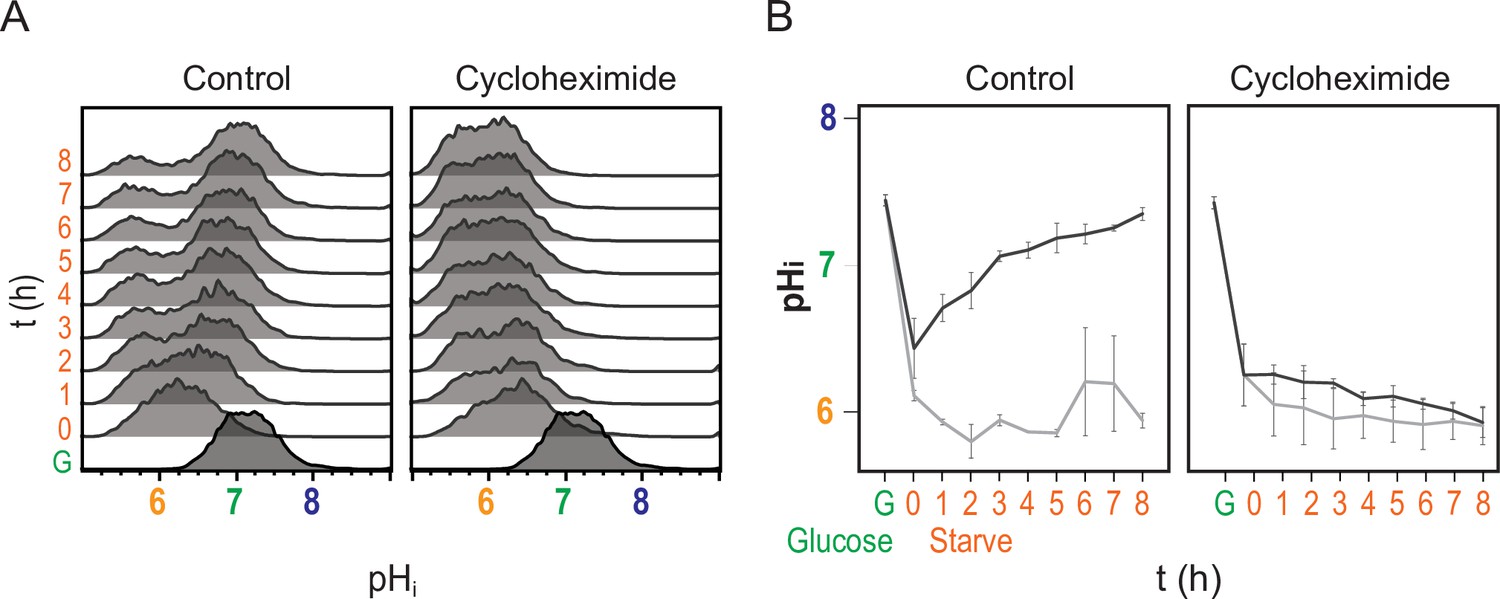
Recovery of pHi requires new protein translation.
(A) Cytometry data showing nucleocytoplasmic pH (pHi), calculated using the ratiometric pHluorin probe. (B) Quantification of pHi data (see Materials and methods), orange and gray lines are from induced and uninduced populations, respectively. Mean and standard deviation of three biological replicates are plotted. Cells were switched to acute carbon starvation media titrated to the optimal pHe of 5.5 at time 0, but the right panels show cells additionally exposed to the translational inhibitor cycloheximide. Intracellular pH fails to recover without new protein translation.
Figure 3 with 4 supplements
Transient acidification is required for ADH2 induction upon carbon starvation.
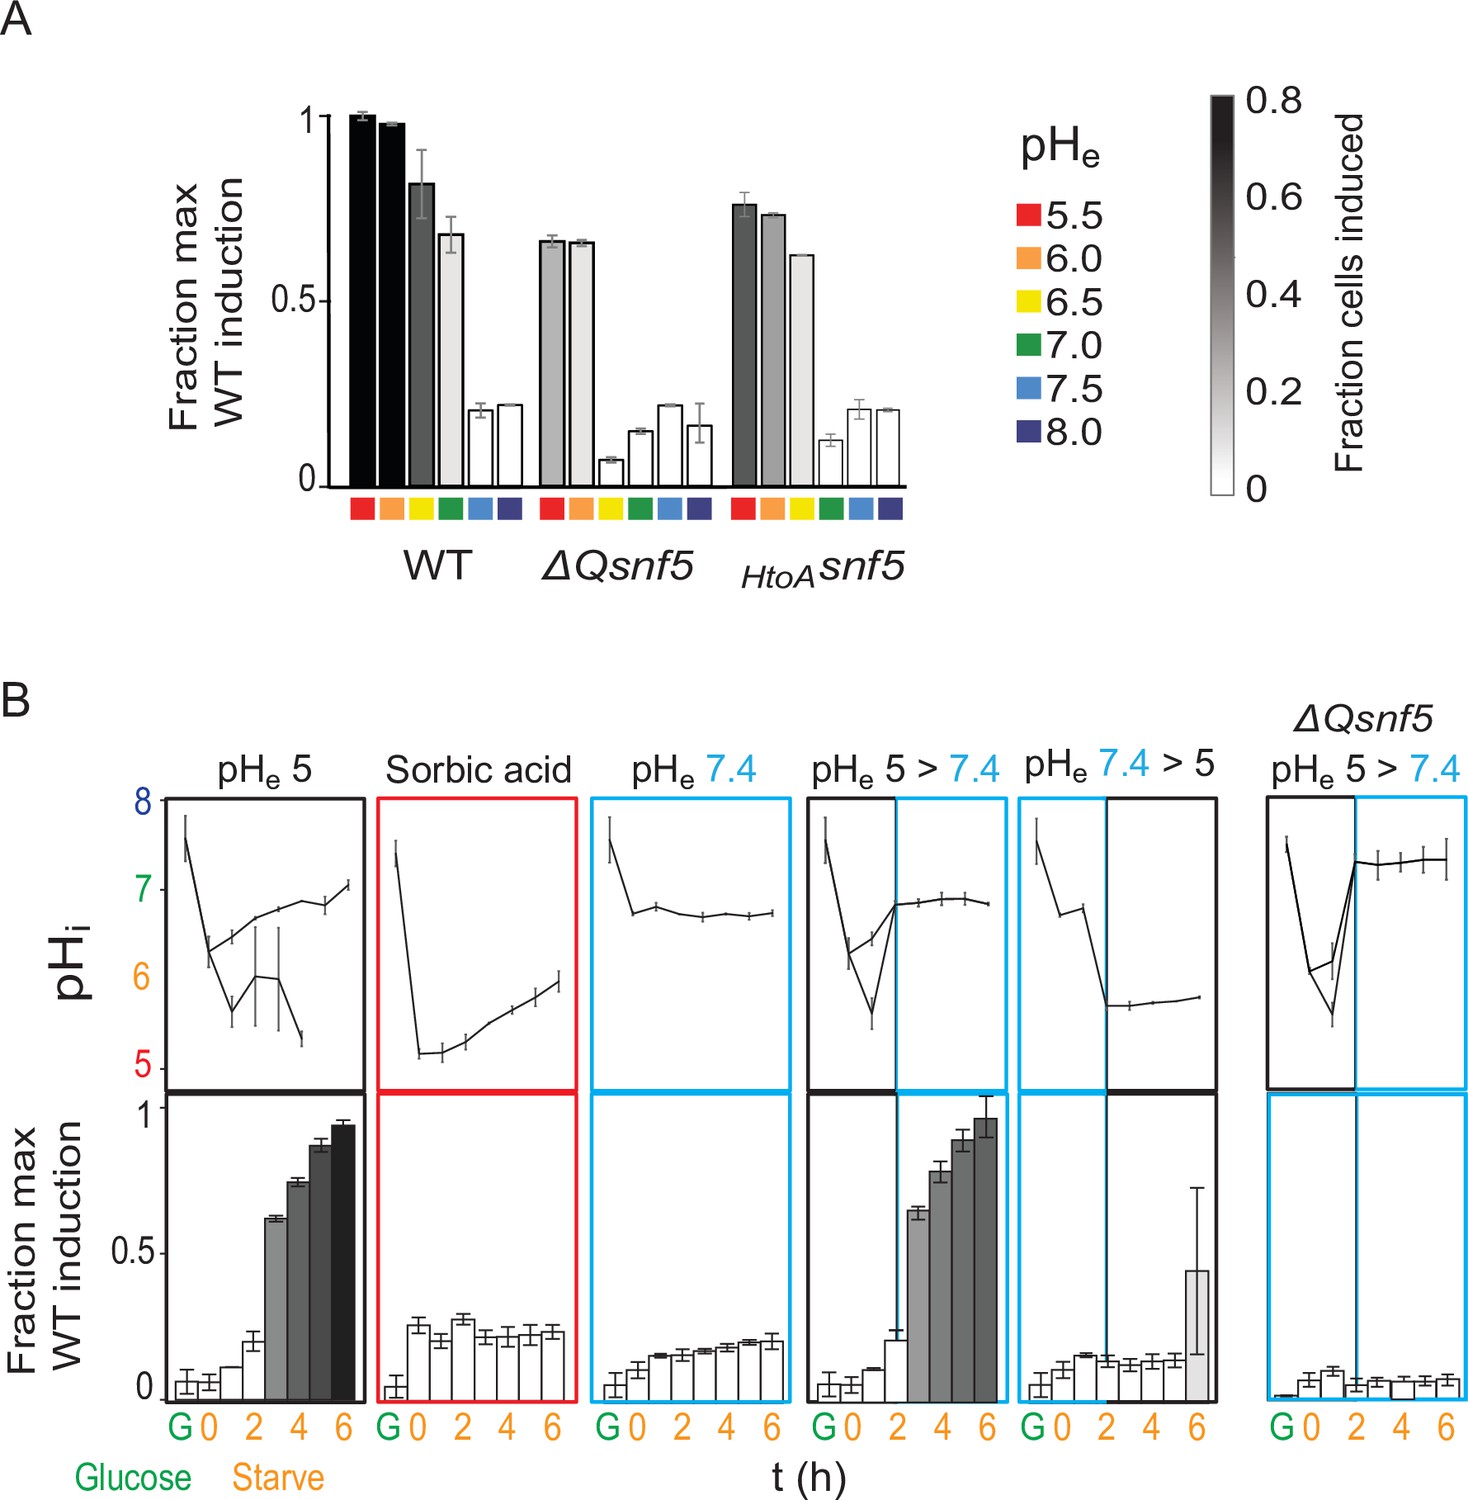
(A) Expression of PADH2-mCherry reporter gene in WT, ΔQsnf5, or HtoAsnf5 strains 8 hr after acute carbon starvation in media titrated to various pH (pHe, see legend, right). Bar height indicates the fraction of maximal PADH2-mCherry reporter gene expression (WT cells, pHe 5.5). The darkness of the bars indicates the fraction of the population in the induced versus uninduced state (see legend, right). (B) Time courses of glucose starvation with media manipulations to perturb the intracellular pH response, either by changing media pH (pHe) or by adding sorbic acid. Top panels show nucleocytoplasmic pH (pHi), black and gray lines from induced and uninduced populations, respectively. Bottom panels quantify expression of the PADH2-mCherry reporter gene (as in A). All strains are WT except for the far-right panels, which are from a ΔQsnf5 strain.
Figure 3—figure supplement 1

Deletion of the N-terminal glutamine-rich domain of SNF5 renders cells hypersensitive to starvation at suboptimal extracellular pH.
Cells were grown to log phase and then subjected to acute carbon starvation in media titrated to various pHe values (see legend). After 24 hr starvation, cells were plated to determine the number of colony-forming units compared to WT cells starved at pHe 6.5. Mean and standard deviation of three biological replicates are shown. * and ** represent p<0.05 and p<0.01, respectively, from t-tests.
Figure 3—figure supplement 2

PADH2-mCherry induction requires an acidic extracellular environment and the SNF5 QLC.
Cytometry data showing expression levels of the PADH2-mCherry reporter from WT, ΔQsnf5, or HtoAsnf5 cells either growing in glucose (Glu), or 6 hr after acute carbon starvation in media titrated to various pHe values (these are representative source data for Figure 3A).
Figure 3—figure supplement 3
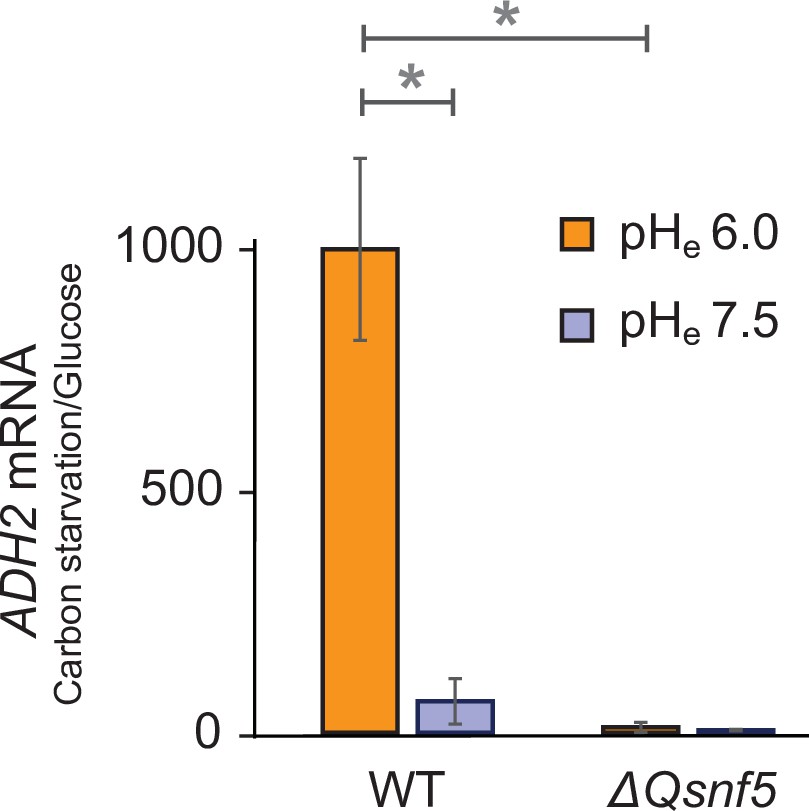
Expression of the endogenous ADH2 mRNA requires an acidic extracellular environment and the SNF5 QLC.
RT-qPCR data showing ADH2 mRNA levels. The ratio of ADH2 levels in carbon-starved cells to cells growing in glucose is shown. ACT1 was used as an internal control to normalize ADH2 values. WT and ΔQsnf5 strains were carbon-starved in media titrated to pHe of either 6.0 or 7.5. Mean and standard deviation of three biological replicates are shown. * and ** represent p<0.05 and p<0.01, respectively, from t-tests.
Figure 3—figure supplement 4
Transient acidification of cells requires an acidic extracellular environment.
Flow cytometry for WT, ΔQsnf5, or HtoAsnf5 strains: the x-axis shows nucleocytoplasmic pH (pHi), while the y-axis shows fluorescence from the PADH2-mCherry reporter. Panels show cells grown in glucose (top) and then (decond to bottom) after 0–8 hr of acute glucose starvation.
Figure 4
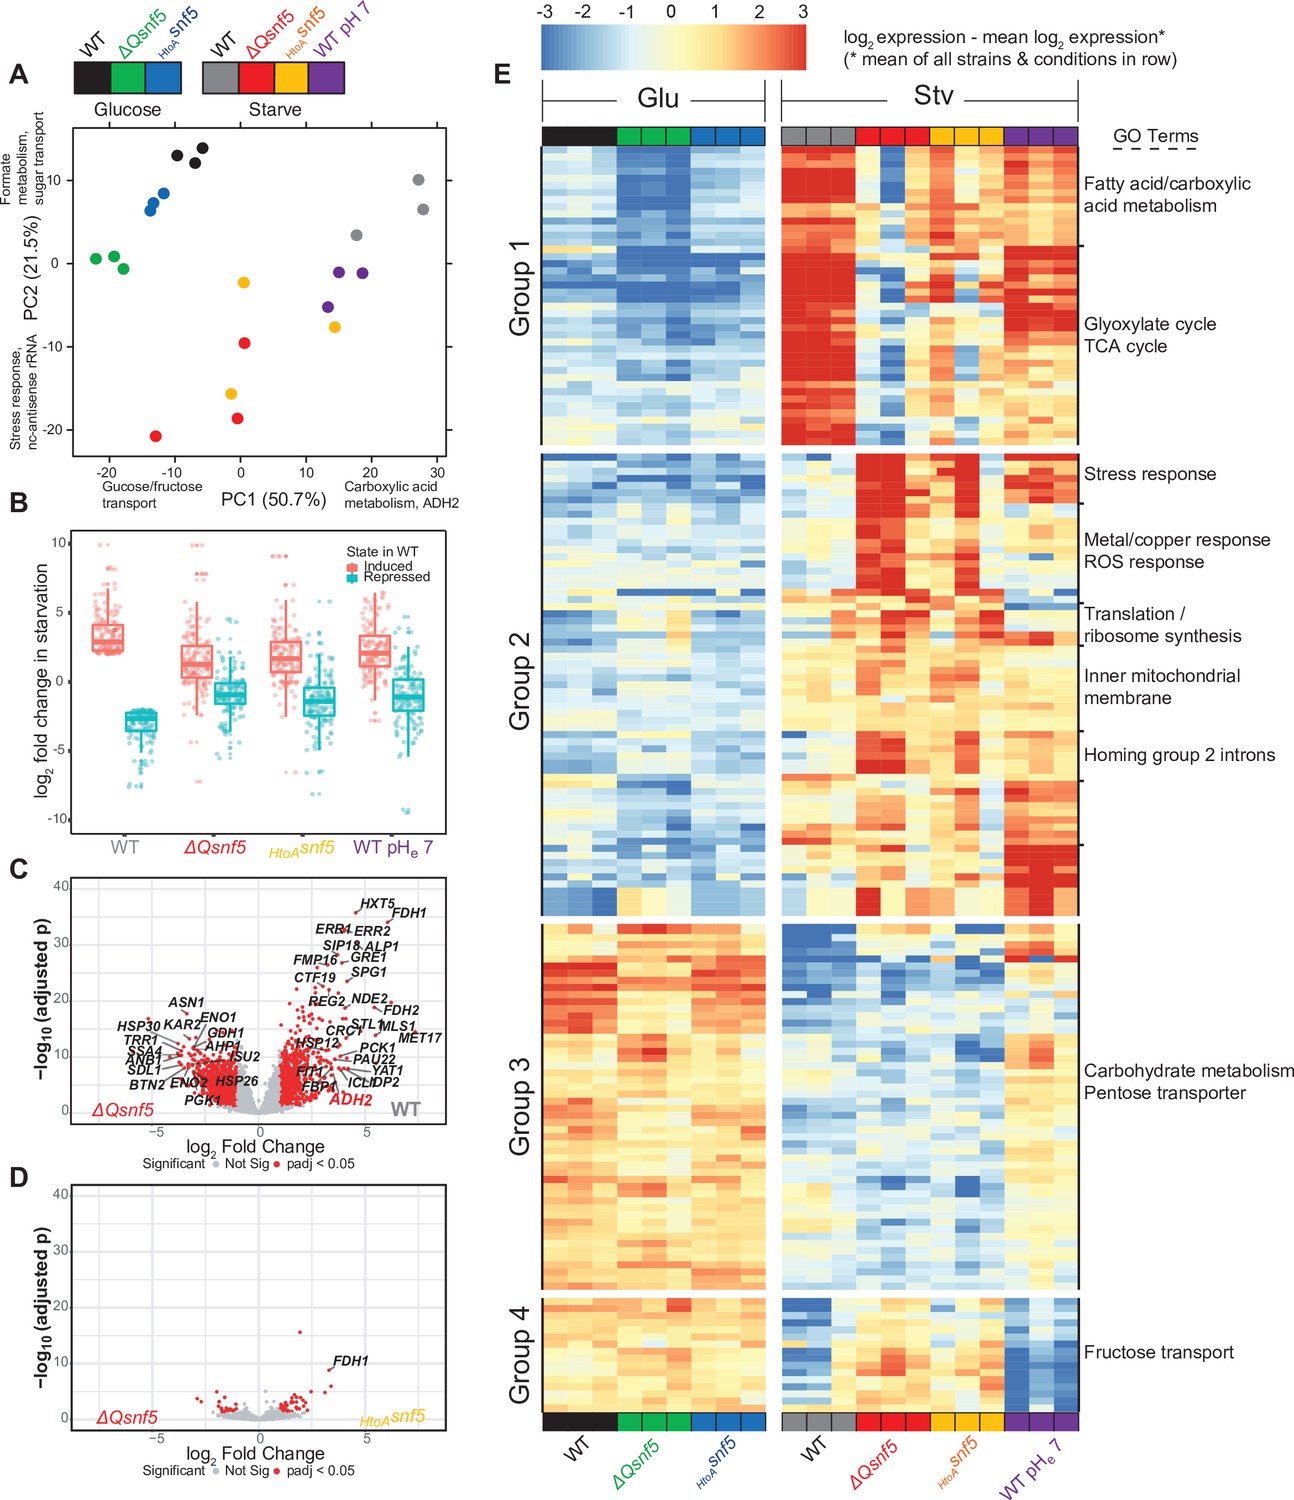
The SNF5 QLC and acidification of the nucleocytoplasm are required for efficient widespread transcriptional reprogramming upon carbon starvation.
(A) Principal component (PC) analysis of three RNA-seq biological replicates for each condition tested. (B) Expression levels of genes that were greater than threefold induced or repressed upon carbon starvation in WT strains are plotted for each SNF5 allele. (C) Volcano plot showing the log2 ratio of expression levels in WT versus ΔQsnf5 strains (x-axis) and p-values for differential expression (y-axis). Genes with significantly different expression are indicated in red (log2 fold change > 1 and Wald test adjusted p-value<0.05). (D) Volcano plot as in (C) but comparing expression levels in HtoAsnf5 strains to ΔQsnf5 strains. (E) Hierarchically clustered heat map showing expression values of 149 genes with a significant change in expression upon starvation of WT cells (log2 fold change > 1 and Wald test adjusted p-value<0.05). Color code indicates gene expression relative to the mean expression of that gene across all strains and conditions, with red indicating high and blue indicating low values (see legend). Three biological replicates are shown for each experiment. Strain and condition identities are indicated at the bottom of each column. Four groups of genes with similar behavior are indicated to the left. Gene Ontology enrichment results for nine clusters of genes are shown to the right.
Figure 5 with 2 supplements
The SNF5 QLC mediates a pH-sensitive transcription factor interaction in vitro.
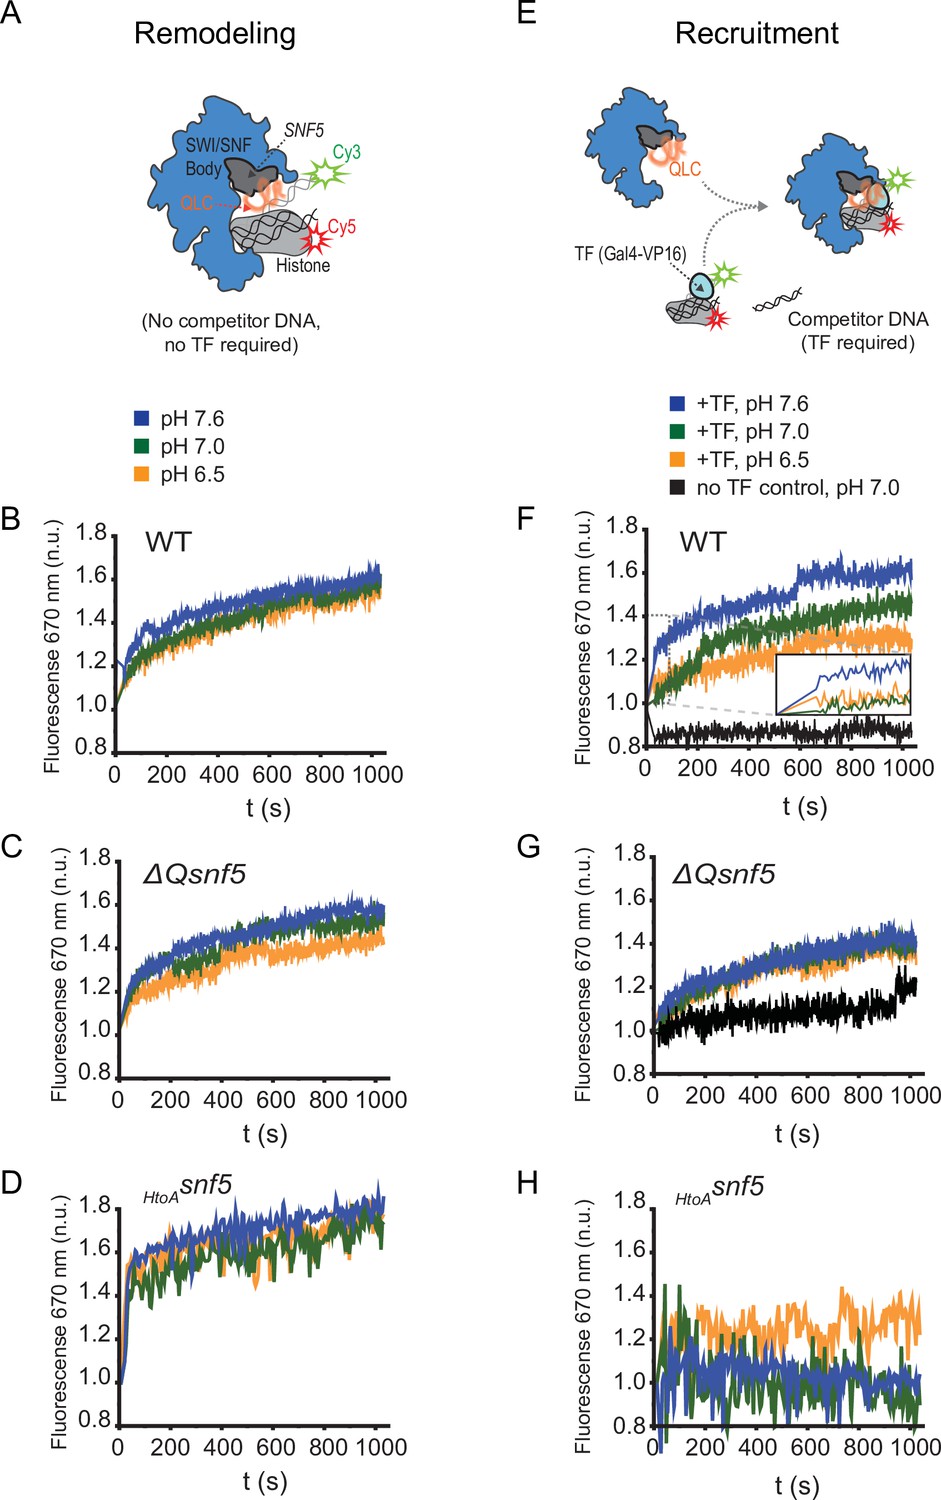
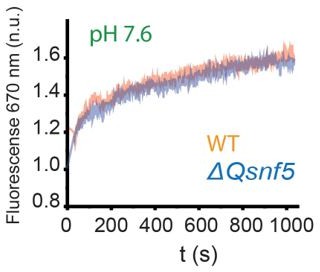
(A) Schematic: a Cy3 donor fluorophore was attached to one end of the DNA, and the histone H2A C-termini were labeled with a Cy5 acceptor fluorophore. ATP-dependent mobilization of the nucleosome to the DNA increases Förster resonance energy transfer (FRET), leading to increased emission at 670 nm. (B) Representative kinetic traces for WT (B), ΔQsnf5p (C), and HtoAsnf5 (D) SWI/SNF complexes at pH 7.6 (blue), 7.0 (green), or 6.5 (orange). There is no competitor DNA, so these traces indicate intrinsic remodeling activity without requirement for recruitment by transcription factors. (E) Schematic: in the presence of excess competitor DNA, SWI/SNF-dependent remodeling requires recruitment by a transcription factor (Gal4-VP16). (D) Representative kinetic traces for WT (F), ΔQsnf5p (G), and HtoAsnf5 (H) SWI/SNF complexes at pH 7.6 (blue), 7.0 (green), or 6.5 (orange). Inset on the WT panel (F) shows the first 100 s of the assay after ATP addition. All traces are averages of 2–4 experiments and represent FRET normalized to values prior to addition of ATP.
Figure 5—figure supplement 1
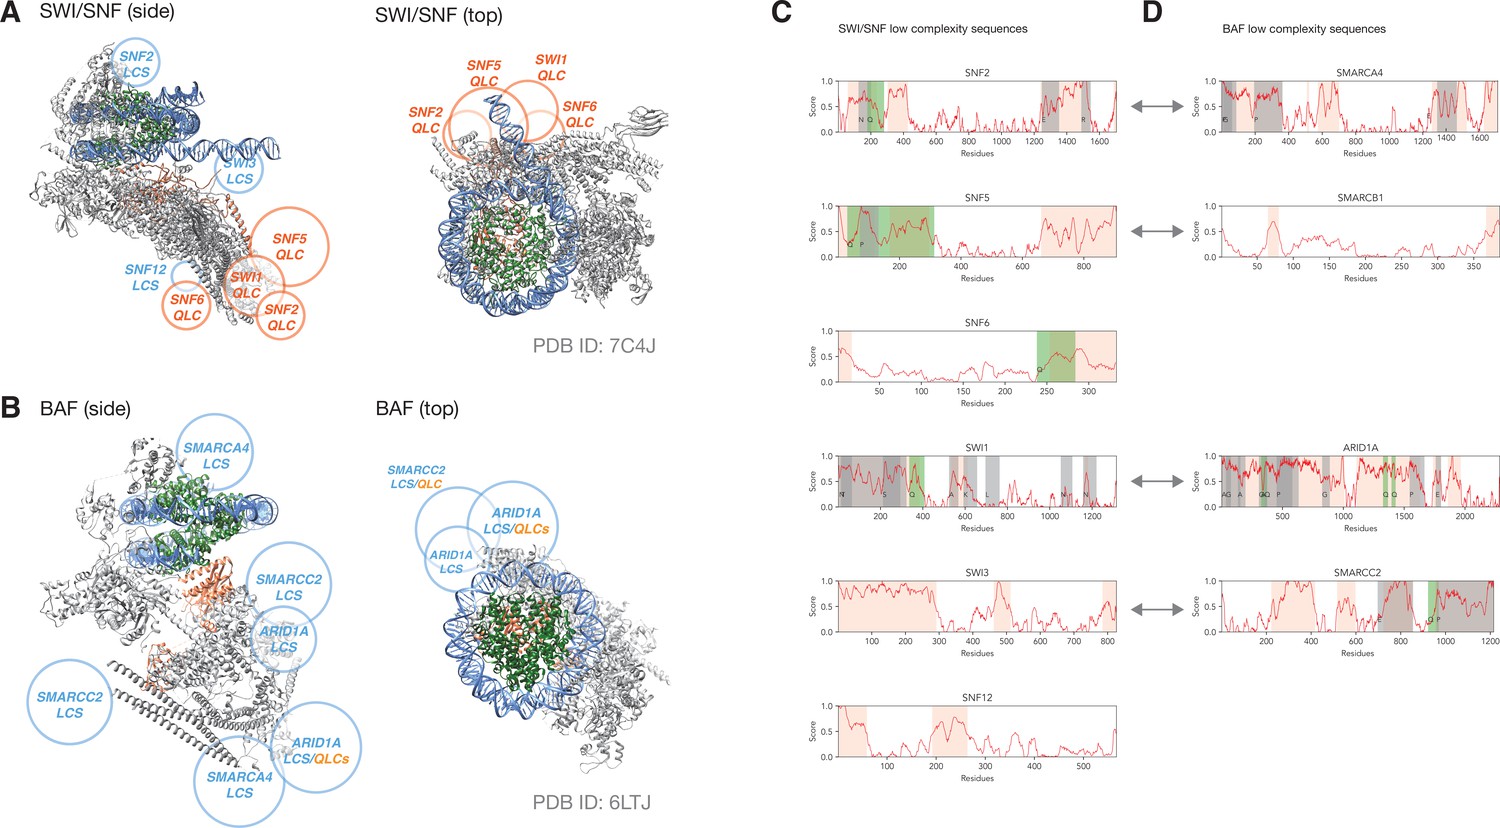
QLCs of SWI/SNF cluster around putative transcription factor interaction sites, as do low-complexity sequences of human BAF complex.
(A) Electron microscopy structure of SWI/SNF (gray) bound to a nucleosome (DNA blue, histones green; PDB ID: 7C4J). The position of SNF5 is highlighted in coral. Rough positions of QLCs are depicted in orange, and large low-complexity sequences are shown in cyan. (B) Electron microscopy structure of human BAF complex (gray) bound to a nucleosome (DNA blue, histones green; PDB ID: 6LTJ). The position of ARID1B is highlighted in coral. Rough positions of large low-complexity domains are depicted in cyan, two of which contain short QLCs (indicated in orange). In both cases, top views only highlight sequences that are proximal to the DNA exiting the nucleosome (potential transcription-factor binding site). (C, D) Schematics showing predicted low-complexity sequence (orange), including regions enriched for particular amino acids (gray, or green for QLCs). (C) shows SWI/SNF subunits and (D) shows BAF subunits. Orthology between SWI/SNF and BAF subunits is indicated by gray double-headed arrows.
Figure 5—figure supplement 2
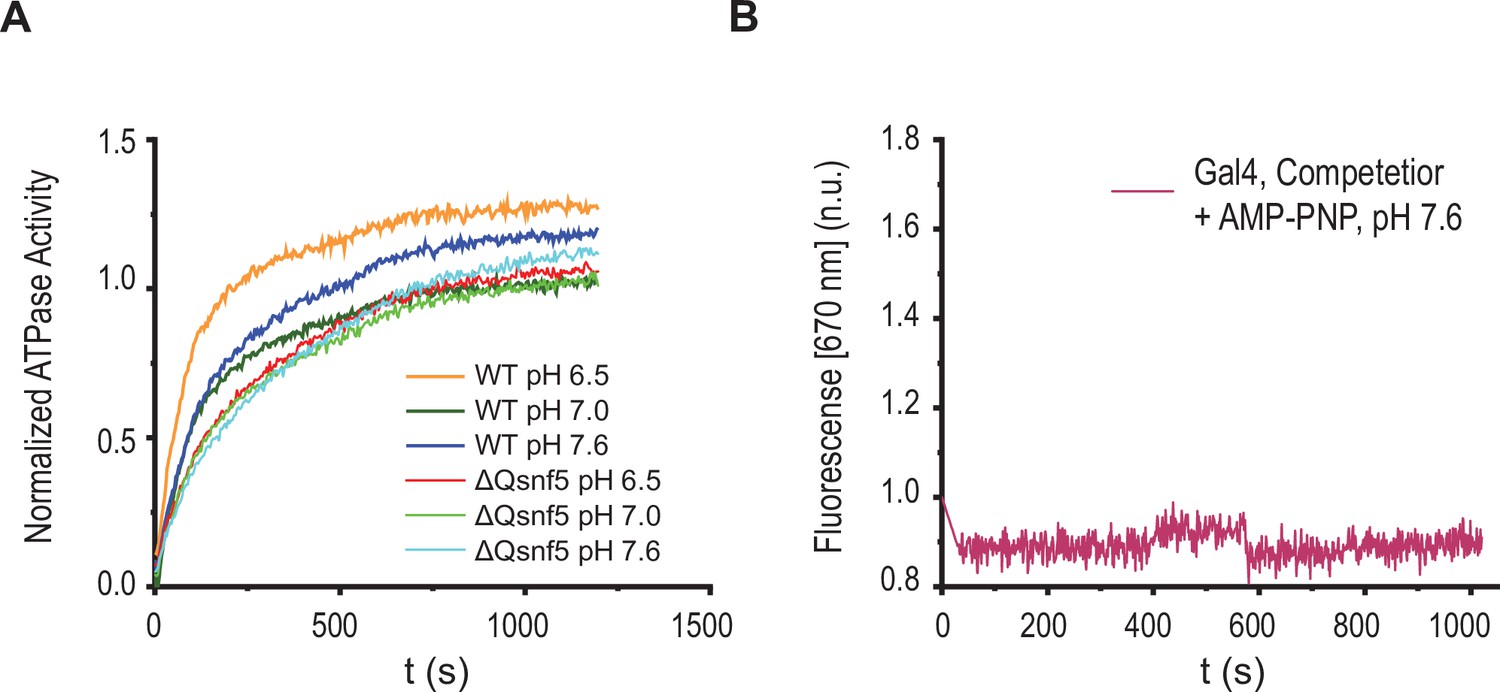
Basal ATPase activity is not affected by pH, and Förster resonance energy transfer (FRET) changes require ATP hydrolysis.
(A) Representative trace of ATPase activity for WT and ΔQsnf5 mutant SWI/SNF complexes in response to varied environmental pH. WT and mutant complexes do not show significant changes in ATPase activity (as assessed by inorganic phosphate release, see Materials and methods). (B) Representative kinetic trace for wild-type SWI/SNF under recruitment conditions after addition of AMP-PNP (a non-hydrolyzable ATP analogue).
Figure 6 with 1 supplement
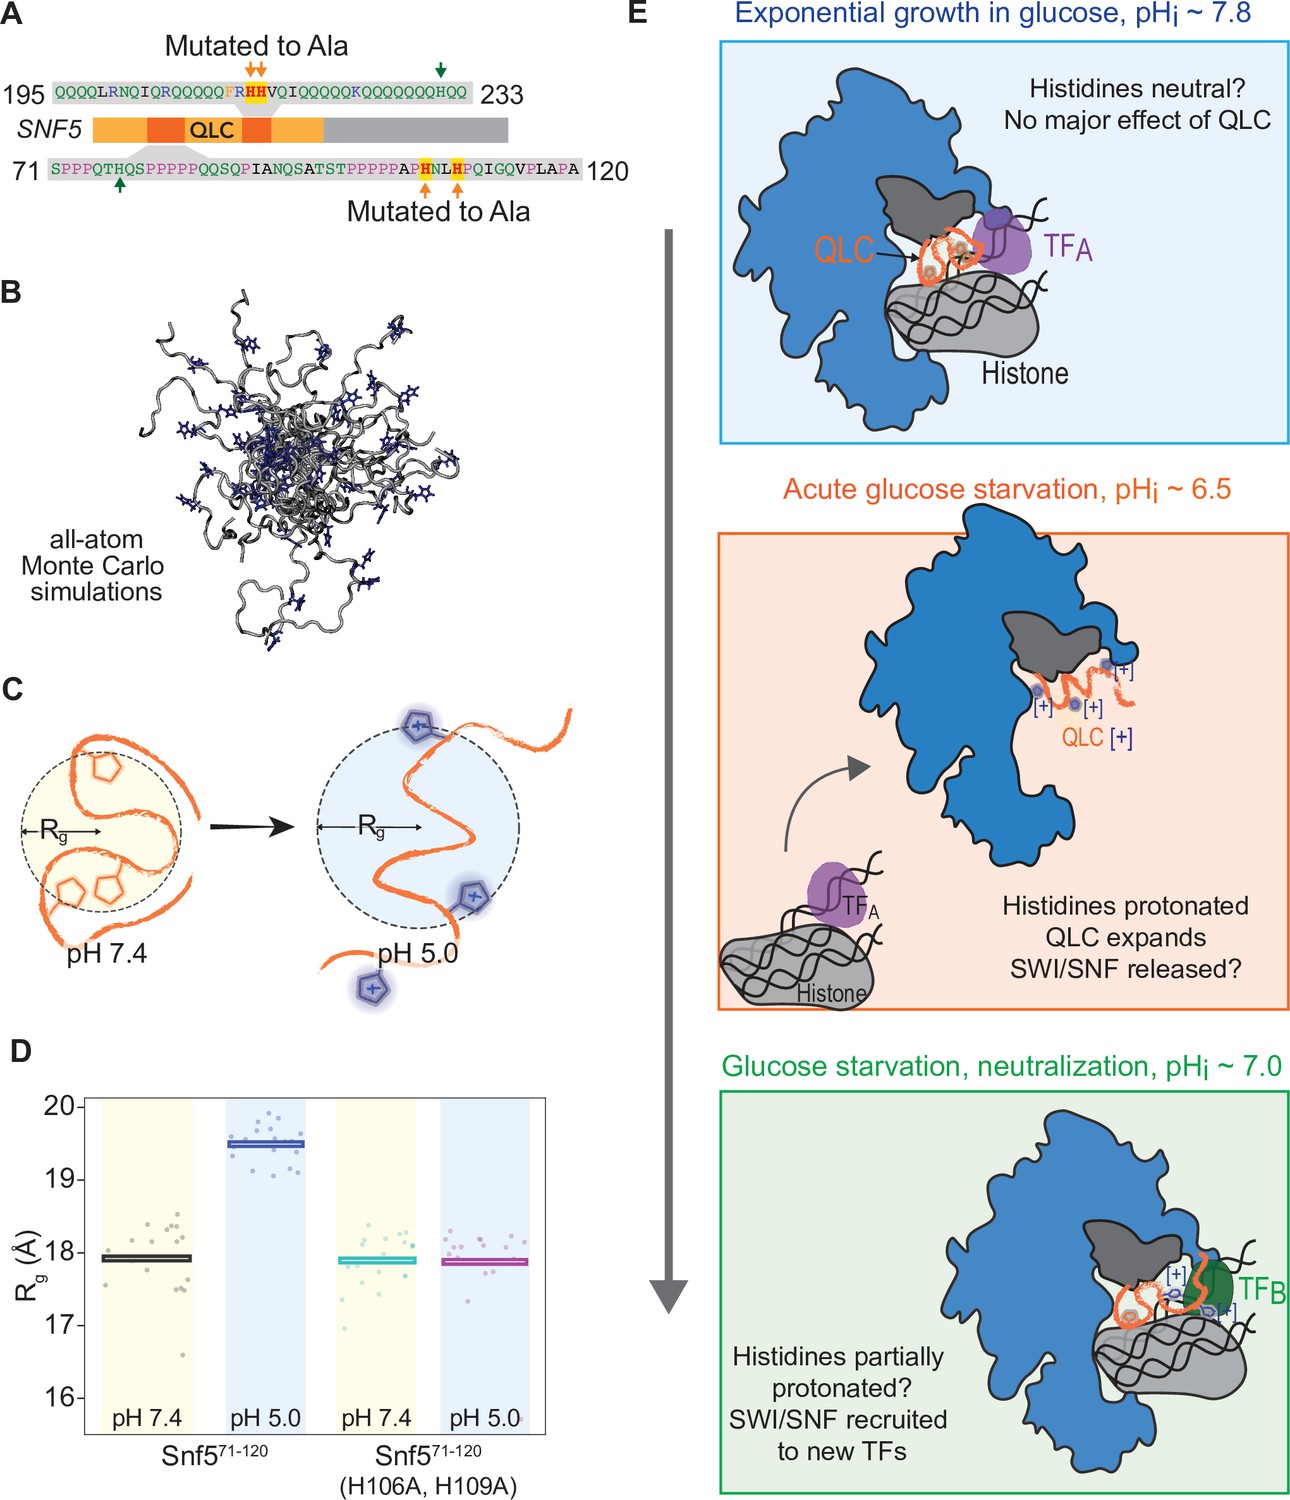
Protonation of histidines leads to conformational expansion of the SNF5 QLC.
(A) Schematic of the SNF5 gene (center) with the N-terminal QLC in orange and the two simulated peptides in dark orange. Sequences of the simulated peptides and identities of histidines mutated in both the HtoAsnf5 yeast strain and in simulations are indicated. (B) Representative images of conformations sampled in Monte Carlo all-atom simulations. (C) Cartoon depicting quantification of radius of gyration (Rg). (D) Radius of gyration (Rg, y-axis) of simulations of amino acids 71–120 of the SNF5 QLC with histidines either neutral (pH 7.4) or protonated (pH 5.0). Left two datasets are for the native peptide, right two datasets are with 2/3 histidines (H106 and H109) replaced with alanine, mimicking the HtoAsnf5 allele. Points represent the mean Rg from all conformations sampled in each independent simulation (beginning from distinct random initial conformers). Bars represent the mean values of all simulations. (E) Model of SWI/SNF regulation during carbon starvation. (Top) In glucose (pHi ~ 7.8), the SNF5 QLC is unprotonated. SWI/SNF is engaged by transcription factors that prevent transcription of glucose repressed genes or that activate other genes (TFA). (Middle) Upon acute carbon starvation, pHi drops to ~6.5, leading to protonation of histidines in the SNF5 QLC. Conformational expansion of the QLC may aid the release of SWI/SNF from some transcription factors (TFA) and potentially drive recruitment to others (not shown). (Bottom) As the cell adapts to carbon starvation, pHi neutralizes to ~7.0. Histidines within the SNF5 QLC may be partially protonated? The pKa of histidine is highly context-dependent. The QLC may aid recruitment of SWI/SNF to the promoters of glucose-repressed genes, thus leading to their expression.
Figure 6—figure supplement 1
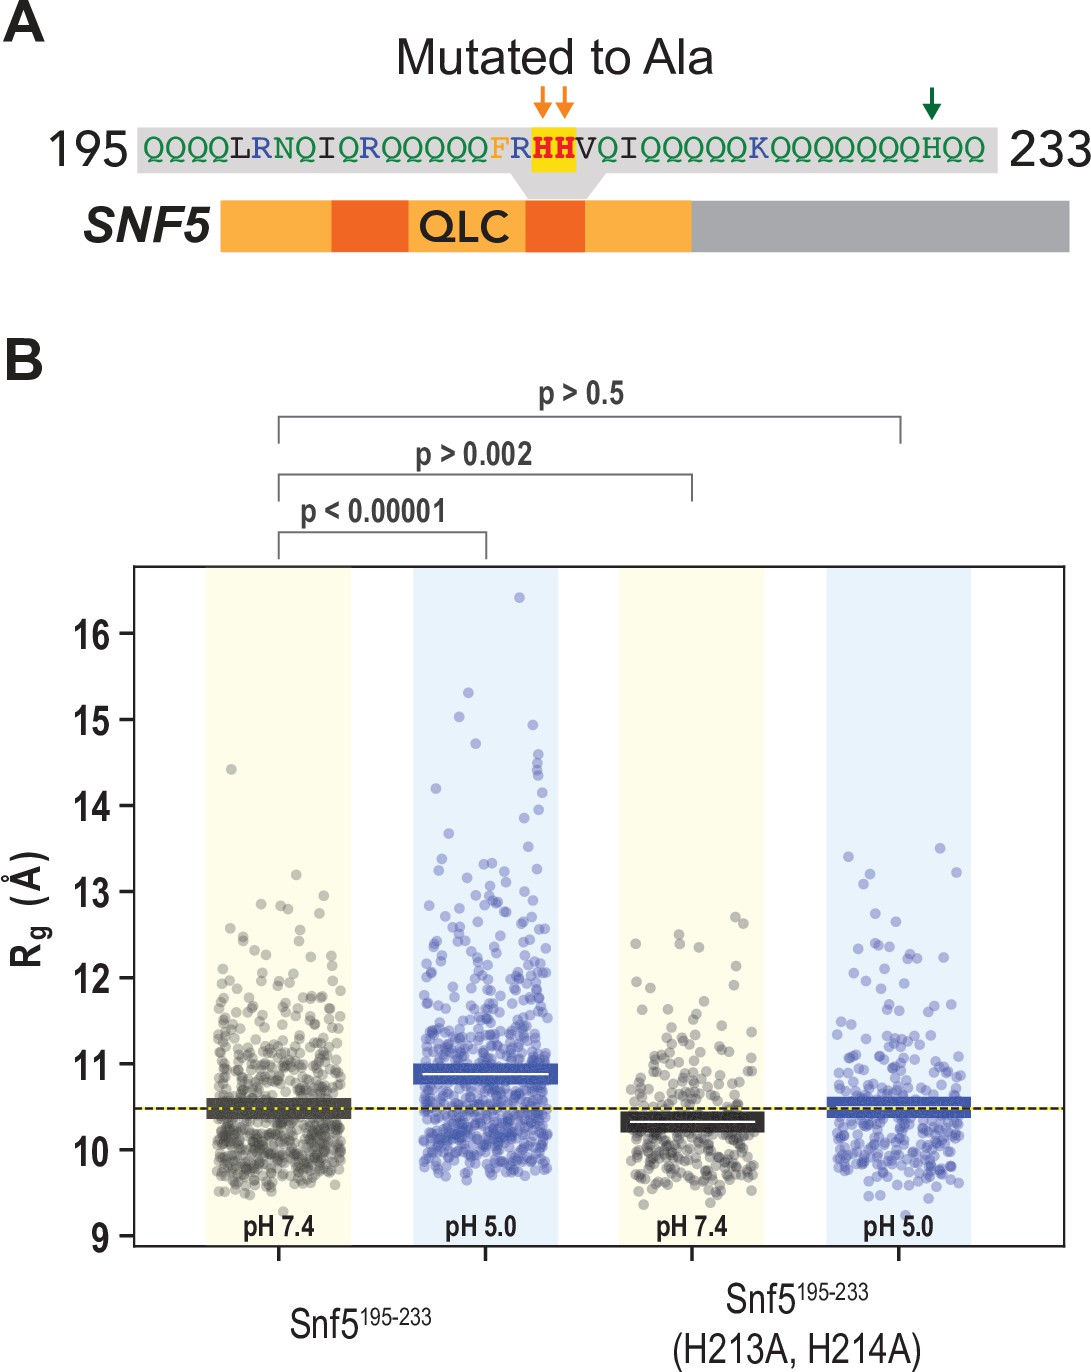
A second peptide within the N-terminal QLC of SNF5 undergoes conformational expansion upon protonation.
(A) Schematic of the SNF5 gene, with the sequence and location of the simulated peptide indicated. (B) Radius of gyration (Rg, y-axis) of all-atom Monte Carlo simulations of amino acids 195–233 of the SNF5 QLC with histidines either neutral (pH 7.4) or protonated (pH 5.0). Left two datasets are for the native peptide, right two datasets are with 2/3 histidines (H213 and H214) replaced with alanine, mimicking the HtoASNF5 allele. Points represent the mean Rg from all conformations sampled in each independent simulation (beginning from distinct random initial conformers). Bars represent the mean values of all simulations. p-Values are from two-sided independent t-tests.
Author response image 1
Tables
Key resources table
| Reagent type (species) or resource | Designation | Source or reference | Identifiers | Additional information |
|---|---|---|---|---|
| Gene (Saccharomyces cerevisiae) | SNF5 | https://www.yeastgenome.org/ | SGD:S000000493 | |
| Gene (S. cerevisiae) | SNF2 | https://www.yeastgenome.org/ | SGD:S000005816 | |
| Gene(pHluorin) | pHluorin | doi:10.1099/mic.0.022038-0 | ||
| Strain, strain background (S. cerevisiae S288c) | BY4741 | doi:https://doi.org/10.1002/(SICI)1097-0061(19980130)14:2<115::AID-YEA204>3.0.CO;2-2 | All strains used in this study are derived form BY4741 | |
| Other | LH3647 | ADH2::PADH2-mCherry-URA3 snf2::SNF2-TAP-His3MX6 | Yeast strain used to purify SWI/SNF complex | |
| Other | LH3649 | ΔQsnf5-HIS3 ADH2::PADH2-mCherry-URA3 snf2::SNF2-TAP-kanMX6 | Yeast strain used to purify SWI/SNF complex containing ∆Qsnf5 | |
| Other | LH3652 | HtoAsnf5-HIS3 ADH2::PADH2-mCherry-URA3 snf2::SNF2-TAP-kanMX6 | Yeast strain used to purify SWI/SNF complex containing HtoAsnf5 | |
| Recombinant DNA reagent | Plasmid (pRS316) | GenBank: U03442 | Used to complement SNF5 gene in snf5∆ strains prior to removal using 5FOA | |
| Recombinant DNA reagent | Plasmid(pRS306) | GenBank: U03438 | SNF5 and snf5 mutant alleles were all cloned into pRS306 and pRS303 | |
| Recombinant DNA reagent | Plasmid(pRS303) | GenBank: U03435 | SNF5 and snf5 mutant alleles were all cloned into pRS306 and pRS303 | |
| Antibody | Rabbit polyclonal IgG | Sigma | Cat# 12-370 | |
| Antibody | Fluorescently labeled goat anti-rabbit polyclonal | LI-COR Biosciences | Cat# 926-68071 | Western blot (1:15,000 dilution) |
| Antibody | Rabbit polyclonalanti-glucokinase | US Biological | Cat# H2035-01 | Western blot (1:3000 dilution) |
| Antibody | Fluorescently labeled goat anti-rabbit polyclonal | LI-COR Biosciences | Cat# 926-32211 | Western blot (1:15,000 dilution) |
Additional files
-
Supplementary file 1
Sequences of glutamine-rich low-complexity sequences (QLCs) in the Saccharomyces cerevisiae genome.
All S. cerevisiae QLCs identified using the parameters optimized in Figure 1—figure supplement 2 are included in this summary table.
- https://cdn.elifesciences.org/articles/70344/elife-70344-supp1-v2.xlsx
-
Supplementary file 2
Comparison of sequence properties of SNF5 N-terminal intrinsically disordered regions (IDRs).
Comparison of the IDRs of SNF5 orthologues from Ascomycete fungi, with the number of glutamines and histidines indicated.
- https://cdn.elifesciences.org/articles/70344/elife-70344-supp2-v2.xlsx
-
Supplementary file 3
Transcription factors enriched in each gene group from RNA-seq analysis.
The YEASTRACT server used to find transcription factors enriched within the promoters of each of four gene sets defined by hierarchical clustering of genes significantly regulated upon carbon starvation (see Figure 4E). YEASTRACT search settings were DNA binding plus expression evidence; TF acting as either activator or inhibitor.
- https://cdn.elifesciences.org/articles/70344/elife-70344-supp3-v2.xlsx
-
Supplementary file 4
SNF5 subregions examined by all-atom Monte Carlo simulations.
- https://cdn.elifesciences.org/articles/70344/elife-70344-supp4-v2.xlsx
-
Supplementary file 5
Parameters used for all-atom Monte Carlo simulations.
- https://cdn.elifesciences.org/articles/70344/elife-70344-supp5-v2.xlsx
-
Supplementary file 6
Yeast strains used in this study.
- https://cdn.elifesciences.org/articles/70344/elife-70344-supp6-v2.xlsx
-
Supplementary file 7
Plasmids used in this study.
- https://cdn.elifesciences.org/articles/70344/elife-70344-supp7-v2.xlsx
-
Transparent reporting form
- https://cdn.elifesciences.org/articles/70344/elife-70344-transrepform1-v2.pdf
Download links
A two-part list of links to download the article, or parts of the article, in various formats.
Downloads (link to download the article as PDF)
Open citations (links to open the citations from this article in various online reference manager services)
Cite this article (links to download the citations from this article in formats compatible with various reference manager tools)
SWI/SNF senses carbon starvation with a pH-sensitive low-complexity sequence
eLife 11:e70344.
https://doi.org/10.7554/eLife.70344


