ZHX2 promotes HIF1α oncogenic signaling in triple-negative breast cancer
- Department of Pharmacy, The First Affiliated Hospital of Nanjing Medical University, China
- Lineberger Comprehensive Cancer Center, University of North Carolina School of Medicine, United States
- Department of Pathology, University of Texas Southwestern Medical Center, United States
- Department of Genetics, Neuroscience Center; University of North Carolina School of Medicine, United States
- UNC Neuroscience Center, Carolina Institute for Developmental Disabilities, University of North Carolina, United States
- Shanghai Institute of Immunology, Faculty of Basic Medicine, Shanghai Jiao Tong University School of Medicine, China
- Department of Biochemistry and Molecular Biology, The University of Texas Health Science Center at Houston McGovern Medical School, United States
- Institute of Bioinformatics and Structural Biology, National Tsing Hua University, Taiwan
- Chemical Biology and Molecular Biophysics Program, Taiwan International Graduate Program, Institute of Chemistry, Taiwan
- Department of Chemistry, National Tsing-Hua University, Taiwan
- Harold C. Simmons Comprehensive Cancer Center, University of Texas Southwestern Medical Center, United States
- Physics Division, National Center for Theoretical Sciences, Taiwan
Figures
Figure 1 with 1 supplement
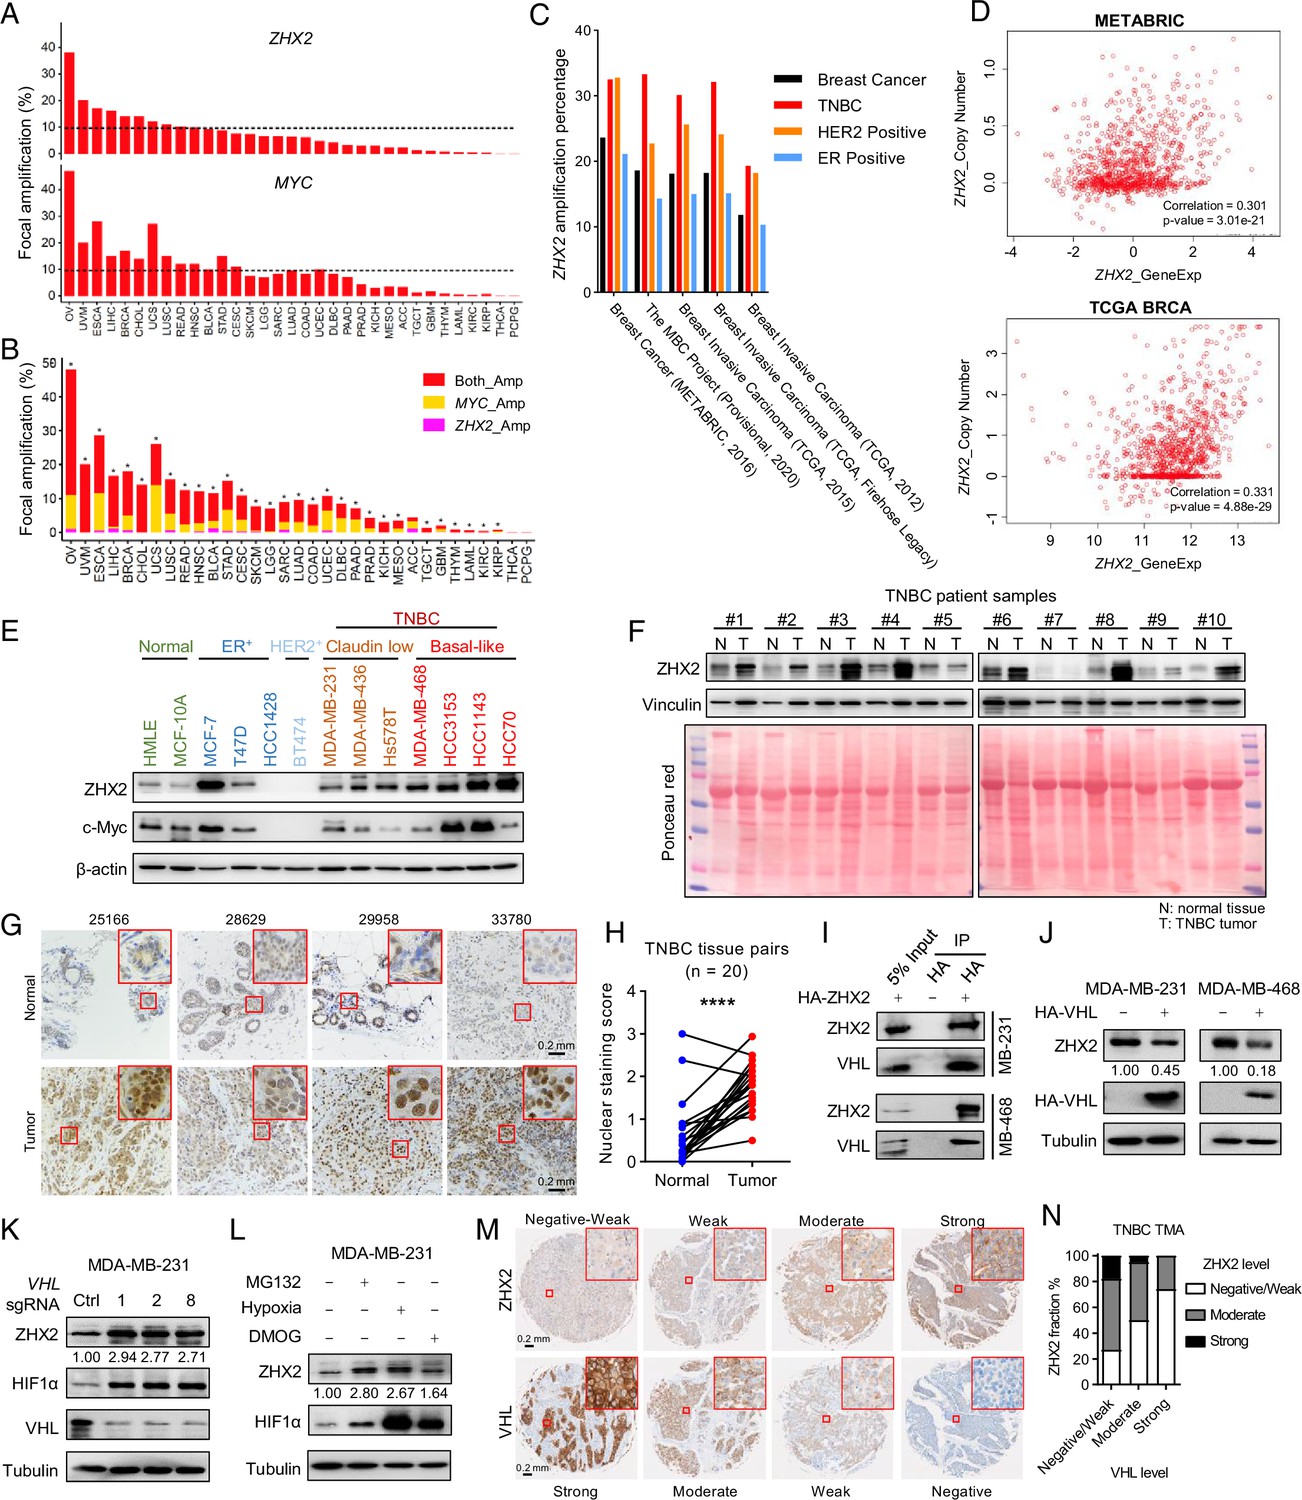
ZHX2 is amplified in triple-negative breast cancer (TNBC) and is potentially regulated by pVHL.
(A) The percentage of tumor samples with ZHX2 (top) or MYC (bottom) focal amplification across cancer types. (B) The percentage of samples with both ZHX2 and MYC (red), ZHX2 specific (magenta), and MYC specific (orange). Asterisk indicates statistical significance for overlap of ZHX2 and MYC focal amplification (Fisher’s exact test, p < 0.05). (C) The percentage of ZHX2 amplification of different breast cancer subtypes in several breast cancer datasets. (D) The relation of ZHX2 copy number gain and its expression in The Cancer Genome Atlas (TCGA) datasets and METABRIC datasets. (E) Immunoblots of lysates from different normal breast cell and breast cancer cell lines. (F) Immunoblots of lysates from paired TNBC patient-derived normal (N) and tumor (T) breast tissues. (G, H) Representative immunohistochemistry (IHC) staining images (G) and quantification (H) of ZHX2 protein level in paired TNBC patient-derived normal and tumor breast tissues. (I) Immunoprecipitations (IP) and immunoblot of MDA-MB-231 and 468 cell lysates with HA beads. (J) Immunoblot of cell lysates from MDA-MB-231 and 468 cells stably expressed control vector or HA-VHL. (K) Immunoblot of cell lysates from MDA-MB-231 infected with lentivirus encoding either VHL sgRNAs (1, 2, or 8) or control sgRNA (Ctrl). (L) Immunoblots of lysates from MDA-MB-231 cells treated with hypoxia or indicated inhibitors for 8 hr. (M, N) Representative IHC staining images (M) and quantification (N) of human TNBC specimens with four staining grades showing the expression correlation between ZHX2 and VHL protein. Error bars represent mean ± standard error of the mean (SEM), unpaired t-test. ****p < 0.0001.
-
Figure 1—source data 1
Uncropped western blot images for Figure 1.
- https://cdn.elifesciences.org/articles/70412/elife-70412-fig1-data1-v3.pdf
Figure 1—figure supplement 1

ZHX2 overexpression leads worse patient survival and is potentially regulated by pVHL in breast cancer.
(A, B) The overall survival of breast cancer patients with high or low ZHX2 expression in different breast cancer subtypes. The K–M plots were generated from https://kmplot.com using two Affymetrix probe, ZHX2: 236169_at (A) and 203556_at (B). (C) Immunoblots of lysates from normal breast epithelial cell and triple-negative breast cancer (TNBC) cell lines. (D) Immunoblot of cell lysates from MDA-MB-468 cells infected with lentivirus encoding either VHL sgRNAs (1, 2, or 8) or control sgRNA (Ctrl). (E) Immunoblots of lysates from MDA-MB-468 cells treated with hypoxia or indicated inhibitors for 8 hr. (F) Immunoblots of lysates from paired TNBC patient-derived normal (N) and tumor (T) breast tissues. (G) Images of immunohistochemistry (IHC) staining of ZHX2 and pVHL in TNBC tissue microarray (TMA).
-
Figure 1—figure supplement 1—source data 1
Uncropped western blot images for Figure 1—figure supplement 1.
- https://cdn.elifesciences.org/articles/70412/elife-70412-fig1-figsupp1-data1-v3.pdf
Figure 2 with 1 supplement
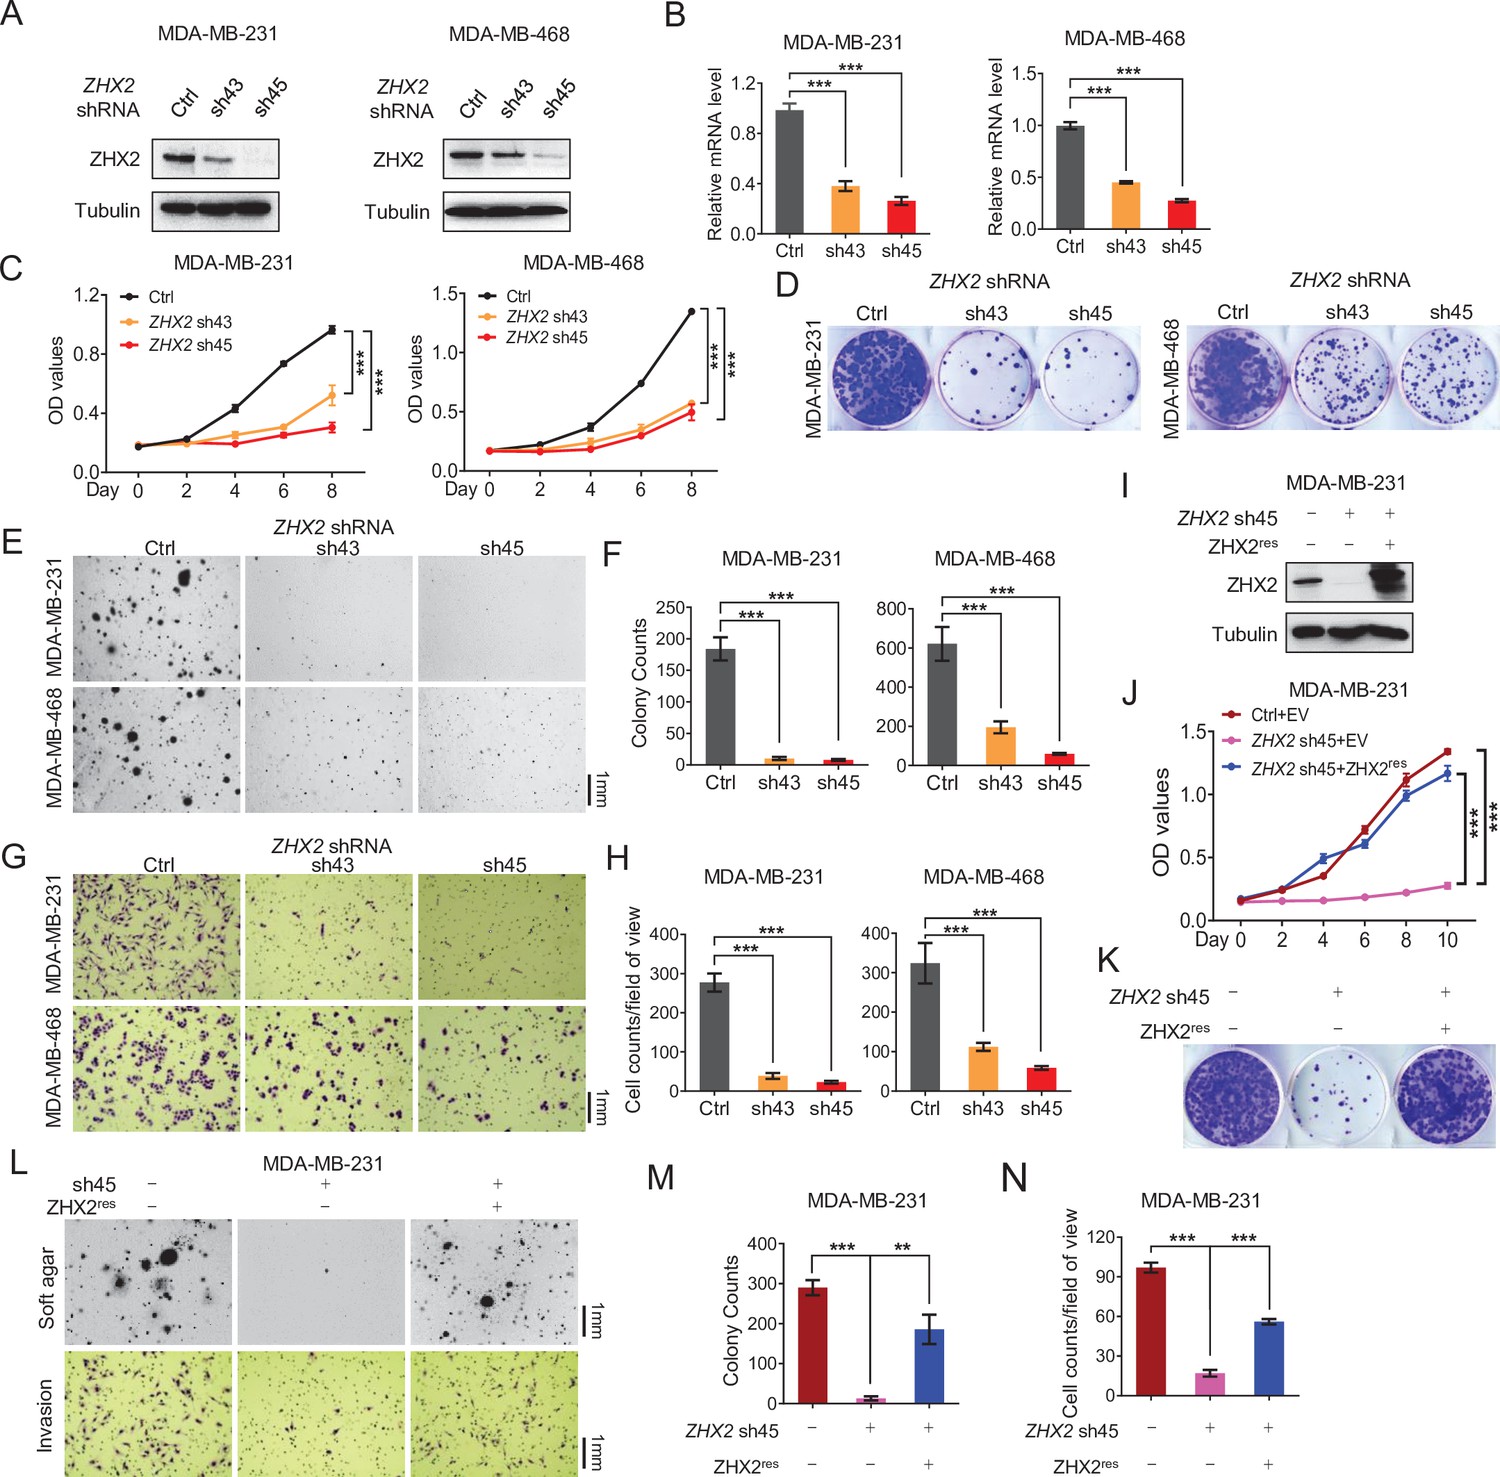
ZHX2 is essential for triple-negative breast cancer (TNBC) cell proliferation and invasion.
(A–H) Immunoblot of cell lysates (A), Real-time quantitative PCR (qRT-PCR) (B), cell proliferation assays (C), 2D colony formation assays (D), representative images of 3D soft agar growth (E) and quantification of oft agar colonies (F), invasion assay (G), and quantification of invasion assay (H) of MDA-MB-231/468 cells infected with lentivirus encoding two individual ZHX2 shRNAs (43 and 45) or control shRNA (Ctrl). (I–N) Immunoblot of cell lysates (I), cell proliferation (J), 2D colony formation assay (K), representative images of 3D soft agar growth (upper), and invasion assays (down) (L) as well as their quantifications (M, N) of MDA-MB-231 cells infected with lentivirus encoding sh45-resistant ZHX2 (ZHX2res) or control vector (EV), then followed by ZHX2 sh45 or Ctrl lentivirus infection. Error bars represent mean ± standard error of the mean (SEM), unpaired t-test. **p < 0.01; ***p < 0.001.
-
Figure 2—source data 1
Uncropped western blot images for Figure 2.
- https://cdn.elifesciences.org/articles/70412/elife-70412-fig2-data1-v3.pdf
Figure 2—figure supplement 1
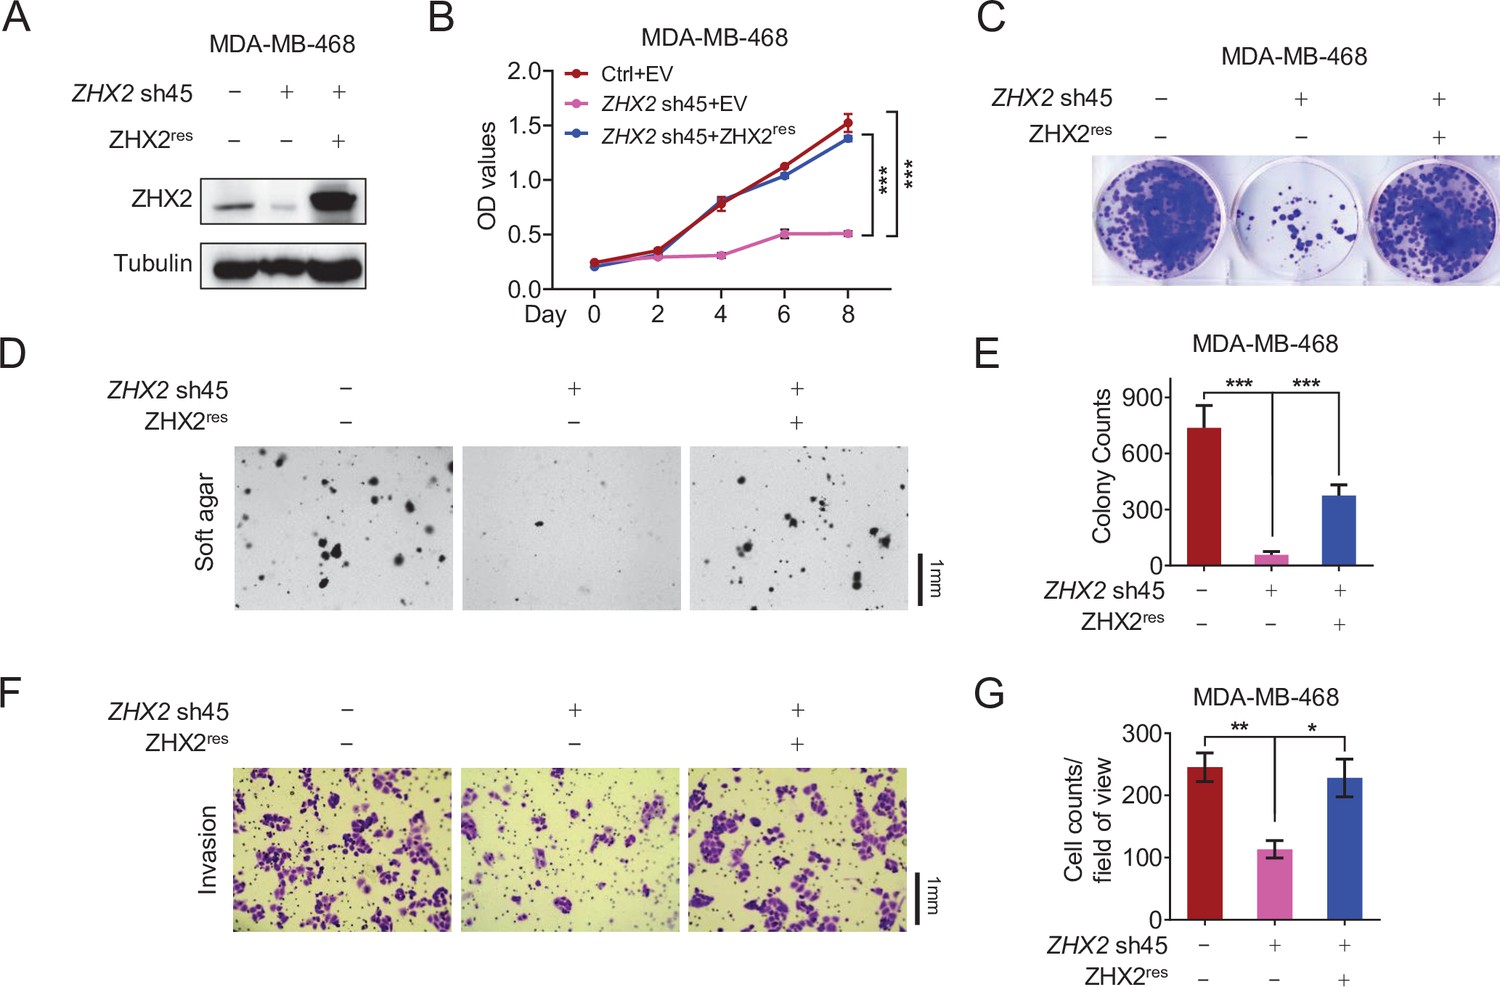
The phenotype of ZHX2 shRNA on cell proliferation and invasion is due to its on-target effect.
(A–E) Immunoblot of cell lysates (A), cell proliferation assays (B), representative 2D colony formation (C), representative soft agar colony (D), quantification of soft agar colony (E), invasion assays (F), and quantification of invasion assays (G) of MDA-MB-468 cells transfected with ZHX2 sh45-resistant (ZHX2res) or empty vector (EV), followed by ZHX2 sh45 or control (Ctrl) shRNA infection. Error bars represent mean ± standard error of the mean (SEM), unpaired t-test. *p < 0.05; **p < 0.01; ***p < 0.001.
-
Figure 2—figure supplement 1—source data 1
Uncropped western blot images for Figure 2—figure supplement 1.
- https://cdn.elifesciences.org/articles/70412/elife-70412-fig2-figsupp1-data1-v3.pdf
Figure 3 with 1 supplement

ZHX2 is important for triple-negative breast cancer (TNBC) cell proliferation and tumorigenesis in vivo.
(A, B) Immunoblot of cell lysates (A) and tumor growth (B) of MDA-MB-231-luc cells expressing doxycycline (Dox)-inducible control or ZHX2 shRNAs (Teton Ctrl, sh43, 45). Cells were orthotopically injected at the mammary fat pad of NoD SCID Gamma (NSG) mice. Treatment of Dox food started as indicated. (C, D) Tumor weight (C) and image (D) from MDA-MB-231 xenografts mice after dissection. (E) Immunoblot of lysates from the MDA-MB-231 xenograft tumors. (F, G) Lung ex vivo bioluminescence imaging (F) and quantification of lung ex vivo imaging (G) of the MDA-MB-231-luc xenograft mice. (H, I) Immunoblot of cell lysates (H) and tumor growth (I) of HCC70-luc cells expressing Dox-inducible control or ZHX2 shRNAs (Teton Ctrl, sh43, 45). Cells were orthotopically injected at the mammary fat pad of NSG mice. Treatment of Dox food started as indicated. (J, K) Representative bioluminescence images at the indicated weeks (J) and quantification of the bioluminescence imaging (K) of the HCC70-luc xenograft tumors. (L, M) Representative immunohistochemistry (IHC) staining images (L) and quantification (M) of hematoxylin–eosin (H&E), ZHX2, Ki-67, cleaved caspase 3, and Endomucin in tumors (n = 4) from the MDA-MB-231 xenograft tumors. Error bars represent mean ± standard error of the mean (SEM), unpaired t-test. *p < 0.05; **p < 0.01; ***p < 0.001; ****p < 0.0001.
-
Figure 3—source data 1
Uncropped western blot images for Figure 3.
- https://cdn.elifesciences.org/articles/70412/elife-70412-fig3-data1-v3.pdf
Figure 3—figure supplement 1
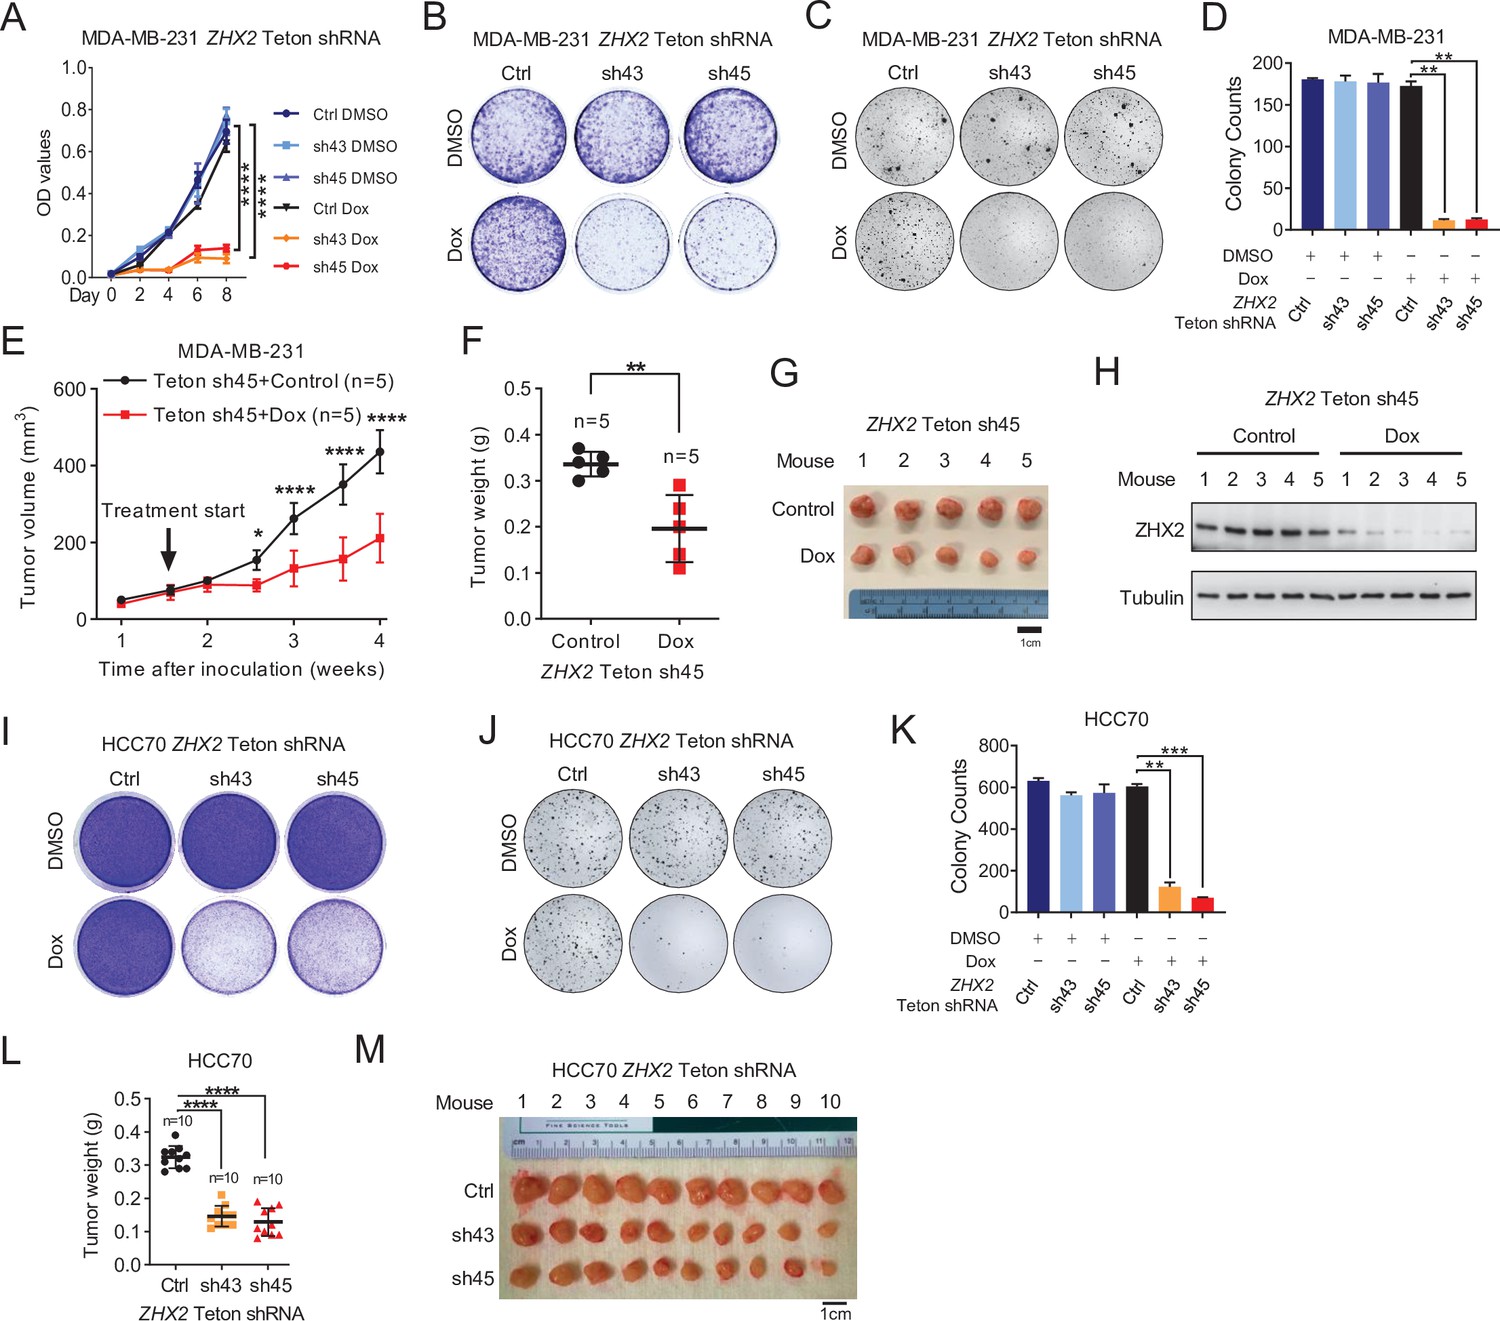
ZHX2 is important for maintaining triple-negative breast cancer (TNBC) tumorigenesis in vivo.
(A–D) Cell proliferation (A), 2D colony formation assay (B), representative images of 3D soft agar growth (C), and quantification of soft agar growth (D) of MDA-MB-231-luc cells infected with lentivirus encoding either ZHX2 Teton shRNAs (43 and 45) or Teton Ctrl, and treated with Dimethylsulfoxide (DMSO) or doxycycline (Dox; 2 μg/ml) for 72 hr. (E–H) Tumor growth (E), tumor weight (F), image (G), and immunoblot of lysates from tumors (H) of ZHX2-inducible sh45 expressing MDA-MB-231 cells orthotopically injected in NoD SCID Gamma (NSG) mice. Treatment of control or Dox food started as indicated. (I–K) Representative 2D colony (I), soft agar colony (J), and quantification of soft agar colony (K) of HCC70-luc cell lines infected with lentivirus encoding either Teton-ZHX2 shRNA (43 and 45) or Teton-Ctrl. (L, M) Tumor weight (L) and image (M) from HCC70 xenografts mice after dissection. Error bars represent mean ± standard error of the mean (SEM), unpaired t-test. *p < 0.05; **p < 0.01; ***p < 0.001; ****p < 0.0001.
-
Figure 3—figure supplement 1—source data 1
Uncropped western blot images for Figure 3—figure supplement 1.
- https://cdn.elifesciences.org/articles/70412/elife-70412-fig3-figsupp1-data1-v3.pdf
Figure 4 with 2 supplements

ZHX2 regulates hypoxia-inducible factor (HIF) signaling in triple-negative breast cancer (TNBC).
(A, B) Venn diagrams showing the overlap in downregulated (A) or upregulated (B) differentially expressed genes (DEGs) between ZHX2 shRNA 43 and 45. (C) Pathway analysis of the significantly decreased pathways in ZHX2 depleted MDA-MB-231 cells. (D, E) Venn diagrams showing overlap in DEGs (D) and downregulated DEGs (E) between ZHX2 depletion and HIF double knockout (DKO) (GSE108833). (F, G) Immunoprecipitations (IP) and immunoblots with indicated antibodies of MDA-MB-231 cells overexpress either HA-ZHX2 (F) or HA-HIF1α (G). IP was performed with HA beads. (H) IPs of MDA-MB-231 cells treated with DMOG for 8 hr. (I, J) Immunoblots of cell lysates from MDA-MB-231 cells (I) and MDA-MB-468 cells (J) infected with lentivirus encoding ZHX2 shRNAs or Ctrl, followed by treating with normoxia or hypoxia (1% O2). (K–M) Immunoblots (K) and IPs (L) of cell lysates, qRT-PCR of mRNA (M) from MDA-MB-231 cells infected with lentivirus encoding control vector (EV) or ZHX2. (N) Immunoblots of cell lysates from MDA-MB-231 cells infected with lentivirus encoding ZHX2 shRNAs or Ctrl treated with MG132 overnight under hypoxia (1% O2). (O) IPs of cell lysates from MDA-MB-231 cells infected with lentivirus encoding control vector (EV) or HA-ZHX2. Error bars represent mean ± standard error of the mean (SEM), unpaired t-test. n.s., not significant.
-
Figure 4—source data 1
Uncropped western blot images for Figure 4.
- https://cdn.elifesciences.org/articles/70412/elife-70412-fig4-data1-v3.pdf
Figure 4—figure supplement 1
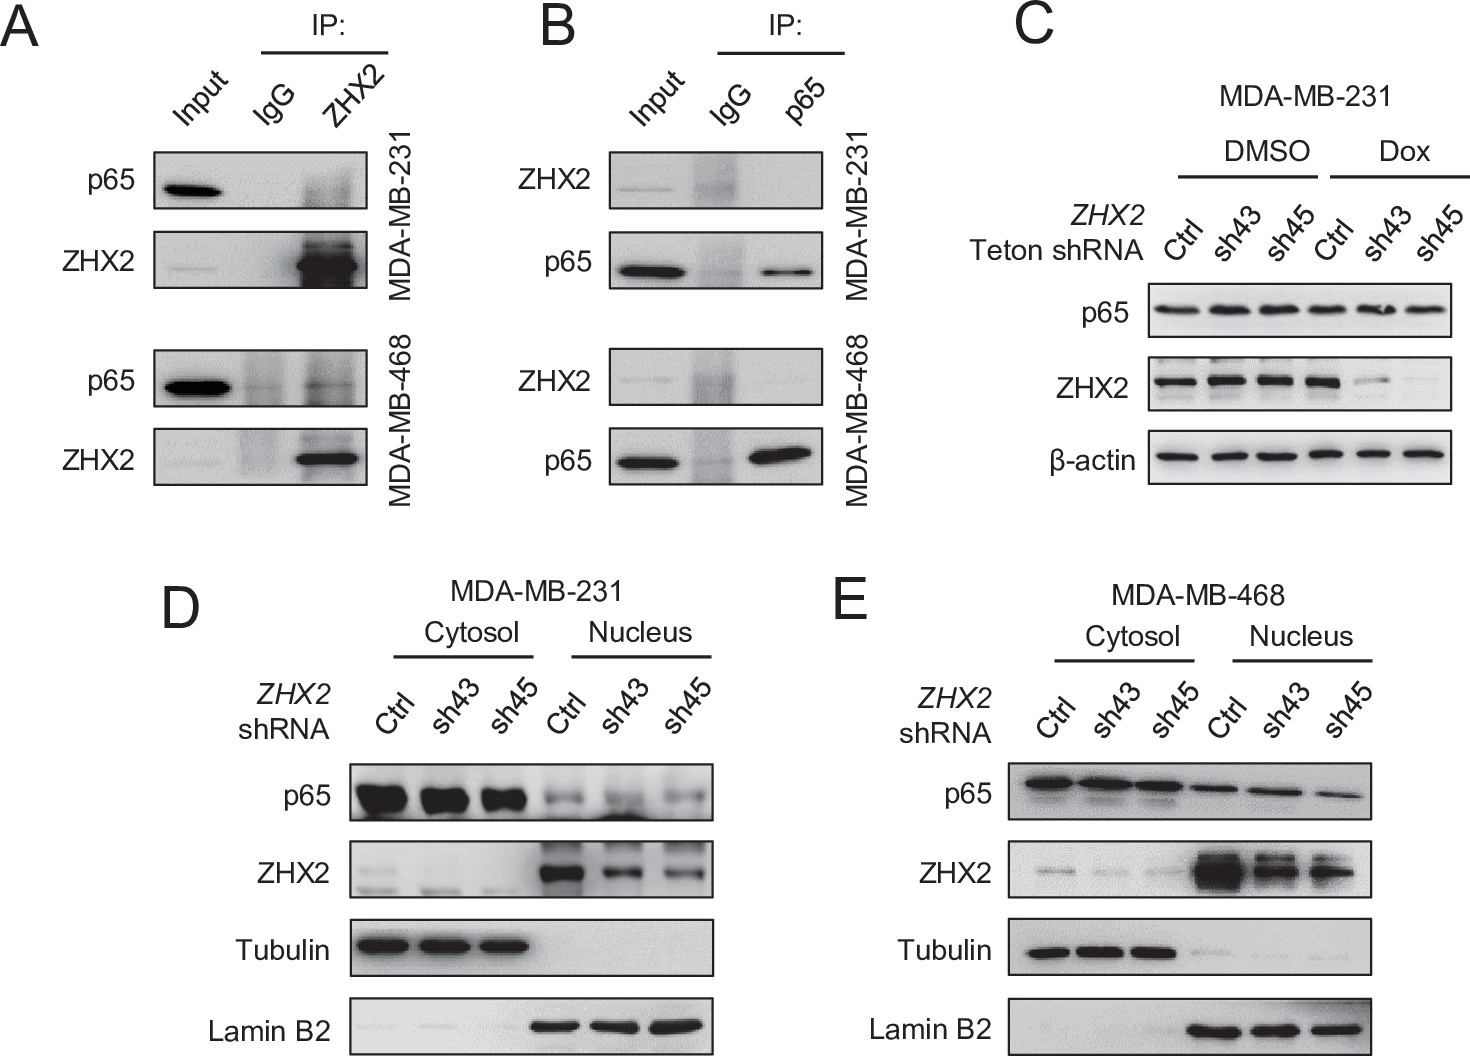
ZHX2 does not affect p65 translocation in triple-negative breast cancer (TNBC).
(A, B) Immunoprecipitations and immunoblots of MDA-MB-231 and 468 cell lysates by ZHX2 antibody (A) or p65 antibody (B). (C) Immunoblot of cell lysates from inducible ZHX2 knockdown MDA-MB-231 cells treated with or without doxycycline (Dox). (D–E) Immunoblot of cell fractions from MDA-MB-231 (D) or MDA-MB-468 (E) infected with ZHX2 shRNA (Ctrl, sh43, or sh45).
-
Figure 4—figure supplement 1—source data 1
Uncropped western blot images for Figure 4—figure supplement 1.
- https://cdn.elifesciences.org/articles/70412/elife-70412-fig4-figsupp1-data1-v3.pdf
Figure 4—figure supplement 2

ZHX2 regulates hypoxia-inducible factor (HIF)1 signaling in triple-negative breast cancer (TNBC).
(A) Gene set enrichment analysis (GSEA) of the significantly decreased pathways in ZHX2 depleted MDA-MB-231 cells. (B, C) Plot (B) and related heatmap (C) from GSEA analysis suggest hypoxia pathway is significantly downregulated in ZHX2 depleted MDA-MB-231 cells. (D) qRT-PCR quantification of relative mRNA expression of hypoxia target genes from MDA-MB-231 cells infected with ZHX2 shRNA 43, 45, or Ctrl under normoxia or hypoxia conditions. (E) Hypoxia response element (HRE) double luciferase gene assay of MDA-MB-231 cells infected with ZHX2 sh45, sh45-resistant (ZHX2res), or Ctrl under normoxia or hypoxia condition. (F) HRE double luciferase gene assay of HEK293T cells infected with different amount of HA-ZHX2 (100, 200, and 400 ng), HRE-Luci, and pCMV-Renilla. (G) Immunoprecipitations and immunoblots with indicated antibodies of MDA-MB-231 cells overexpressing HA-ZHX2 and HA-HIF1α. (H) Immunoblot of MDA-MB-231 cells infected with lentivirus encoding either HIF1A shRNA 3809, 3810, or Ctrl. Error bars represent mean ± standard error of the mean (SEM), unpaired t-test. *p < 0.05; **p < 0.01; ***p < 0.001.
-
Figure 4—figure supplement 2—source data 1
Uncropped western blot images for Figure 4—figure supplement 2.
- https://cdn.elifesciences.org/articles/70412/elife-70412-fig4-figsupp2-data1-v3.pdf
Figure 5
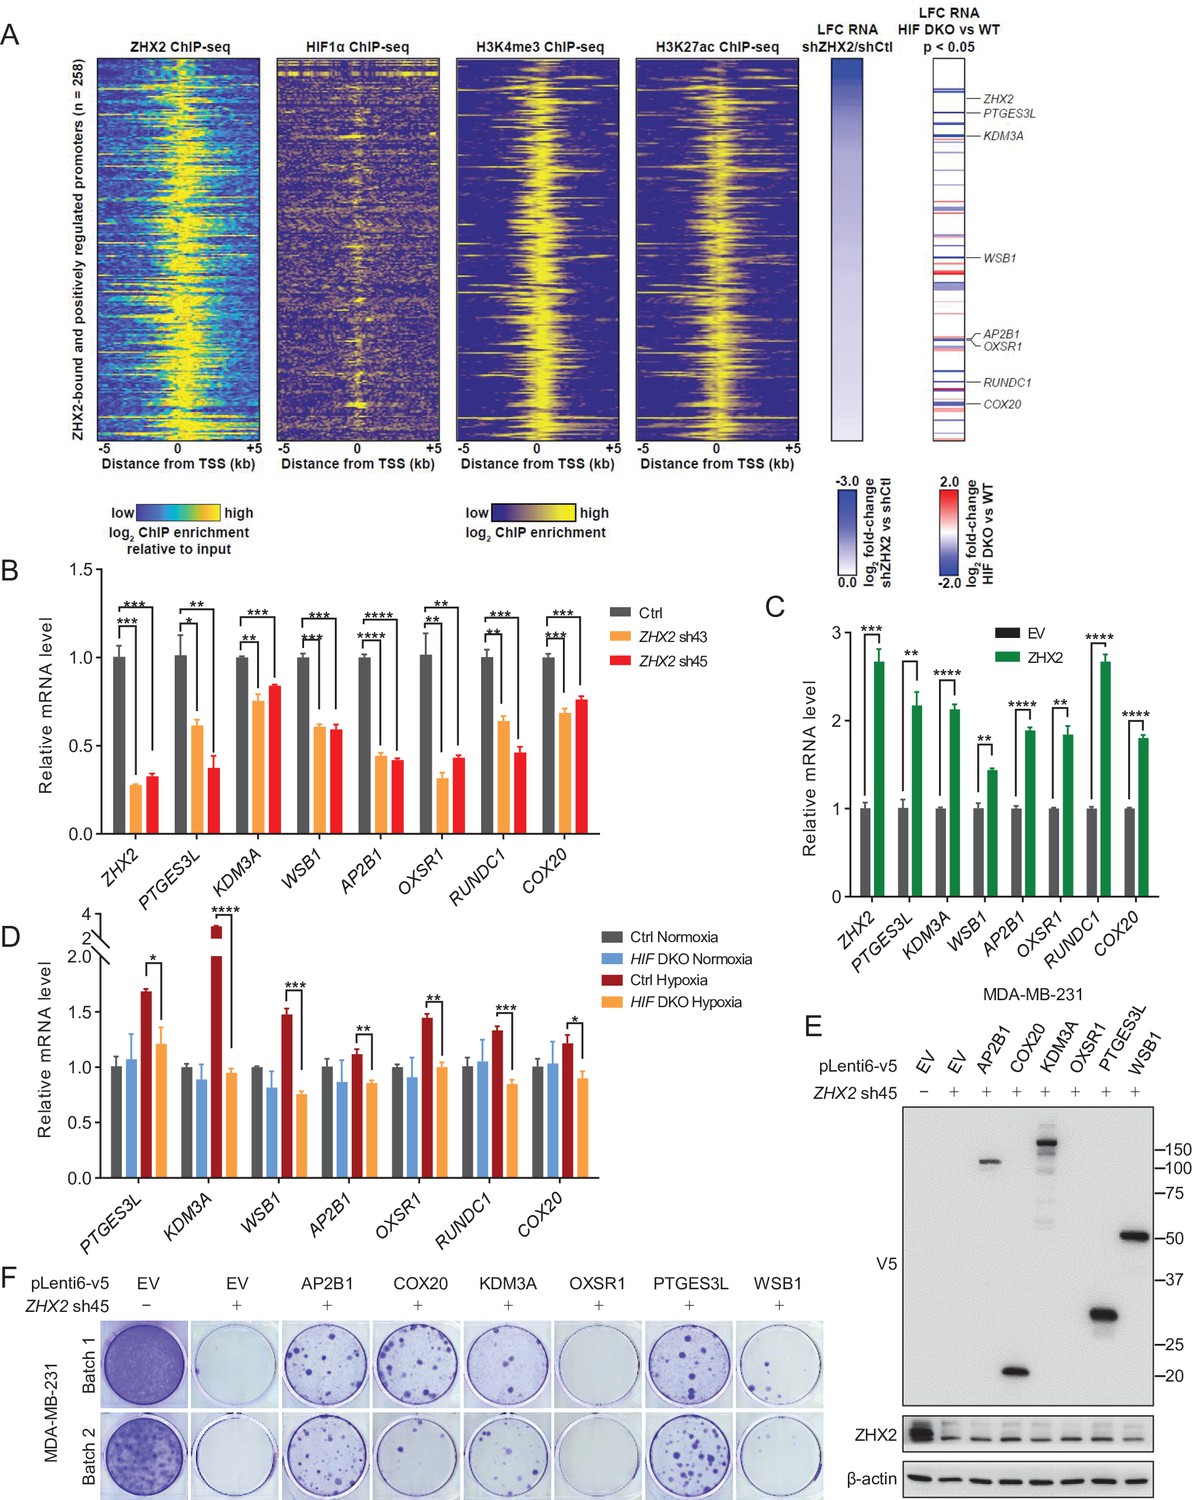
Representative ZHX2 and HIF downstream targets and analysis of their chromatin-binding motifs.
(A) Integrated analyses of ChIP-seqs (including ZHX2, HIF1α, H3K4me3, and H3K27ac), signals expressed as relative to input control when available. Log2 fold change (LFC) for ZHX2 knockdown RNA-seq and HIF double knockout (HIF DKO) RNA-seq; critical target genes were marked on the right. (B–D) qRT-PCR quantification of ZHX2 target genes from MDA-MB-231 cells infected with indicated lentivirus encoding ZHX2 shRNAs (43 and 45) (B), control vector (EV) or ZHX2 (C), or HIF DKO under normoxia (21% O2) or hypoxia (1% O2) (D). (E) Representative immunoblots of cell lysates from MDA-MB-231 cells infected with lentivirus encoding EV or AP2B1, COX20, KDM3A, OXSR1, PTGES3L, and WSB1, and followed by depletion of ZHX2 by sh45. (F) 2D colony formation growth of stable selected cells from (E). Batach1 and 2 indicate two biological experiments. Error bars represent mean ± standard error of the mean (SEM), unpaired t-test. *p < 0.05; **p < 0.01; ***p < 0.001; ****p < 0.0001.
-
Figure 5—source data 1
Uncropped western blot images for Figure 5.
- https://cdn.elifesciences.org/articles/70412/elife-70412-fig5-data1-v3.pdf
Figure 6 with 1 supplement
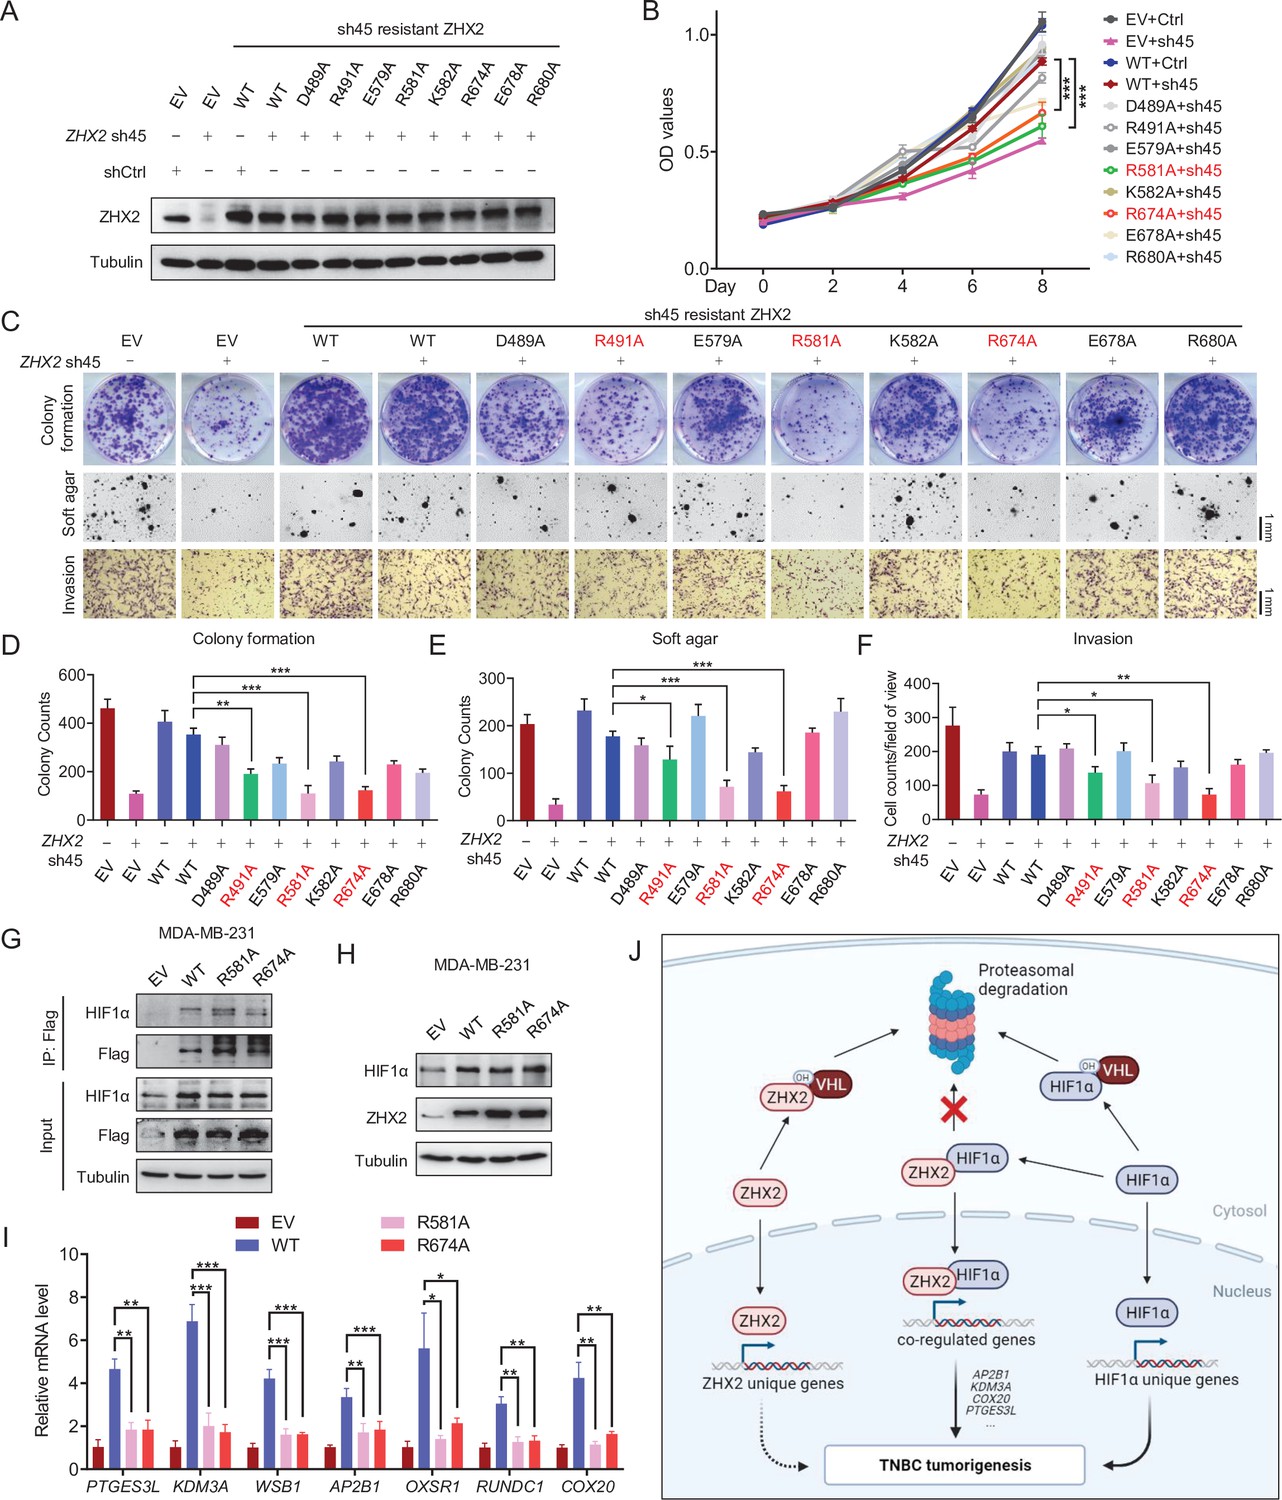
Identification of important sites on ZHX2 that may affect its function in triple-negative breast cancer (TNBC).
(A–F) Immunoblot of cell lysates (A), cell proliferation (B), representative images of 2D colony formation (top), 3D soft agar (middle), and invasion assay (bottom) (C) as well as the corresponding quantifications (D–F) of MDA-MB-231 cell lines infected with lentivirus encoding either sh45-resistant ZHX2 wild type (WT) or mutations, followed by sh45 ZHX2 depletion. (G–I) Immunoprecipitations (G), immunoblot (H), and qRT-PCR (I) of MDA-MB-231 cells infected with lentivirus encoding either ZHX2 WT or mutation. (J) Schematic model of the major findings from the current study. Error bars represent mean ± standard error of the mean (SEM), unpaired t-test. *p < 0.05; **p < 0.01; ***p < 0.001.
-
Figure 6—source data 1
Uncropped western blot images for Figure 6.
- https://cdn.elifesciences.org/articles/70412/elife-70412-fig6-data1-v3.pdf
Figure 6—figure supplement 1
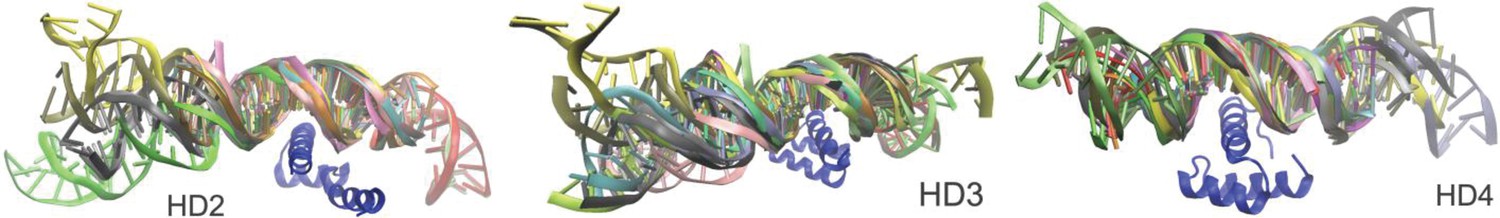
Residue-based DNA contact analysis derived from ensembles of DNA-bound HD proteins.
Videos
Video 1
The 350-ns molecular dynamics (MD) simulation trajectory of 1NK2-based HB2–dsDNA complex.
The HB2–dsDNA complex is in secondary structure cartoon representation. The top C-terminal helix residue that most contacts the DNA, which is ARG491, and the DNA atoms within 4 Å distance from it are in licorice representation.
Video 2
The 350-ns molecular dynamics (MD) simulation trajectory of 1MNM-based HB3–dsDNA complex.
The HB3–dsDNA complex is in secondary structure cartoon representation (violet color: HB3’s helix; gray color: dsDNA). The top C-terminal helix residue that most contacts the DNA, which is ARG581, and the DNA atoms within 4 Å distance from it are in licorice representation.
Video 3
The 350-ns molecular dynamics (MD) simulation trajectory of 1HF0-based HB4–dsDNA complex.
The HB4–dsDNA complex is in secondary structure cartoon representation (violet color: HB4’s helix; gray color: dsDNA). The top C-terminal helix residue that most contacts the DNA, which is ARG674, and the DNA atoms within 4 Å distance from it are in licorice representation.
Tables
Key resources table
| Reagent type (species) or resource | Designation | Source or reference | Identifiers | Additional information |
|---|---|---|---|---|
| Gene (Homo sapiens) | ZHX2 | GenBank | Gene ID: 22,882 | |
| Cell line (Homo sapiens) | MDA-MB-231 | ATCC | Catalog # ATCC HTB-26RRID:CVCL_0062 | |
| Cell line (Homo sapiens) | MDA-MB-468 | ATCC | Catalog # ATCC HTB-132RRID:CVCL_0419 | |
| Antibody | Rabbit anti ZHX2 antibody(Rabbit Polyclonal) | Genetex | Catalog # 112,232RRID:AB_10727176 | WB (1:1000)Co-IP (1:100)IHC (1:500) |
| Antibody | Rabbit anti HIF1α(Rabbit Monoclonal) | Cell Signaling | Catalog # 36,169RRID:AB_2861751 | WB (1:1000) |
| Antibody | Rabbit anti VHL(Rabbit Polyclonal) | Cell Signaling | Catalog # 68,547 | WB (1:1000)IHC (1:200) |
| Recombinant DNA reagent | pLKO.1 | Addgene | Catalog # 10,878RRID:Addgene_10878 | TRC cloning vector |
| Recombinant DNA reagent | lentiCRISPR v2 | Addgene | Catalog # 52,961RRID:Addgene_52961 | |
| Recombinant DNA reagent | pcDNA3.1 | Addgene | Catalog # 52,535RRID:Addgene_52535 | |
| Chemical compound, drug | MG132 | Peptide International | Catalog # IZL-3175-v | |
| Chemical compound, drug | Doxycycline hydrochloride | Sigma-Aldrich | Catalog # D3447 | |
| Chemical compound, drug | Agarose | Life Technologies | Catalog # BP165-25 | Soft agar assay |
| Commercial assay or kit | MTS Assay Kit (Colorimetric) | Abcam | Catalog # ab197010 | Cell proliferation assay |
| Commercial assay or kit | BD BioCoat Matrigel Invasion Chamber | Corning | Catalog # ab354480 | Invasion assay |
Additional files
-
Transparent reporting form
- https://cdn.elifesciences.org/articles/70412/elife-70412-transrepform1-v3.docx
-
Supplementary file 1
Supplementary files.
(a) Amplification status of ZHX2 in different breast cancer subtype. (b) The clinical information of the TNBC patient samples. (c) Top DNA-contacting residues in HD2/3/4 along with their evolutionary conservation. (d) MM/PBSA Calculations of the Free Energy (ΔH-TΔS) for Homeobox 2-4 dsDNA complexes. (e) Top C-terminal helix residues in the Homeobox 2-4 contributing the most DNA binding enthalpy. (f) Real-time PCR primers used in this study.
- https://cdn.elifesciences.org/articles/70412/elife-70412-supp1-v3.docx
Download links
A two-part list of links to download the article, or parts of the article, in various formats.
Downloads (link to download the article as PDF)
Open citations (links to open the citations from this article in various online reference manager services)
Cite this article (links to download the citations from this article in formats compatible with various reference manager tools)
ZHX2 promotes HIF1α oncogenic signaling in triple-negative breast cancer
eLife 10:e70412.
https://doi.org/10.7554/eLife.70412


