Hepatic MIR20B promotes nonalcoholic fatty liver disease by suppressing PPARA
- Department of Biological Sciences, Ulsan National Institute of Science and Technology, Republic of Korea
- Department of Internal Medicine, Ulsan University Hospital, Republic of Korea
- Department of Internal Medicine, Asan Medical Center, Republic of Korea
- Department of Medical Science, Asan Medical Center, Republic of Korea
Figures
Figure 1 with 4 supplements

MIR20B expression is significantly increased in the livers of dietary obese mice and humans.
The miRNA regulatory networks for NR genes downregulated in the transcriptome of NAFLD patients. The adjusted p-values in the table represent the enrichment of miRNA targets in the downregulated NR genes (hypergeometric distribution) (A). The expression of miRNAs was measured in indicated condition by quantitative RT-PCR (B–G). Hepatic miRNA levels of patients with steatosis (n = 4) or NASH (n = 6) were normalized to those of normal individuals (n = 11). *p < 0.05, **p < 0.01 and ***p < 0.001 vs normal individuals. #p < 0.05 and ##p < 0.01 vs patients with steatosis (B). MIR20B levels from HepG2 cells (C) and Huh-7 cells (D) treated with OA for 24 hr were normalized to no treatment (NT). Hepatic Mir20b levels from C57BL/6 J mice fed high-fat diet (HFD) (E), or methionine-deficient diet (MCD) (F) were normalized to normal chow diet (NCD). Hepatic Mir20b levels from leptin-deficient Lepob/ob mice were normalized to lean wild mice (G). Values represent means ± SEM (n = 3–5). *p < 0.05, **p < 0.01 vs NT in cells or NCD-fed mice. Raw data can be found in a Source Data file named ‘Figure 1—source data 1’.
-
Figure 1—source data 1
MIR20B expression is significantly increased in the livers of dietary obese mice and humans.
- https://cdn.elifesciences.org/articles/70472/elife-70472-fig1-data1-v2.xlsx
Figure 1—figure supplement 1
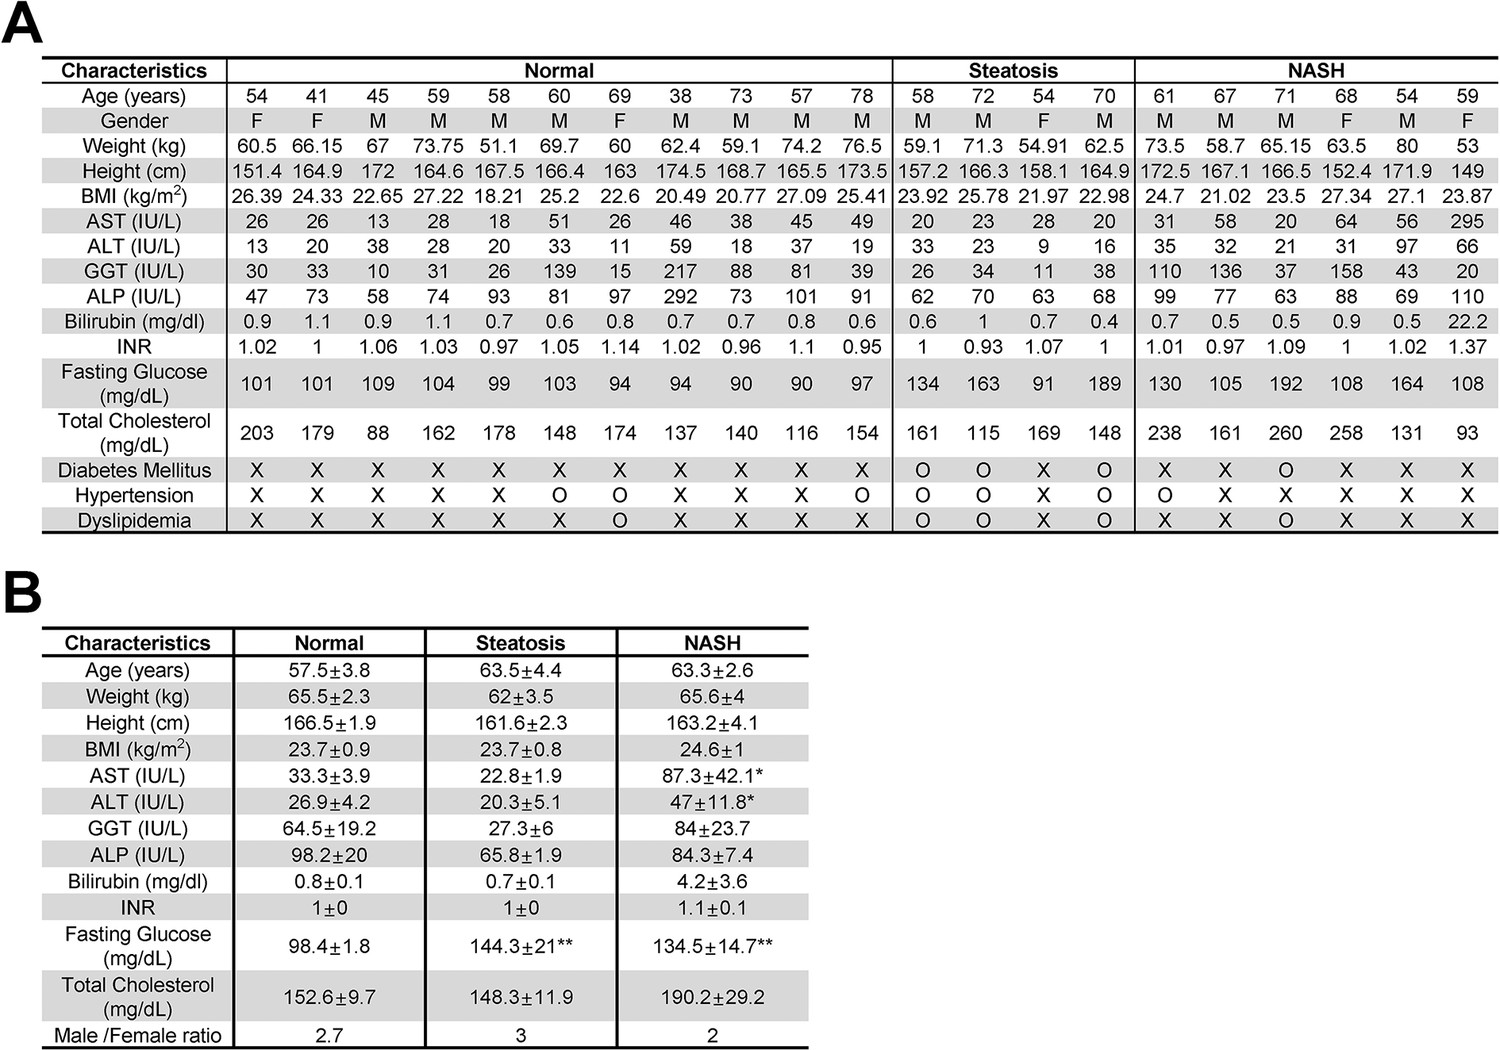
Clinical characteristics of control individuals (N = 11), steatosis (steatosis >50%, N = 4) and NASH patients (N = 6).
Individual clinical characteristics (A) and summary statistics (B) of patients. Data were presented as mean ± SEM. *p < 0.05, **p < 0.01 vs Normal. BMI, Body Mass Index; AST, aspartate aminotransferase; ALT, alanine aminotransferase; GGT, γ-glutamyl transpeptidase; ALP, alkaline phosphatase; INR, international normalized ratio.
Figure 1—figure supplement 2
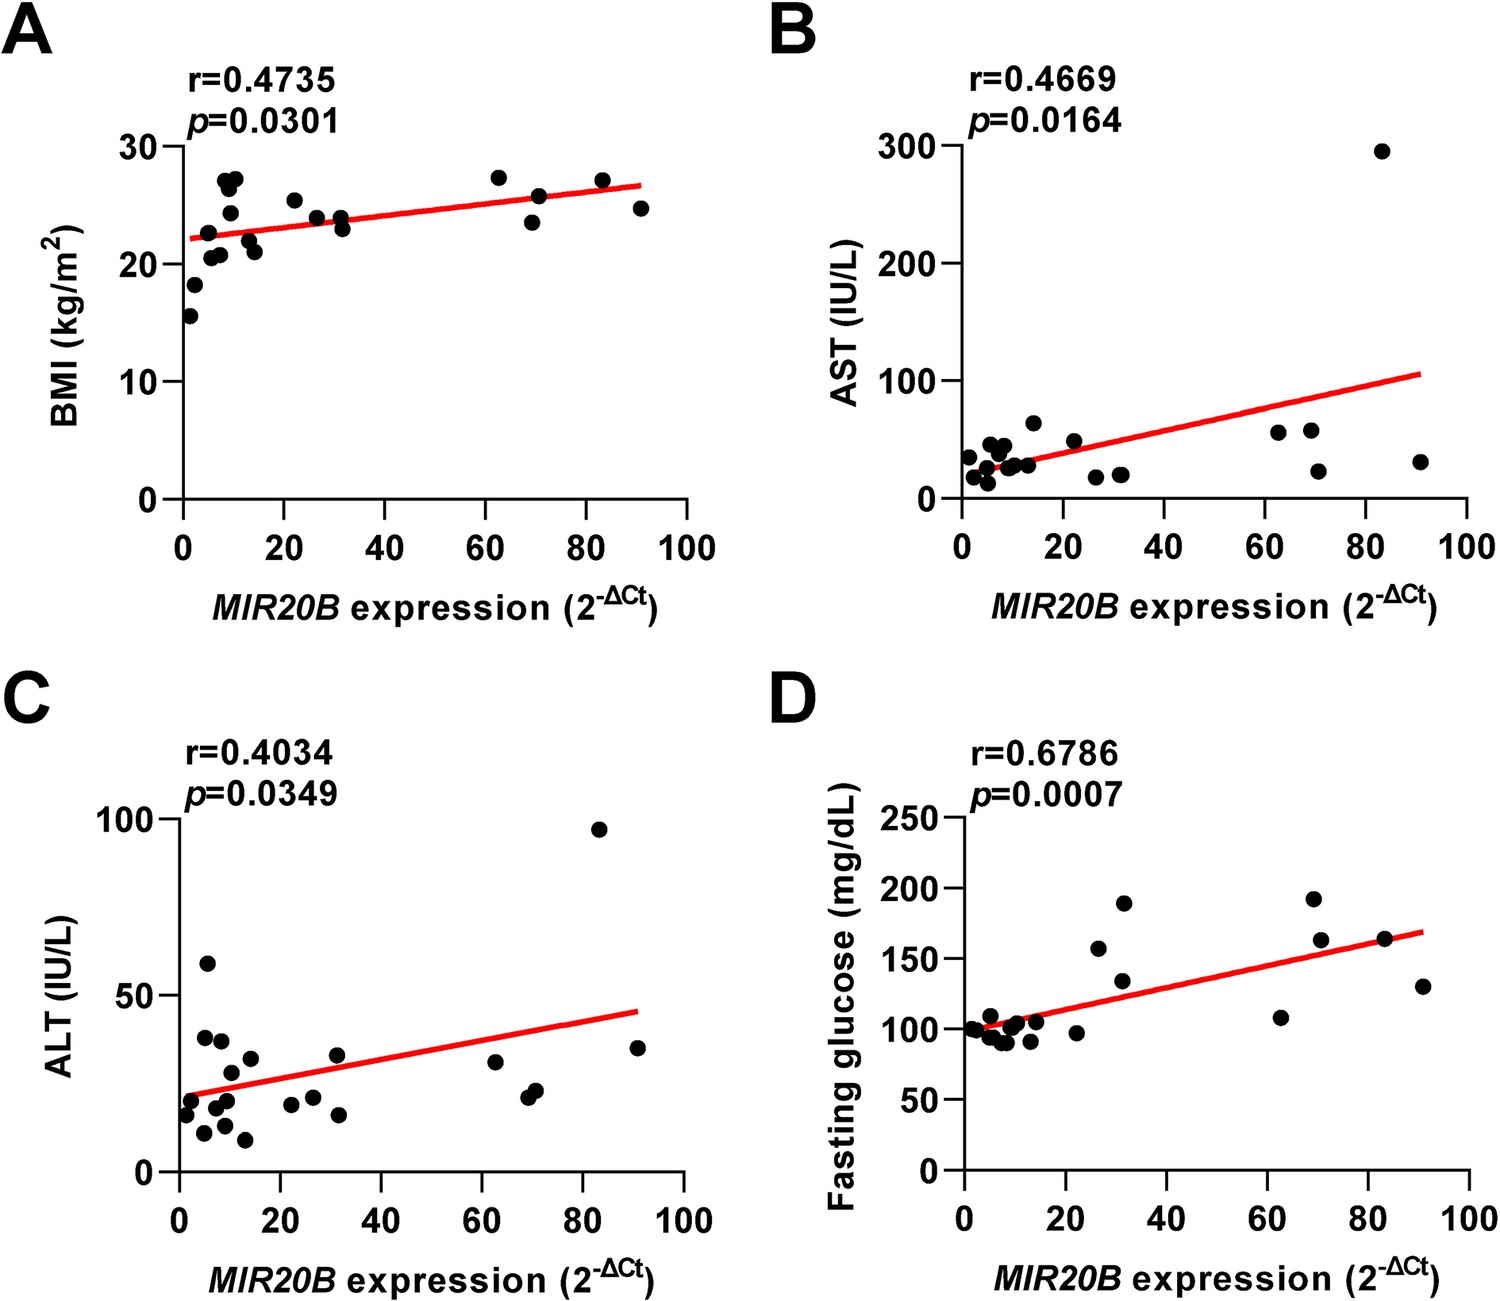
Pearson correlation between clinical characteristics of patients and MIR20B expression.
Pearson correlation between metabolic parameters and MIR20B mRNA levels in individual clinical patients. Correlation analysis of BMI (kg/m2) (A), AST (IU/L) (B), ALT (IU/L) (C), and fasting glucose (mg/dL) (D) with MIR20B expression (2-ΔCt) in all population. BMI, Body Mass Index; AST, aspartate aminotransferase; ALT, alanine aminotransferase.
Figure 1—figure supplement 3
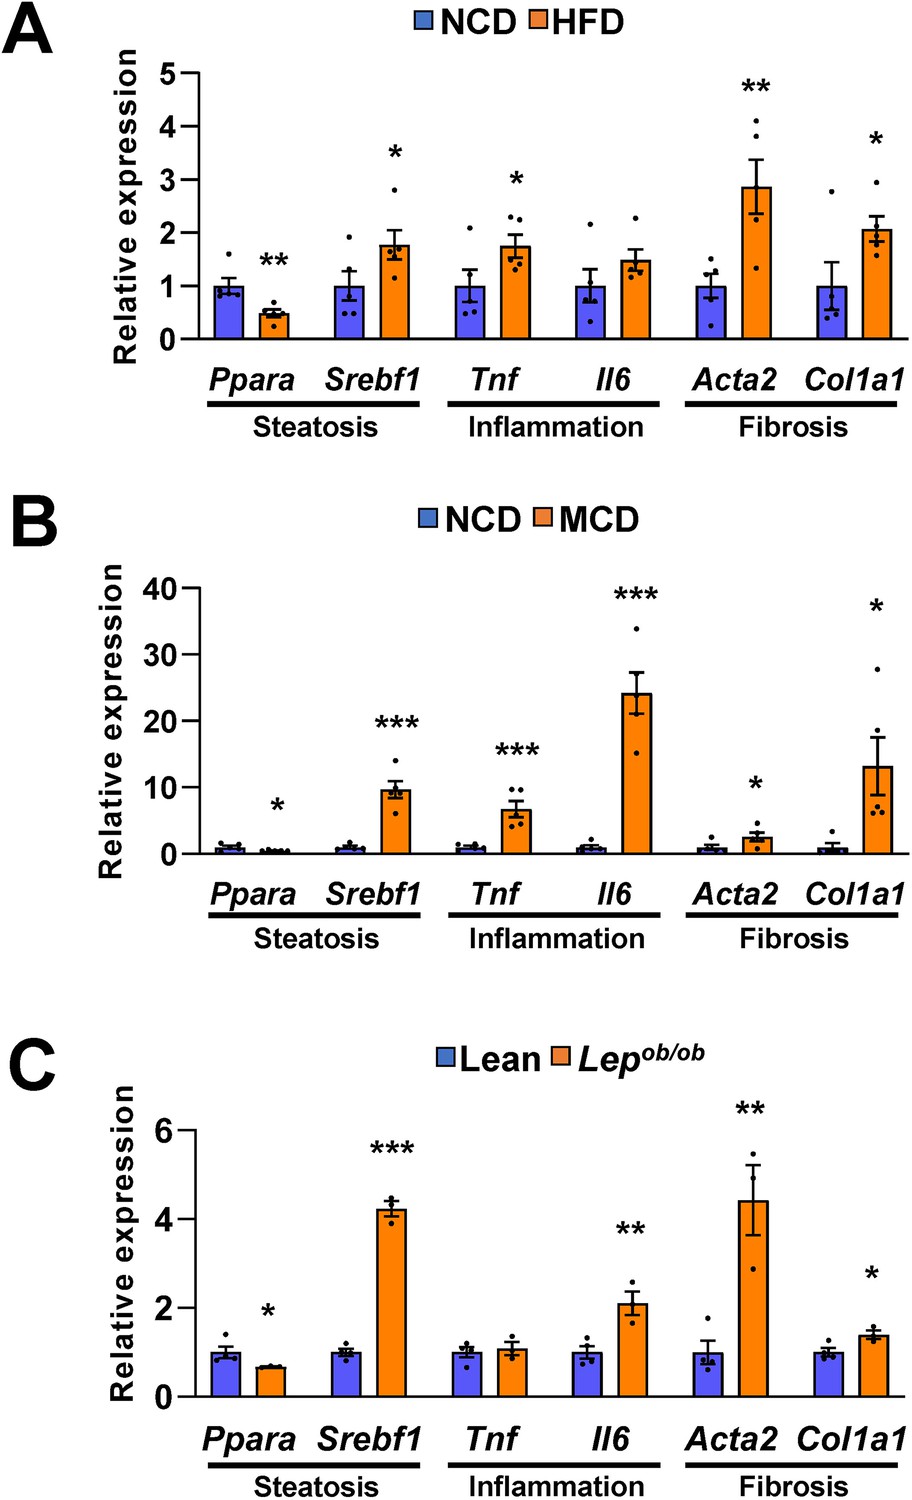
Hepatic gene expression associated with steatosis, inflammation and fibrosis is increased in dietary or genetic obese mice.
Genes involved in steatosis, inflammation, and fibrosis were measured by quantitative RT-PCR in C57BL/6 J mice fed high fat diet (HFD) (A) or methionine-deficient diet (MCD) (B), and were normalized to normal chow diet (NCD). Leptin-deficient Lepob/ob mice were normalized to lean wild mice (C). Values represent means ± SEM (n = 3–5). *p < 0.05, **p < 0.01, ***p < 0.001 vs NCD-fed mice. Raw data can be found in a Source Data file named ‘Figure 1—figure supplement 3—source data 1’.
-
Figure 1—figure supplement 3—source data 1
Hepatic gene expression associated with steatosis, inflammation and fibrosis is increased in dietary or genetic obese mice.
- https://cdn.elifesciences.org/articles/70472/elife-70472-fig1-figsupp3-data1-v2.xlsx
Figure 1—figure supplement 4

MIR20B expression significantly increases in OA-treated hepatocytes and the livers of dietary obese mice.
The expression of miRNA candidates from regulatory network analysis was measured by quantitative RT-PCR in OA-treated HepG2 cells (A) or Huh-7 cells (B) for 24 hr, and liver of C57BL/6 J mice fed a high fat diet (HFD) (C). It was normalized to miRNA expression in no treatment (NT) or normal chow diet (NCD). Values represent means ± SEM (n = 3–5). ns, not significant. *p < 0.05, **p < 0.01 vs NT in cells or NCD-fed mice. Raw data can be found in a Source Data file named ‘Figure 1—figure supplement 4—source data 1’.
-
Figure 1—figure supplement 4—source data 1
MIR20B expression significantly increases in OA-treated hepatocytes and the livers of dietary obese mice.
- https://cdn.elifesciences.org/articles/70472/elife-70472-fig1-figsupp4-data1-v2.xlsx
Figure 2 with 5 supplements
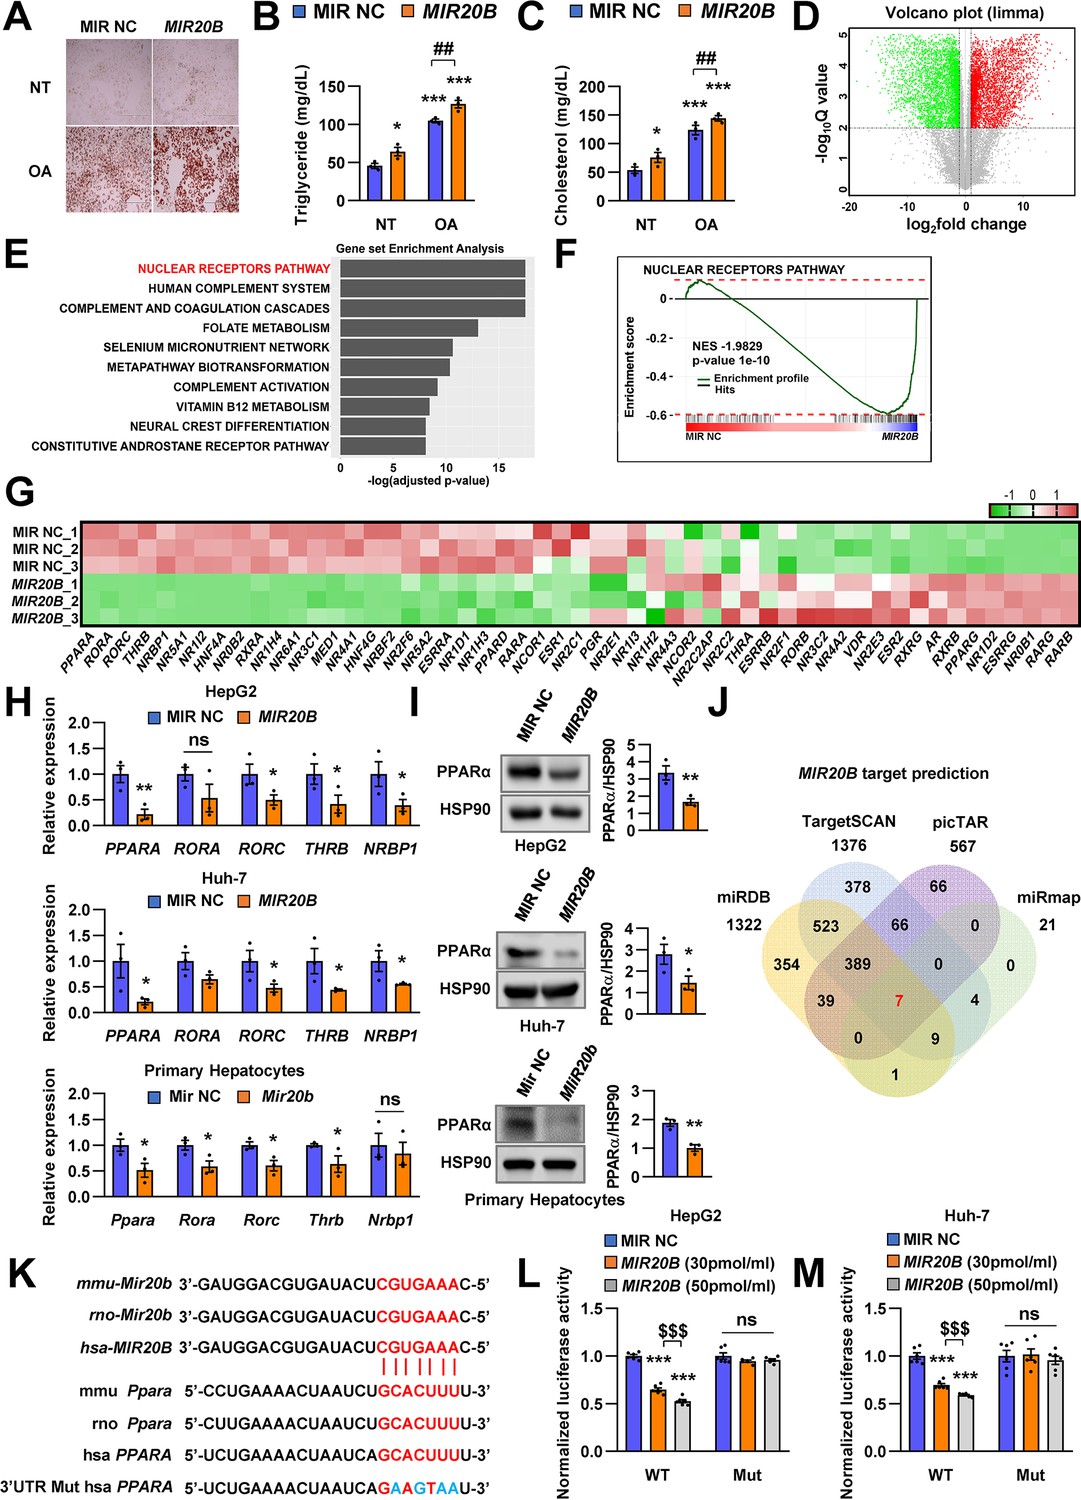
PPARA is a direct target of MIR20B.
Overexpressed MIR20B induces hepatic lipid accumulation in HepG2 cells treated with OA (1 mM). Oil Red O staining showed intracellular lipid accumulation in HepG2 cells. Scale bar is 400 µm (A). TG (B) and Cholesterol levels (C) were examined in OA-treated HepG2 cells transfected with MIR NC or MIR20B. RNA-seq was performed on sample from HepG2 cell with or without overexpression of MIR20B.Volcano plot of the gene expressions (log2 fold change) compared to the negative control from RNA-seq analysis (D). Top ranked GSEA in overexpressed MIR20B compared to MIR NC in HepG2 cells (E). The primary ranked enrichment plot of nuclear receptors pathway (F). Heatmap of the genes in NR pathway upon MIR20B overexpression compared to control (G). Expression of primary ranked nuclear receptors pathway genes from RNA-seq analysis in HepG2 cells, Huh-7 cells, and primary hepatocytes transfected with MIR20B were normalized to each cells transfected with MIR NC (H). Western blot analysis of PPARα on MIR NC or MIR20B transfected cells. The intensity of PPARα blot was normalized to that of HSP90 (I). Venn diagram of predicted targets for MIR20B in four major database system (J). Graphic image of the conserved binding motifs of MIR20B within 3’UTR mRNA of PPARA (K). Luciferase activities of MIR20B-transfected HepG2 cells and Huh-7 cells containing the luciferase reporter DNA constructs for wild-type or mutated 3’UTR of PPARA were normalized to those or MIR NC-transfected cells (L, M). Values represent means ± SEM (n = 3). *p < 0.05, **p < 0.01, ***p < 0.001 vs MIR NC. ##p < 0.01 vs MIR NC+ OA. $$$ < 0.001 vs MIR20B (30 pmol/ml). Raw data can be found in a Source Data file named ‘Figure 2—source data 1’.
-
Figure 2—source data 1
PPARA is a direct target of MIR20B.
- https://cdn.elifesciences.org/articles/70472/elife-70472-fig2-data1-v2.xlsx
Figure 2—figure supplement 1
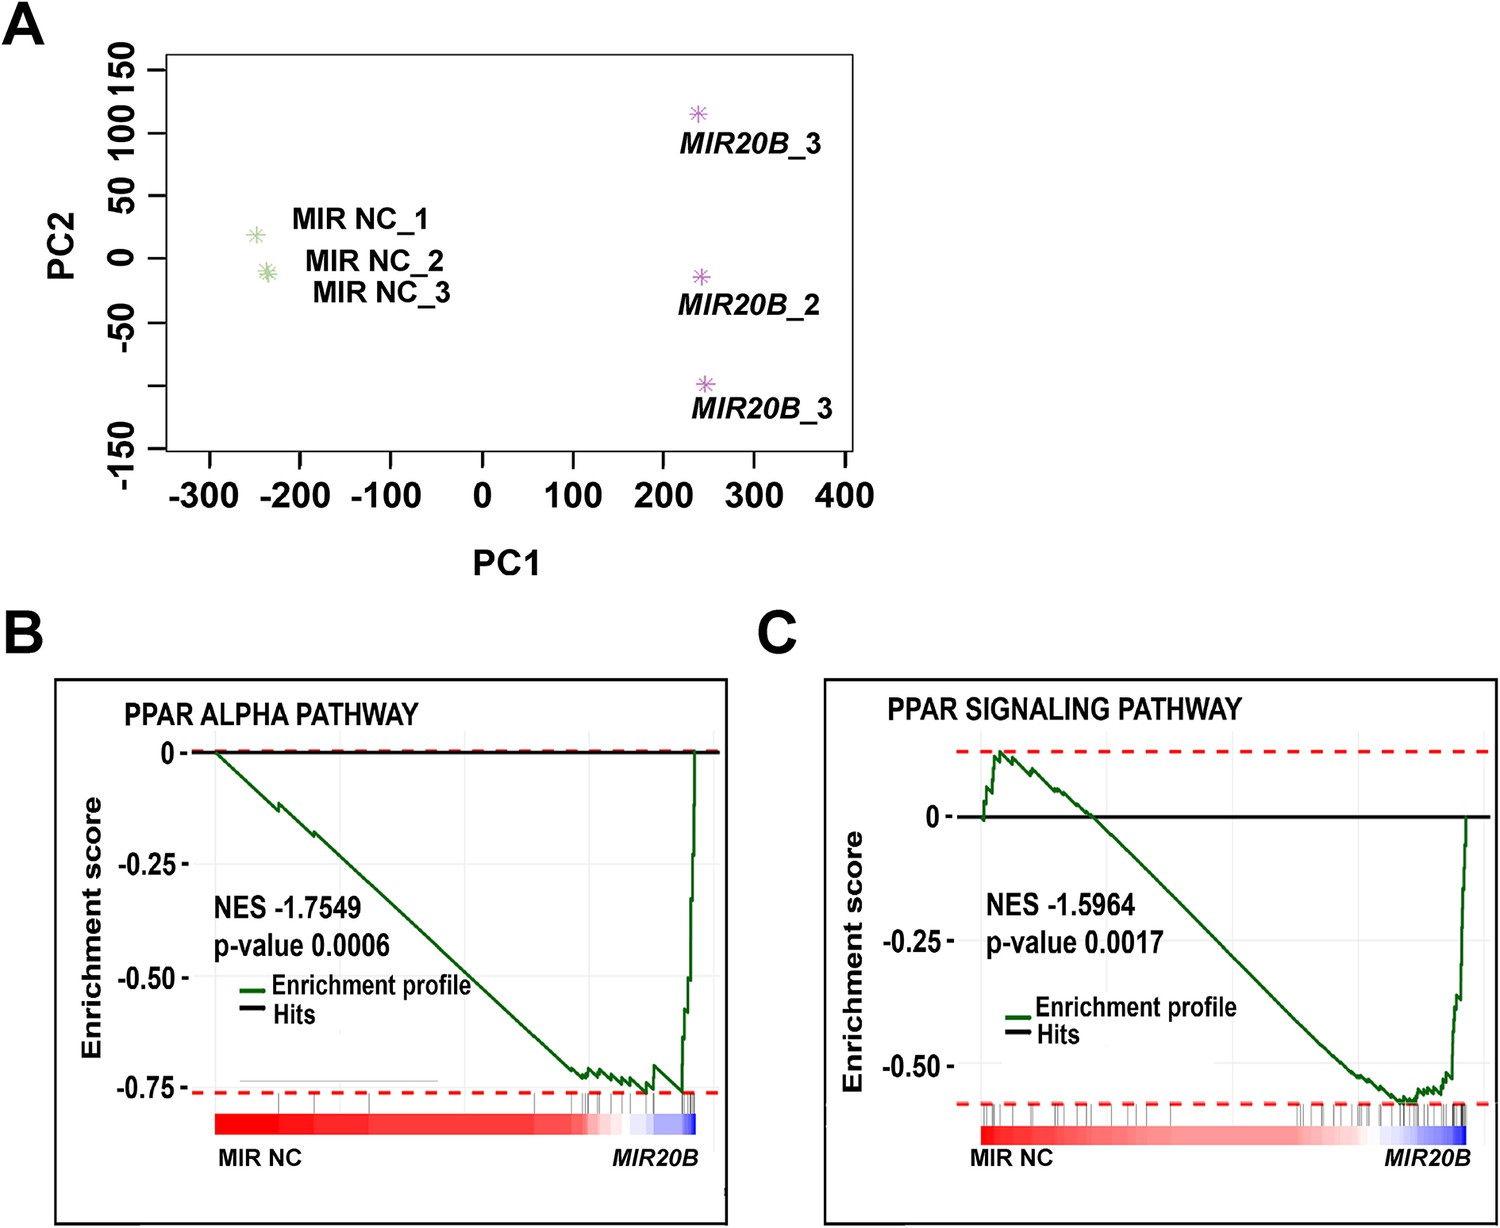
Analysis of PPARα related pathway in RNA-seq of MIR20B overexpressed HepG2 cells.
HepG2 cells were transfected either with MIR NC or MIR20B and analyzed by RNA-seq. Analysis of the MIR20B compared to the negative control (n = 3) via PCA plot from RNA-seq data (A). Gene set enrichment pathway analysis of PPARα-related pathways, including PPARA pathway and PPAR signaling pathway in overexpressed MIR20B compared to MIR NC (B, C).
Figure 2—figure supplement 2
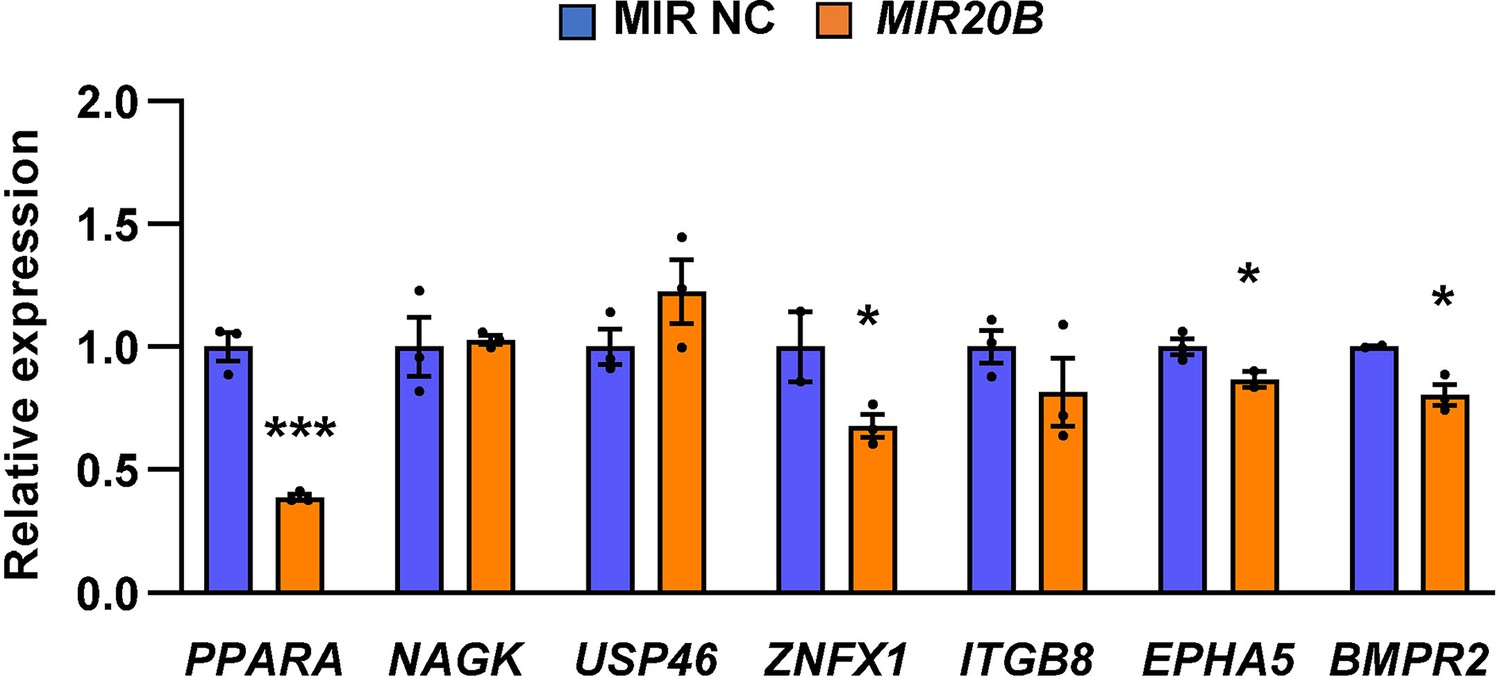
PPARA is the primary target of the overlapped candidates.
The seven predicted MIR20B targets (PPARA, NAGK, USP46, ZNFX1, ITGB8, EPHA5, BMPR2) were overlapped in miRNA target prediction programs. HepG2 cells were transfected with MIR NC or MIR20B and the expression of seven predicted MIR20B targets were measured by quantitative RT-PCR. Relative values are normalized to MIR NC. Values represent means ± SEM (n = 3). *p < 0.05, ***p < 0.001 vs MIR NC. Raw data can be found in a Source Data file named ‘Figure 2—figure supplement 2—source data 1’.
-
Figure 2—figure supplement 2—source data 1
PPARA is the primary target of the overlapped candidates.
- https://cdn.elifesciences.org/articles/70472/elife-70472-fig2-figsupp2-data1-v2.xlsx
Figure 2—figure supplement 3
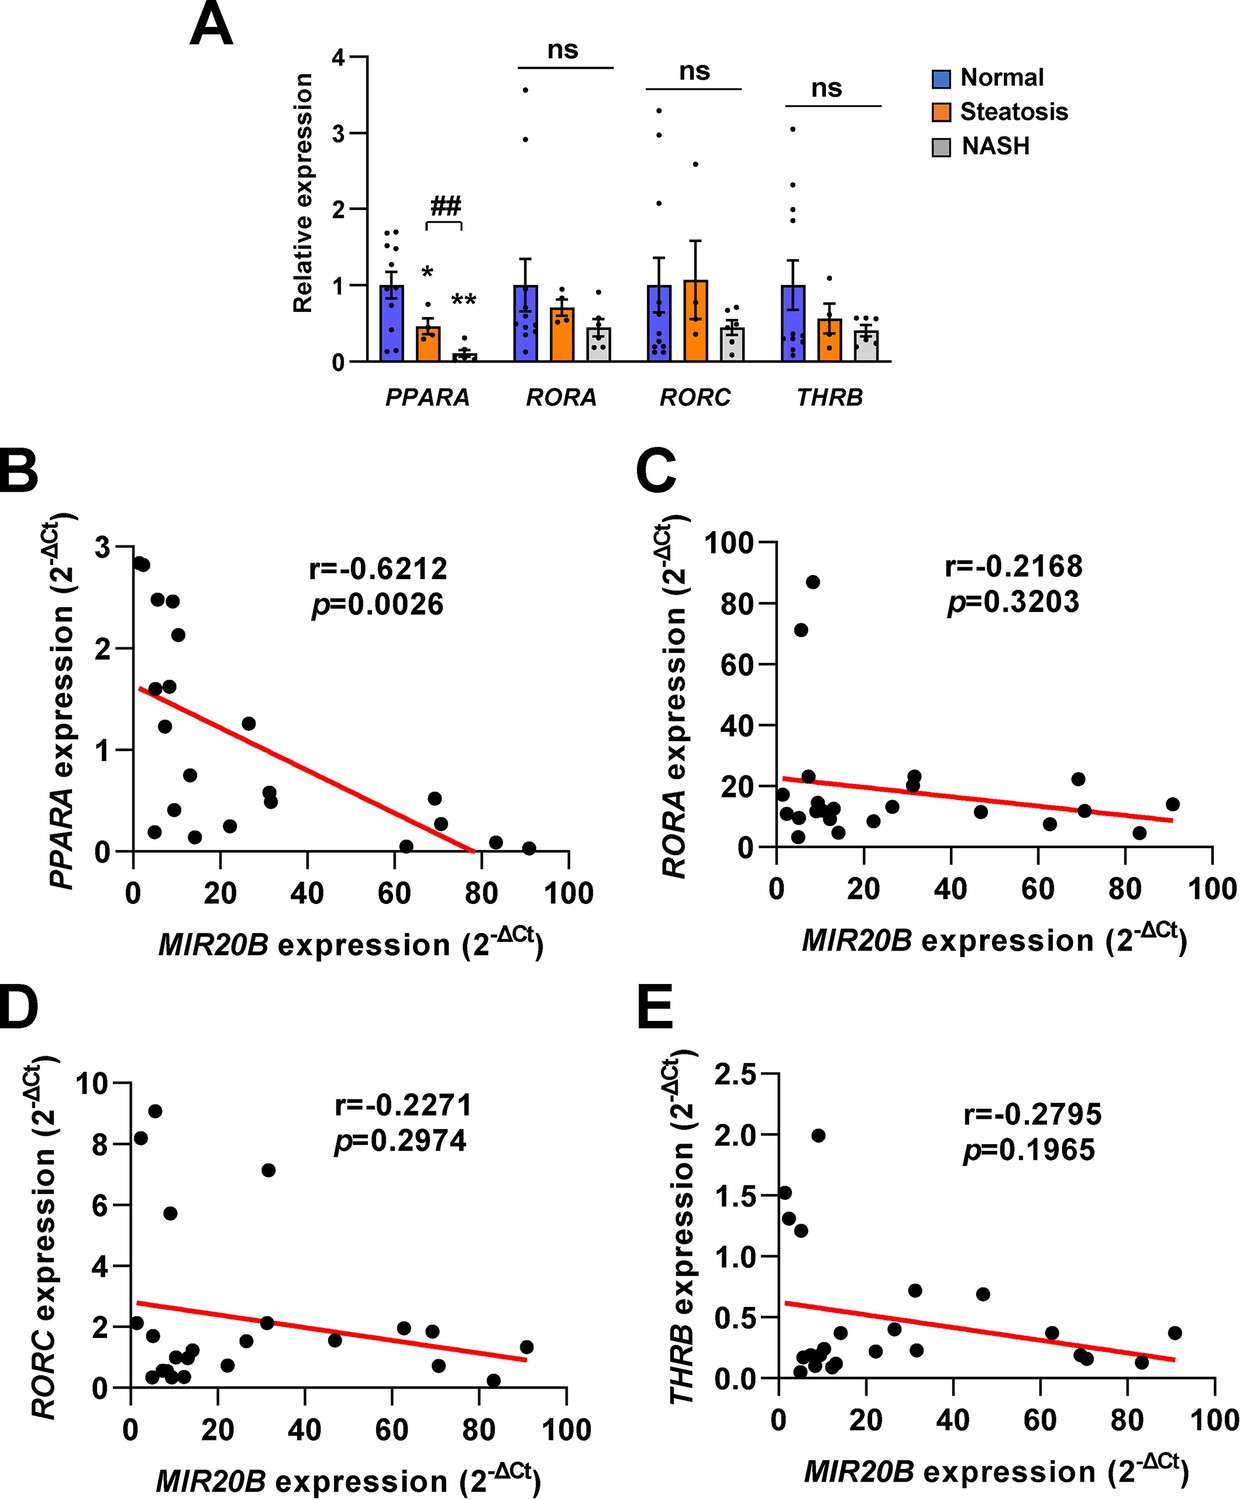
Correlation between the expression of nuclear receptors and MIR20B during NAFLD progression.
The expression of nuclear receptors (PPARA, RORA, RORC, THRB), potential target genes of MIR20B, was measured in the liver of patient with indicated condition by quantitative RT-PCR. The level of nuclear receptors in patients with steatosis or NASH was normalized to that of normal individuals (A). Pearson correlation was analyzed between the expression (2-ΔCt) of MIR20B and nuclear receptors in all study population (B–E). Data were presented as mean ± SEM. ns, not significant. *p < 0.05 and **p < 0.01 vs normal individuals. ##p < 0.01 vs patients with steatosis. Raw data can be found in a Source Data file named ‘Figure 2—figure supplement 3—source data 1’.
-
Figure 2—figure supplement 3—source data 1
Correlation between the expression of nuclear receptors and MIR20B during NAFLD progression.
- https://cdn.elifesciences.org/articles/70472/elife-70472-fig2-figsupp3-data1-v2.xlsx
Figure 2—figure supplement 4
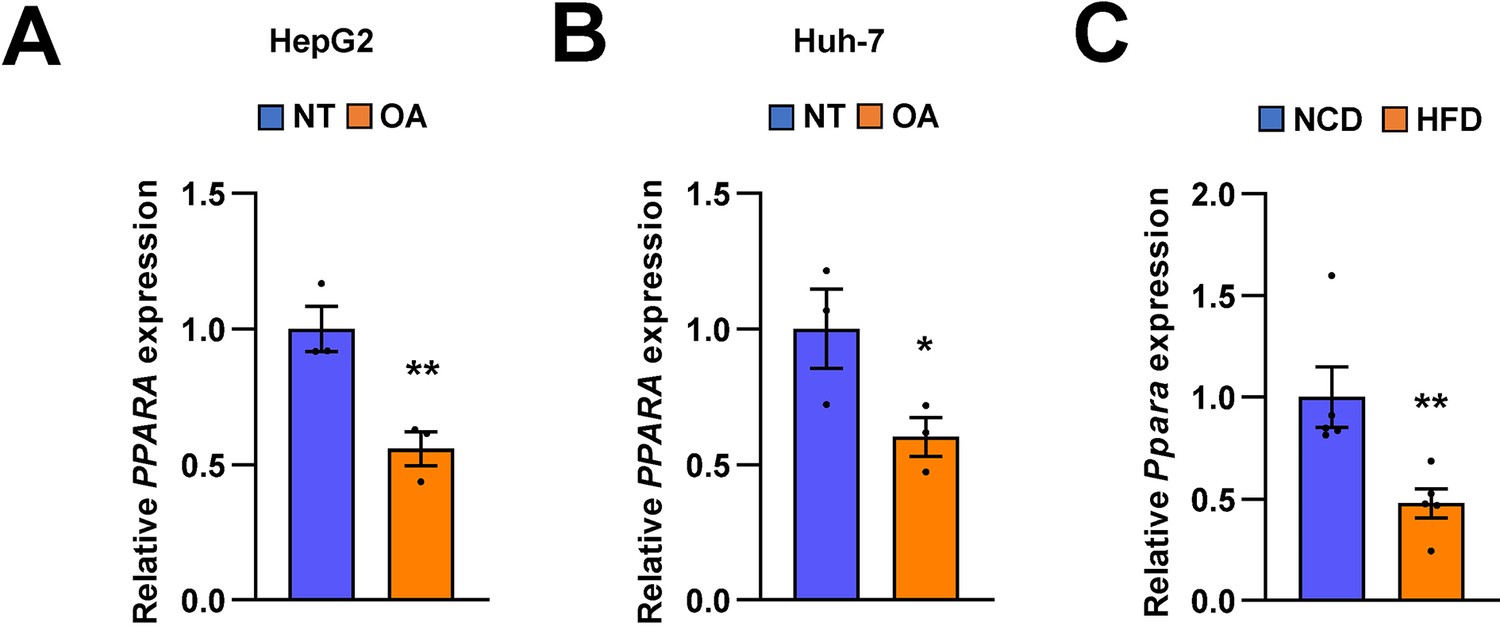
The expression of PPARA is regulated both in human and mice.
The expression of PPARA was measured in HepG2, Huh-7 cells, and mice liver tissues by quantitative RT-PCR. PPARA expression levels from HepG2 cells (A) and Huh-7 cells (B) treated with OA for 24 hr were normalized to no treatment (NT). Hepatic Ppara expression levels from C57BL/6 J mice fed a HFD (C) were normalized to NCD. Values represent means ± SEM (n = 3–5). *p < 0.05, **p < 0.01 vs NT in cells or NCD-fed mice. Raw data can be found in a Source Data file named ‘Figure 2—figure supplement 4—source data 1’.
-
Figure 2—figure supplement 4—source data 1
The expression of PPARA is regulated both in human and mice.
- https://cdn.elifesciences.org/articles/70472/elife-70472-fig2-figsupp4-data1-v2.xlsx
Figure 2—figure supplement 5
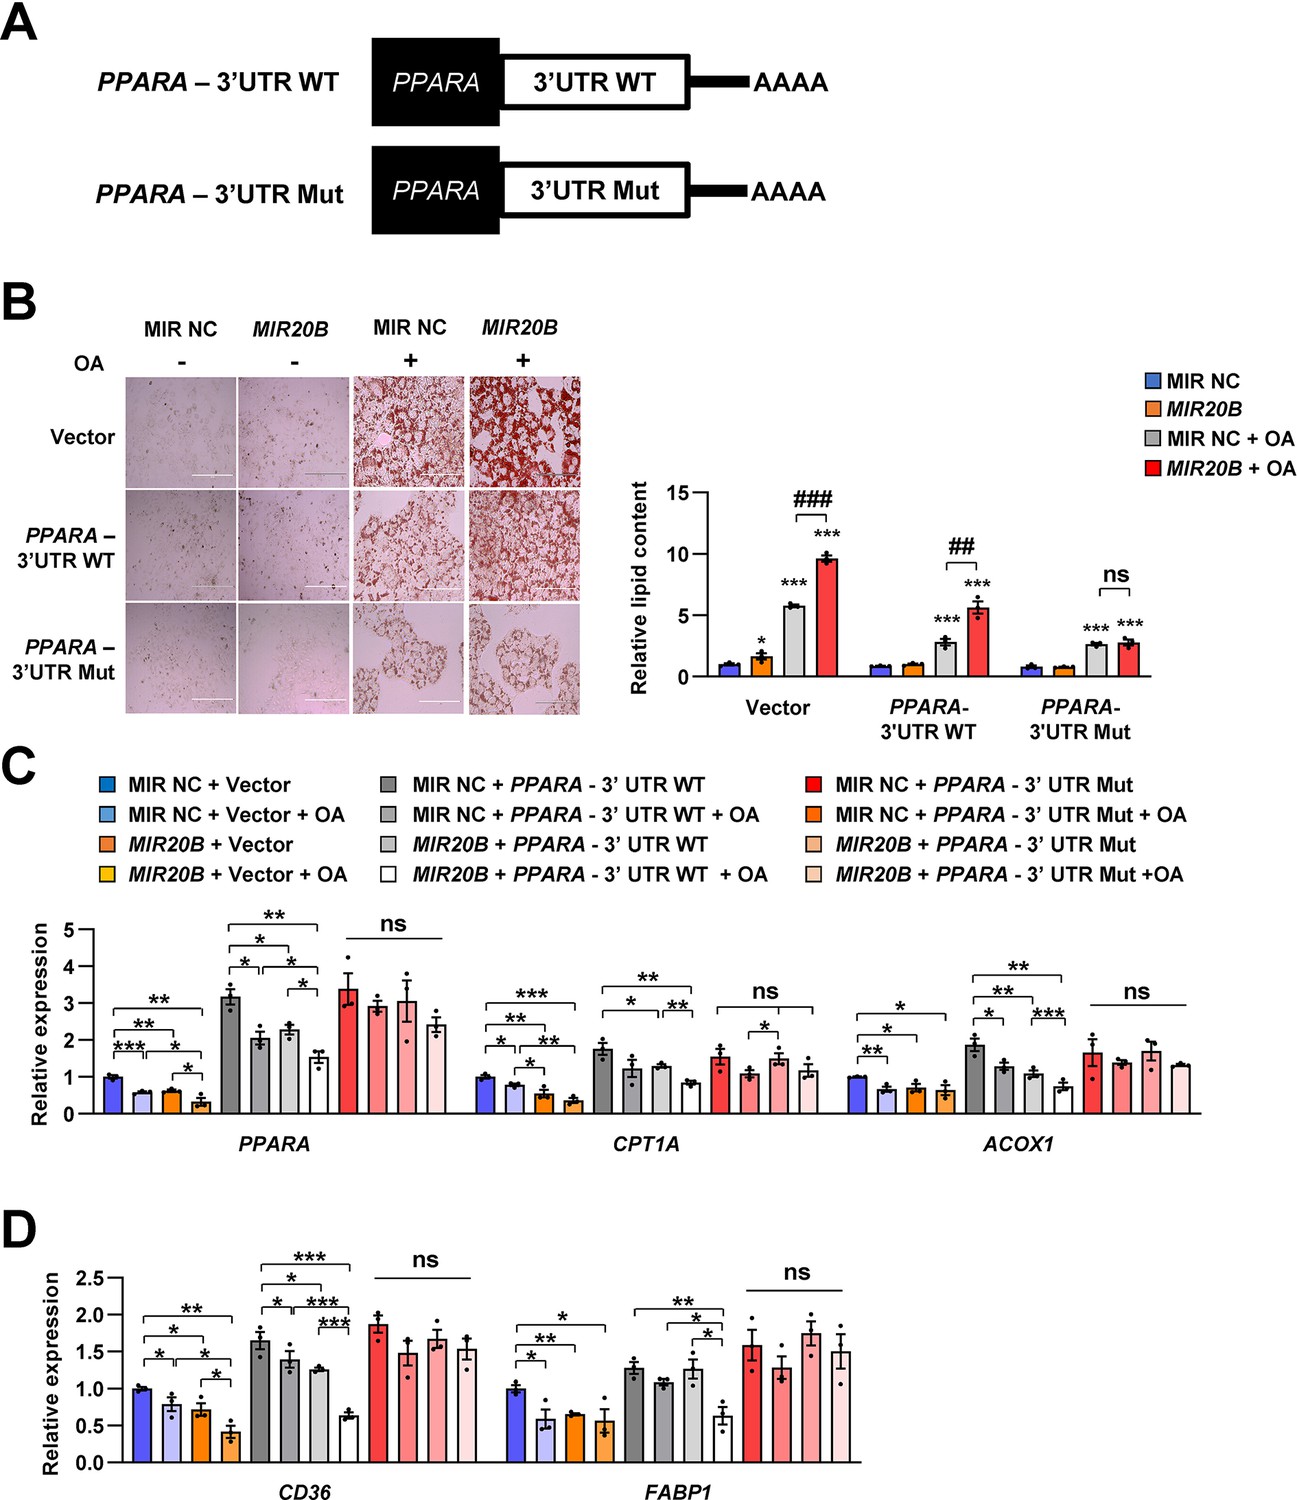
PPARA-3’UTR mutant blocks the effects of MIR20B on lipid metabolism.
Schematic image of expressing plasmids for PPARA-3’UTR wild-type (WT) or mutated (Mut) (A). Lipid accumulation in 1 mM OA-treated HepG2 cells transfected with plasmids and miRNA was stained by Oil Red O. Scale bar is 400 µm (B, Left). The staining was normalized to that of HepG2 cells transfected with vector and MIR NC without OA (B, Right). ns, not significant. *p < 0.05, ***p < 0.001 vs MIR NC. ##p < 0.01, ###p < 0.001 vs MIR NC+ OA. The expression of genes related to FA β-oxidation (C) and FA uptake (D) was measured by quantitative RT-PCR. Relative values are normalized to that of HepG2 cells transfected with vector and MIR NC without OA. Values represent means ± SEM (n = 3). ns, not significant. *p < 0.05, **p < 0.01, ***p < 0.001. Raw data can be found in a Source Data file named ‘Figure 2—figure supplement 5—source data 1’.
-
Figure 2—figure supplement 5—source data 1
PPARA-3’UTR mutant blocks the effects of MIR20B on lipid metabolism.
- https://cdn.elifesciences.org/articles/70472/elife-70472-fig2-figsupp5-data1-v2.xlsx
Figure 3
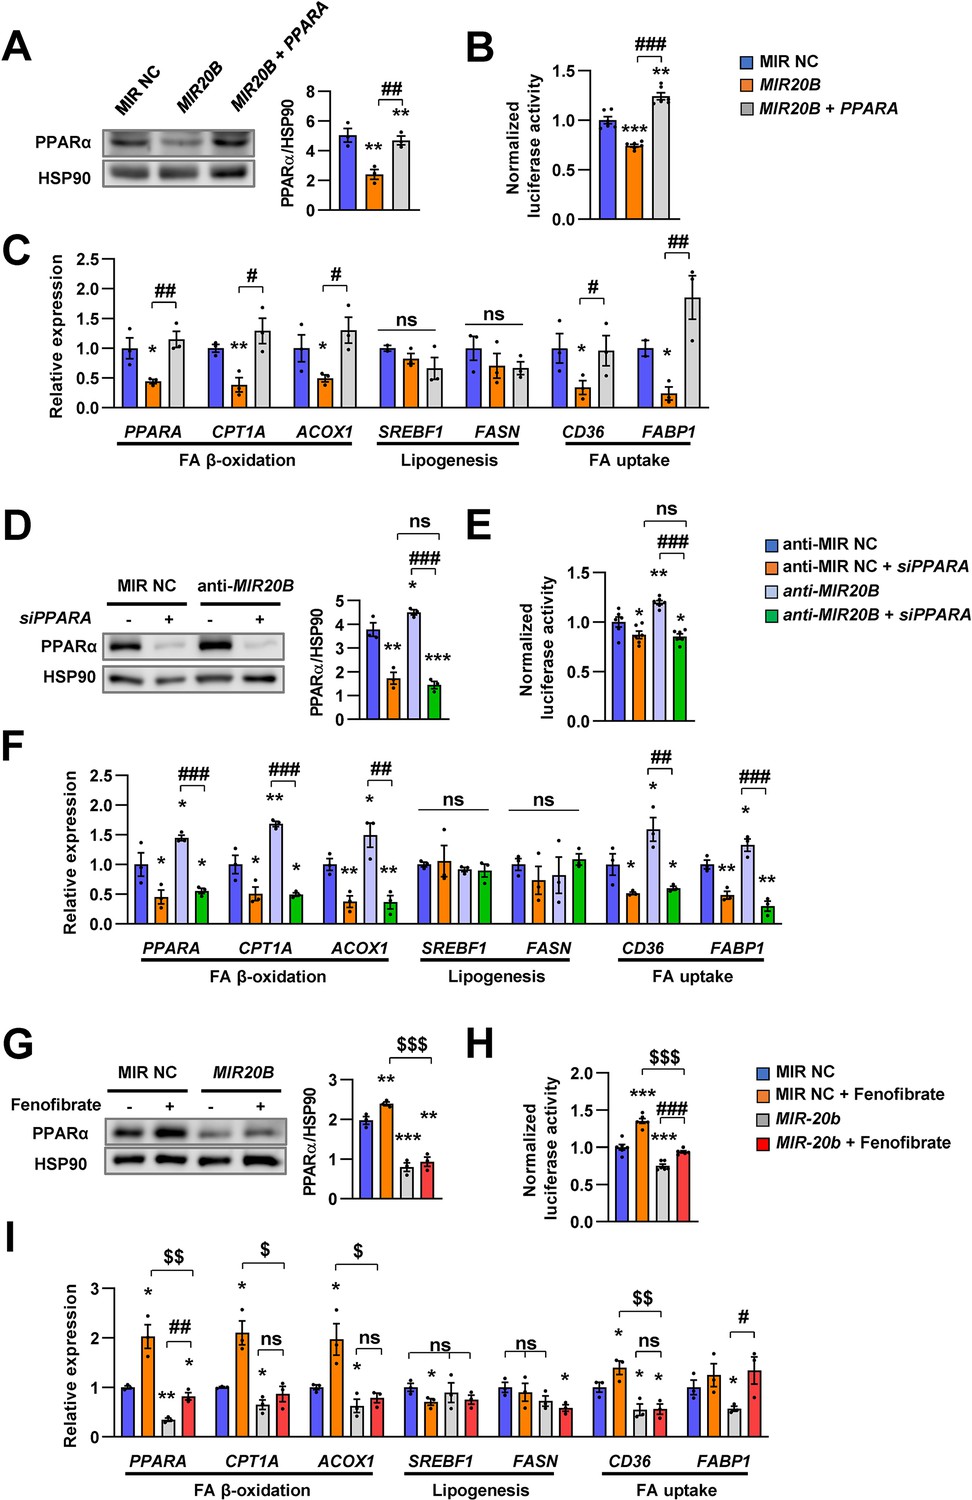
The effects of MIR20B are mediated by PPARα.
HepG2 cells transfected with indicated miRNA, siRNA, or PPARA expression vector. Western blot analysis of PPARα. The intensity of PPARα blot was normalized to that of HSP90 (A, D). Luciferase activity using the luciferase reporter DNA constructs containing PPRE (PPAR response element) was transfected in HepG2 cells. Luciferase activity was normalized to renilla activity (B, E). mRNA level of genes involved in FA β-oxidation, lipogenesis, and FA uptake was analyzed by real-time qPCR (C and F). After transfected with MIR NC or MIR20B, HepG2 cells were treated with fenofibrate (100 µM). Protein level of PPARα was analyzed by western blot and normalized to that of HSP90 (G). The transcriptional activity of PPARα was measured (H). Genes involved in of FA β-oxidation, lipogenesis and FA uptake were determined by real-time qPCR (I). Relative values are normalized to MIR NC. Values represent means ± SEM (n = 3). ns, not significant. *p < 0.05, **p < 0.01, ***p < 0.001 vs MIR NC. #p < 0.05, ##p < 0.01, ###p < 0.001 vs MIR20B or anti-MIR20B. $p < 0.05, $$p < 0.01, $$$p < 0.001 vs MIR NC+ fenofibrate. Raw data can be found in a Source Data file named ‘Figure 3—source data 1’.
-
Figure 3—source data 1
The effects of MIR20B are mediated by PPARα.
- https://cdn.elifesciences.org/articles/70472/elife-70472-fig3-data1-v2.xlsx
Figure 4 with 6 supplements
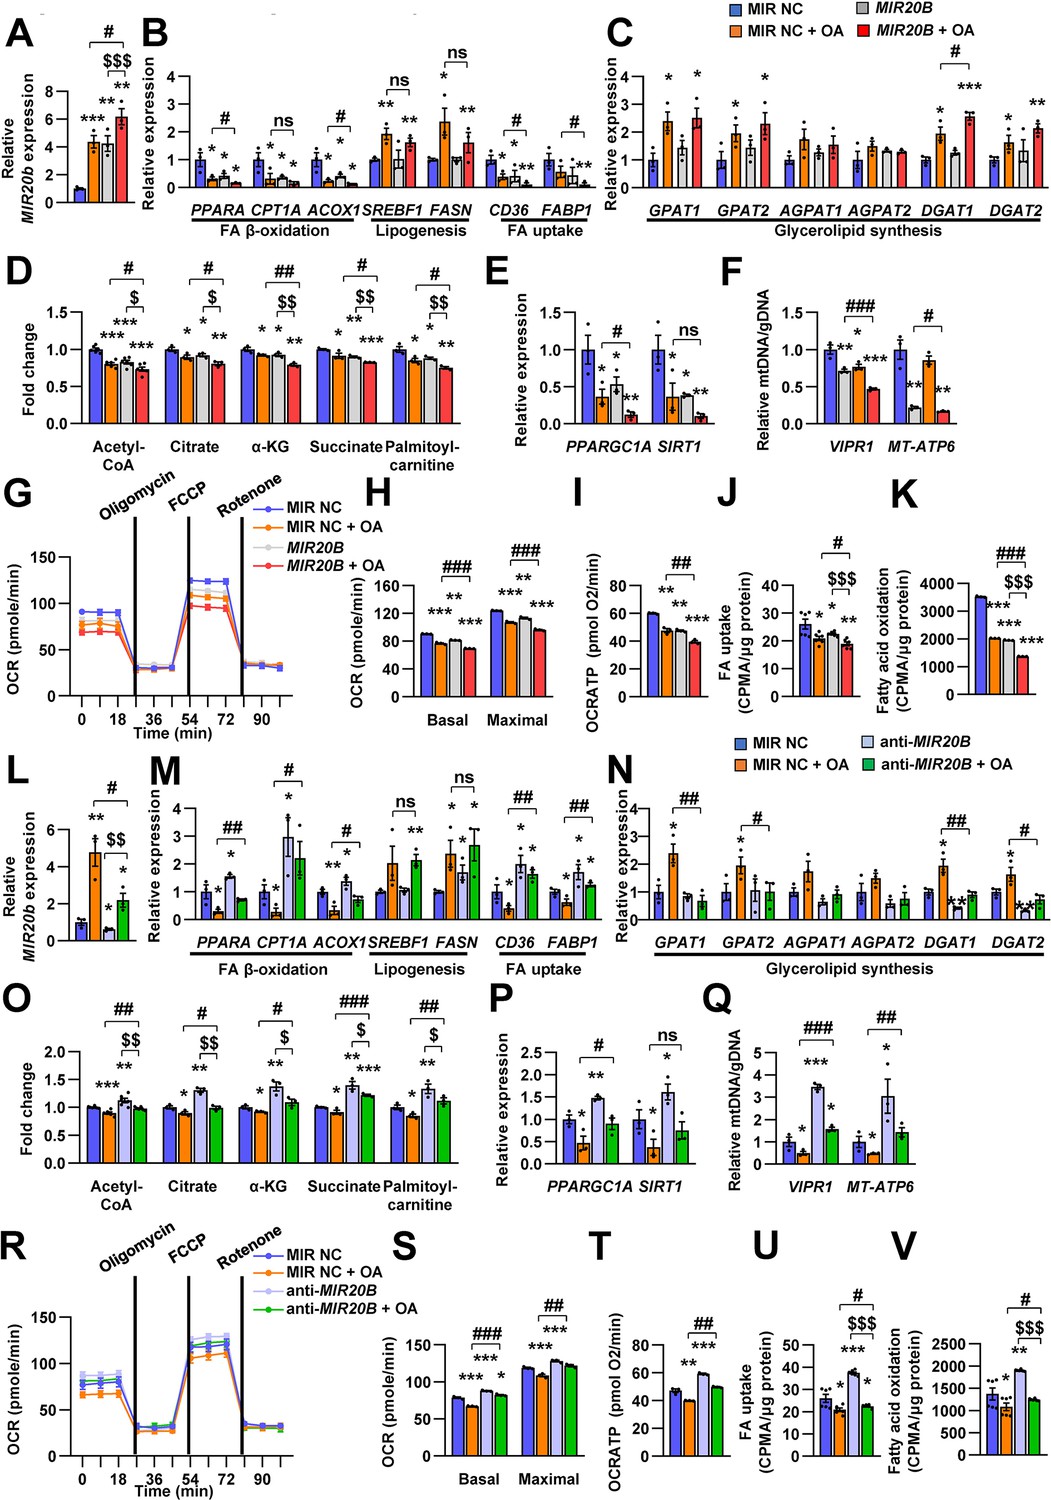
MIR20B regulates fatty acid metabolism.
HepG2 cells were transfected with MIR20B or anti-MIR20B and treated with OA for 24 hr. The expression of MIR20B (A, L) and genes related to FA β-oxidation, lipogenesis, FA uptake (B, M) and glycerolipid synthesis (C, N) were measured by quantitative RT-PCR. Representative mitochondrial metabolites were measured in HepG2 cells (D, O). The expression of genes related to mitochondrial biogenesis (E, P) were measured by quantitative RT-PCR. The mitochondrial copy of VIPR1 and MT-ATP6 were determined (F, Q). OCR (G, R), basal and maximal OCR (H, S), and ATP levels (I, T) were measured in HepG2 cells. FA uptake (J, U) and β-oxidation (K, V) activity were measured using [9,10-3H(N)]-Palmitic Acid and normalized to the total protein content. Relative values are normalized to MIR NC. Values represent means ± SEM (n = 3–5). ns, not significant. *p < 0.05, **p < 0.01, ***p < 0.001 vs MIR NC. #p < 0.05, ##p < 0.01, ###p < 0.001 vs MIR NC+ OA. $p < 0.05, $$p < 0.01, $$$p < 0.001 vs MIR20B or anti-MIR20B, respectively. Raw data can be found in a Source Data file named ‘Figure 4—source data 1’.
-
Figure 4—source data 1
MIR20B regulates fatty acid metabolism.
- https://cdn.elifesciences.org/articles/70472/elife-70472-fig4-data1-v2.xlsx
Figure 4—figure supplement 1
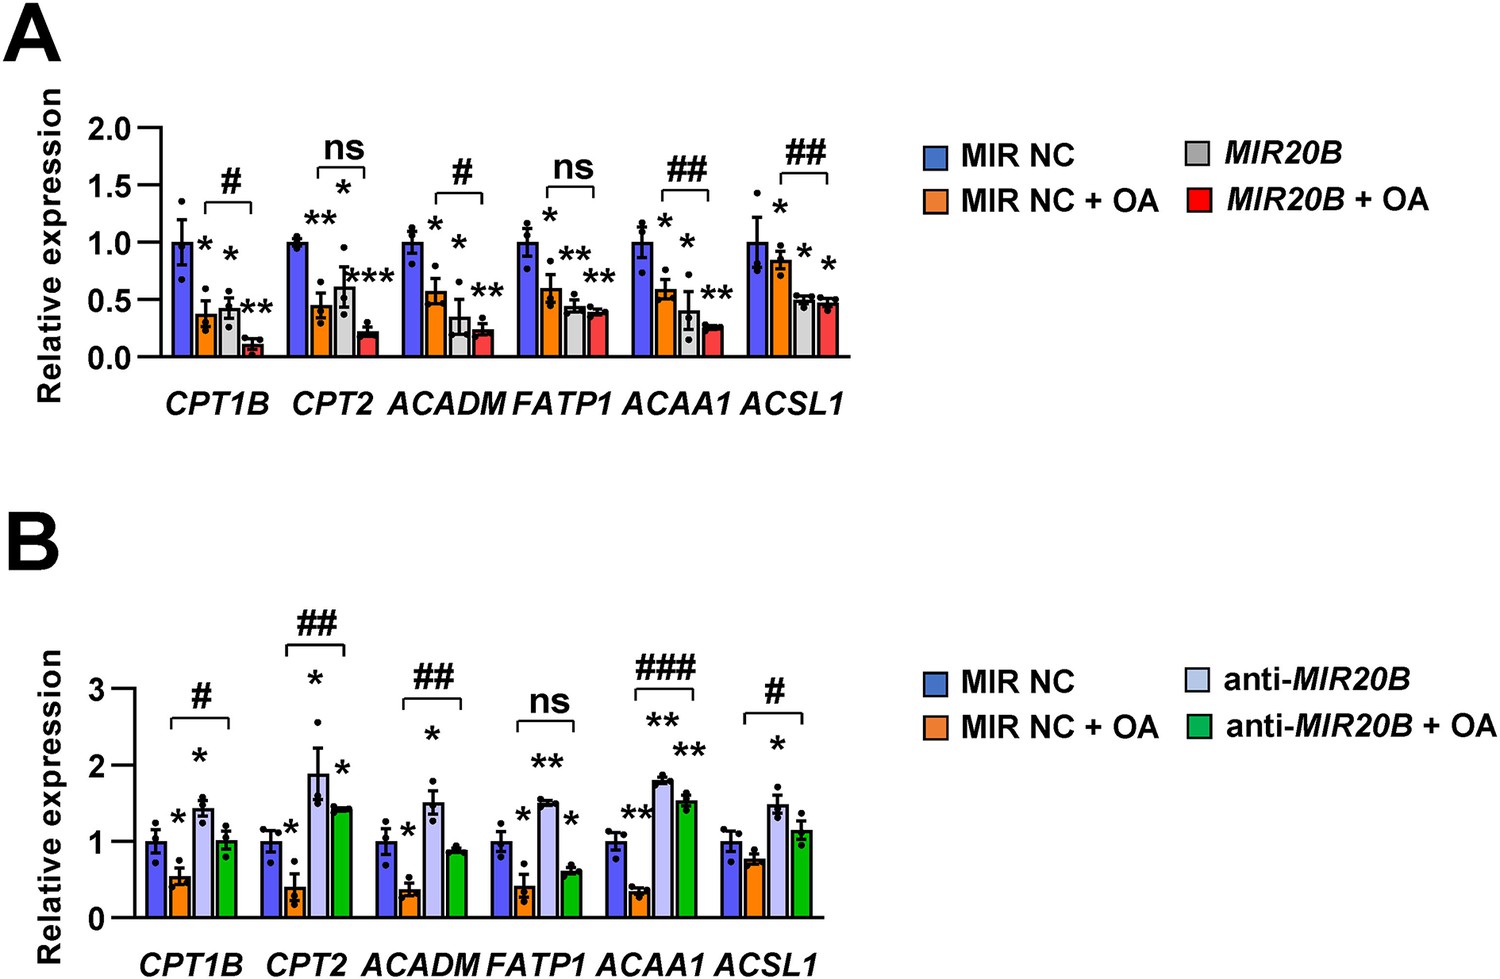
The expression of PPARα target genes is regulated by MIR20B.
HepG2 cells were transfected with MIR20B (A) or anti-MIR20B (B) and treated with OA for 24 hr. The expression of PPARα target genes was measured by quantitative RT-PCR. Relative values are normalized to MIR NC. Values represent means ± SEM (n = 3). ns, not significant. *p < 0.05, **p < 0.01, ***p < 0.001 vs MIR NC. #p < 0.05, ##p < 0.01, ###P < 0.001 vs MIR NC+ OA. Raw data can be found in a Source Data file named ‘Figure 4—figure supplement 1—source data 1’.
-
Figure 4—figure supplement 1—source data 1
The expression of PPARα target genes is regulated by MIR20B.
- https://cdn.elifesciences.org/articles/70472/elife-70472-fig4-figsupp1-data1-v2.xlsx
Figure 4—figure supplement 2
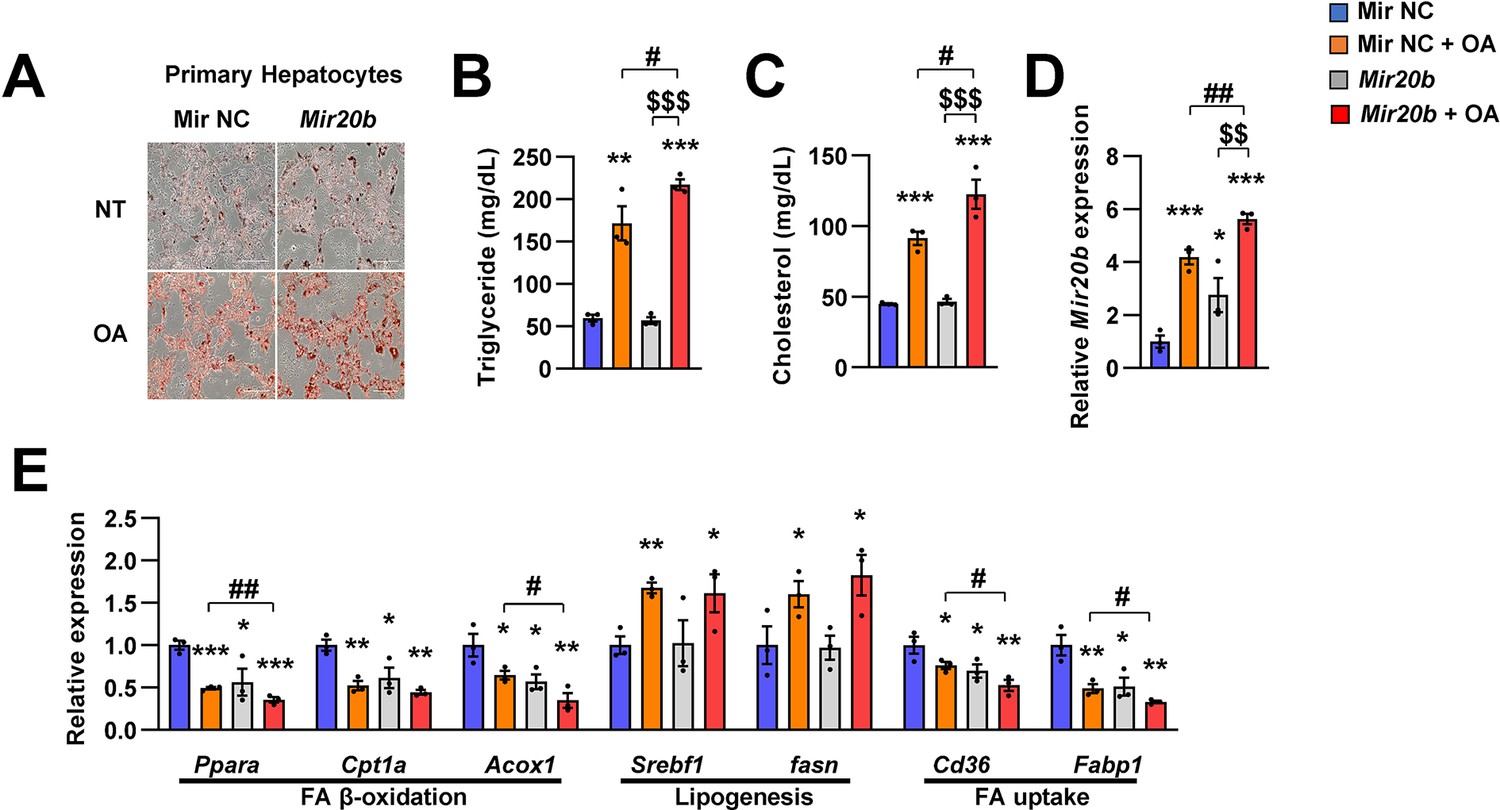
MIR20B enhances lipid accumulation in primary hepatocytes under OA-treatment.
Primary hepatocytes were transfected with MIR NC or MIR20B, subsequently treated with OA (1 mM). Representative Oil Red O staining revealed intracellular lipid accumulation (A). The level of triglyceride (B) and cholesterol (C) were analyzed. The expression of MIR20B (D) and genes related to FA β-oxidation, lipogenesis and FA uptake (E) was measured by quantitative RT-PCR. Values represent means ± SEM (n = 3). ns, not significant. *p < 0.05, **p < 0.01, ***p < 0.001 vs MIR NC. #p < 0.05, ##p < 0.01, vs MIR NC+ OA. $$p < 0.01, $$$p < 0.001, vs MIR20B. Raw data can be found in a Source Data file named ‘Figure 4—figure supplement 2—source data 1’.
-
Figure 4—figure supplement 2—source data 1
MIR20B enhances lipid accumulation in primary hepatocytes under OA-treatment.
- https://cdn.elifesciences.org/articles/70472/elife-70472-fig4-figsupp2-data1-v2.xlsx
Figure 4—figure supplement 3
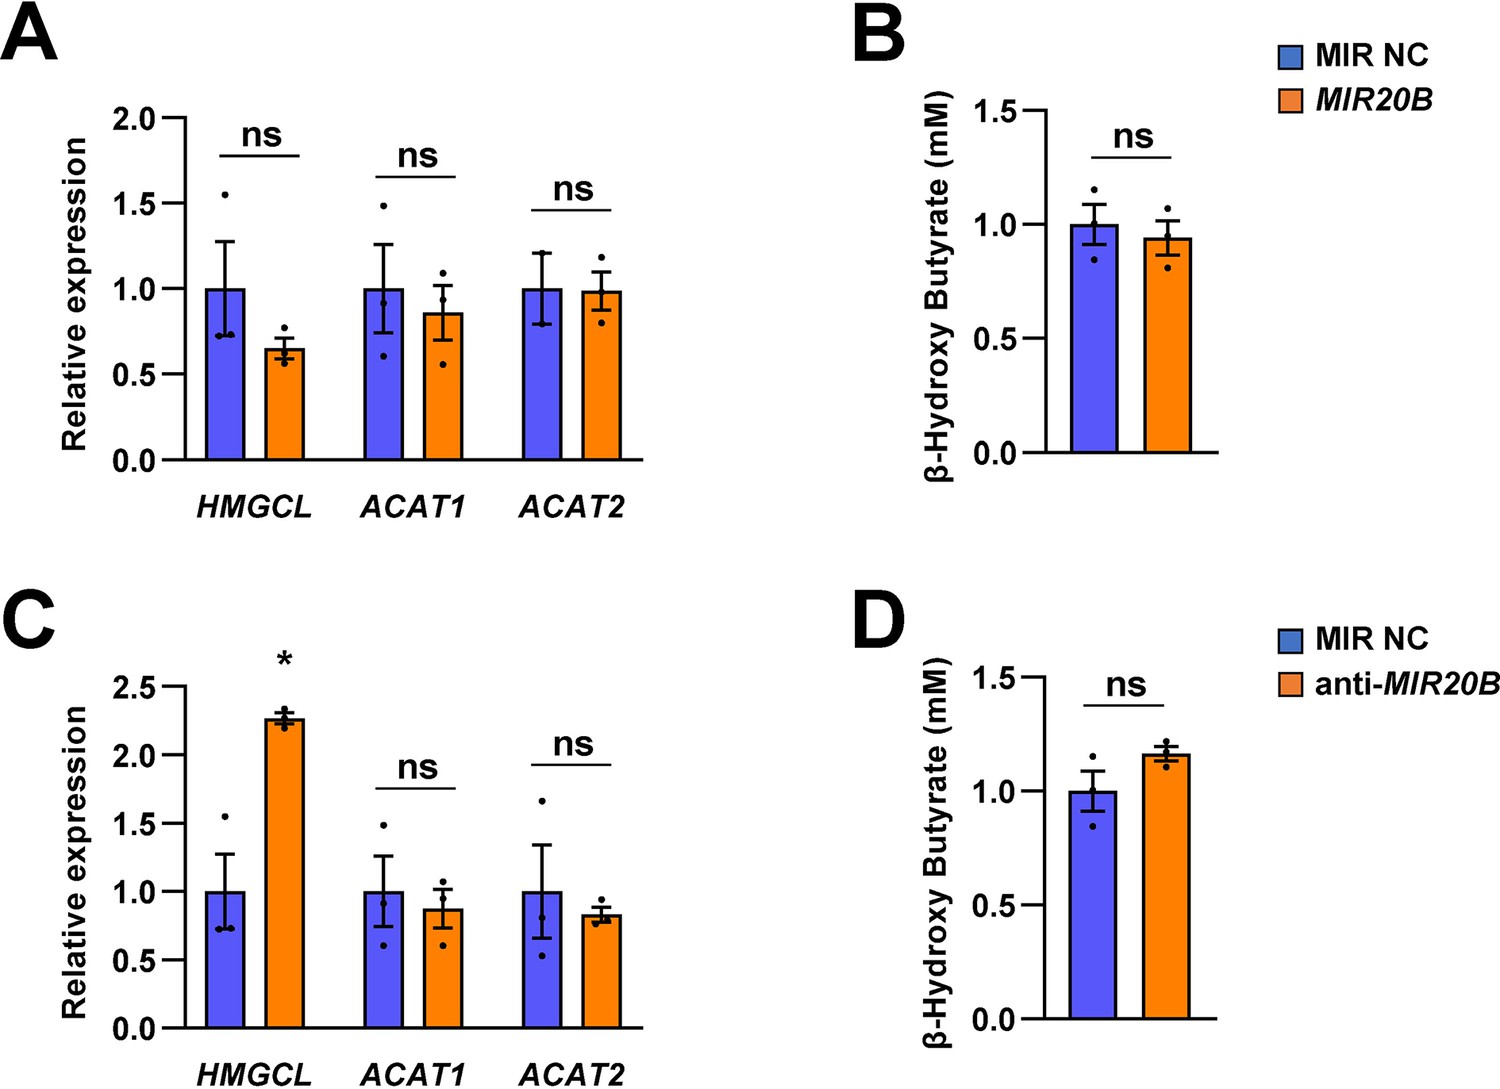
Ketogenesis is not regulated by MIR20B in HepG2 cells.
HepG2 cells were transfected with MIR20B, anti-MIR20B, or MIR NC as control. The expression of genes involved in ketogenesis (HMGCL, ACAT1 and ACAT2) were measured by quantitative RT-PCR. Relative values are normalized to MIR NC (A, C). The concentration of β-hydroxybutyrate which generated by ketogenesis was examined in HepG2 cells (B, D). Values represent means ± SEM (n = 3). ns, not significant. *p < 0.05 vs MIR NC. Raw data can be found in a Source Data file named ‘Figure 4—figure supplement 3—source data 1’.
-
Figure 4—figure supplement 3—source data 1
Ketogenesis is not regulated by MIR20B in HepG2 cells.
- https://cdn.elifesciences.org/articles/70472/elife-70472-fig4-figsupp3-data1-v2.xlsx
Figure 4—figure supplement 4
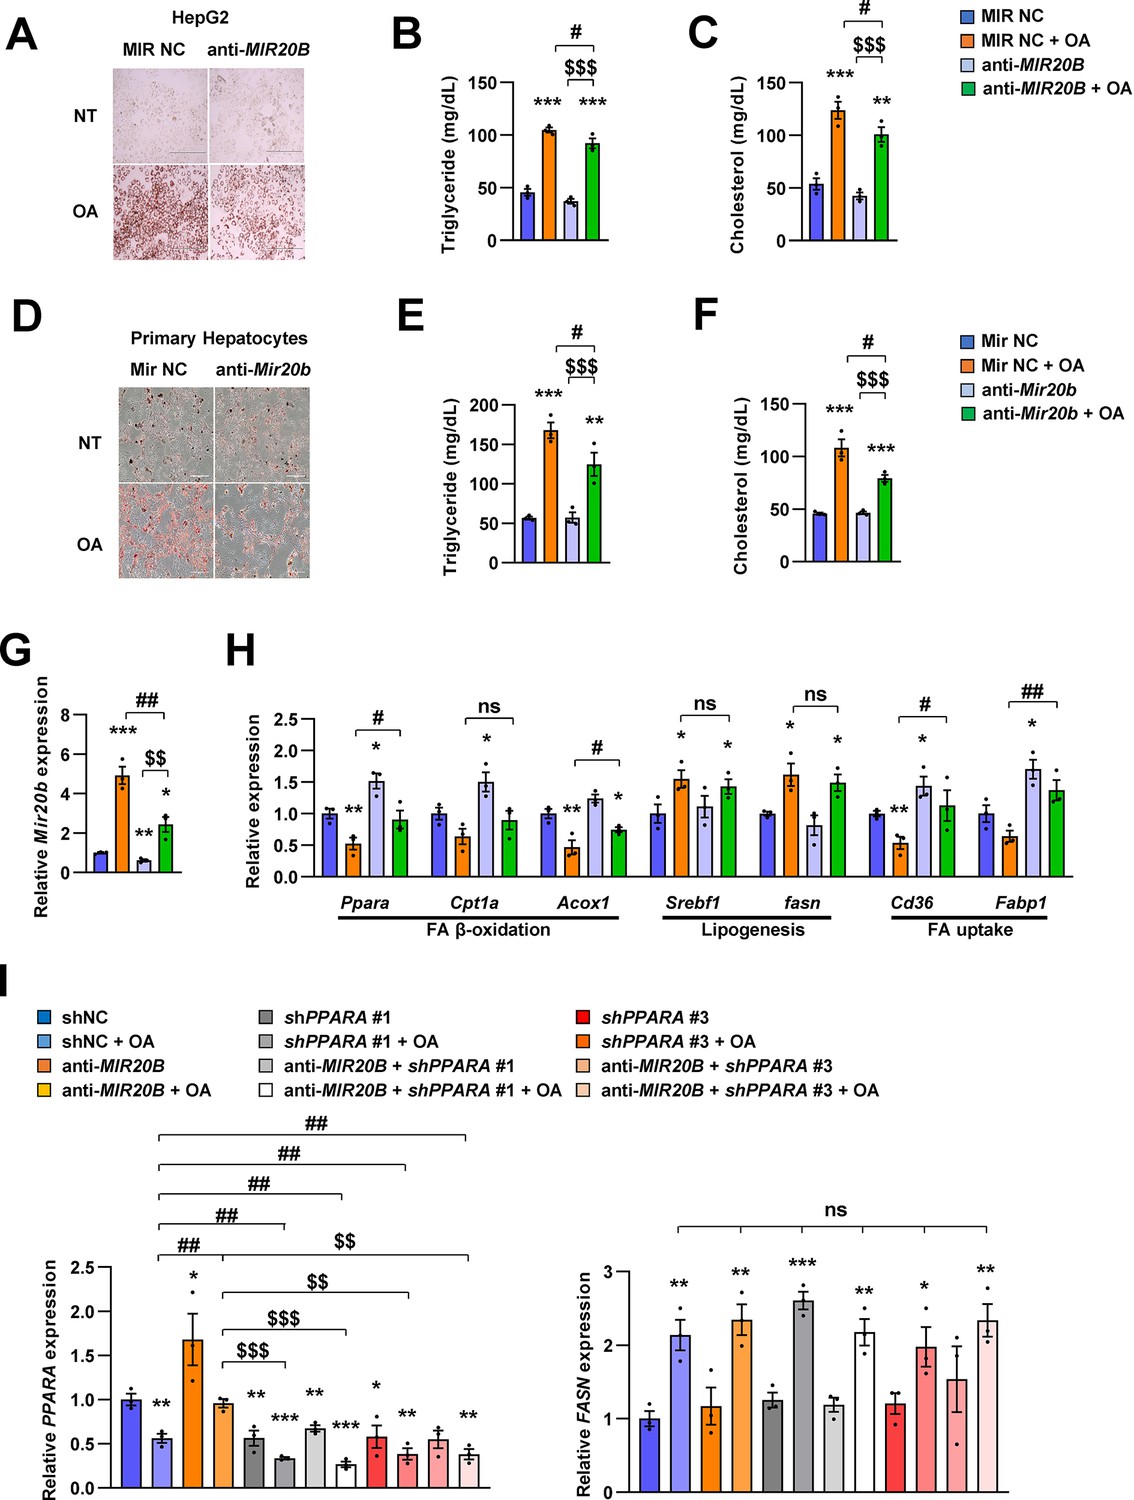
Inhibition of MIR20B alleviates lipid accumulation in HepG2 cells.
HepG2 cells and primary hepatocytes were transfected with MIR NC or anti-MIR20B, subsequently treated with OA (1 mM). Representative Oil Red O staining revealed intracellular lipid accumulation (A, D). The level of triglyceride (B, E) and cholesterol (C, F) were analyzed. The expression of MIR20B (G) and genes related to FA β-oxidation, lipogenesis and FA uptake (H) were measured by quantitative RT-PCR. HepG2 cells were infected with lentivirus containing shRNA non-targeting control (shNC) or shRNA targeting PPARA (shPPARA) and transfected with either MIR NC or anti-MIR20B, subsequently treated with OA (1 mM). Expression of PPARA and FASN was measured by quantitative RT-PCR (I). Values represent means ± SEM (n = 3). ns, not significant. *p < 0.05, **p < 0.01, ***p < 0.001 vs MIR NC. #p < 0.05, ##p < 0.01 vs MIR NC+ OA. $$p < 0.01, $$$p < 0.001 vs anti-MIR20B or anti-MIR20B + OA, respectively. Raw data can be found in a Source Data file named ‘Figure 4—figure supplement 4—source data 1’.
-
Figure 4—figure supplement 4—source data 1
Inhibition of MIR20B alleviates lipid accumulation in HepG2 cells.
- https://cdn.elifesciences.org/articles/70472/elife-70472-fig4-figsupp4-data1-v2.xlsx
Figure 4—figure supplement 5
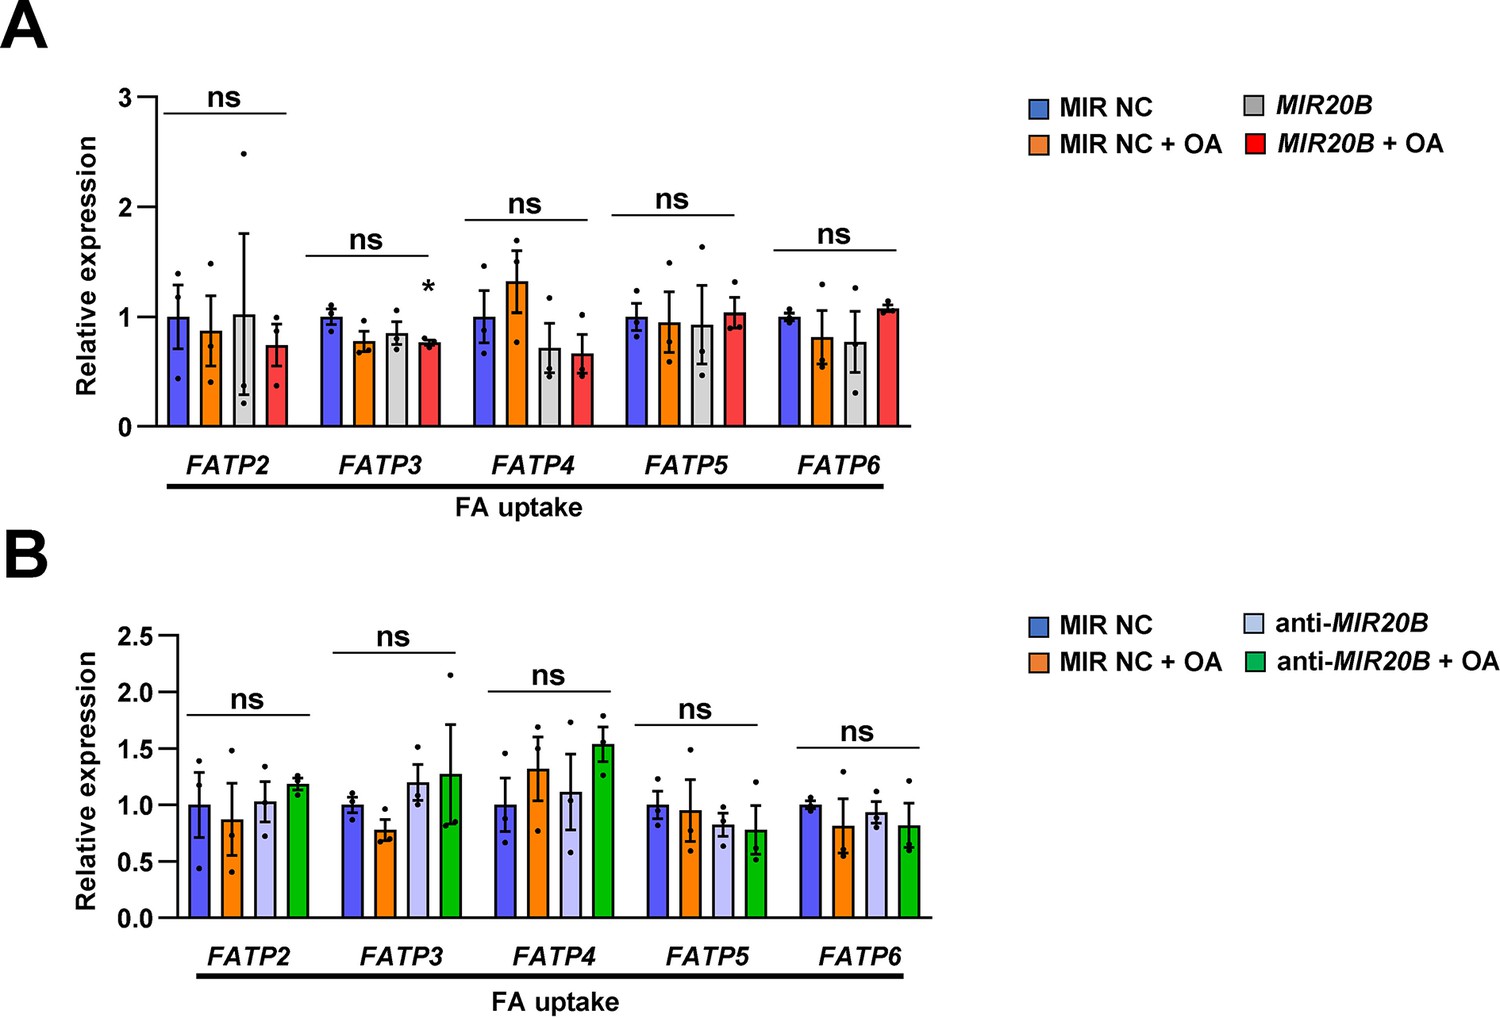
The expression of genes associated with FA uptake by MIR20B in HepG2 cells.
HepG2 cells were transfected with MIR20B (A) or anti-MIR20B (B), subsequently treated with OA (1 mM) for 24 hr. The expression of genes related to FA uptake were measured by quantitative RT-PCR. Relative values are normalized to MIR NC. Values represent means ± SEM (n = 3). ns, not significant. Raw data can be found in a Source Data file named ‘Figure 4—figure supplement 5—source data 1’.
-
Figure 4—figure supplement 5—source data 1
The expression of genes associated with FA uptake by MIR20B in HepG2 cells.
- https://cdn.elifesciences.org/articles/70472/elife-70472-fig4-figsupp5-data1-v2.xlsx
Figure 4—figure supplement 6
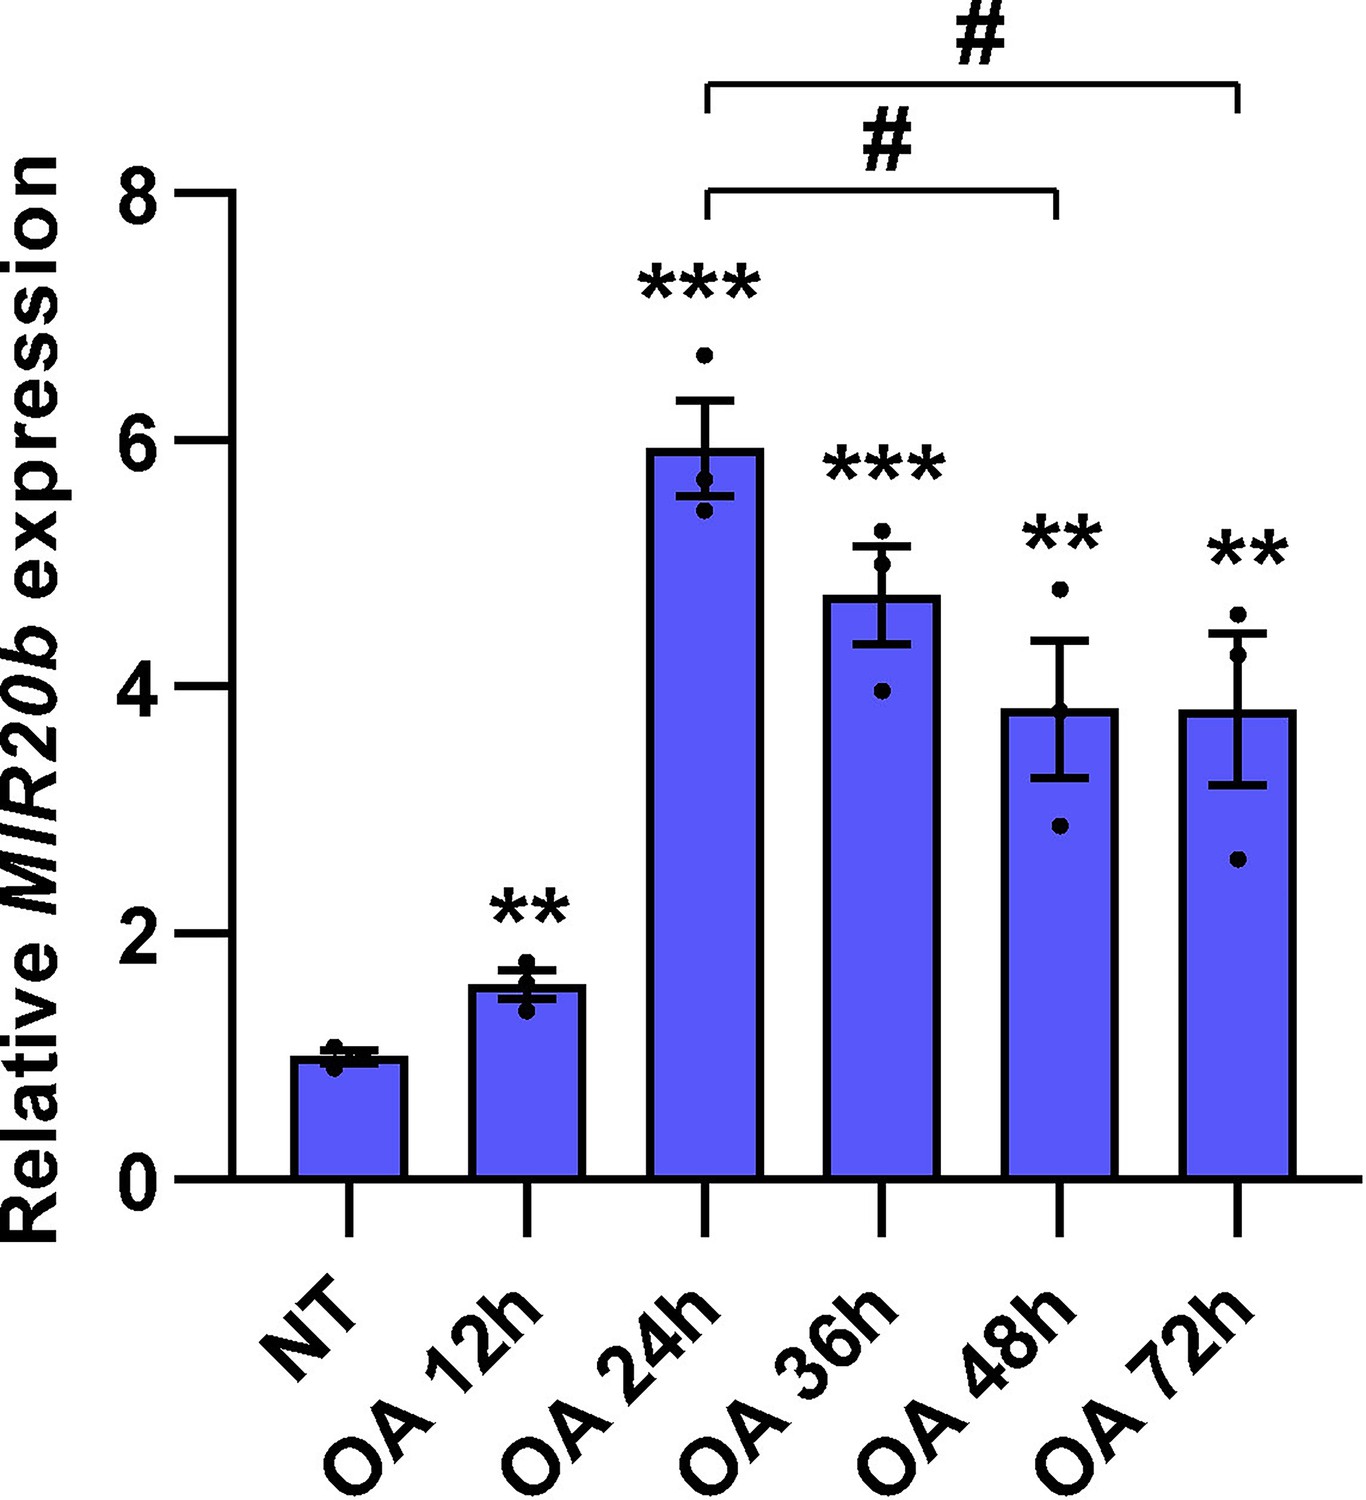
The expression of MIR20B by OA in HepG2 cells.
HepG2 cells were incubated with OA (1 mM) for indicated time. The expression of MIR20B was measured by quantitative RT-PCR. Relative values are normalized to NT. Values represent means ± SEM (n = 3). **p < 0.01, ***p < 0.001 vs NT. #p < 0.05 vs OA 24 hr. Raw data can be found in a Source Data file named ‘Figure 4—figure supplement 6—source data 1’.
-
Figure 4—figure supplement 6—source data 1
The expression of MIR20B by OA in HepG2 cells.
- https://cdn.elifesciences.org/articles/70472/elife-70472-fig4-figsupp6-data1-v2.xlsx
Figure 5 with 4 supplements
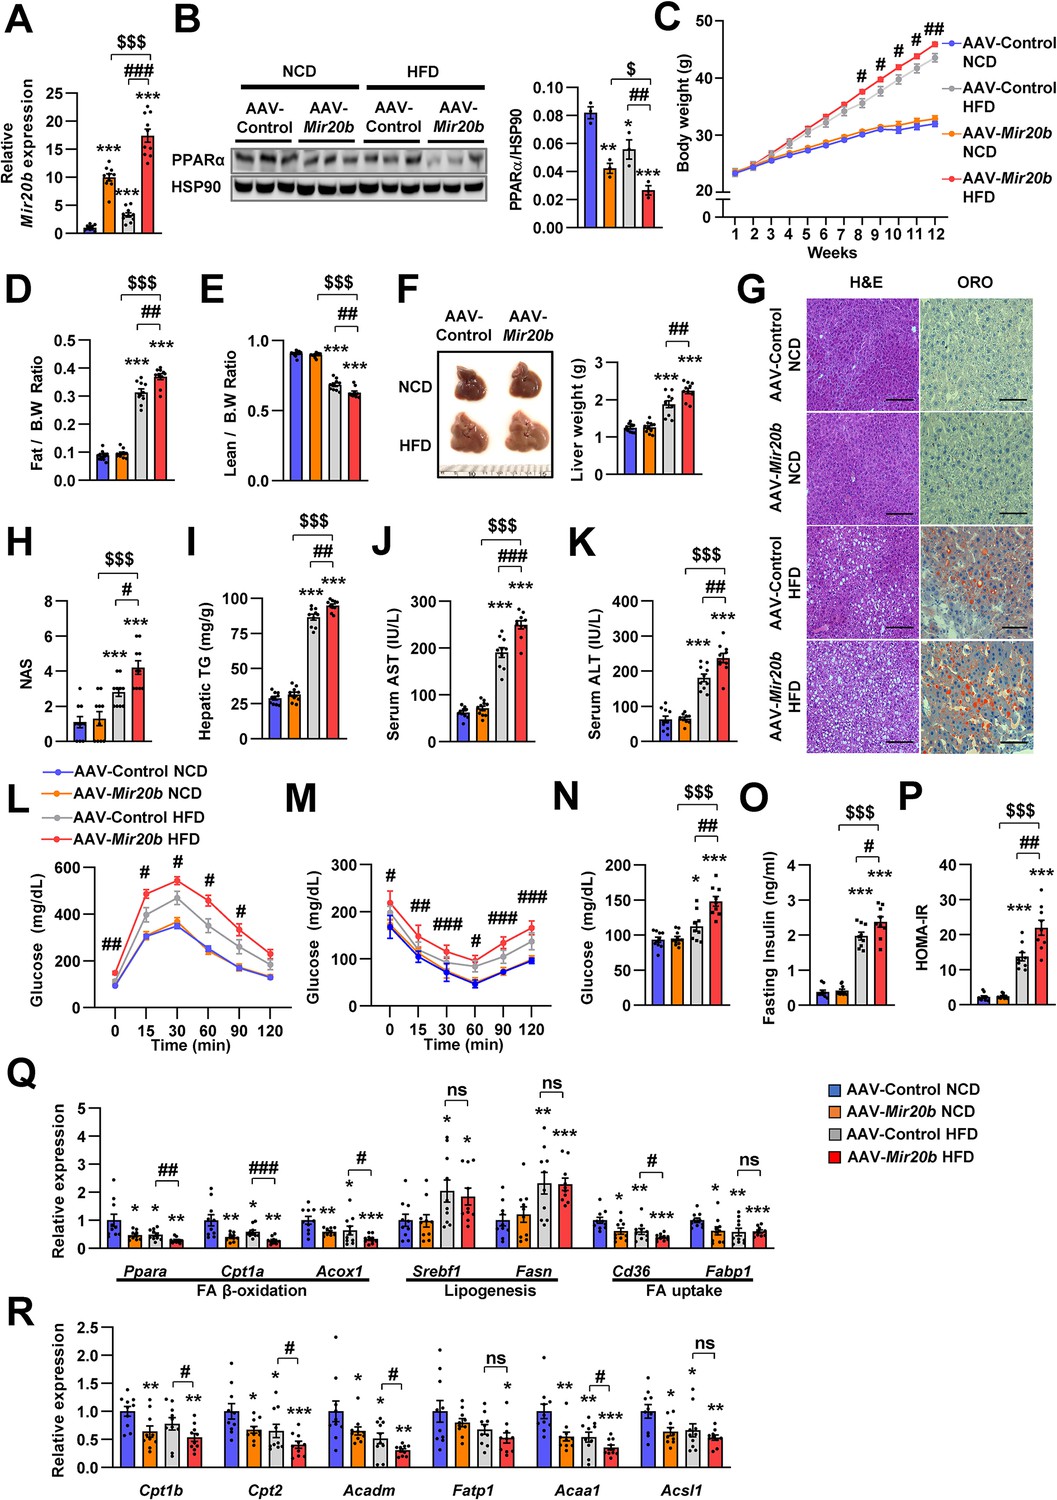
Mir20b promotes hepatic steatosis in HFD-fed mice.
C57BL/6 J mice were fed on normal chow diet (NCD, n = 10 per group) or high fat diet (HFD, n = 10 per group) for 12 weeks and administered with indicated AAVs. Hepatic expression of Mir20b (A) and PPARα (B), body weight (C), the ratio of fat mass to body weight (D), the ratio of lean mass to body weight (E), representative images and weight of liver (F), representative images of H&E staining and Oil Red O staining of liver slides (G), NAFLD activity score (NAS) (H), hepatic TG (I), serum AST (J), serum ALT (K), glucose tolerance (L), insulin tolerance (M), fasting glucose (N), fasting insulin (O), and HOMA-IR (P) were analyzed in indicated mice. Genes related to FA β-oxidation, lipogenesis and FA uptake (Q) and PPARα target genes (R) were determined by quantitative RT-PCR. Relative values are normalized to AAV-Control NCD. The intensity of PPARα blot was normalized to that of HSP90. Values represent means ± SEM (n = 10). ns, not significant. *p < 0.05, **p < 0.01, ***p < 0.001 vs AAV-Control NCD. #p < 0.05, ##p < 0.01, ###p < 0.001 vs AAV-Control HFD. $p < 0.05, $$$p < 0.001 vs AAV-Mir20b NCD. Scale bar is 100 µm. Raw data can be found in a Source Data file named ‘Figure 5—source data 1’.
-
Figure 5—source data 1
Mir20b promotes hepatic steatosis in HFD-fed mice.
- https://cdn.elifesciences.org/articles/70472/elife-70472-fig5-data1-v2.xlsx
Figure 5—figure supplement 1

The expression of Mir20b in adipose tissues of AAV injected mice.
C57BL/6 J mice were fed on normal chow diet (NCD, n = 10 per group) or high-fat diet (HFD, n = 10 per group) for 12 weeks and administered with indicated AAVs. All tissues were harvested at the same time. Quantitative RT-PCR analysis of Mir20b expression in epididymal white adipose tissue (A), inguinal white adipose tissue (B), brown adipose tissue (C) in AAV-Control or AAV-Mir20b injected mice. Values represent means ± SEM (n = 10). ns, not significant. *p < 0.05 vs AAV-Control NCD. Raw data can be found in a Source Data file named ‘Figure 5—figure supplement 1—source data 1’.
-
Figure 5—figure supplement 1—source data 1
The expression of Mir20b in adipose tissues of AAV injected mice.
- https://cdn.elifesciences.org/articles/70472/elife-70472-fig5-figsupp1-data1-v2.xlsx
Figure 5—figure supplement 2

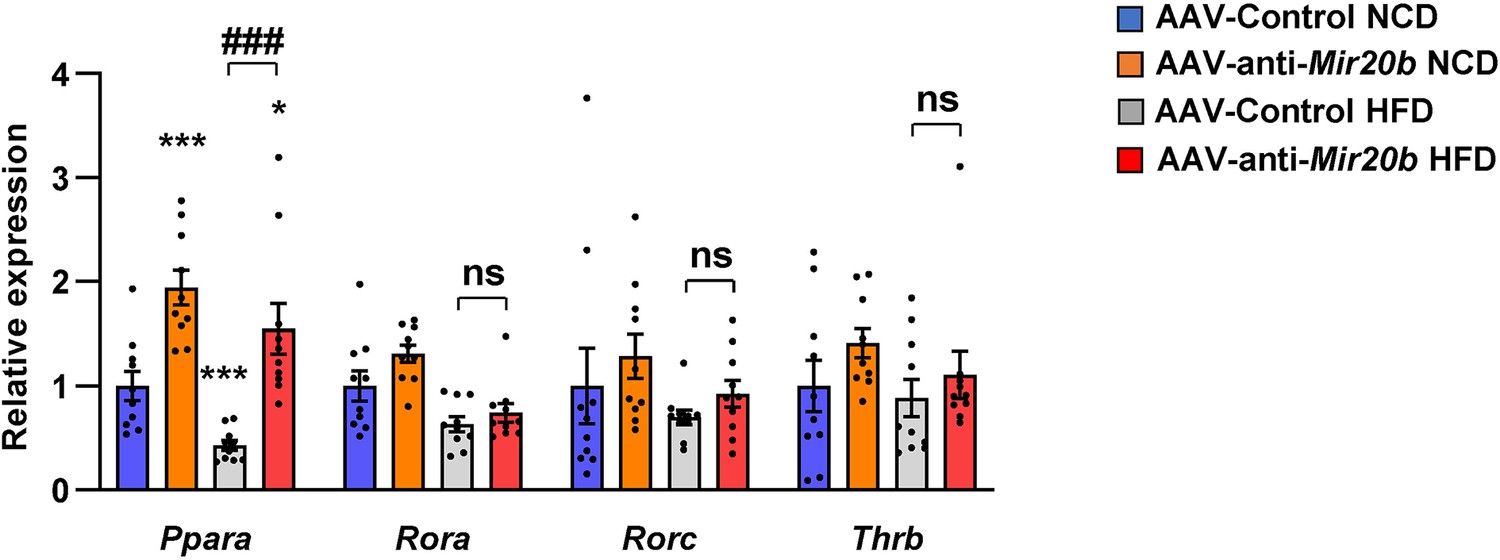
Mir20b significantly regulates Ppara in HFD-fed mice.
C57BL/6 J mice were fed on normal chow diet (NCD, n = 10 per group) or high fat diet (HFD, n = 10 per group) for 12 weeks and administered with indicated AAVs. The expression of nuclear receptors, Mir20b target candidates from regulatory network analysis and RNA-seq, was measured by quantitative RT-PCR in liver of AAV-Control or AAV-Mir20b injected mice. Values represent means ± SEM (n = 10). ns, not significant. *p < 0.05, **p < 0.01 vs AAV-Control NCD. ##p < 0.01 vs AAV-Control HFD. Raw data can be found in a Source Data file named ‘Figure 5—figure supplement 2—source data 1’.
-
Figure 5—figure supplement 2—source data 1
Mir20b significantly regulates Ppara in HFD-fed mice.
- https://cdn.elifesciences.org/articles/70472/elife-70472-fig5-figsupp2-data1-v2.xlsx
Figure 5—figure supplement 3

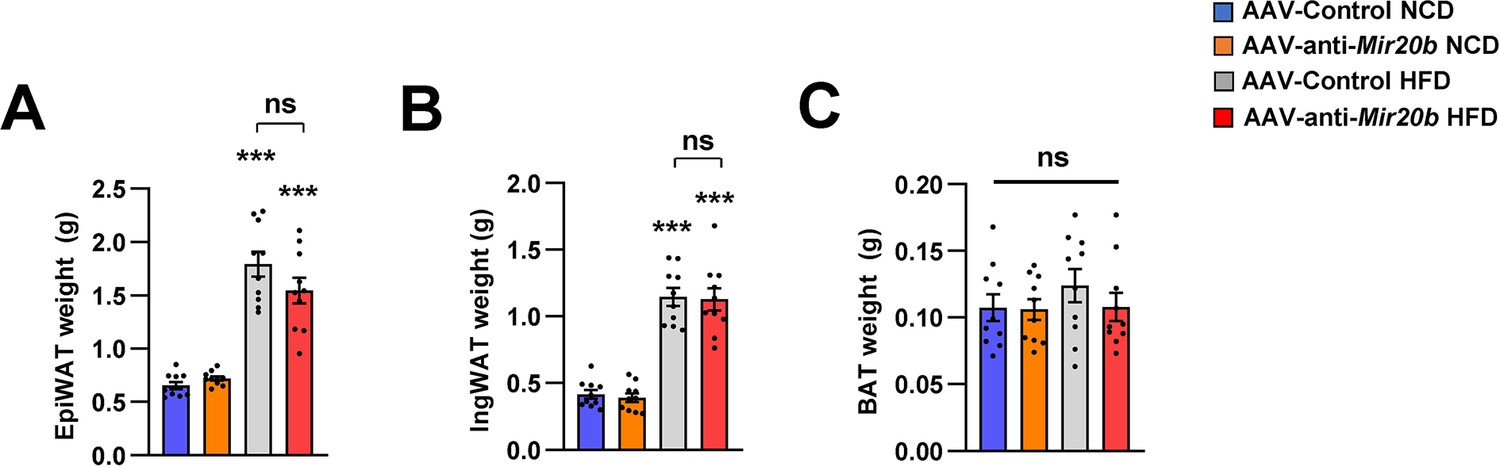
The weight of adipose tissues of AAV injected mice.
C57BL/6 J mice were fed on normal chow diet (NCD, n = 10 per group) or high-fat diet (HFD, n = 10 per group) for 12 weeks and administered with indicated AAVs. All tissues were harvested at the same time. Wet weight of epididymal white adipose tissue (A), inguinal white adipose tissue (B), and brown adipose tissue (C) in AAV-Control or AAV-Mir20b injected mice. Values represent means ± SEM (n = 10). ns, not significant. ***p < 0.01 vs AAV-Control NCD. #p < 0.05 vs AAV-Control HFD. Raw data can be found in a Source Data file named ‘Figure 5—figure supplement 3—source data 1’.
-
Figure 5—figure supplement 3—source data 1
The weight of adipose tissues of AAV injected mice.
- https://cdn.elifesciences.org/articles/70472/elife-70472-fig5-figsupp3-data1-v2.xlsx
Figure 5—figure supplement 4

The expression of genes involved in lipolysis in adipose tissue and serum FFA in AAV injected mice.
C57BL/6 J mice were fed on normal chow diet (NCD, n = 10 per group) or high fat diet (HFD, n = 10 per group) for 12 weeks and administered with indicated AAVs. The expression of genes involved in lipolysis was analyzed by quantitative RT-PCR in epididymal white adipose tissue of AAV-Control or AAV-Mir20b injected mice (A). Serum FFA (B) was also examined. Relative values are normalized to AAV-Control. Values represent means ± SEM (n = 10). ns, not significant. **p < 0.01, ***p < 0.001 vs AAV-Control NCD. Raw data can be found in a Source Data file named ‘Figure 5—figure supplement 4—source data 1’.
-
Figure 5—figure supplement 4—source data 1
The expression of genes involved in lipolysis in adipose tissue and serum FFA in AAV injected mice.
- https://cdn.elifesciences.org/articles/70472/elife-70472-fig5-figsupp4-data1-v2.xlsx
Figure 6 with 4 supplements
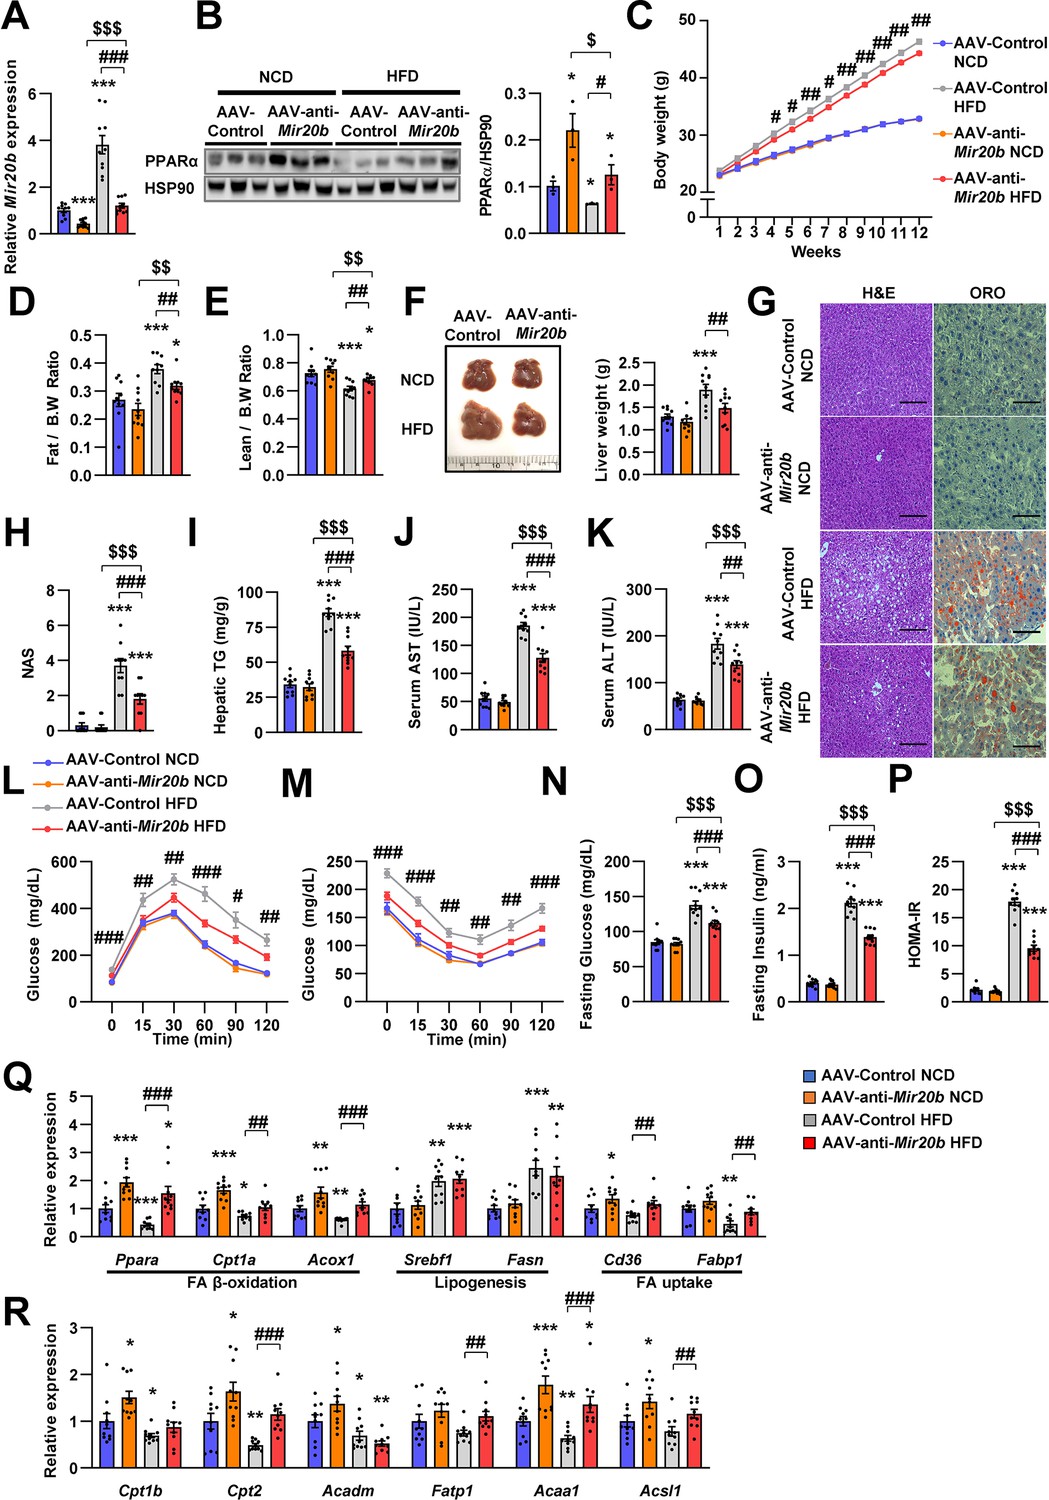
Inhibition of Mir20b alleviates hepatic steatosis in HFD-fed mice.
C57BL/6 J mice were fed on normal chow diet (NCD, n = 10 per group) or high fat diet (HFD, n = 10 per group) for 12 weeks and administered with indicated AAVs. Hepatic expression of Mir20b (A) and PPARα (B) and body weight (C), the ratio of fat mass to body weight (D), the ratio of lean mass to body weight (D), representative images and weight of liver (F), representative images of H&E staining and Oil Red O staining of liver slides (G), NAFLD activity score (NAS) (H), hepatic TG (I), serum AST (J), and serum ALT (K), glucose tolerance (L), insulin tolerance (M), fasting glucose (N), fasting insulin (O), and HOMA-IR (P) were analyzed in indicated mice. Genes related to FA β-oxidation, lipogenesis and FA uptake (Q) and PPARα target genes (R) were determined by quantitative RT-PCR. Relative values are normalized to AAV-Control NCD. The intensity of PPARα blot was normalized to that of HSP90. Values represent means ± SEM (n = 10). *p < 0.05, **p < 0.01, ***p < 0.001 vs AAV-Control NCD. #p < 0.05, ##p < 0.01, ###p < 0.001 vs AAV-Control HFD. $p < 0.05, $$p < 0.01, $$$p < 0.001 vs AAV-anti-Mir20b NCD. Scale bar is 100 µm. Raw data can be found in a Source Data file named ‘Figure 6—source data 1’.
-
Figure 6—source data 1
Inhibition of Mir20b alleviates hepatic steatosis in HFD-fed mice.
- https://cdn.elifesciences.org/articles/70472/elife-70472-fig6-data1-v2.xlsx
Figure 6—figure supplement 1
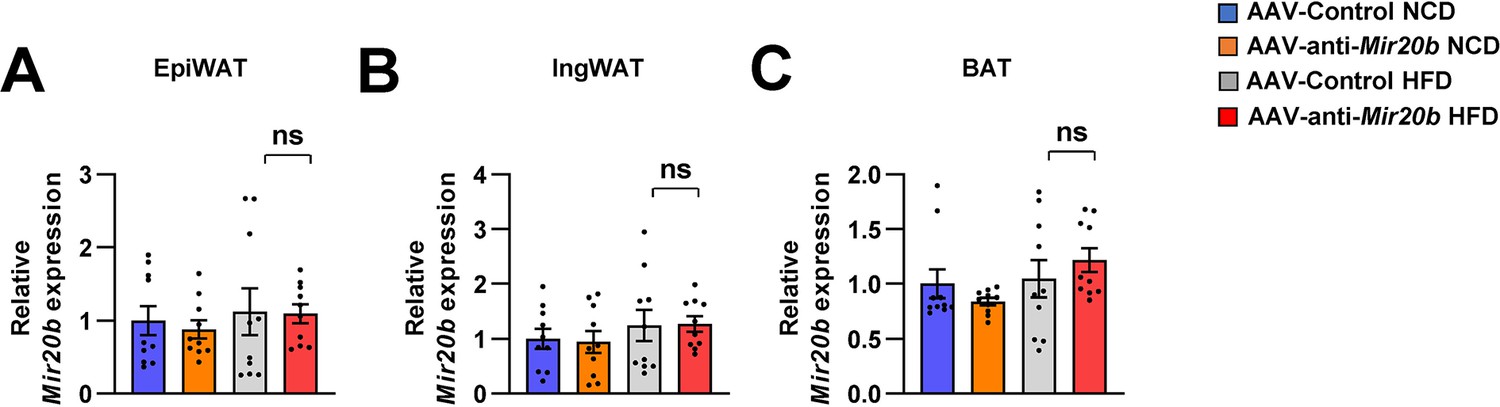
The expression of Mir20b in adipose tissues of AAV injected mice.
C57BL/6 J mice were fed on normal chow diet (NCD, n = 10 per group) or high-fat diet (HFD, n = 10 per group) for 12 weeks and administered with indicated AAVs. All tissues were harvested at the same time. Quantitative RT-PCR analysis of Mir20b expression in epididymal white adipose tissue (A), inguinal white adipose tissue (B), brown adipose tissue (C) in AAV-Control or AAV-anti-Mir20b injected mice. Relative values are normalized to AAV-Control. Values represent means ± SEM (n = 10). ns, not significant. Raw data can be found in a Source Data file named ‘Figure 6—figure supplement 1—source data 1’.
-
Figure 6—figure supplement 1—source data 1
The expression of Mir20b in adipose tissues of AAV injected mice.
- https://cdn.elifesciences.org/articles/70472/elife-70472-fig6-figsupp1-data1-v2.xlsx
Figure 6—figure supplement 2
Inhibition of Mir20b significantly increases hepatic Ppara in HFD-fed mice.
C57BL/6 J mice were fed on normal chow diet (NCD, n = 10 per group) or high-fat diet (HFD, n = 10 per group) for 12 weeks and administered with indicated AAVs. The expression of nuclear receptors, MIR20B target candidates from regulatory network analysis and RNA-seq, was measured by quantitative RT-PCR in liver of AAV-Control or AAV-anti-MIR20B injected mice. Values represent means ± SEM (n = 10). ns, not significant. *p < 0.05, ***p < 0.001 vs AAV-Control NCD. ###p < 0.001 vs AAV-Control HFD. Raw data can be found in a Source Data file named ‘Figure 6—figure supplement 2—source data 1’.
-
Figure 6—figure supplement 2—source data 1
Inhibition of Mir20b significantly increases hepatic Ppara in HFD-fed mice.
- https://cdn.elifesciences.org/articles/70472/elife-70472-fig6-figsupp2-data1-v2.xlsx
Figure 6—figure supplement 3
The weight of adipose tissues of AAV injected mice.
C57BL/6 J mice were fed on normal chow diet (NCD, n = 10 per group) or high fat diet (HFD, n = 10 per group) for 12 weeks and administered with indicated AAVs. All tissues were harvested at the same time. Wet weight of epididymal white adipose tissue (A), inguinal white adipose tissue (B), and brown adipose tissue (C) in AAV-Control or AAV-anti-Mir20b injected mice. Values represent means ± SEM (n = 10). ns, not significant. ***p < 0.01 vs AAV-Control NCD. Raw data can be found in a Source Data file named ‘Figure 6—figure supplement 3—source data 1.
-
Figure 6—figure supplement 3—source data 1
The weight of adipose tissues of AAV injected mice.
- https://cdn.elifesciences.org/articles/70472/elife-70472-fig6-figsupp3-data1-v2.xlsx
Figure 6—figure supplement 4

The expression of genes involved in lipolysis in adipose tissue and serum FFA in AAV injected mice.
C57BL/6 J mice were fed on normal chow diet (NCD, n = 10 per group) or high fat diet (HFD, n = 10 per group) for 12 weeks and administered with indicated AAVs. The expression of genes involved in lipolysis was analyzed by quantitative RT-PCR in epididymal white adipose tissue of AAV-Control or AAV-anti-Mir20b injected mice (A). Serum FFA (B) was also examined. Relative values are normalized to AAV-Control. Values represent means ± SEM (n = 10). ns, not significant. ***p < 0.001 vs AAV-Control NCD. Raw data can be found in a Source Data file named ‘Figure 6—figure supplement 4—source data 1’.
-
Figure 6—figure supplement 4—source data 1
The expression of genes involved in lipolysis in adipose tissue and serum FFA in AAV injected mice.
- https://cdn.elifesciences.org/articles/70472/elife-70472-fig6-figsupp4-data1-v2.xlsx
Figure 7
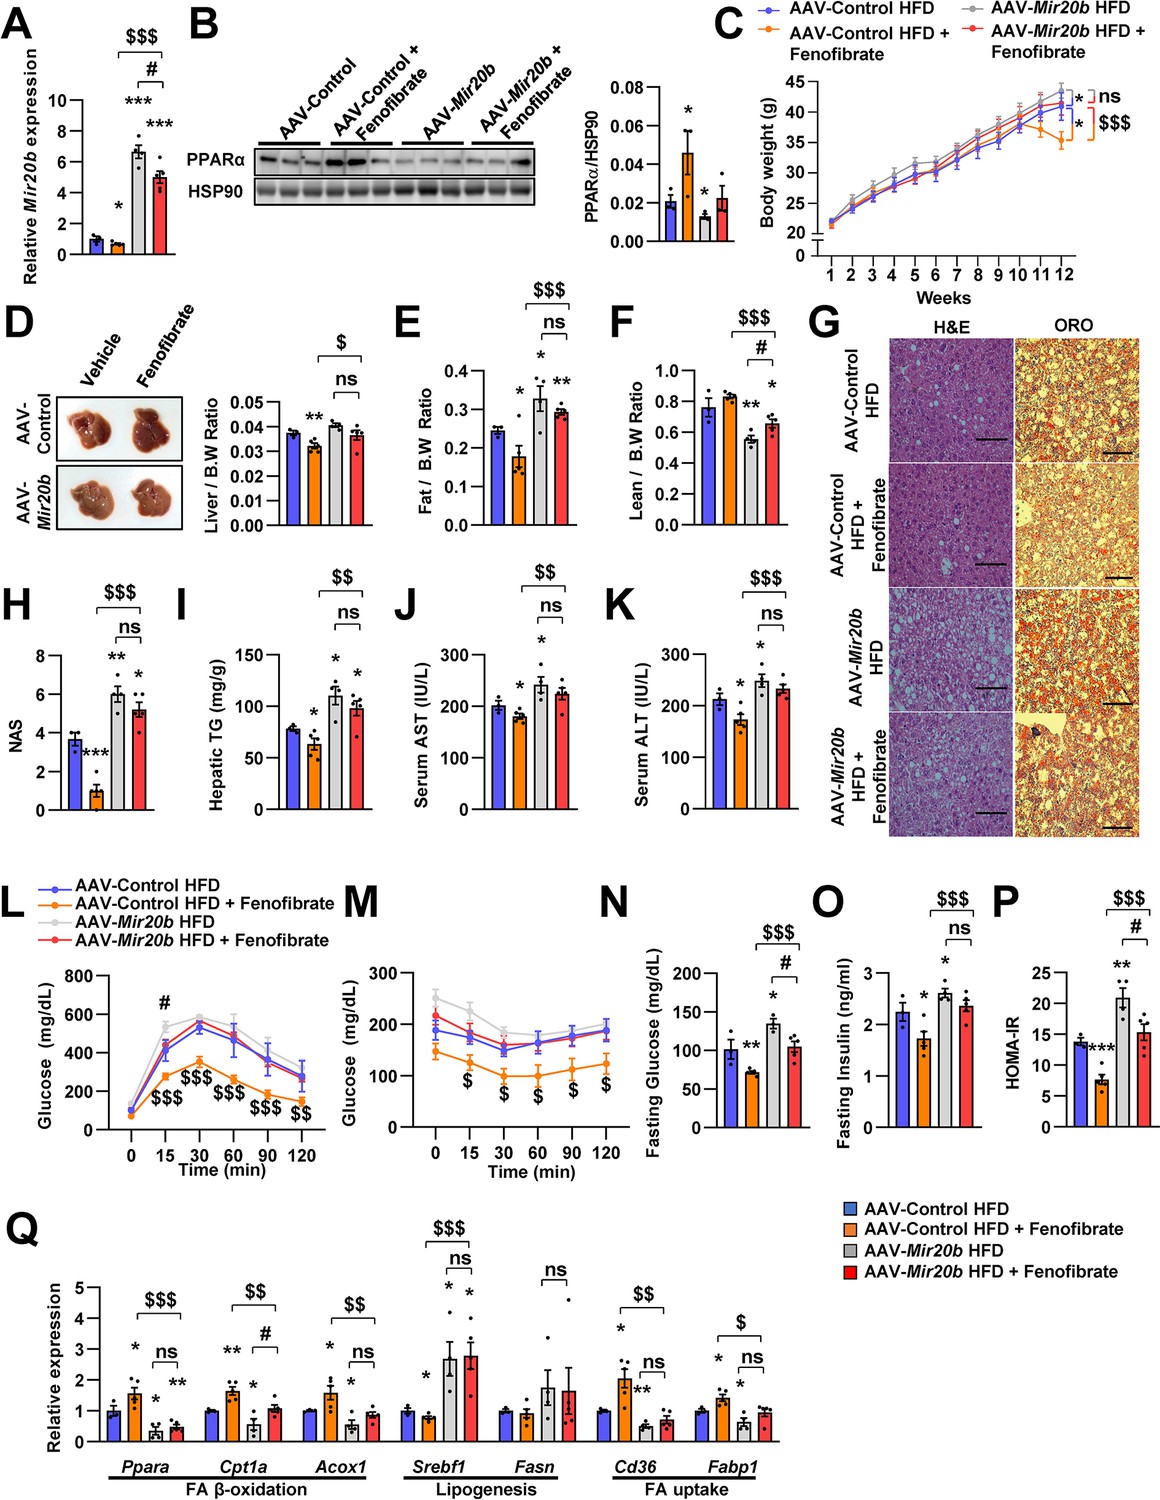
The effects of fenofibrate are limited in Mir20b-introduced mice.
C57BL/6 J mice were fed on high fat diet (HFD) for 12 weeks and administered with indicated AAVs (n = 3–5 per group). Then, mice injected with vehicle or fenofibrate (100 mg/kg) for 4 weeks. Hepatic Mir20b (A) and PPARα expression (B), body weight (C), representative images and weight of liver (D), the ratio of fat mass to body weight (E), the ratio of lean mass to body weight (F), representative images of H&E staining and Oil Red O staining of liver slides (G), NAFLD activity score (NAS) (H), hepatic TG (I), serum AST (J), and serum ALT (K), glucose tolerance (L), insulin tolerance (M), fasting glucose (N), fasting insulin (O), and HOMA-IR (P) were analyzed in indicated mice. Genes related to FA β-oxidation, lipogenesis and FA uptake were determined by quantitative RT-PCR (Q). Relative values are normalized to AAV-Control HFD. The intensity of PPARα blot was normalized to that of HSP90. The intensity of PPARα blot was normalized to that of HSP90. Values represent means ± SEM (n = 3–5). ns, not significant, *p < 0.05, **p < 0.01, ***p < 0.001 vs AAV-Control HFD. #p < 0.05 vs AAV-Mir20b HFD. $p < 0.05, $$p < 0.01, $$$p < 0.001 vs AAV-Control HFD+ fenofibrate. Scale bar is 100 µm. Raw data can be found in a Source Data file named ‘Figure 7—source data 1’.
-
Figure 7—source data 1
The effects of fenofibrate are limited in Mir20b-introduced mice.
- https://cdn.elifesciences.org/articles/70472/elife-70472-fig7-data1-v2.xlsx
Figure 8
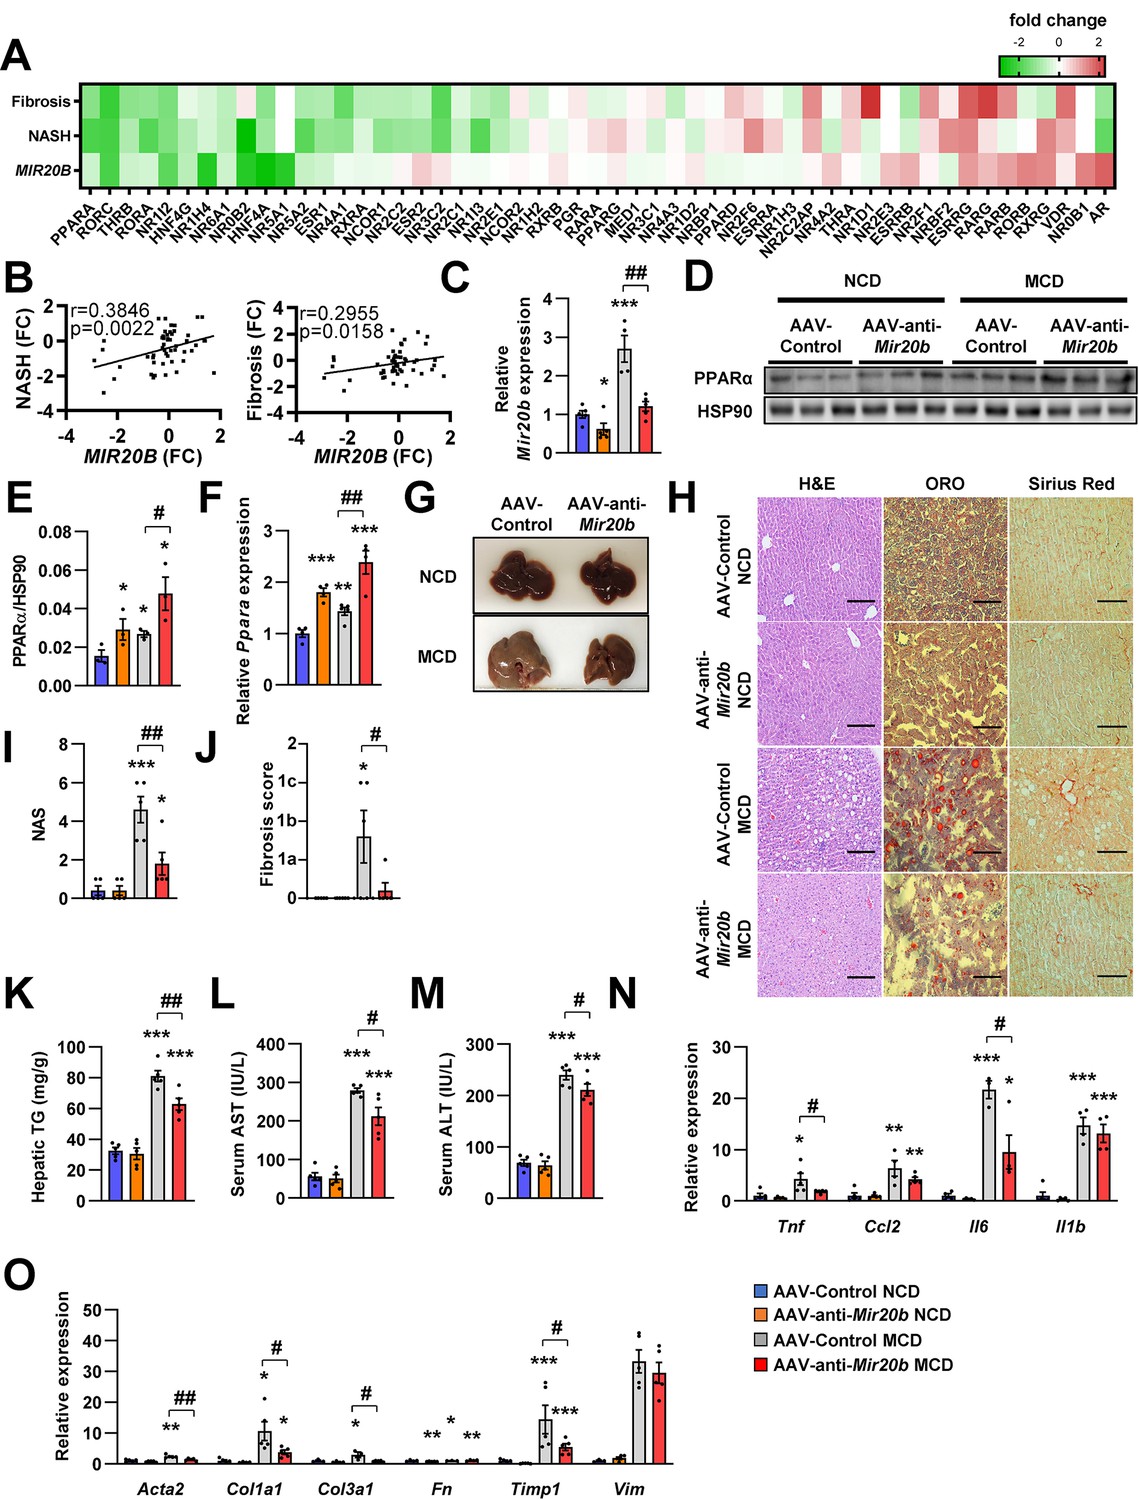
Mir20b promotes liver inflammation and fibrosis in MCD-fed mice.
Heatmap (A) and correlation (B) of hepatic nuclear receptor gene expression in RNA-seq (Figure 2) with public databases of liver fibrosis or NASH patients. The values are fold change (FC) compared to each control samples. C57BL/6 J mice were fed on normal chow diet (NCD, n = 5 per group) or methionine-deficient diet (MCD, n = 5 per group) for 4 weeks and administered with indicated AAVs. Before 1 week of MCD challenge, mice were injected with AAV-Control or AAV-anti-Mir20b. Hepatic Mir20b (C) and PPARα expression (D, E, F), representative images of liver (G), H&E staining, Oil Red O, staining and Sirius Red staining of liver slides (H), NAFLD activity score (NAS) (I), fibrosis score (J), hepatic TG (K), serum AST (L), and serum ALT (M) were analyzed in indicated mice. Genes related to inflammation (N) and fibrosis (O) were determined by quantitative RT-PCR. Relative values are normalized to AAV-Control NCD. The intensity of PPARα blot was normalized to that of HSP90. Values represent means ± SEM (n = 5). *p < 0.05, **p < 0.01, ***p < 0.001 vs AAV-Control NCD. #p < 0.05, ##p < 0.01 vs AAV-Control MCD. Scale bar is 100 µm. Raw data can be found in a Source Data file named ‘Figure 8—source data 1’.
-
Figure 8—source data 1
Mir20b promotes liver inflammation and fibrosis in MCD-Fed Mice.
- https://cdn.elifesciences.org/articles/70472/elife-70472-fig8-data1-v2.xlsx
Figure 9
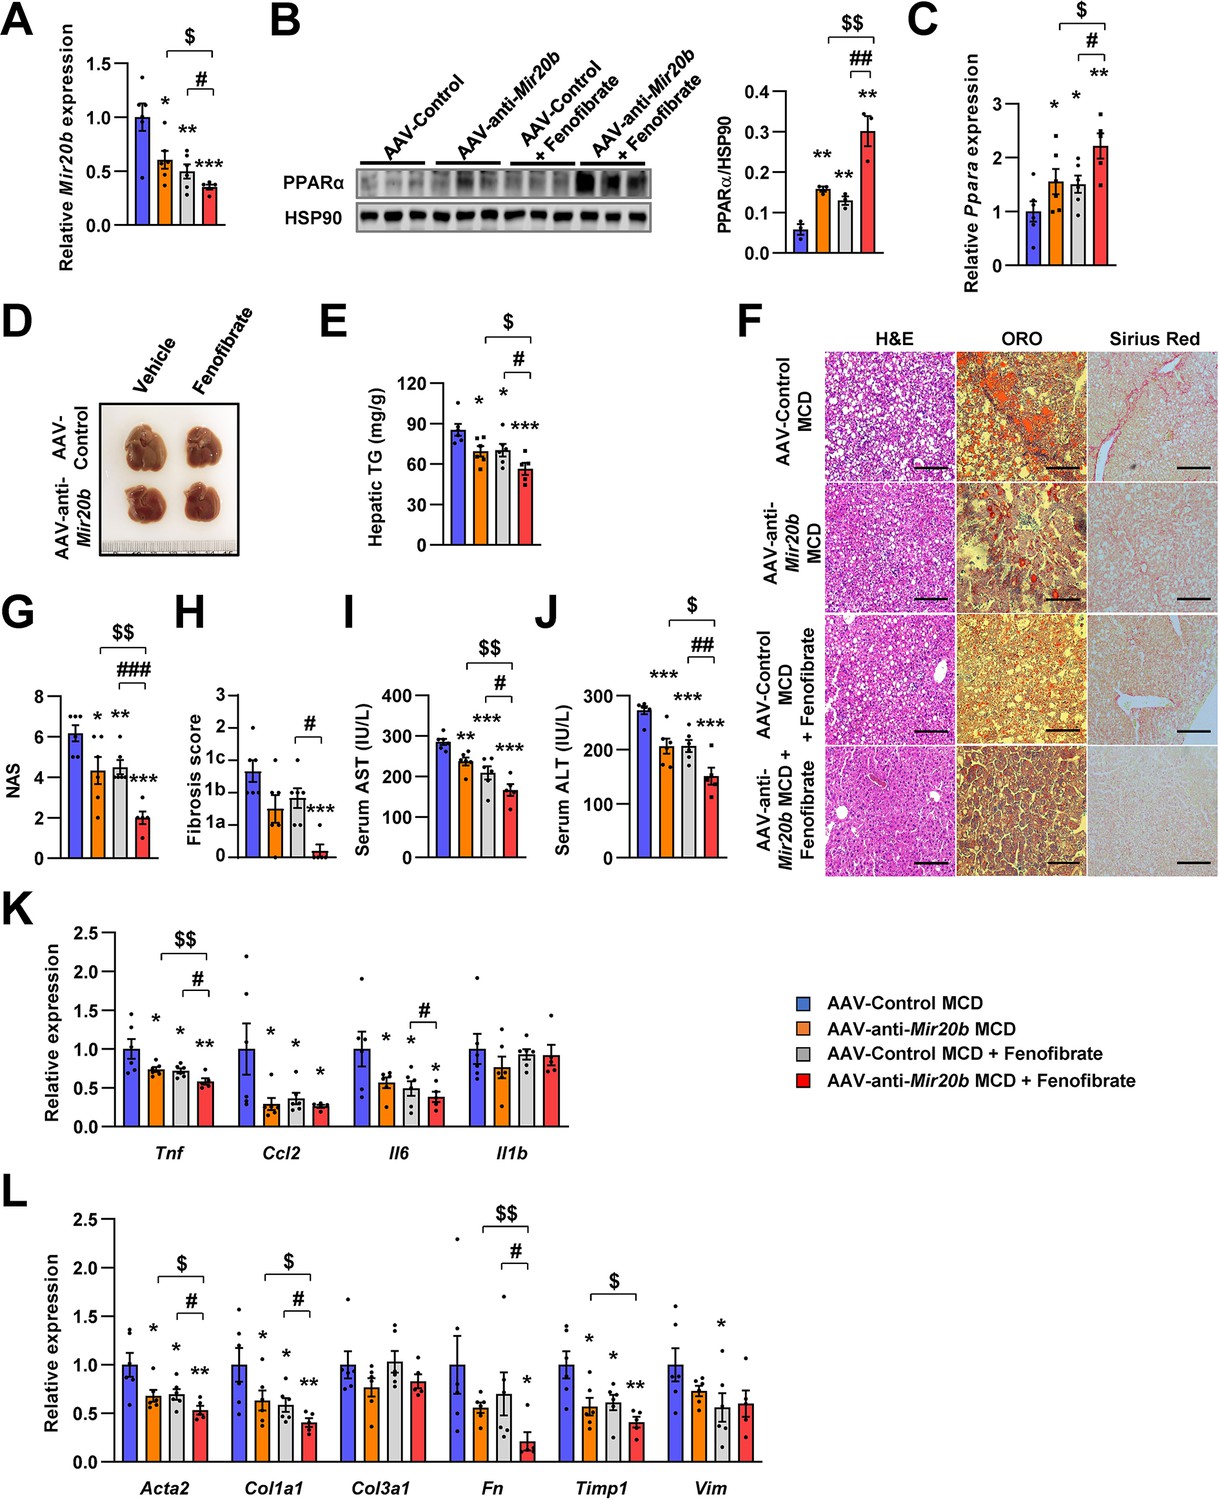
Inhibition of Mir20b with fenofibrate ameliorates liver inflammation and fibrosis in MCD-fed mice.
C57BL/6 J were fed a methionine-deficient diet (MCD) for 4 weeks with administration of indicated AAVs (n = 5–6 per group). Then, mice injected with vehicle or fenofibrate (100 mg/kg) for 4 weeks. Hepatic Mir20b (A) and PPARA expression (B, C). Representative images of liver (D), hepatic TG (E), H&E staining, Oil Red O staining, Sirius Red staining of liver slides (F), NAFLD activity score (NAS) (G), fibrosis score (H), serum AST (I), and serum ALT (J) were analyzed in indicated mice. Genes related to inflammation (K) and fibrosis (L) were determined by quantitative RT-PCR. Relative values are normalized to AAV-Control MCD. The intensity of PPARα blot was normalized to that of HSP90. Values represent means ± SEM (n = 5–6). *p < 0.05, **p < 0.01, ***p < 0.001 vs AAV-Control MCD. #p < 0.05, ##p < 0.01, ###p < 0.001 vs AAV-Control MCD+ fenofibrate. $p < 0.05, $$p < 0.01 vs AAV-anti-Mir20b MCD. Scale bar is 100 µm. Raw data can be found in a Source Data file named ‘Figure 9—source data 1’.
-
Figure 9—source data 1
Inhibition of Mir20b with fenofibrate ameliorates liver inflammation and fibrosis in MCD-fed mice.
- https://cdn.elifesciences.org/articles/70472/elife-70472-fig9-data1-v2.xlsx
Figure 10
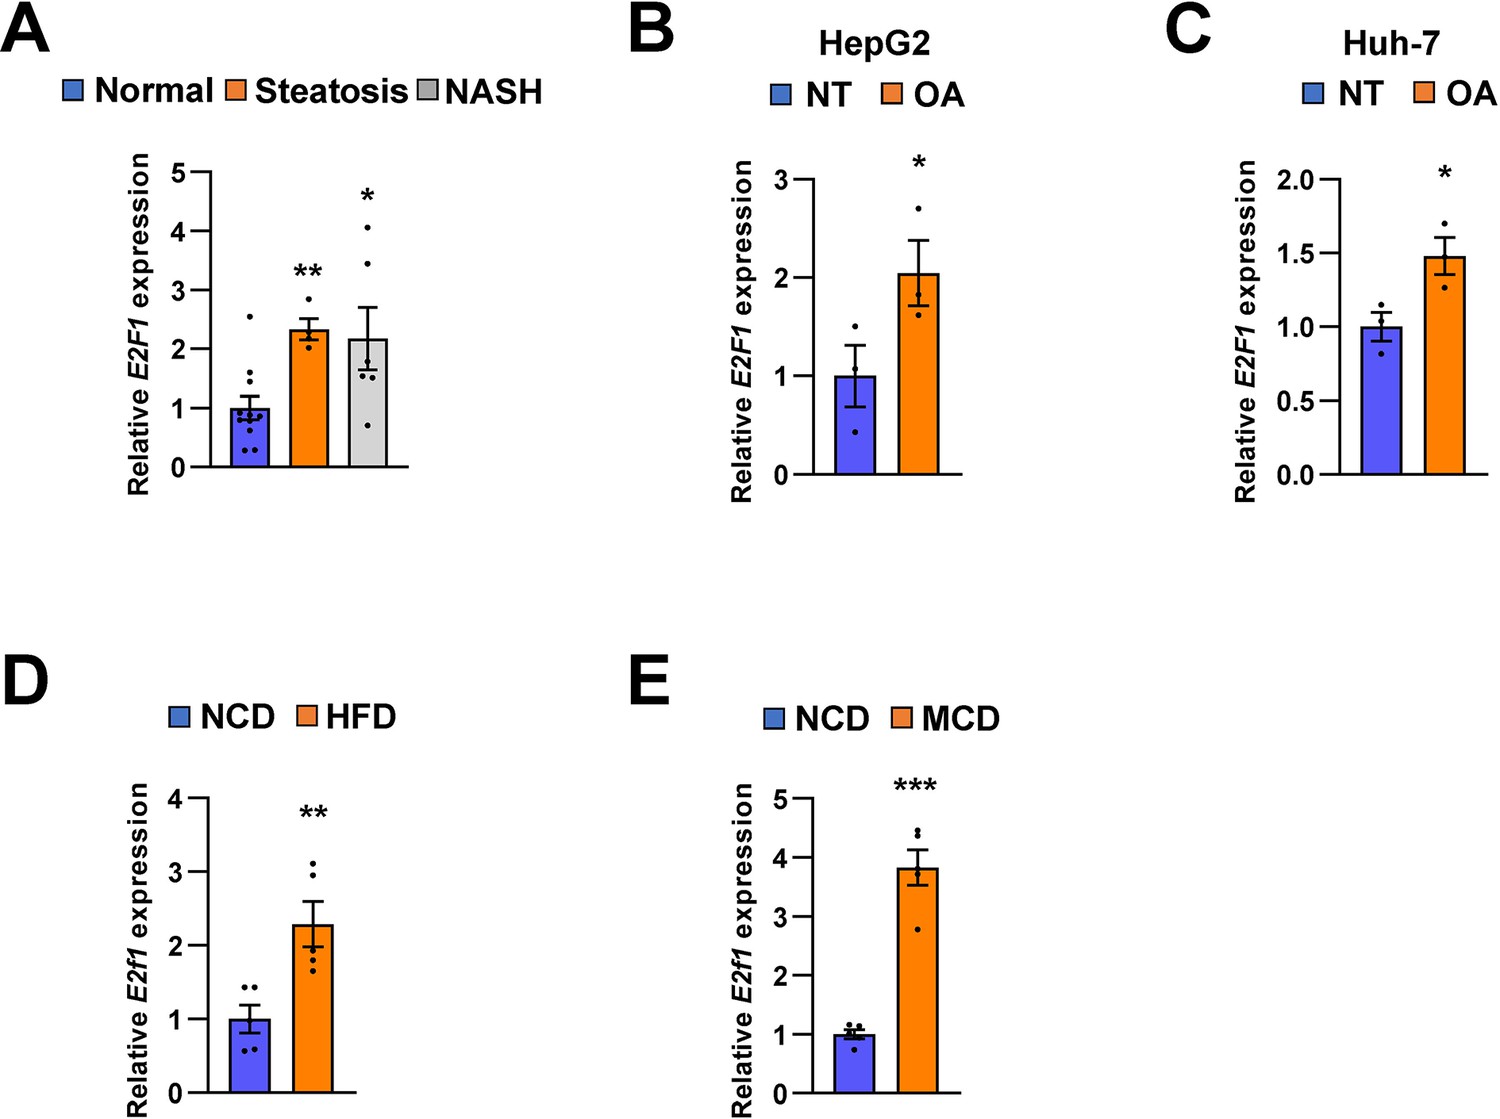
E2F1 is upregulated in both NAFLD patients and mice model.
The expression of E2F1 was analyzed by quantitative RT-PCR. Hepatic E2F1 expression levels of steatosis or NASH patients were normalized to those of normal patients. *p < 0.05 and **p < 0.01 vs normal patients (A). E2F1 expression levels from HepG2 cells (B) and Huh-7 cells (C) treated with OA for 24 hours were normalized to no treatment (NT). Hepatic E2f1 expression levels from C57BL/6 J mice fed a HFD (D) and a MCD (E) were normalized to NCD. Values represent means ± SEM (n = 3–11). *p < 0.05, **p < 0.01, ***p < 0.001 vs NT in cells or NCD-fed mice, respectively. Raw data can be found in a Source Data file named ‘Figure 10—source data 1’.
-
Figure 10—source data 1
E2F1 is upregulated in both NAFLD patients and mice model.
- https://cdn.elifesciences.org/articles/70472/elife-70472-fig10-data1-v2.xlsx
Tables
Key resources table
| Reagent type (species) or resource | Designation | Source or reference | Identifiers | Additional information |
|---|---|---|---|---|
| Genetic reagent(Mus. Musculus) | C57BL/6JbomTac | DBL | RRID:IMSR_TAC:b6jbom | |
| Cell line (Homo sapiens) | HepG2 | ATCC | HB-8065, RRID:CVCL_0027 | |
| Cell line (Homo sapiens) | Huh-7 | Dr. Yoshiharu Matsuura; originally from Japanese Collection of Research Bioresources Cell Bank | JCRB0403, RRID:CVCL_0336 | |
| Antibody | Anti-PPARα(Rabbit Polyclonal) | abcam | Cat# ab24509, RRID:AB_448110 | WB(1:1000) |
| Antibody | Anti-HSP90(Rabbit Polyclonal) | Cell Signaling Technology | Cat# 4,877 S, RRID:AB_2233307 | WB(1:1000) |
| Sequence-based reagent | MIR20B/Mir20b(MIR20B/Mir20b mimic) | GenePharma | N/A | Sequence: CAAAGUGCUCAUAGUGCAGGUAG |
| Sequence-based reagent | anti-MIR20B/Mir20b (MIR20B/Mir20b inhibitor) | GenePharma | N/A | Sequence: CUACCUGCACUAUGAGCACUUUG |
| Sequence-based reagent | PPARA siRNA | GenePharma | N/A | Sequence: CGGCGAGGATAGTTCTGGAAGCTTT |
| Sequence-based reagent | PPARA shRNA | Sigma-Aldrich | N/A | Sequence: GAACAGAAACAAATGCCAGTASequence:GTAGCGTATGGAAATGGGTTT |
| Sequence-based reagent | Primers for qPCR | This paper | N/A | |
| Recombinant DNA reagent | psiCHECK-2- PPARA-WT (plasmid) | This paper | N/A | |
| Recombinant DNA reagent | psiCHECK-2- PPARA-Mut (plasmid) | This paper | N/A | |
| Recombinant DNA reagent | pOTTC385-pAAV CMV-IE IRES EGFP-Mir20b | This paper | N/A | |
| Recombinant DNA reagent | pOTTC385-pAAV CMV-IE IRES EGFP-anti-Mir20b | This paper | N/A | |
| Commercial assay or kit | Dual-Luciferase kit | Promega | Cat# E1910 | |
| Commercial assay or kit | RNeasy mini kit | Qiazen | Cat# 74,004 | |
| Commercial assay or kit | QuickChange II Site-Directed Mutagenesis Kit | Agilent | Cat# 200,521 | |
| Commercial assay or kit | AAVpro Purification Kit | Takara Bio. | Cat# 6,675 | |
| Commercial assay or kit | Triglyceride Colorimetric Assay Kit | Cayman Chemical | Cat# 10010303 | |
| Commercial assay or kit | Alanine Transaminase Colorimetric Activity Assay Kit | Cayman Chemical | Cat# 700,260 | |
| Commercial assay or kit | Aspartate Aminotransferase Colorimetric Activity Assay Kit | Cayman Chemical | Cat# 701,640 | |
| Commercial assay or kit | Mouse Insulin ELISA Kit | Crystal Chem | Cat# 90,080 | |
| Commercial assay or kit | PicoSens Free Fatty Acid Quantification Kit | BioMax | Cat# BM-FFA-100 | |
| Commercial assay or kit | Β-hydroxybutyrate assay Kit | abcam | Cat# ab83390 | |
| Chemical Compound, drug | Oleic acid | Sigma-Aldrich | Cat# O1008 | |
| Chemical Compound, drug | Fenofibrate | Santa Cruz biotechnology | Cat# sc-204751 |
|
Additional files
-
Transparent reporting form
- https://cdn.elifesciences.org/articles/70472/elife-70472-transrepform1-v2.docx
-
Source data 1
Raw western blot data.
- https://cdn.elifesciences.org/articles/70472/elife-70472-supp1-v2.zip
Download links
A two-part list of links to download the article, or parts of the article, in various formats.
Downloads (link to download the article as PDF)
Open citations (links to open the citations from this article in various online reference manager services)
Cite this article (links to download the citations from this article in formats compatible with various reference manager tools)
Hepatic MIR20B promotes nonalcoholic fatty liver disease by suppressing PPARA
eLife 10:e70472.
https://doi.org/10.7554/eLife.70472


