Multi-step recognition of potential 5' splice sites by the Saccharomyces cerevisiae U1 snRNP
- Department of Biochemistry, University of Wisconsin–Madison, United States
- Integrated Program in Biochemistry, University of Wisconsin–Madison, United States
- Department of Chemistry, University of Wisconsin–Madison, United States
- New England Biolabs, United States
Figures
Figure 1 with 4 supplements

Immobilized yeast U1 small nuclear ribonucleoprotein (snRNP) forms reversible short- and long-lived interactions with a 5' splice site (5’ SS) oligo.
(A) Cryo-EM structure of the yeast U1 snRNP obtained as part of the spliceosome A complex (PDB 6G90). U1 proteins are labeled and shown as either cartoons or spacefill (Yhc1 and Luc7). The U1 snRNA backbone is shown as a black ribbon. (B) Expanded view of the region within the dotted box in panel (A) showing the cleft formed by Yhc1 (purple) and Luc7 (red) that binds the U1 SSRS/5’ SS duplex. Nucleotides at the 5’ and 3’ ends of the of the SS and splice site recognition sequence (SSRS) are labeled. (C) Preparation of purified, fluorescently labeled yeast U1 snRNP using SNAP and TAP tags. In single-molecule experiments, U1 snRNP is immobilized to the slide surface and its interactions with Cy3-labeled RNA oligomers are observed using colocalization single-molecule spectroscopy (CoSMoS). The U1 SSRS that binds to the oligo is shown in red. (D) Images showing individual U1 snRNP molecules tethered to the slide surface (left field of view, FOV) and colocalized Cy3-labeled RNA-4+2 molecules (right FOV). Each FOV is ~50 µm in diameter. (E) Representative fluorescence trajectory of changes in Cy3 intensity (green) due to oligo binding to a single immobilized U1 molecule. RNA-binding events appear as spots of fluorescence in the recorded images (see inset). Also shown is the predicted pairing interactions (blue) between the RNA-4+2 oligo and the U1 SSRS. (F) Probability density histogram of dwell times for the RNA-4+2 oligo (N=367) and the fitted parameters of the data to an equation containing two exponential terms; the shaded region represents the uncertainty associated with the parameters. The dwell times are plotted as binned values, with bins values chosen that adequately represent the underlying distribution for visualization. The error bars of each bin are computed as the error or of a binomial distribution. The ordinate values are plotted on a log-scale to highlight the difference in short- and long-lived components (see Methods for more details). (G) Kinetic model with optimized rate constants describing the interaction between U1 snRNP and RNA-4+2. In this scheme, ‘Bound’ and ‘Bound*’ states correspond to the short- and long-lived bound time constants observed in the dwell time analysis, respectively.
-
Figure 1—source data 1
Sequences and predicted thermodynamic stabilities of RNA oligos.
- https://cdn.elifesciences.org/articles/70534/elife-70534-fig1-data1-v2.docx
-
Figure 1—source data 2
Fit parameters for data collected at fivefold increased frame rate.
- https://cdn.elifesciences.org/articles/70534/elife-70534-fig1-data2-v2.docx
-
Figure 1—source data 3
Results from hidden Markov modeling of binding data for RNA-4+2.
- https://cdn.elifesciences.org/articles/70534/elife-70534-fig1-data3-v2.docx
Figure 1—figure supplement 1
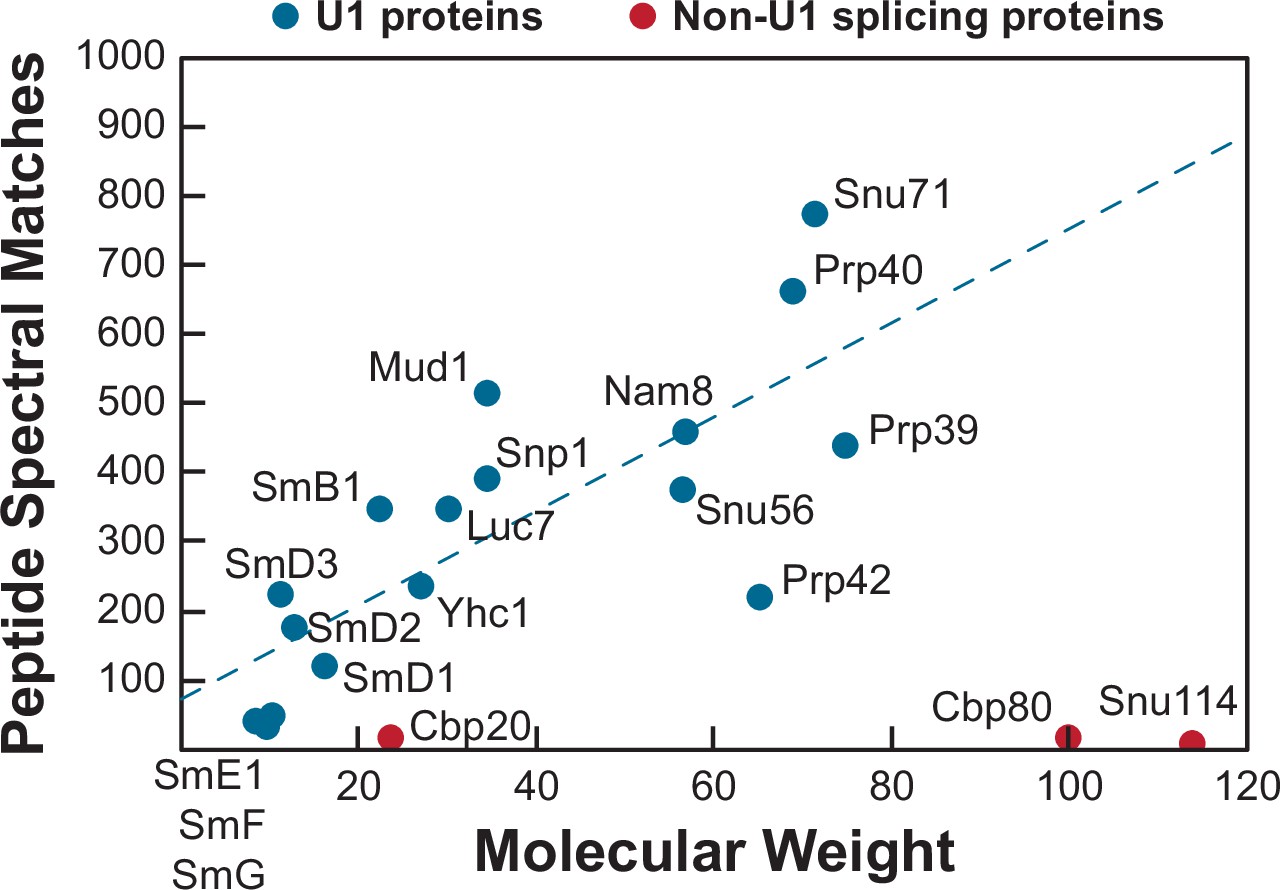
Mass spectrometry analysis of purified U1 samples.
Plotted are the number of peptide spectral matches observed for the indicated U1 small nuclear ribonucleoprotein (snRNP) proteins (blue) vs. the predicted molecular weight of the protein in kDa. The indicated U1 proteins were observed in all preparations of U1 analyzed by mass spectrometry. In some preparations, peptides corresponding to Cbp20 (two out of three preparations), Cbp80 (one out of three preparations), and Snu114 (one out of three preparations) were also observed (red). These were the only known non-U1 splicing factors observed in the samples and these factors were likely present at very low levels since few peptides were observed given the molecular weights of the proteins.
Figure 1—figure supplement 2
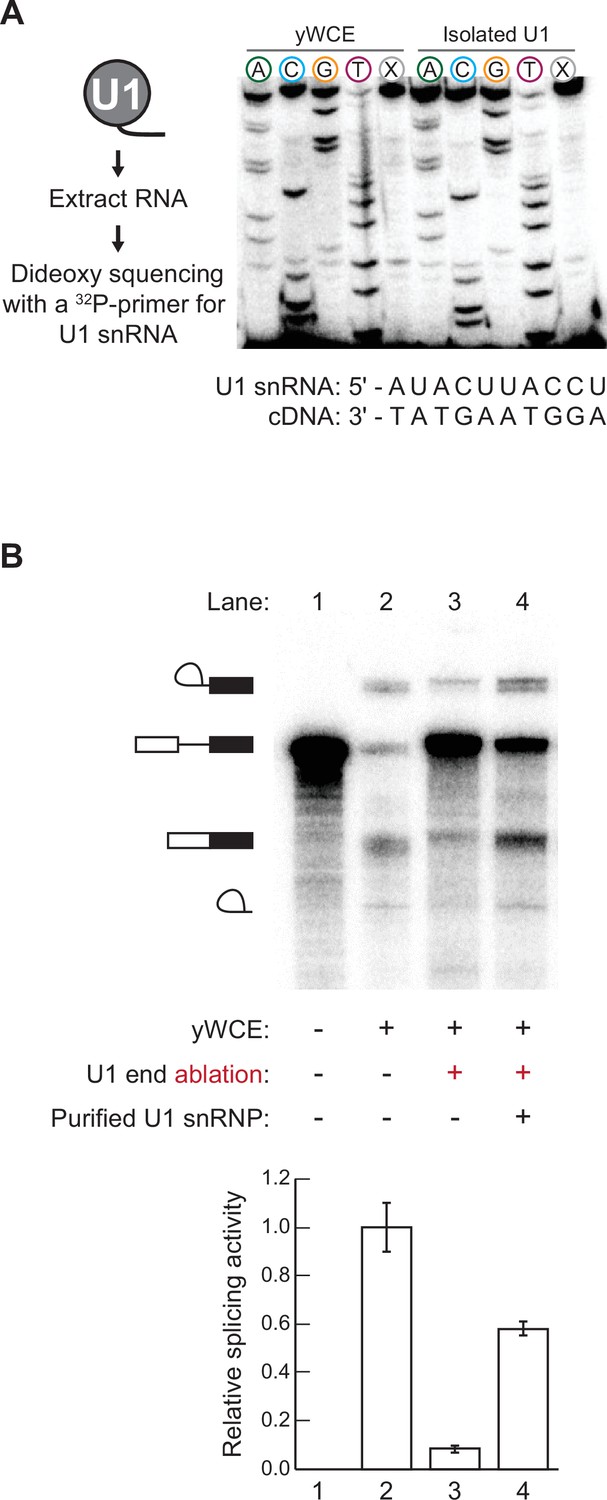
Dideoxy sequencing of the purified U1 small nuclear ribonucleoprotein (snRNA) and activity assay.
(A) The presence of the U1 splice site recognition sequence (SSRS) in the purified U1 snRNP was confirmed by dideoxy sequencing of the SSRS and comparison with sequencing of the snRNA present in total RNA isolated from yeast whole cell extract (yWCE). The dideoxynucleotide present in each reaction is noted above the corresponding lane. Lanes marked X did not contain any dideoxynucleotides. Similar patterns are obtained for the U1 snRNA present in the yWCE as in the isolated U1 and confirm presence of the SSRS. (B) Purified U1 can restore splicing activity of yWCE in which the endogenous U1 was ablated by addition of a complementary DNA oligo and RNase H cleavage. Relative splicing efficiencies shown were calculated as the amounts of mRNA products formed compared to the total of the observed RNA species. The bar graph represents the average of three replicate experiments ± SD.
-
Figure 1—figure supplement 2—source data 1
Uncropped phosphorimage of the dideoxy sequencing gel shown in Figure 1—figure supplement 2A.
- https://cdn.elifesciences.org/articles/70534/elife-70534-fig1-figsupp2-data1-v2.zip
-
Figure 1—figure supplement 2—source data 2
Uncropped phosphorimage of the precursor messenger RNA (pre-mRNA) splicing assay shown in Figure 1—figure supplement 2B.
- https://cdn.elifesciences.org/articles/70534/elife-70534-fig1-figsupp2-data2-v2.zip
Figure 1—figure supplement 3

Observed U1-binding events are sequence-dependent.
Relative event densities of oligo binding to immobilized U1 molecules for RNA-C (little to no pairing with the splice site recognition sequence [SSRS]) and RNA-4+2 (the WT RP51A 5' splice site [5’ SS] with six predicted base pairs). Ordinate values are computed as the number of binding events (N) per area of interest (AOI) per minute (min). Plotted are the results from three replicate experiments (dots) along with the average ± SD (horizontal bars and vertical lines).
Figure 1—figure supplement 4
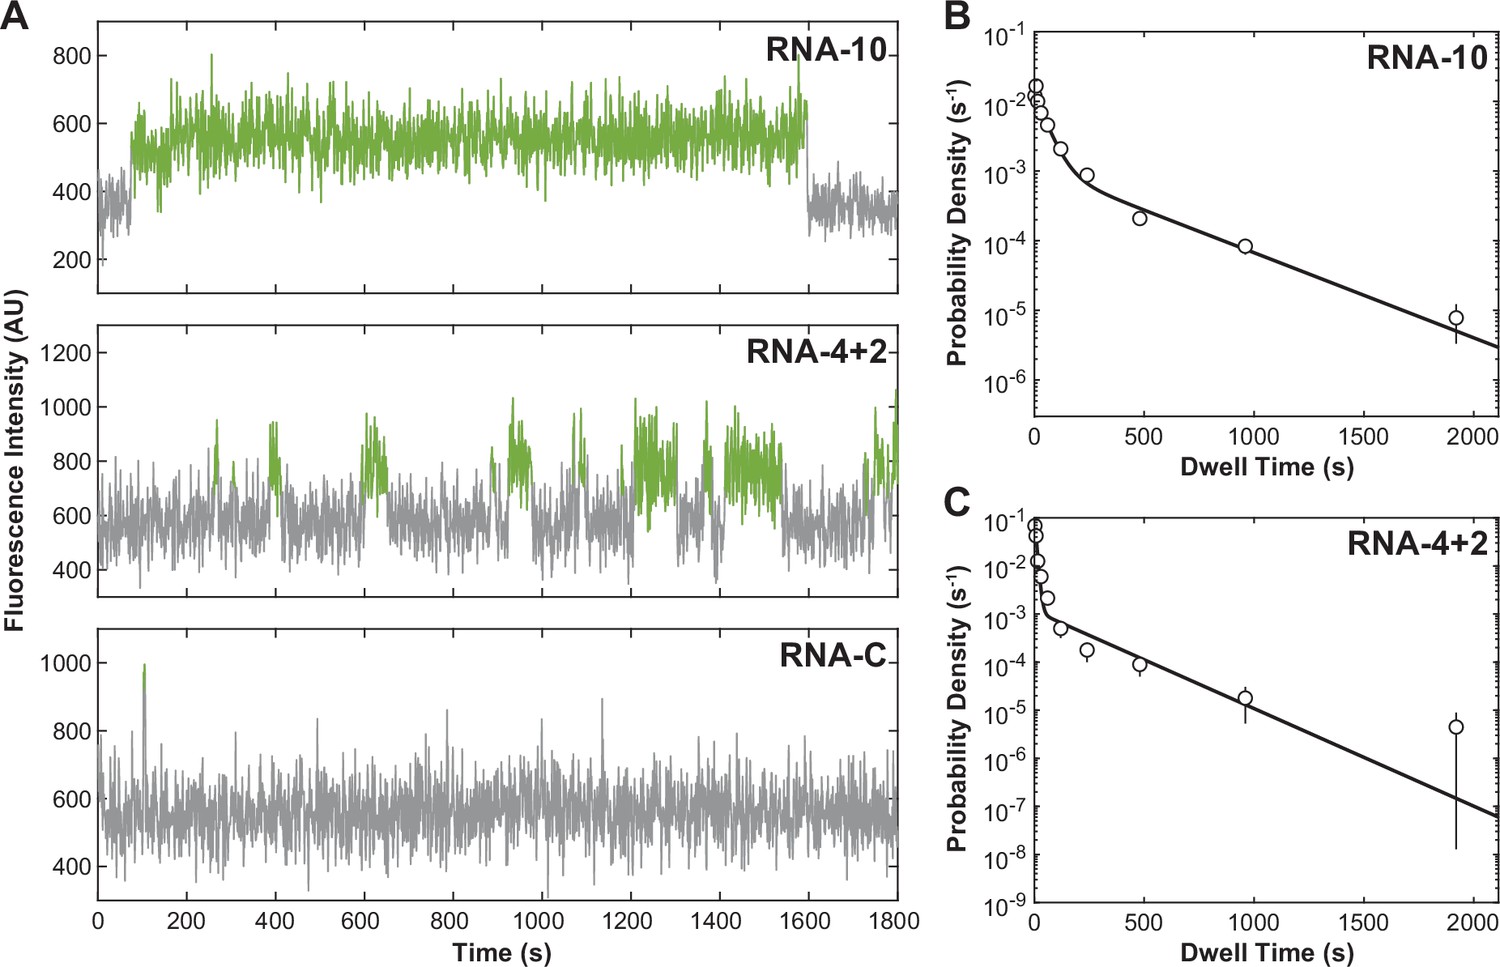
U1-binding events at 1 frame per second.
(A) Fluorescence trajectories of changes in Cy3 intensity (green) due to oligo binding to a single immobilized U1 molecule for 10 nM of RNA-10, RNA-4+2, and RNA-C collected continuously at 1 frame per second (1 Hz). Probability density histograms of dwell times overlaid with maximum likelihood estimates of a double-exponential function for RNA-10 (B) and RNA-4+2 (C) (solid line). See Figure 1—source data 2 for estimated parameters and numbers of events (N).
Figure 2
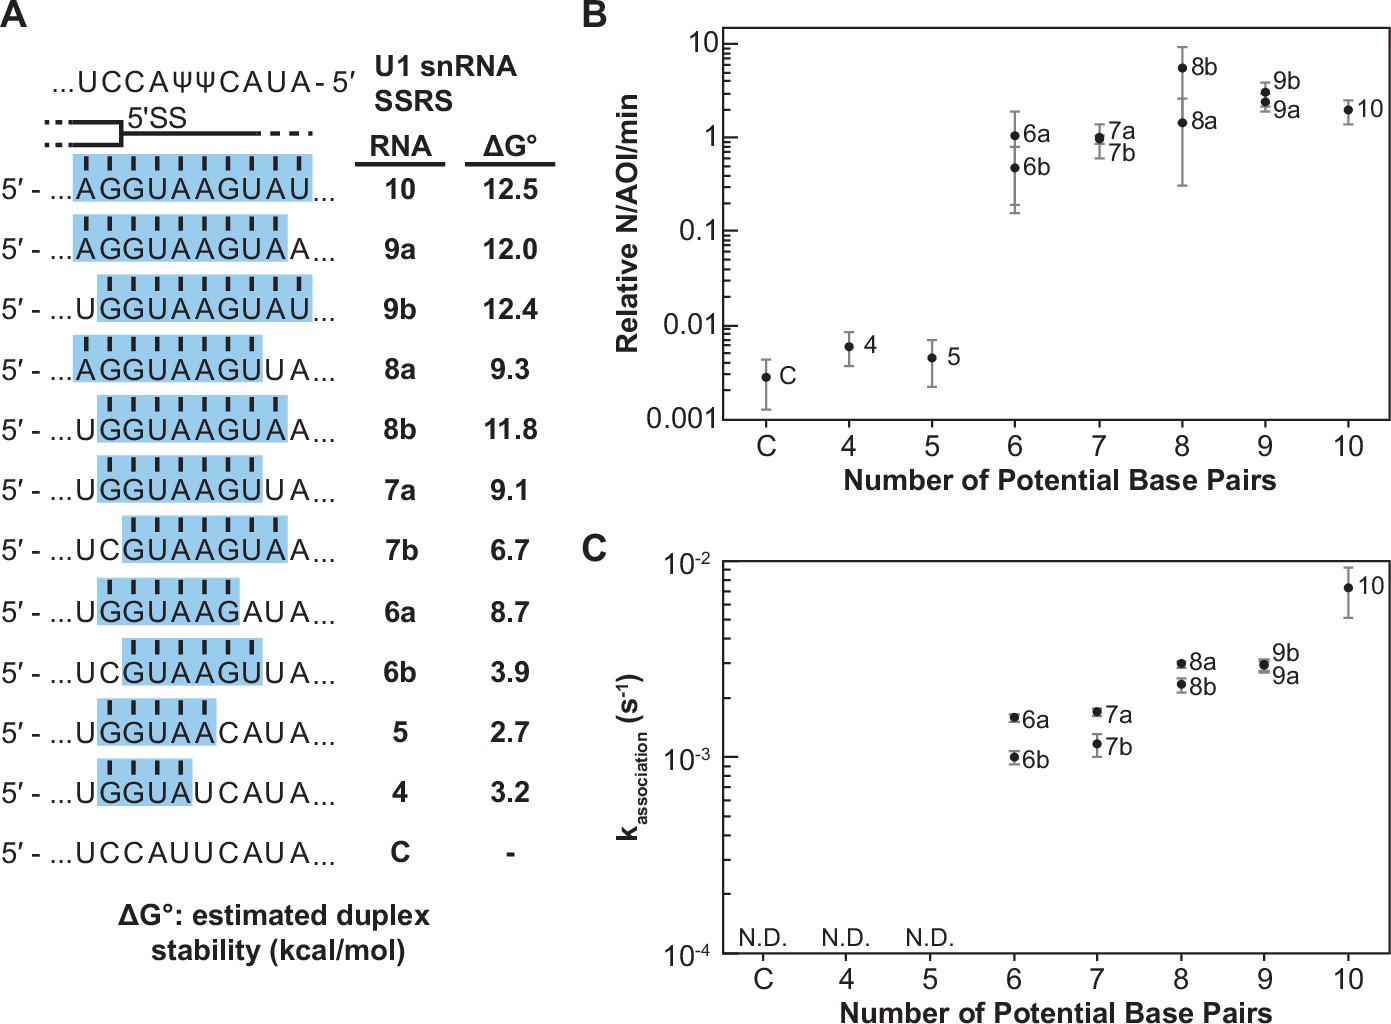
Impact of base-pairing potential on RNA oligo binding to U1.
(A) RNA oligos tested for interaction with U1 containing 4–10 predicted base pairs and the calculated free energy changes for duplex unwinding/formation based on nearest neighbor analysis. The regions shaded in blue are predicted to pair with the splice site recognition sequence (SSRS). (B) Relative event densities of oligo binding to immobilized U1 molecules as a function of potential base pairs. Ordinate values are computed as the number of binding events (N) per area of interest (AOI) per minute (min). (C) Measured association rates of the oligos to U1 as a function of potential base pairs. For (B), the plotted points represent the average results from at least three replicate experiments ± SD. For (C), the plotted points represent the fitted parameters ± the uncertainties of the fits. Numbers of events (N) are reported in Figure 2—source data 1.
-
Figure 2—source data 1
Number of measured events and calculated association rates for RNA oligos shown in Figure 2.
- https://cdn.elifesciences.org/articles/70534/elife-70534-fig2-data1-v2.docx
Figure 3
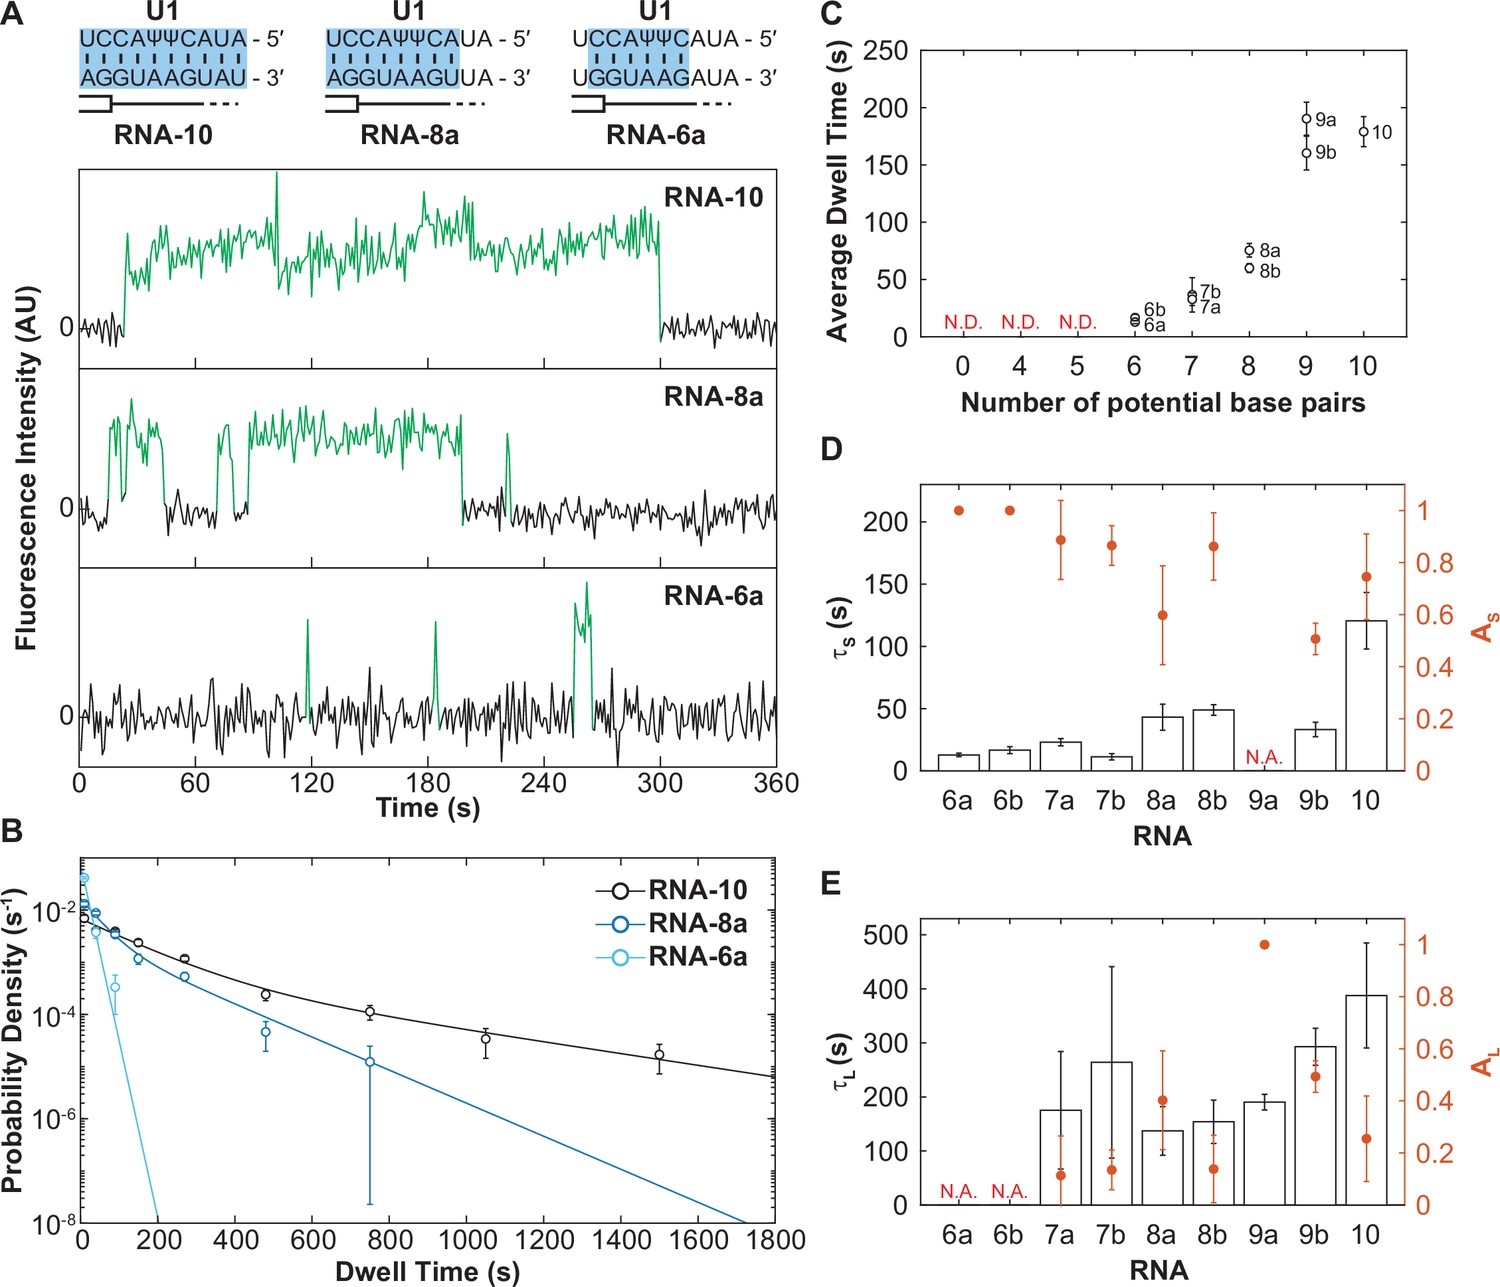
The long-lived state is dependent on the length of the small nuclear RNA (snRNA)-RNA duplex.
(A) Representative fluorescence trajectories of changes in Cy3 intensity (green) due to oligo binding to a single immobilized U1 molecules for RNAs-6a, -8a, and -10. Also shown are the predicted pairing interactions (blue) between the oligos and the U1 SSRS. (B) Probability density histograms for dwell times for RNAs-6a, -8a, and -10 binding to U1. Lines represent the single- or double-exponential distribution obtained for the fitted parameter from each data set. (C) The average dwell time of each RNA oligomer in Figure 2A. The average dwell time is not determined (ND) for oligomers for which little binding was observed. (D–E) Bars shown the estimated parameters for short-lived binding (panel D, τS < 120 s) and long-lived binding (panel E, τL > 120 s) shown for each RNA oligomer in Figure 2A and correspond to the values on the left ordinate. If there is only one fit parameter, then the other is not applicable (NA). Orange markers show the amplitude of the time constant (AS and AL) across the fitted distribution and correspond to the values on the right ordinate (orange). Error bars in C–E are standard error of the estimated parameters determined by bootstrapping. Numbers of events (N) and fit parameters are listed in Figure 3—source data 1.
-
Figure 3—source data 1
Number of measured events and calculated fit parameters for RNA oligos shown in Figure 3.
- https://cdn.elifesciences.org/articles/70534/elife-70534-fig3-data1-v2.docx
Figure 4
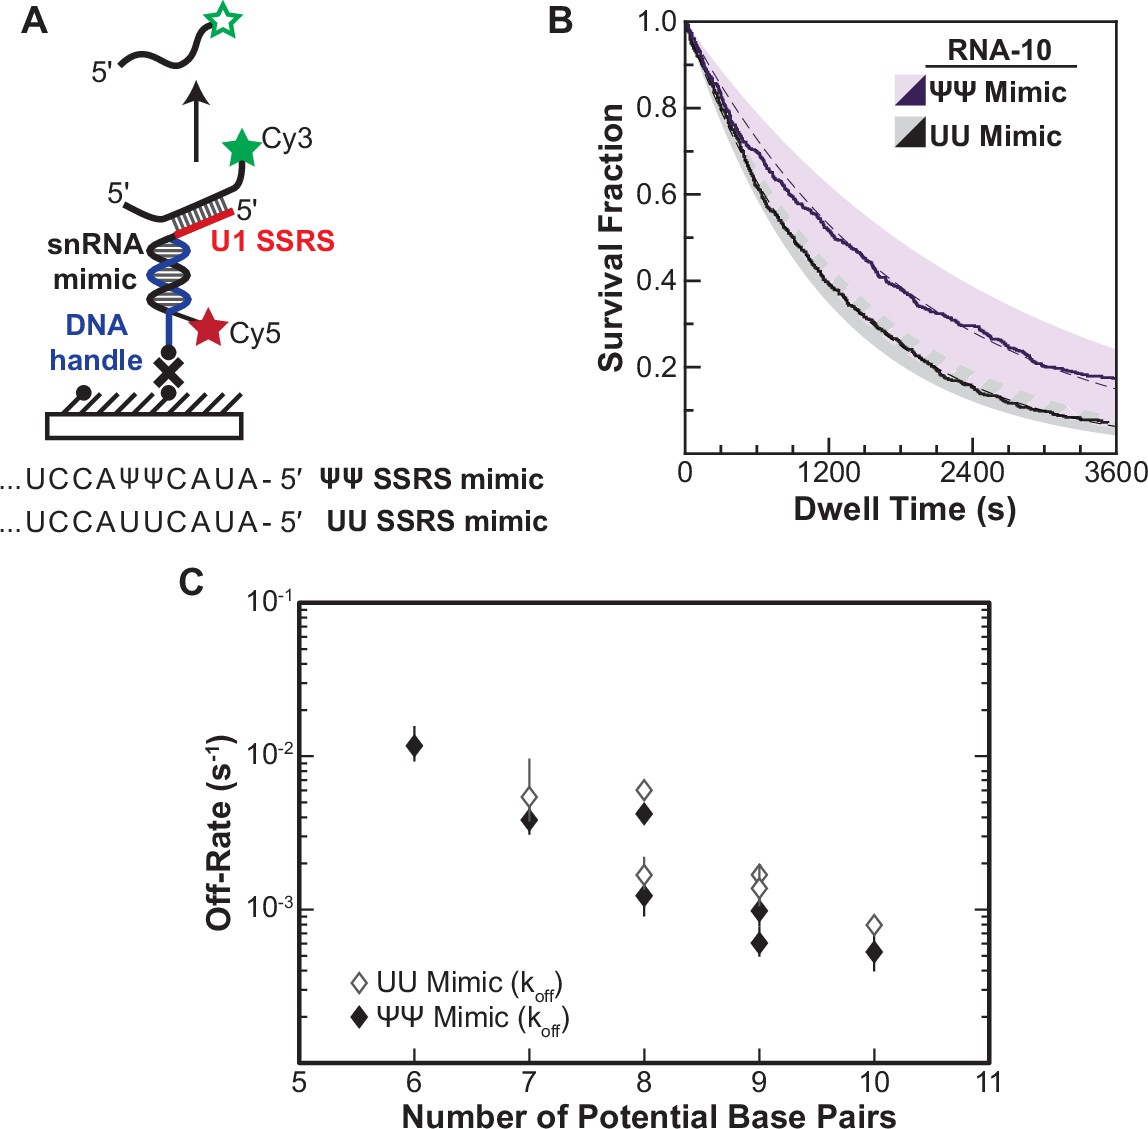
Lifetimes of 5' splice site (5' SS) oligo/RNA interactions are dependent on base-pairing potential in an RNA-only mimic of the U1 splice site recognition sequence (SSRS).
(A). Schematic of a single-molecule assay for monitoring dissociation of RNA oligos from the RNA-only mimic of the U1 SSRS. Two mimics were used that contain pseudouridine (Ψ) or uridine (U) at two positions in the SSRS that have Ψ in the native U1 small nuclear RNA (snRNA). (B) The fraction of colocalized RNA oligos remaining was plotted over time to yield survival fraction curves for determining RNA oligo off-rates (black lines). The curves were then fit to exponential decay functions to yield off-rates as well as 95% confidence intervals for the fits (dashed lines and shaded regions, respectively). Shown are the survival fraction curves for RNA-10 dissociation (see Figure 2A). (C) Measured off-rates for RNA oligos to the SSRS mimics (see Figure 4—source data 1 for rates and numbers of events, N) plotted as a function of potential base pairs.
-
Figure 4—source data 1
Number of measured events and calculated off rates for RNA oligos shown in Figure 4.
- https://cdn.elifesciences.org/articles/70534/elife-70534-fig4-data1-v2.docx
Figure 5
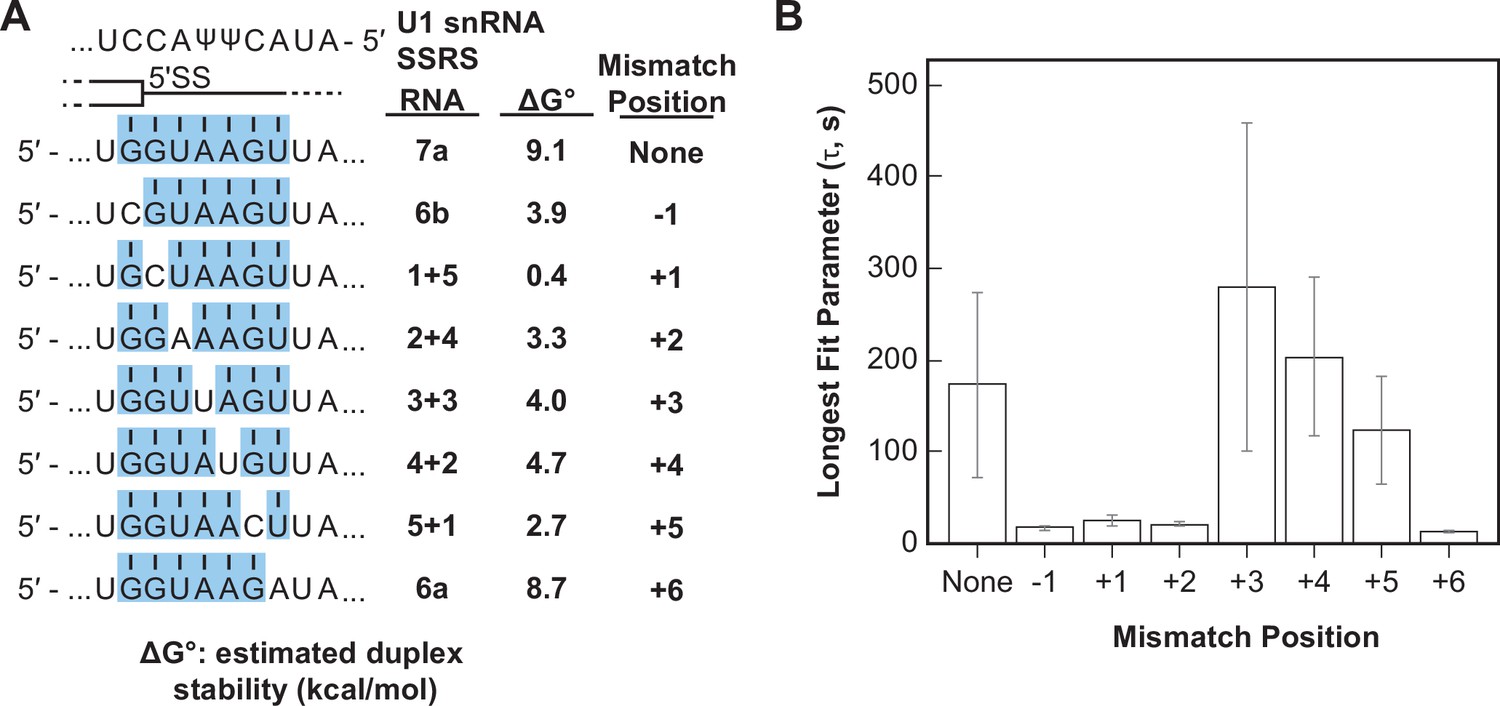
Long-lived U1/RNA interactions are dependent on mismatch position.
(A) RNA oligos tested for interaction with U1 containing mismatches at the –1 to +6 positions and the calculated free energy changes for duplex unwinding/formation based on nearest neighbor analysis. The regions shaded in blue are predicted to pair with the splice site recognition sequence (SSRS). (B) The value of the longest-lived parameter (τ0 or τL, see Figure 5—source data 1 for fit parameters and numbers of events , N) obtained by fits of the distributions of dwell times to U1 for each RNA oligomer in panel (A). The plotted bars represent the fitted parameters ± the uncertainties of the fits. Note that data for RNA oligos 7a, 6a, and 6b were replotted from Figure 3D and E for comparison.
-
Figure 5—source data 1
Numbers of events and fit parameters for data shown in Figure 5.
- https://cdn.elifesciences.org/articles/70534/elife-70534-fig5-data1-v2.docx
Figure 6
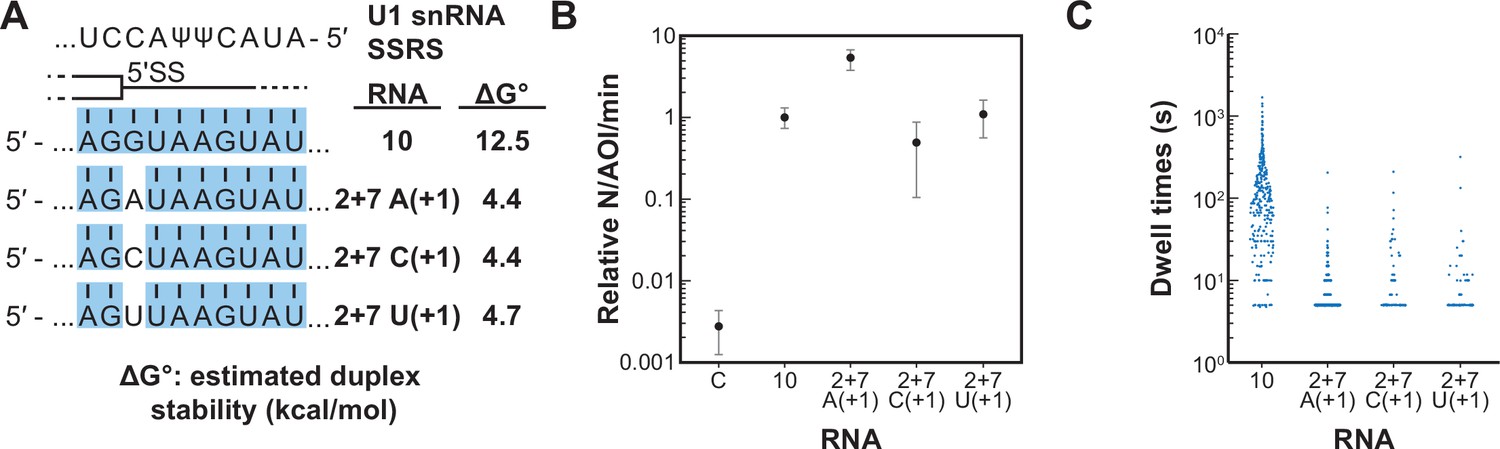
Long-lived interactions are greatly stimulated by G at the 5' splice site (5' SS) +1 position.
(A) RNA oligos tested for interaction with U1 containing mismatches only at the +1 positions and the calculated free energy changes for duplex unwinding/formation based on nearest neighbor analysis. The regions shaded in blue are predicted to pair with the splice site recognition sequence (SSRS). (B) Relative event densities of oligo binding to immobilized U1 molecules for RNAs shown in panel (A). Ordinate values are computed as the number of binding events (N) per area of interest (AOI) per minute (min). Plotted are averages from replicate experiments ± SD (dots and vertical lines). (C) Distribution of observed dwell times for U1 interactions with oligos from panel (A). Each dot corresponds to a single dwell time for N = 295, 518, 90, or 89 events for RNAs 10 and 2+7 variants A(+1), C(+1), and U(+1) , respectively.
-
Figure 6—source data 1
Fit parameters and log-likelihood results for RNA oligos shown in Figure 6.
- https://cdn.elifesciences.org/articles/70534/elife-70534-fig6-data1-v2.docx
Figure 7
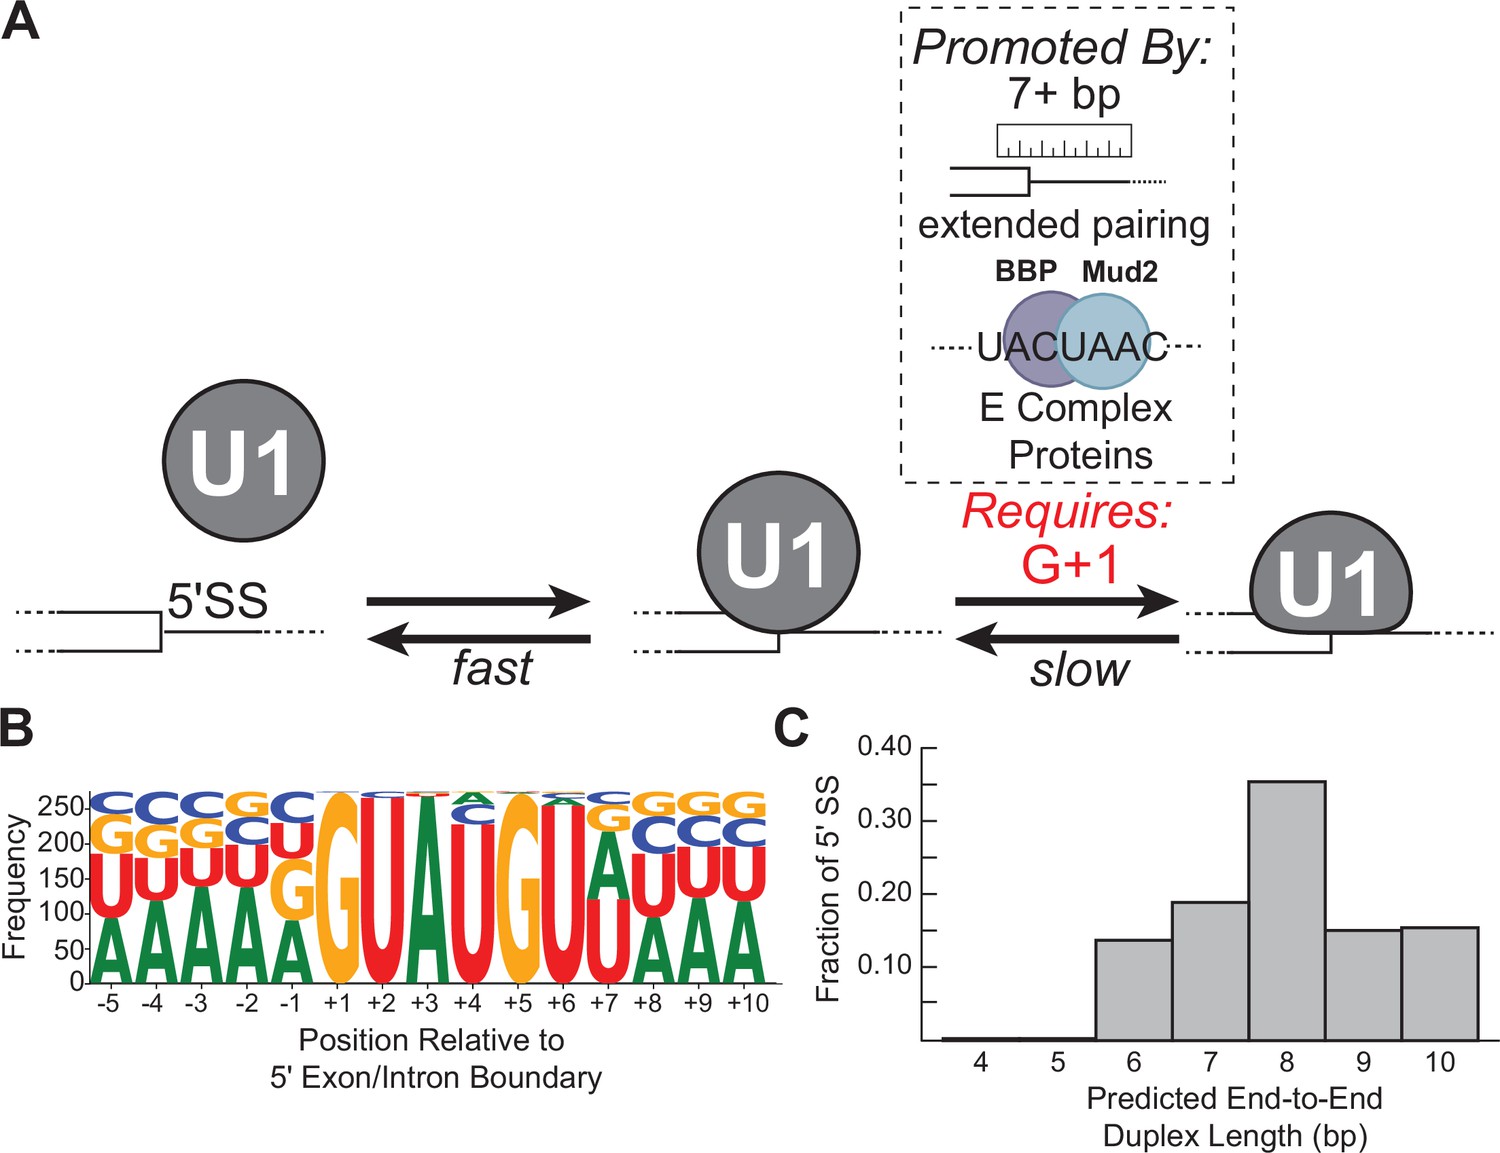
Multi-step authentication model for 5' splice site (5' SS) recognition.
(A) U1 binding initially occurs by formation of a weakly interacting complex that is dependent on base-pairing potential between the RNA and U1 splice site recognition sequence (SSRS). Stable binding is dependent on presence of G+1 at the 5' SS and formation of an extended duplex with an end-to-end length of at least 7 bp or the presence of trans-acting splicing factors such as E complex proteins (Larson and Hoskins, 2017). (B) Sequence LOGO for annotated yeast 5' SS (Lim and Burge, 2001). (C) Histogram of end-to-end duplex lengths based on base-pairing potential between annotated yeast 5' SS (N=282) and the U1 SSRS. Most of these duplexes contain one or more mismatches with the SSRS.
Tables
Key resources table
| Reagent type (species) or resource | Designation | Source or reference | Identifiers | Additional information |
|---|---|---|---|---|
| Strain, strain background (Saccharomyces cerevisiae) | BJ2168 (MATa prc1–407 prb1–1122 pep4–3 leu2 trp1 ura3–52 gal2) | Bruce Goode Lab Crawford et al., 2008 | yAAH0001 | |
| Strain, strain background (Saccharomyces cerevisiae) | U1-SNAP-TAP (BJ2168 +SNP1::SNP1-fSNAP-Hyg+SNU71::SNU71-TAP-URA) | This study | yAAH0393 | See Methods, Tap Tagging of Yeast U1 snRNP |
| Recombinant DNA reagent | Plasmid for in vitro transcription of RP51A (pBS117) | Michael Rosbash Lab Séraphin and Rosbash, 1991 | pAAH0016 | |
| Sequence-based reagent | U1 cOligo (DNA) | Integrated DNA Technologies | JL-U1 5’ complement | 5ʹ-CTT AAG GTA AGT AT |
| Sequence-based reagent | U1 RT Oligo (DNA) | Integrated DNA Technologies | SRH15 | 5ʹ-TCA GTA GGA CTT CTT GAT |
| Sequence-based reagent | U1 snRNA mimic (UU, RNA) | Integrated DNA Technologies | SRH21 | 5ʹ-AUA CUU ACC UUA AGA UAU CAG AGG AGA UCA AGA AG /3Cy5Sp/ |
| Sequence-based reagent | U1 snRNA mimic (ΨΨ, RNA) | Integrated DNA Technologies | SRH36 | 5ʹ-AUA CΨΨ ACC UUA AGA UAU CAG AGG AGA UCA AGA AG /3Cy5Sp/ |
| Sequence-based reagent | Handle for U1 mimic (DNA) | Integrated DNA Technologies | SRH22 | 5ʹ-/Biotin/ TCT CTT CTT GAT CTC CTC TGA TAT CTT A |
| Sequence-based reagent | RNA-Cy3 oligomers | Integrated DNA Technologies | See Figure 1—source data 1 | |
| Commercial assay or kit | Criterion TGX Precast Gel (4–20%) | Bio-Rad | Cat. No. 567-1093 | |
| Commercial assay or kit | Silver Stain Plus Kit | Bio-Rad | Cat. No. 161-0449 | |
| Chemical compound, drug | GE Healthcare IgG Sepharose 6 Fast Flow resin | VWR Scientific | Cat. No. 95017-050 | |
| Chemical compound, drug | Calmodulin Affinity Resin | Agilent | Cat. No. 214303 | |
| Chemical compound, drug | Rnasin Ribonuclease Inhibitor | Promega | Cat. No. N2611 | |
| Chemical compound, drug | Pierce Protease Inhibitor Tablet | Thermo Fisher Scientific | Cat. No. A32965 | |
| Chemical compound, drug | TEV Protease | Sigma-Aldrich | Cat. No. T4455 | |
| Chemical compound, drug | BG-649-PEG-biotin | Smith et al., 2013 | ||
| Chemical compound, drug | m7G(5’)ppp(5’)G RNA Cap Structure Analog | New England BioLabs | Cat. No. S1404S | |
| Chemical compound, drug | AMV Reverse Transcriptase | Promega | Cat. No. M5101 | |
| Chemical compound, drug | RnaseH (2 U/μL) | Thermo Fisher Scientific | Cat. No. 18021014 | |
| Chemical compound, drug | Vectabond | Thermo Fisher Scientific | Cat. No. NC9280699 | |
| Chemical compound, drug | Biotin-PEG-SVA (MW 5000) | Laysan Bio | Cat. No. Biotin-PEG-SVA-5000-100 mg | |
| Chemical compound, drug | mPEG-SVA (MW 5000) | Laysan Bio | Cat. No. mPEG-SVA-5000-1G | |
| Chemical compound, drug | Poly-L-lysine | Sigma-Aldrich | Cat. No. P7890 | |
| Chemical compound, drug | Glucose Oxidase from Aspergillus niger type VII | Sigma-Aldrich | Cat. No. G2133-50KU | |
| Chemical compound, drug | Catalase from bovine liver | Sigma-Aldrich | Cat. No. C40-100MG | |
| Chemical compound, drug | (±)–6-Hydroxy-2,5,7,8-tetramethylchromane-2-carboxylic acid (Trolox) | Sigma-Aldrich | Cat. No. 238813-1G | |
| Chemical compound, drug | TransFluoSpheres Streptavidin-Labeled Microspheres (488/645), 0.04 μm, 0.5% solids | Life Technologies/ Invitrogen | Cat. No. T-10711 | |
| Chemical compound, drug | Yeast tRNA (10 mg/mL) | Thermo Fisher Scientific | Cat. No. AM7119 | |
| Chemical compound, drug | Streptavidin, 10 mg | Prozyme | Cat. No. SA10-10mg | |
| Chemical compound, drug | Heparin sodium salt from porcine intestinal mucosa | Sigma-Aldrich | H4784-250MG | |
| Chemical compound, drug | MilliporeSigma Calbiochem BSA, 10% Aqueous Solution, Nuclease-Free | Thermo Fisher Scientific | Cat. No. 12-661-525ML | |
| Software, algorithm | ImageQuant TL 8.1 software | GE Healthcare Life Sciences | https://www.gelifesciences.com | |
| Software, algorithm | MATLAB | MathWorks | https://www.mathworks.com/products/matlab.html | |
| Software, algorithm | ChemDraw Prime 15.0 | PerkinElmer | http://www.cambridgesoft.com/ | |
| Software, algorithm | Imscroll | Friedman and Gelles, 2015 | https://github.com/gelles-brandeis/CoSMoS_Analysis | |
| Software, algorithm | QuB | Nicolai and Sachs, 2013 | https://qub.mandelics.com | |
| Software, algorithm | DISC | White et al., 2020 | https://github.com/ChandaLab/DISC | |
| Other | Ultra-clear centrifuge tubes (14 mL capacity) | Beckman Coulter | Cat. No. 344060 | Ultracentrifuge tubes for preparing yeast splicing extract |
| Other | Precision Plus Protein All Blue Prestained Protein Standards | Bio-Rad | Cat. No. 161-0373 | Protein molecular weight ladder for SDS-PAGE |
| Other | 0.8×4 cm Poly-Prep Chromatography Columns | Bio-Rad | Cat. No. 731-1550 | Columns used for TAP purification |
| Other | 10 kDa MWCO Slide-A-Lyzer dialysis cassette | Thermo Fisher Scientific | Cat. No. 66380 | Dialysis membranes used during purification |
| Other | Amicon Ultra 100 kDa MWCO centrifugal filters | Sigma-Aldrich | Cat. No. Z677906-24 | Concentrators used during purification |
| Other | Gold Seal Cover Slips (#1, 24×60 mm) | Thermo Fisher Scientific | Cat. No. 5031132 | Glass slides used in CoSMoS assays |
| Other | Gold Seal Cover Slips (#1, 25×25 mm) | Thermo Fisher Scientific | Cat. No. 3307 | Glass slides used in CoSMoS assays |
| Other | Fisherbrand Five-Slide Mailer | Thermo Fisher Scientific | Cat. No. HS15986 | Slide holder used to clean slides |
Additional files
Download links
A two-part list of links to download the article, or parts of the article, in various formats.
Downloads (link to download the article as PDF)
Open citations (links to open the citations from this article in various online reference manager services)
Cite this article (links to download the citations from this article in formats compatible with various reference manager tools)
Multi-step recognition of potential 5' splice sites by the Saccharomyces cerevisiae U1 snRNP
eLife 11:e70534.
https://doi.org/10.7554/eLife.70534


