Mechanisms underlying microglial colonization of developing neural retina in zebrafish
- Developmental Neurobiology Unit, Okinawa Institute of Science and Technology Graduate University, Japan
Figures
Figure 1 with 4 supplements
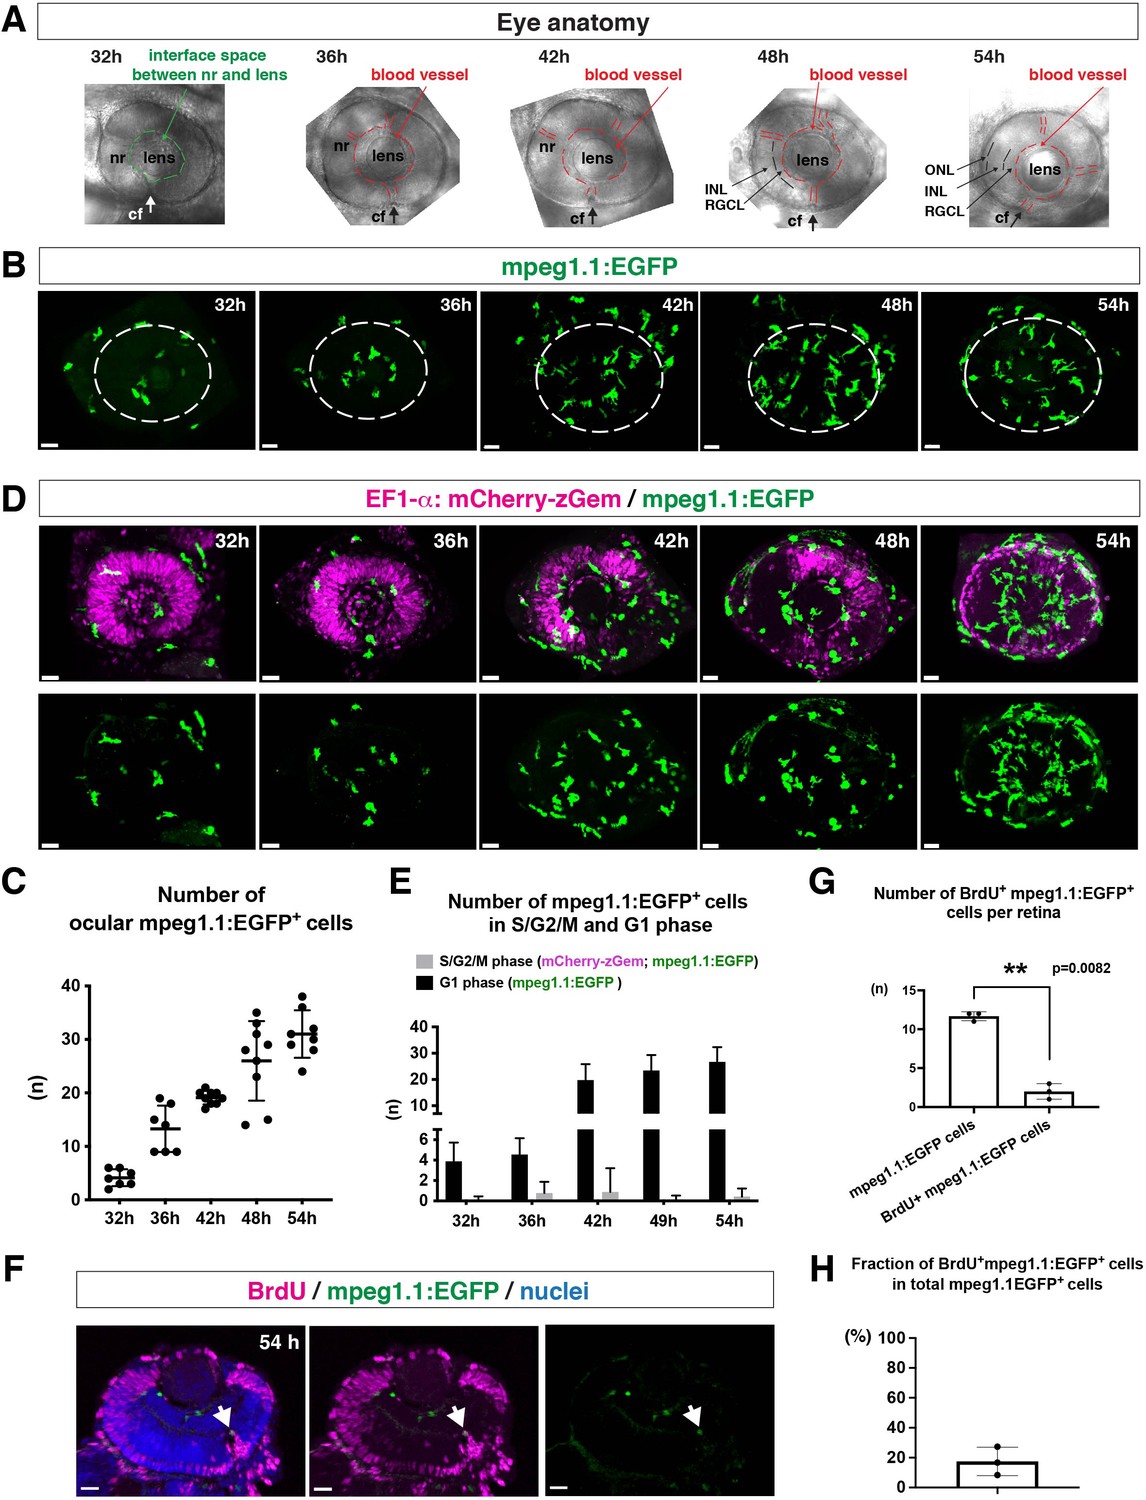
Microglial precursors progressively colonize developing zebrafish retinas.
(A) Lateral view of zebrafish eyes used for confocal scanning shown in panel (B). Anterior is left and dorsal is up. The choroid fissure (cf, arrows) is formed at the ventral retina. At 32 hpf, the interface space between the neural retina (nr) and lens appears, in which ocular blood vessels are formed after 36 hpf. At 48 hpf, RGCL and INL are distinct. At 54 hpf, the ONL becomes evident. (B) Three-dimensional confocal images of mpeg1.1:EGFP-positive microglial precursors (green) in the retina from 32 to 54 hpf. Dotted circles indicate the outline of the optic cup. The first microglial precursors appear in the choroid fissure and near the lens at 32 hpf. Microglial precursors in the optic cup progressively increase in number. At 42 hpf, they start to enter retinal tissue and spread into the entire neural retina by 54 hpf. Scale: 30 µm. (C) Histogram of the number of intraocular microglial precursors from 32 to 54 hpf. Horizonal and vertical bars indicate means ± SD. (D) Three-dimensional confocal images of Tg[EF1α:mCherry-zGem; mpeg1.1:EGFP] retinas from 32 to 54 hpf. Tg[EF1α:mCherry-zGem] (magenta) indicates cells undergoing S and G2 phases. mpeg1.1:EGFP-positive microglial precursors (green) are mostly negative for mCherry-zGem, suggesting that most ocular microglial precursors are in G1 phase. Scale: 30µm. (E) Histogram of numbers of intraocular microglial precursors expressing only mpeg1.1:EGFP, and microglial precursors expressing both mCherry-zGem and mpeg1.1:EGFP in retinas from 32 to 54 hpf. Double-positive microglial precursors represent proliferating microglial precursors undergoing S/G2 phase. Single mpeg1.1:EGFP-positive microglial precursors represent microglial precursors in G1 phase. Bars and lines indicate means ± SD. (F) Sections of Tg[mpeg1.1:EGFP] transgenic retinas with BrdU incorporated and labeled with anti-BrdU (magenta) and anti-EGFP (green) antibody. Nuclei were counterstained by TOPRO3 (blue). The arrowhead indicates BrdU- and mpeg1.1:EGFP double-positive cells. Most mpeg1.1:EGFP+ cells are BrdU-negative at 54 hpf, suggesting that they are not proliferative. Scale: 20 µm. (G) Histogram of numbers of mpeg1.1:EGFP+ cells and BrdU-positive mpeg1.1:EGFP+ cells per retinal section. Bars and lines indicate means ± SD. **p < 0.01. (H) Fraction of BrdU-positive proliferative mpeg1.1:EGFP+ cells in total mpeg1.1:EGFP+ cells. The average is less than 20%, indicating that more than 80 % of ocular microglial precursors are in the G1 phase. Bars and lines indicate means ± SD.
-
Figure 1—source data 1
Data for Figure 1C.
- https://cdn.elifesciences.org/articles/70550/elife-70550-fig1-data1-v1.xlsx
-
Figure 1—source data 2
Data for Figure 1E.
- https://cdn.elifesciences.org/articles/70550/elife-70550-fig1-data2-v1.xlsx
-
Figure 1—source data 3
Data for Figure 1GH.
- https://cdn.elifesciences.org/articles/70550/elife-70550-fig1-data3-v1.xlsx
Figure 1—figure supplement 1
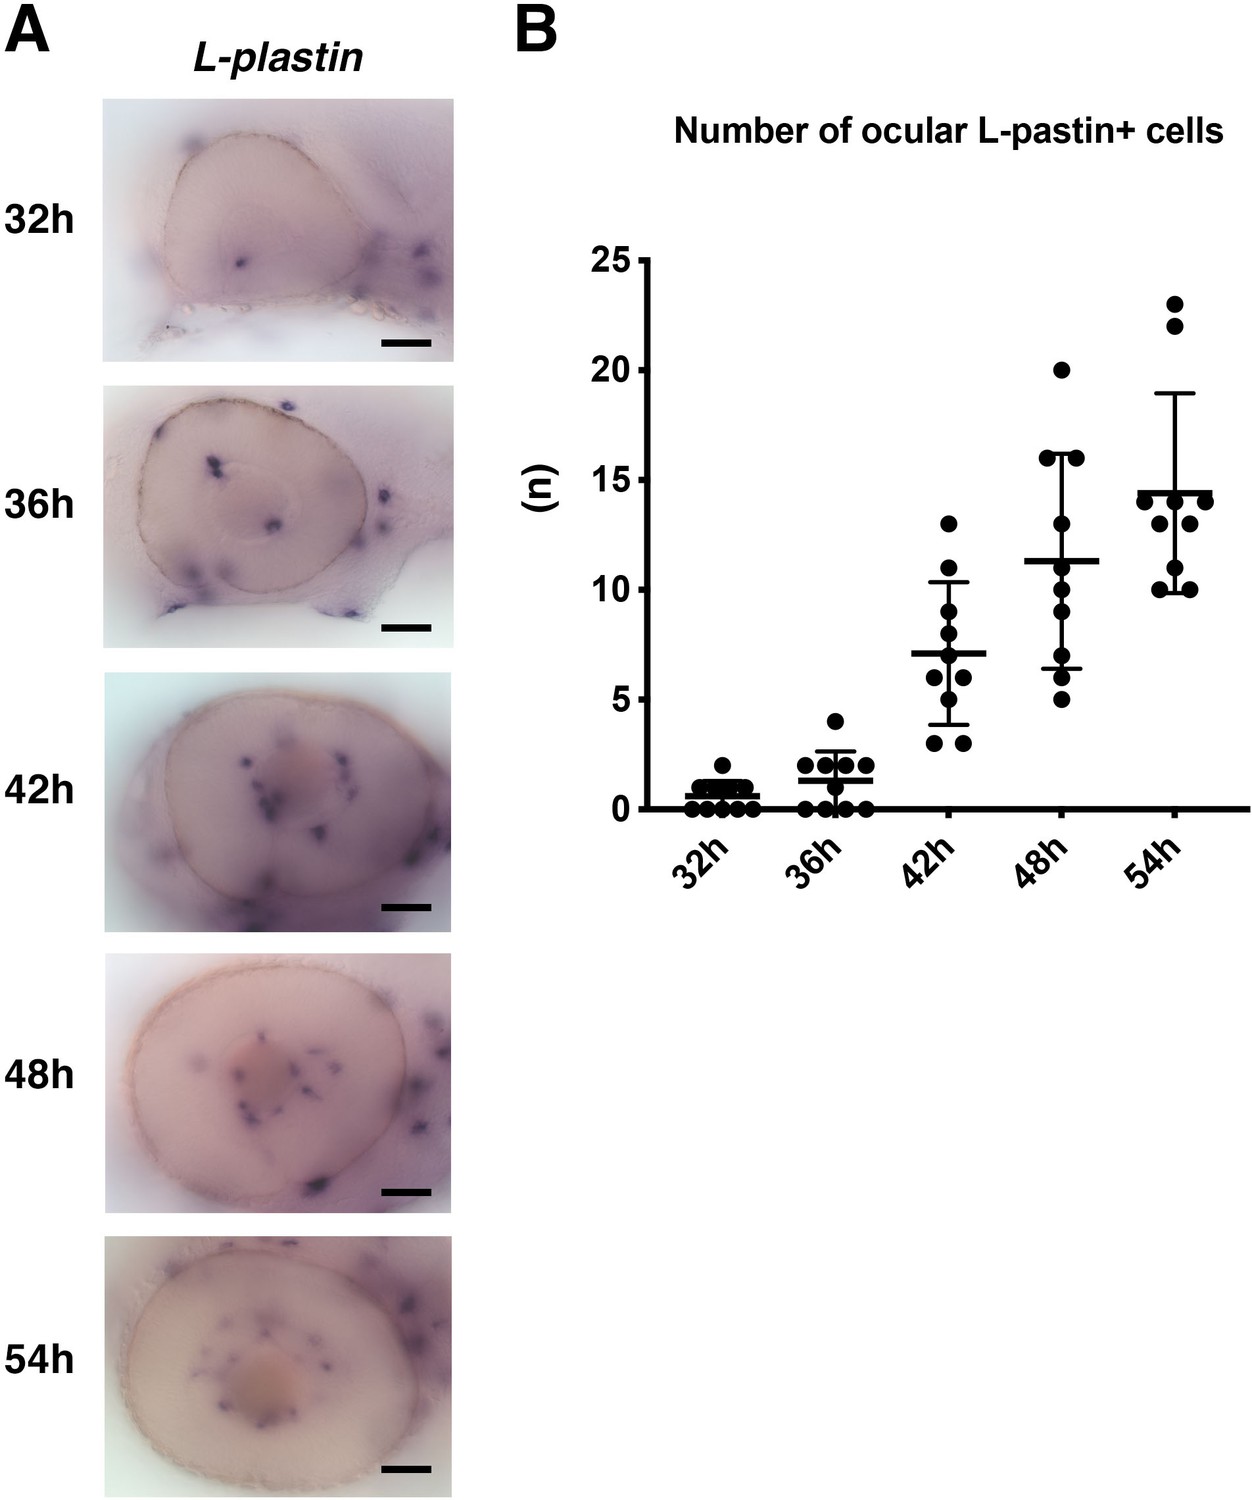
The number of L-plastin-positive cells colonizing developing retinas.
(A) Lateral view of the zebrafish optic cup labeled with L-plastin mRNA probe at 32, 36, 42, 48, 54 hpf. L-plastin mRNA is expressed in microglial precursors and neutrophils in the developing zebrafish brain, including the retinas. Since neutrophils do not invade the brain area during embryonic development, L-plastin-positive ocular cells are thought to be microglial precursors. L-plastin-positive ocular cells increase progressively in number during development. Scale: 50 μm. (B) Histogram of the number of L-plastin-positive ocular cells. Horizontal and vertical bars indicate means ± SD.
-
Figure 1—figure supplement 1—source data 1
Data for Figure 1—figure supplement 1B.
- https://cdn.elifesciences.org/articles/70550/elife-70550-fig1-figsupp1-data1-v1.xlsx
Figure 1—figure supplement 2
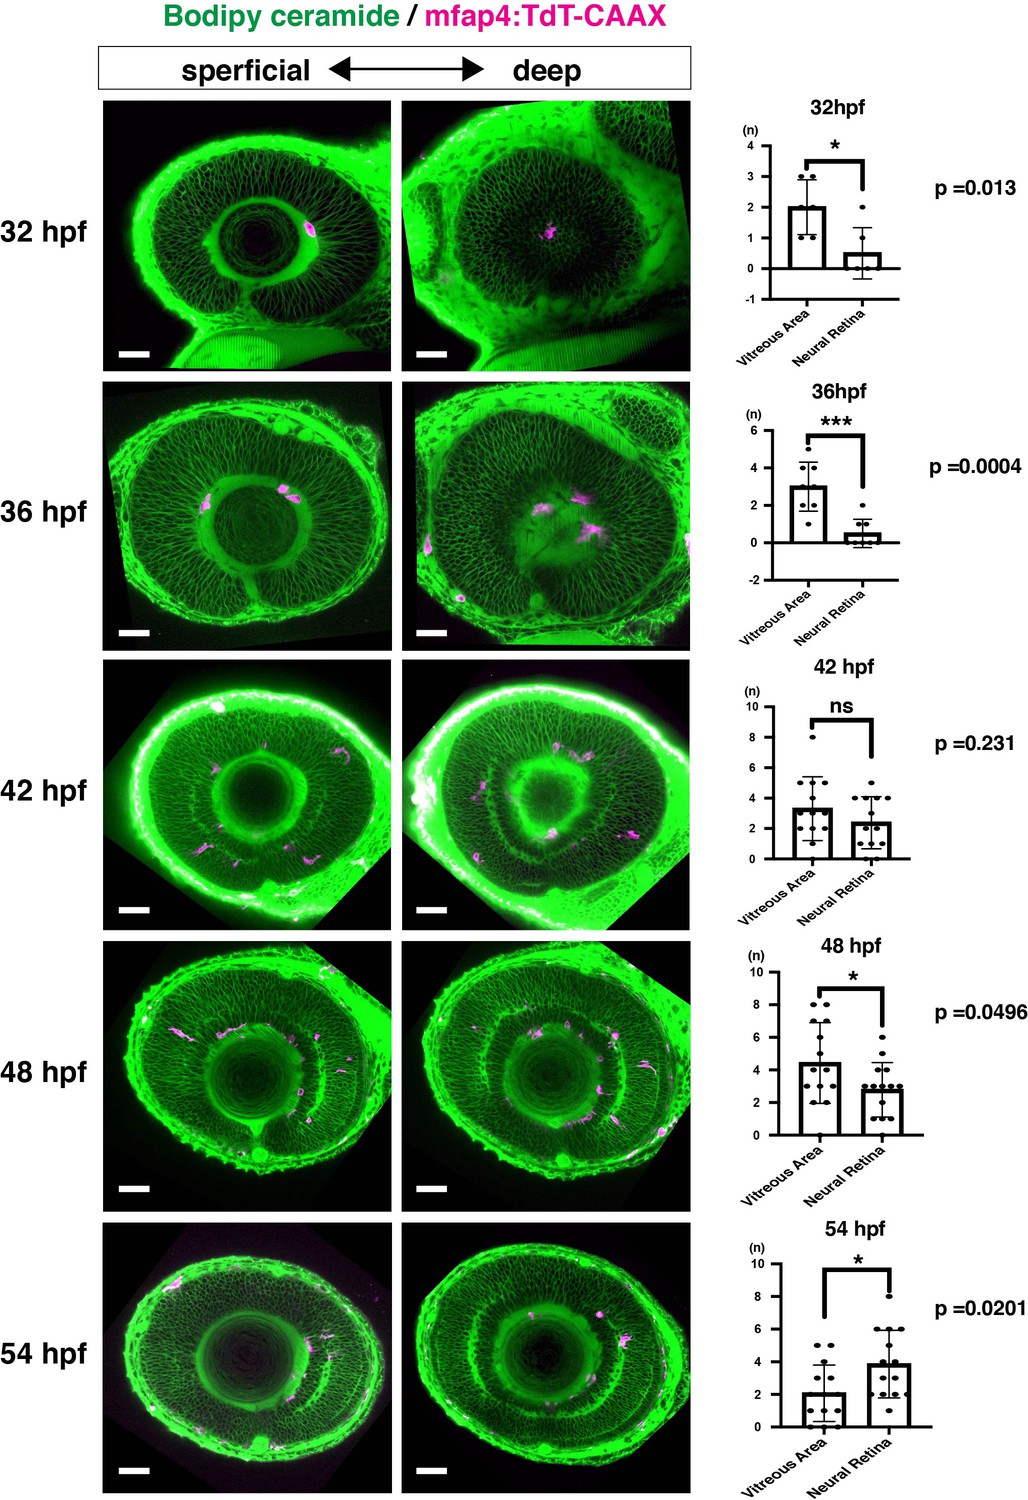
Spatio-temporal profile of microglial precursor colonization of developing retinas.
Left and middle columns indicate Tg[mfap4:TdTomato-CAAX] transgenic zebrafish retinas labeled with Bodipy ceremide at 32, 36, 42, 48, and 54 hpf. The right column shows a histogram of numbers of mfap4+ cells in the vitreous space between the retina and the lens and in the neural retina (means ± SD). At 32 and 36 hfp, most mfap4+ microglial precursors are associated with hyaloid blood vessels that form in the vitreous space between the retina and the lens. After 42 hpf, mfap4+ cells start to infiltrate the neural retina and are often associated with emerging IPL. The number of mfap4+ cells in the neural retina is lower than in the vitreous space at 48 hpf, but becomes higher at 54 hpf. Scale bars: 30 μm.
-
Figure 1—figure supplement 2—source data 1
Data for Figure 1—figure supplement 2.
- https://cdn.elifesciences.org/articles/70550/elife-70550-fig1-figsupp2-data1-v1.xlsx
Figure 1—figure supplement 3

Ocular microglial precursors are associated with newly differentiating amacrine cells.
Confocal image of a 44-hpf Tg[mfap4:tdTomato-CAAX] transgenic retina injected with a DNA construct encoding Ptf1a:EGFP. The lower panel indicates a higher magnification image of the dotted square shown in the upper panel. The dotted circle and dotted line in the lower panel indicate the outline of the lens and retinal pigmented epithelium (pe), respectively. Microglial precursors (magenta) are transiently located in the vitreous space between the lens and the retina (arrowheads), and start to infiltrate the neural retina after 42 hpf. Most infiltrated microglial precursors (arrows) are associated with newly differentiating amacrine cells, which express Ptf1a:EGFP (green). Magenta signals associated with pigmentated epithelium are noise and derived from autofluorescence of iridophores. Scale bars: 30 μm.
Figure 1—figure supplement 4
Peripheral macrophages of Tg[EF1α:mCherry-zGem; mpeg1.1:EGFP] transgenic embryos.
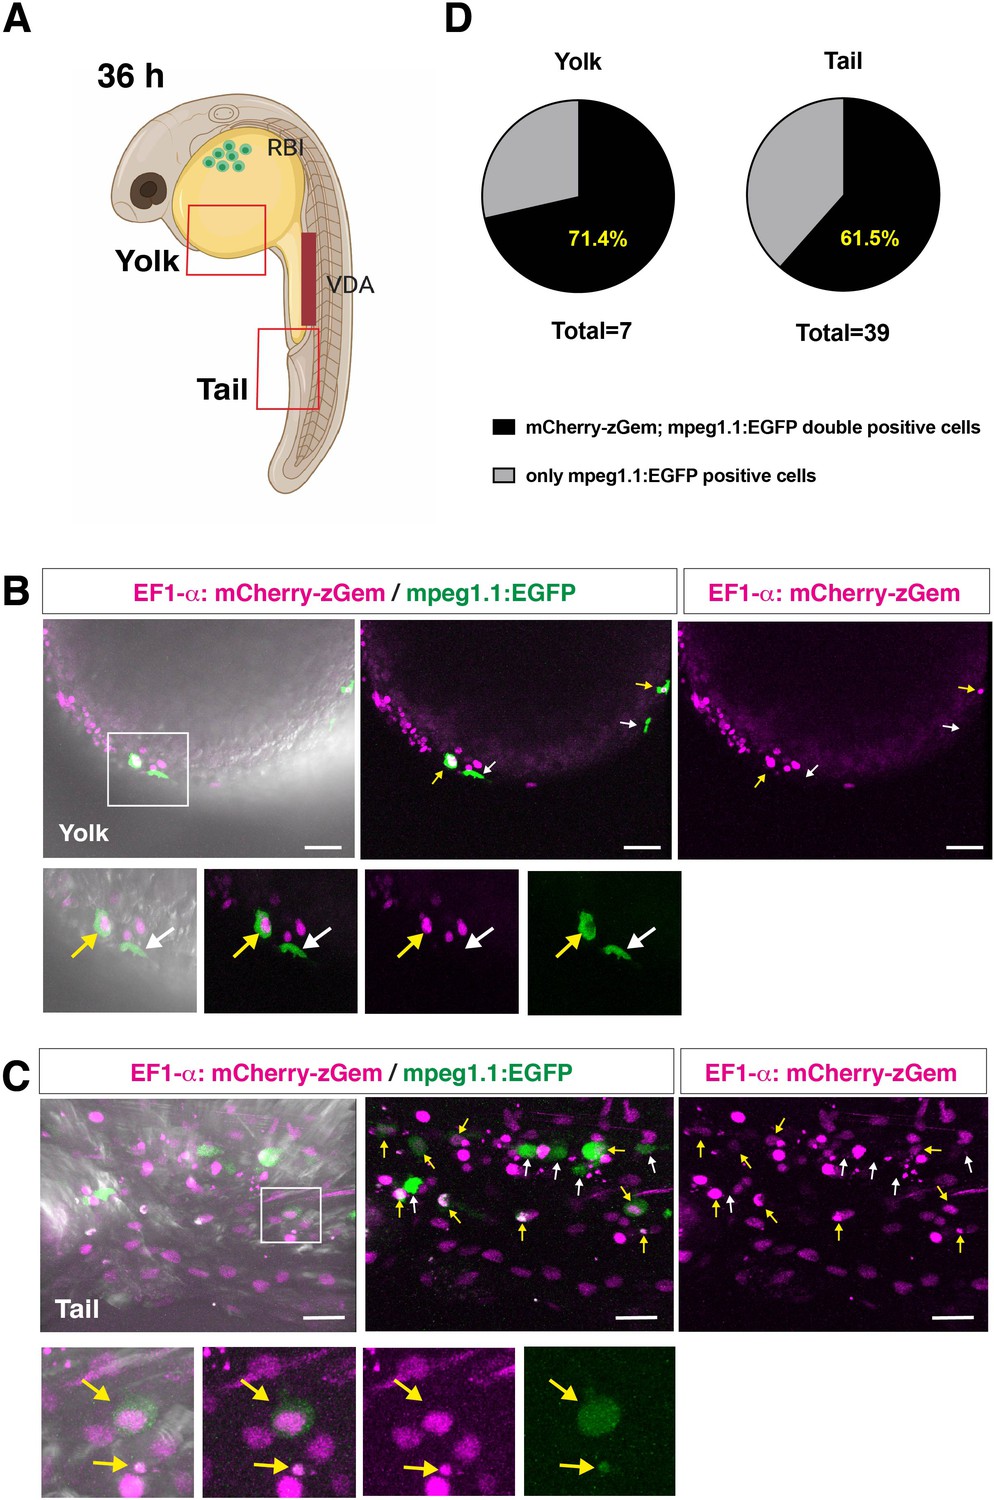
(A) Schematic drawing of 36 hpf zebrafish embryos indicating the scanning area in yolk and tail, which are shown in panels (B) and (C), respectively. RBI, rostral blood island; VDA, ventral wall of dorsal aorta. Zebrafish cartoon image credit; created by https://biorender.com. (B) Confocal scanning of peripheral macrophages in yolk of Tg[EF1α:mCherry-zGem; mpeg1.1:EGFP] transgenic embryos at 36 hpf. Yellow arrows indicate mCherry-zGem and mpeg1.1:EGFP double-positive cells, whereas white arrows indicate only mpeg1.1:EGFP-positive cells. The bottom four panels are higher magnifications of the white square in the top-left panel. Scale bars: 40 μm. (C) Confocal scanning of peripheral macrophages in tails of Tg[EF1α:mCherry-zGem; mpeg1.1:EGFP] transgenic embryos at 36 hpf. Yellow arrows indicate mCherry-zGem and mpeg1.1:EGFP double-positive cells, whereas white arrows indicate only mpeg1.1:EGFP-positive cells. The bottom four panels are higher magnifications of the white square in the top-left panel. Scale bars: 20 μm. (D) The fraction of mCherry-zGem and mpeg1.1:EGFP double-positive cells among all mpeg1.1:EGFP-positive cells. We detected a total of 7 mpeg1.1:EGFP+ cells in the yolk area and 39 cells in the tail area of confocal scanning images obtained from different Tg[EF1α:mCherry-zGem; mpeg1.1:EGFP] transgenic embryos, and then calculated the fraction of mCherry-zGem and mpeg1.1:EGFP double-positive cells among all mpeg1.1:EGFP-positive cells. The average fraction of double-positive cells was 71.4 % for yolk and 61.5 % for tail. Thus, more than 60 % of peripheral macrophages undergo S phase in zebrafish embryos, suggesting that the Tg[EF1α:mCherry-zGem] transgenic system works as an indicator of cell-cycle phases in peripheral macrophages.
-
Figure 1—figure supplement 4—source data 1
Data for Figure 1—figure supplement 4D.
- https://cdn.elifesciences.org/articles/70550/elife-70550-fig1-figsupp4-data1-v1.xlsx
Figure 2 with 3 supplements
Microglial precursors migrate into the retina along blood vessels.
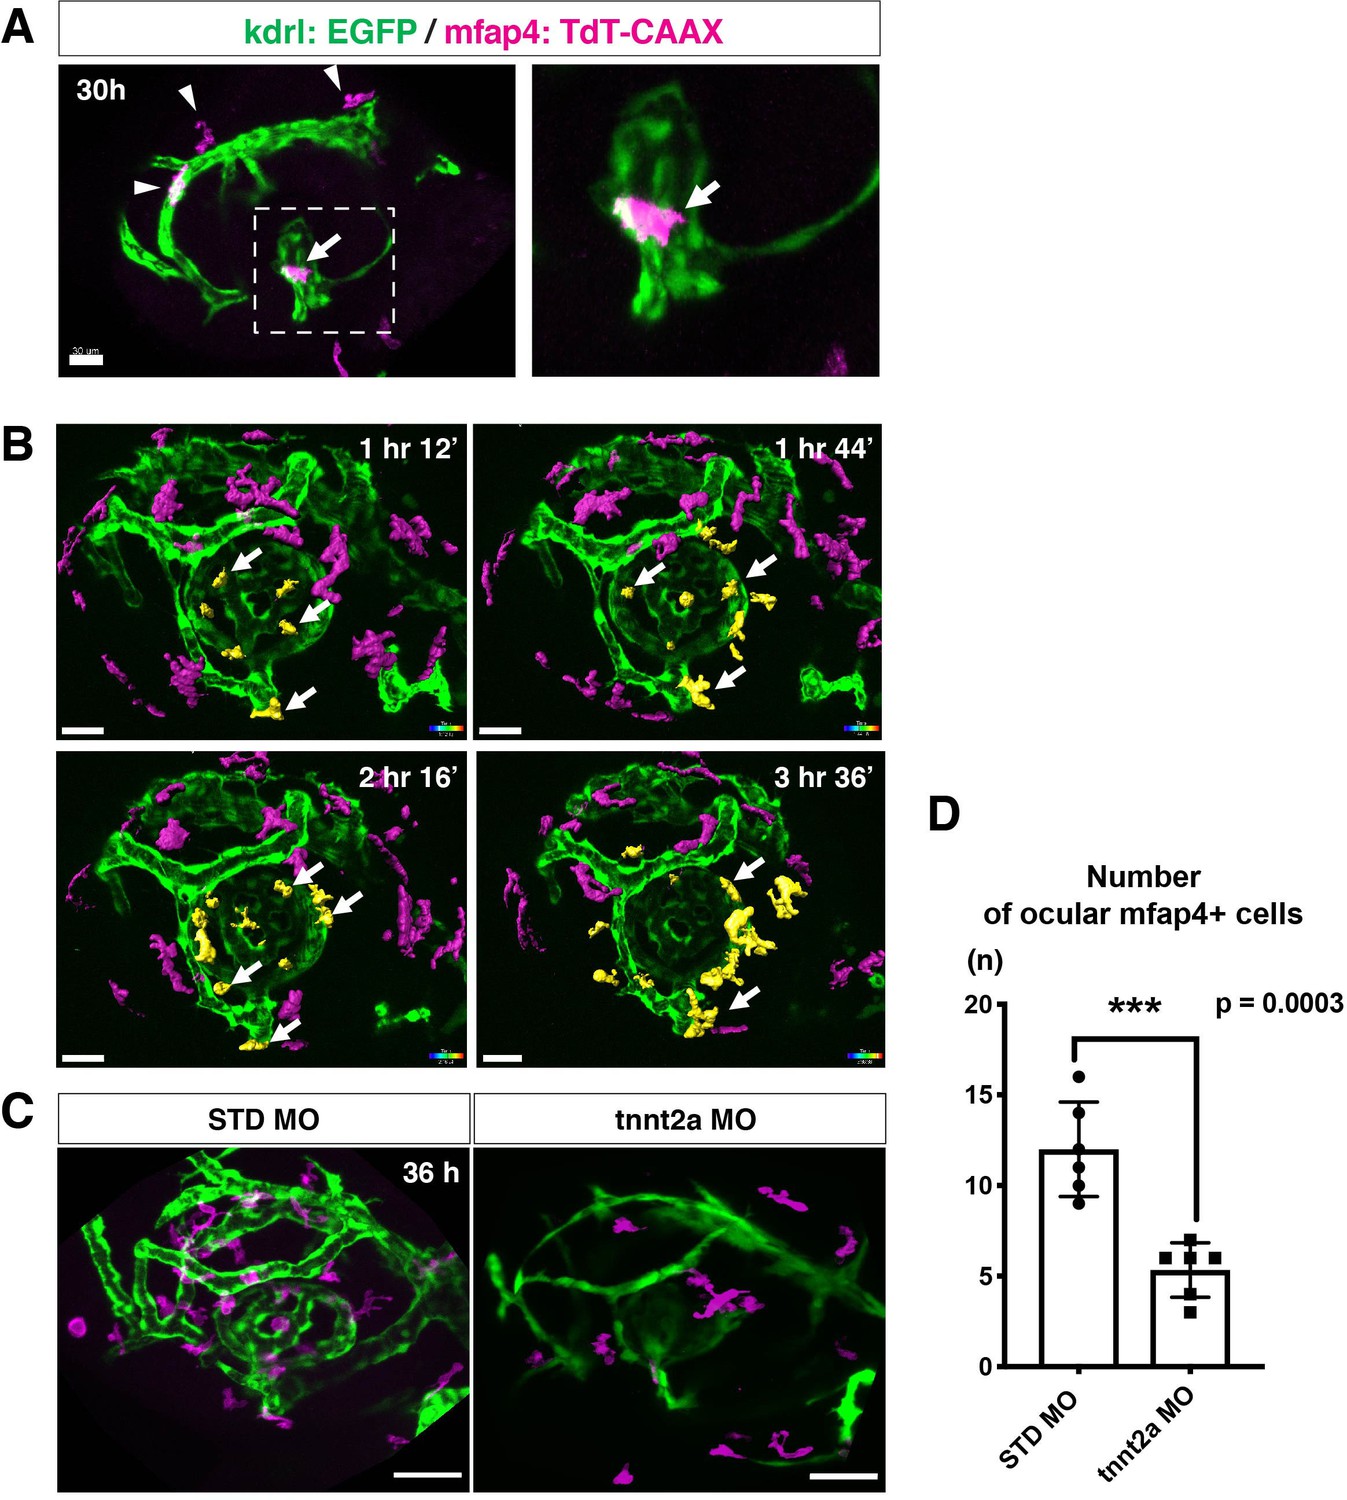
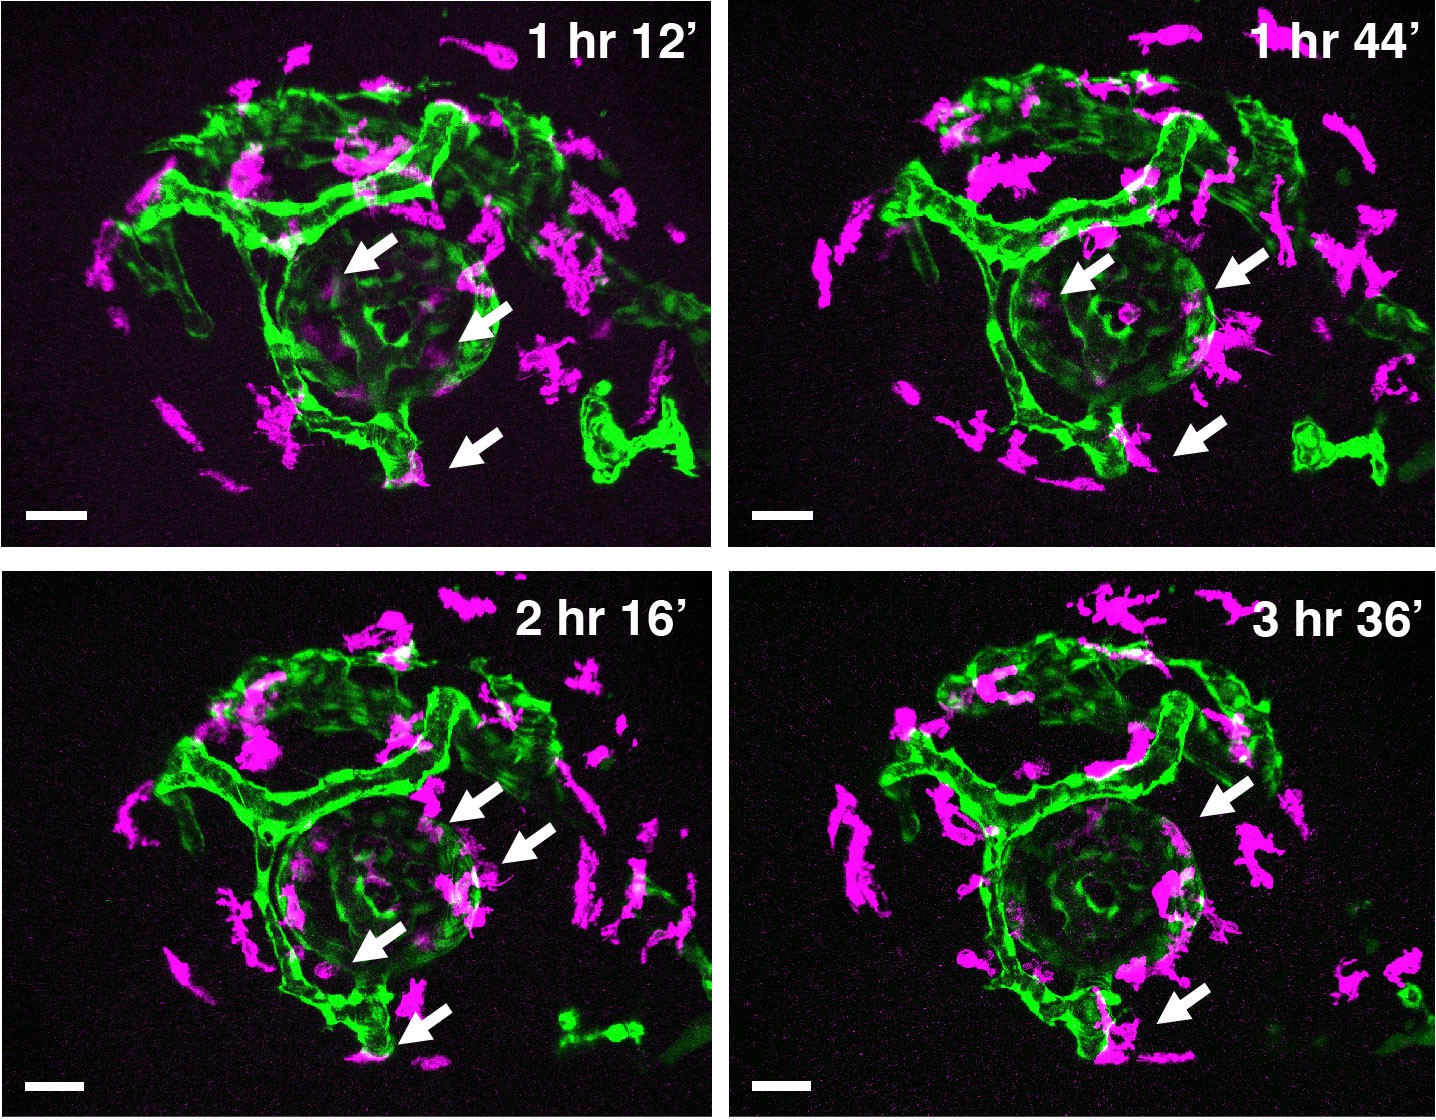
(A) Live confocal images of Tg[kdrl:EGFP; mfap4:tdTomato-CAAX] retinas at 30 hpf. Microglial precursors and blood vessels are visualized using fluorescence of mfap4tdTomato-CAAX (magenta) and kdrl:EGFP (green), respectively. Higher magnification image of a dotted square in the left panel is shown in the right panel. The first microglial precursor (arrow) approaches along developing hyaloid blood vessels near the lens through the choroid fissure. Arrowheads indicate peripheral macrophages outside the optic cup. Scale bar: 30 μm. (B) Time-lapse 3D snapshots of Tg[kdrl:EGFP; mfap4:tdTomato-CAAX] eyes for around 3.5 hr after 32 hpf. Ocular microglial precursors and peripheral macrophages outside the optic cup are indicated as yellow- and magenta-colored, surface-rendered objects, respectively, which were prepared from the original scanning image (Figure 2—figure supplement 1). Ocular blood vessels are visualized in green. Microglia associated with hyaloid blood vessels around the lens (white arrows) gradually increase and infiltrate neurogenic retinal tissue (Video 3). Scale bar: 30 μm. (C) Live 3D images of eyes of Tg[kdrl:EGFP; mfap4:tdTomato-CAAX] embryos injected with standard MO and tnnt2a MO. kdrl:EGFP-positive blood vessels (green) are thinner in tnnt2a morphants. Scale bar: 50 μm. (D) Histogram of the number of intraocular microglial precursors in embryos injected with standard MO and tnnt2a MO. Bars and lines indicate means ± SD. ***p < 0.001.
-
Figure 2—source data 1
Data for Figure 2D.
- https://cdn.elifesciences.org/articles/70550/elife-70550-fig2-data1-v1.xlsx
Figure 2—figure supplement 1
Time-lapse snapshots of Tg[kdrl:EGFP; mfap4:tdTomato-CAAX] heads for around 3.5 hr after 32 hpf.
Original confocal 3D scanning images of Figure 2B. Microglial precursors and peripheral macrophages (magenta) and blood vessels (green) are visualized. Arrows indicate microglial precursors associated with hyaloid blood vessels around the lens, which are indicated as surface-rendered objects in yellow in Figure 2B. Scale bar: 30 μm.
Figure 2—figure supplement 2

Microglial precursor colonization of the optic tectum does not depend on blood vessel formation.
(A) Live images of the optic tectum of Tg[kdrl:EGFP; mfap4:tdTomato-CAAX] embryos injected with standard MO and tnnt2a MO at 48 and 72 hpf. The optic tectum area is indicated by a dotted line. Blood vessels (green) are visualized with kdrl:EGFP and were thinner in tnnt2a morphants. In the standard MO-injected control embryos, the number of mfap4:tdTomato-CAAX-positive microglial precursors was 5.2 ± 1.3 at 48 hpf and increased to 33.5 ± 9.1 at 72 hpf, indicating progressive colonization of the optic tectum during development. On the other hand, the number of microglial precursors in the optic tectum was 17.8 ± 3.7 at 48 hpf and higher in tnnt2a morphants than in control embryos. Furthermore, their shape was round rather than ramified, suggesting activation of microglial precursors. This observation implies that microglial colonization of the optic tectum is enhanced when blood vessel function is compromised. However, the number of microglial precursors was 23.3 ± 5.6 in tnnt2a morphant optic tectum at 72 hpf, and microglial precursors still showed a round shape. Since microglial precursors show a phagocytic morphology in tnnt2a morphants and apoptosis normally promotes microglial colonization of the optic tectum in zebrafish, increased apoptosis may enhance microglial colonization of the optic tectum in tnnt2a morphants at 48 hpf. Scale bar: 50 μm. (B) Histogram of the number of optic tectum-resident microglial precursors in embryos injected with standard MO and tnnt2a MO. The number was significantly higher in tnnt2a morphants than in standard MO-injected embryos at 48 hpf; however, as reported in previous studies by other groups, there was no statistical difference between standard MO-injected embryos and tnnt2a morphants at 72 hpf. Bars and lines indicate means ± SD. ***p < 0.001. (C) Embryonic morphology of embryos injected with standard MO and tnnt2a morphants at 48 and 72 hpf.
-
Figure 2—figure supplement 2—source data 1
Data for Figure 2—figure supplement 2B.
- https://cdn.elifesciences.org/articles/70550/elife-70550-fig2-figsupp2-data1-v1.xlsx
Figure 2—figure supplement 3
Elimination of microglial precursors does not affect ocular blood vessel formation.
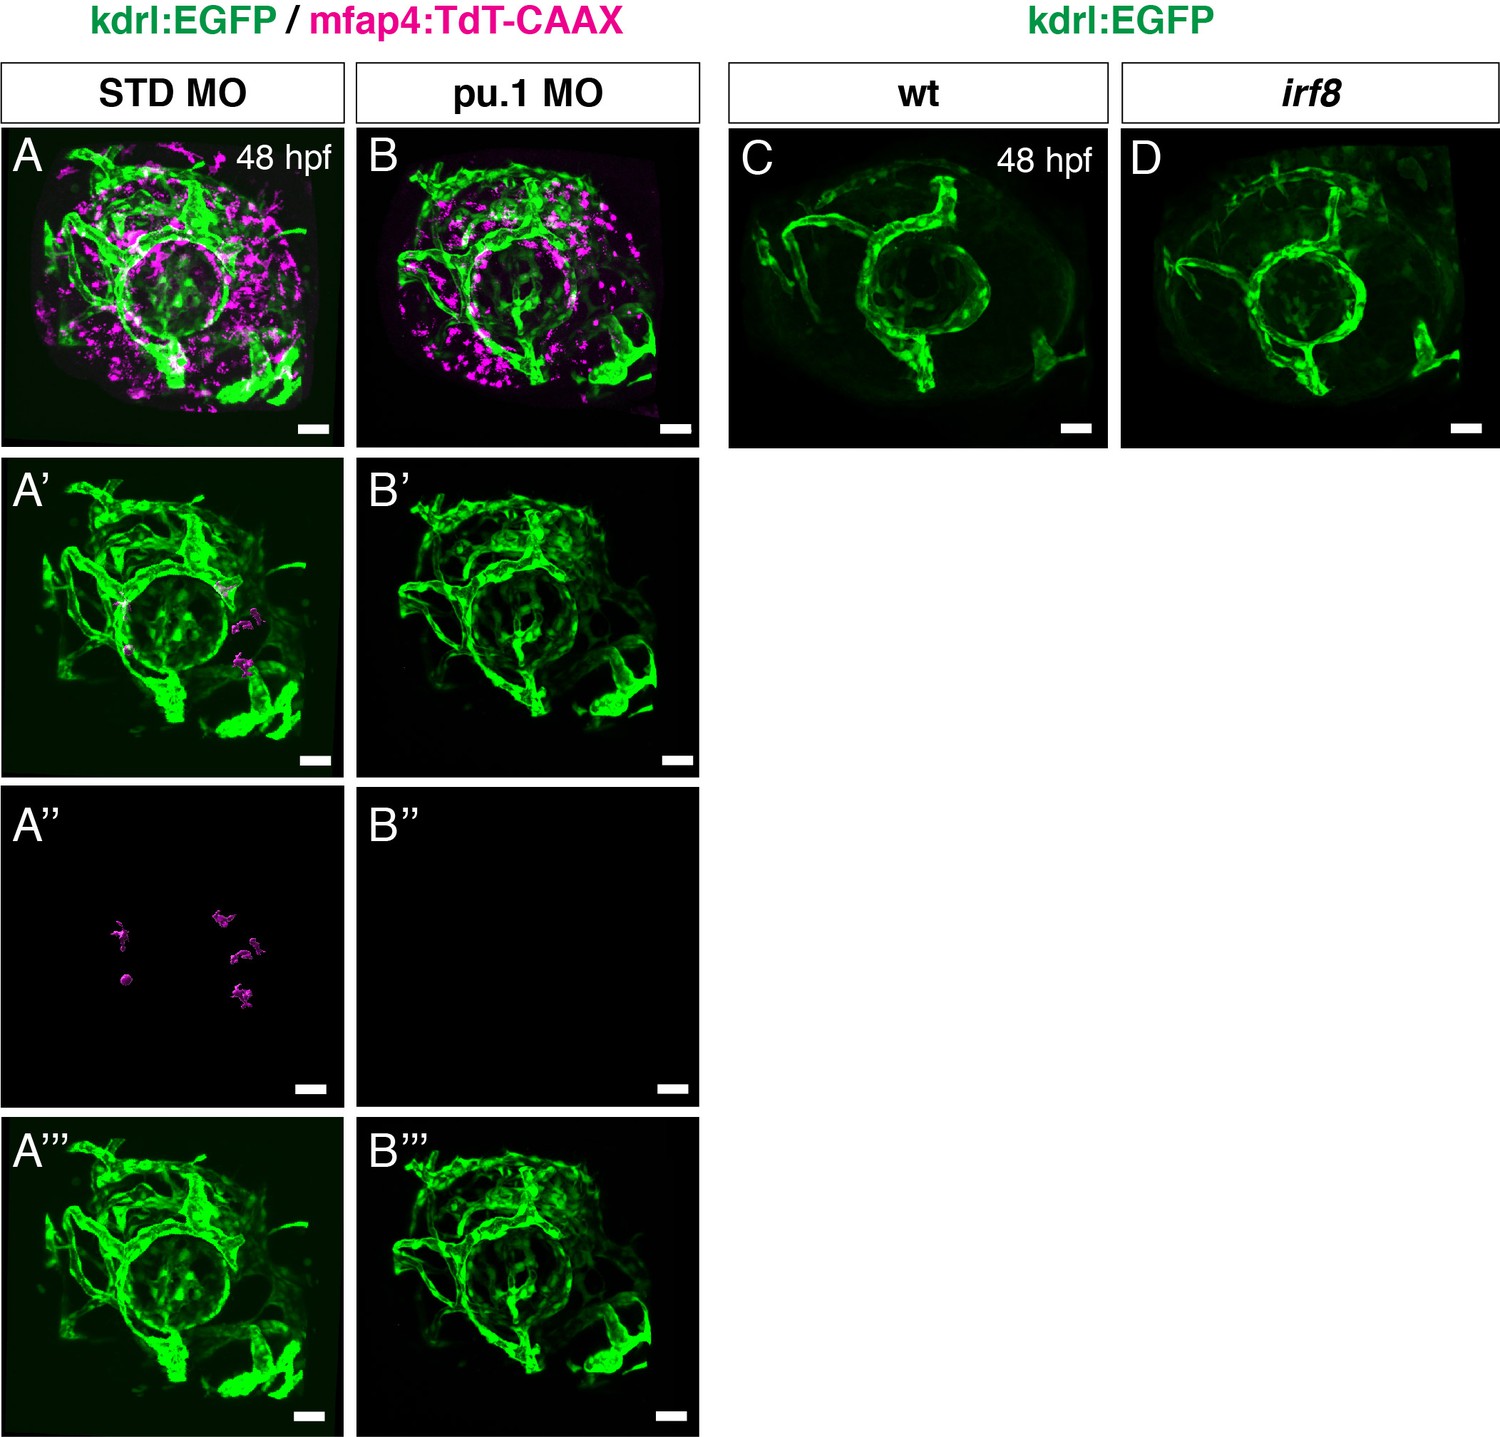
(A, B) Confocal 3D scanning images of Tg[kdrl:EGFP; mfap4:tdTomato-CAAX] transgenic retinas injected with standard control MO (A) and pu.1 MO (B) at 48 hpf. mfap4:tdTomato-CAAX signals indicate ocular microglial precursors and peripheral macrophages outside the optic cup; however, scanning with mfap4:tdTomato-CAAX after 48 hpf also detects noise signal caused by reflection of iridophore pigment cells, which are positioned surrounding the optic cup. (A’, B’) 3D images of kdrl:EGFP-positive ocular blood vessels and mfap4:tdTomato-CAAX surface-rendered objects indicating ocular microglial precursors in retinas injected with standard control MO (A) and pu.1 MO (B). To prepare surface-rendered objects indicating ocular microglial precursors, we digitally removed noise signals caused by reflection of iridophore pigment cells as well as peripheral macrophages outside the optic cup, using the surface-rendering tool of Imaris software (Bitplane) (see the legend of Figure 4—figure supplement 3). (A’’, B’’) Only mfap4:tdTomato-CAAX surface-rendered objects indicating ocular microglial precursors in (A’, B’) are shown. (A’’’, B’’’) Only kdrl:EGFP positive ocular blood vessels in (A’, B’) are shown. Ocular blood vessels are normally formed in pu.1 morphants, suggesting that ocular blood vessel formation is independent of microglial precursor differentiation at least by 48 hpf. (C, D) Confocal 3D scanning images of Tg[kdrl:EGFP] transgenic retinas combined with irf8 mutants (D) and wild-type siblings (C) at 48 hpf. Ocular blood vessels visualized with Tg[kdrl:EGFP] are normally formed in irf8 mutants, suggesting that ocular blood vessel formation is independent of microglial precursor differentiation. Scale bars: 30 μm.
Figure 3 with 3 supplements
Microglial precursors infiltrate the retina through the neurogenic area.
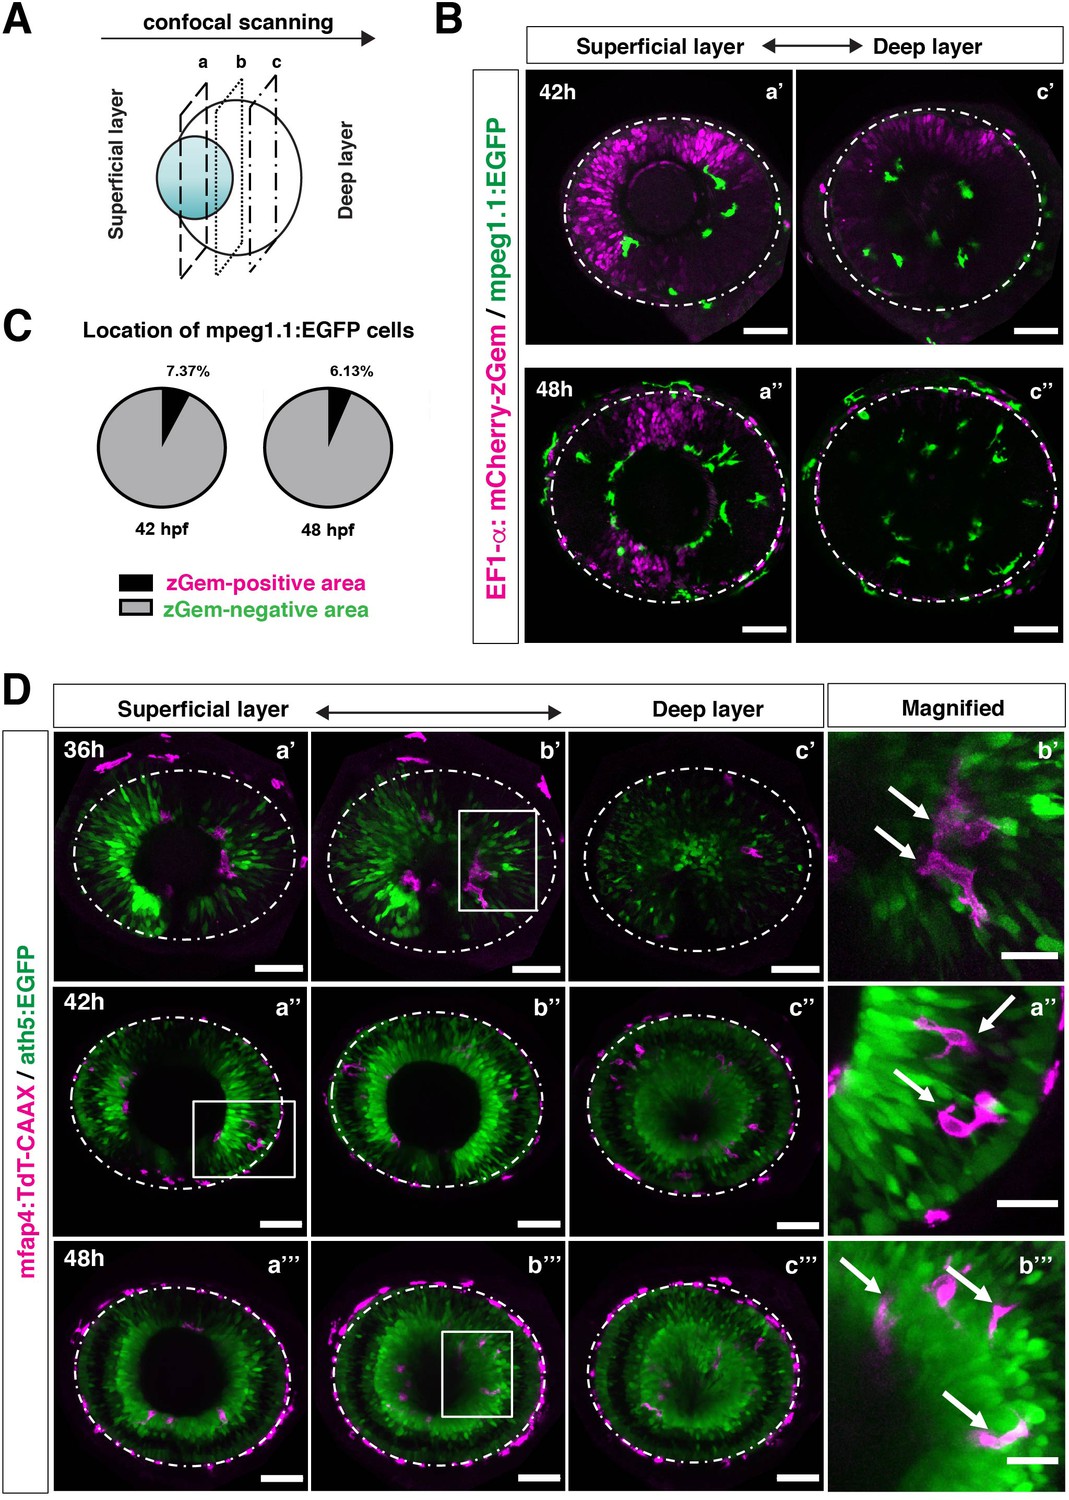
(A) Schematic drawing of confocal scanning planes (superficial, middle, and deep layers) in the optic cup shown in (B) and (D). (B) Live images of Tg[EF1α:mCherry-zGem; mpeg1.1:EGFP] retinas at 42 hpf (upper panels) and 48 hpf (lower panels). Two levels of confocal scanning planes are indicated as superficial (a’, a’’) and deep positions (c’, c’’). mpeg1.1:EGFP positive microglial precursors avoid mCherry-zGem positive proliferating retinal cell area. Scale bar: 50 μm. (C) Histogram of the fraction of microglial precursors associated with the mCherry-zGem-positive area (black) and the mCherry-zGem-negative area (grey). The fraction of microglial precursors associated with the mCherry-zGem-positive area is only 7.37 % at 42 hpf and 6.13 % at 48 hpf. Thus, more than 90 % of microglial precursors are located in the mCherry-zGem-negative retinal area. (D) Live images of Tg[ath5:EGFP; mfap4:tdTomato-CAAX] retinas at 36 (upper panels), 42 (middle panels) and 48 hpf (bottom panels). Three confocal scanning plane levels are indicated as superficial (a’-a”’), middle (b’-b”’), and deep (c-c”’). Dotted circles indicate the outline of the optic cup. The right-most column images indicate higher magnification images shown in the square of left panels. mfap4-positive microglia (magenta, arrows) are closely associated with ath5-positive neurogenic cells (green). Scale bar: 50 μm, except the right-most column images (Scale bar: 15 μm).
-
Figure 3—source data 1
Data for Figure 3C.
- https://cdn.elifesciences.org/articles/70550/elife-70550-fig3-data1-v1.xlsx
Figure 3—figure supplement 1
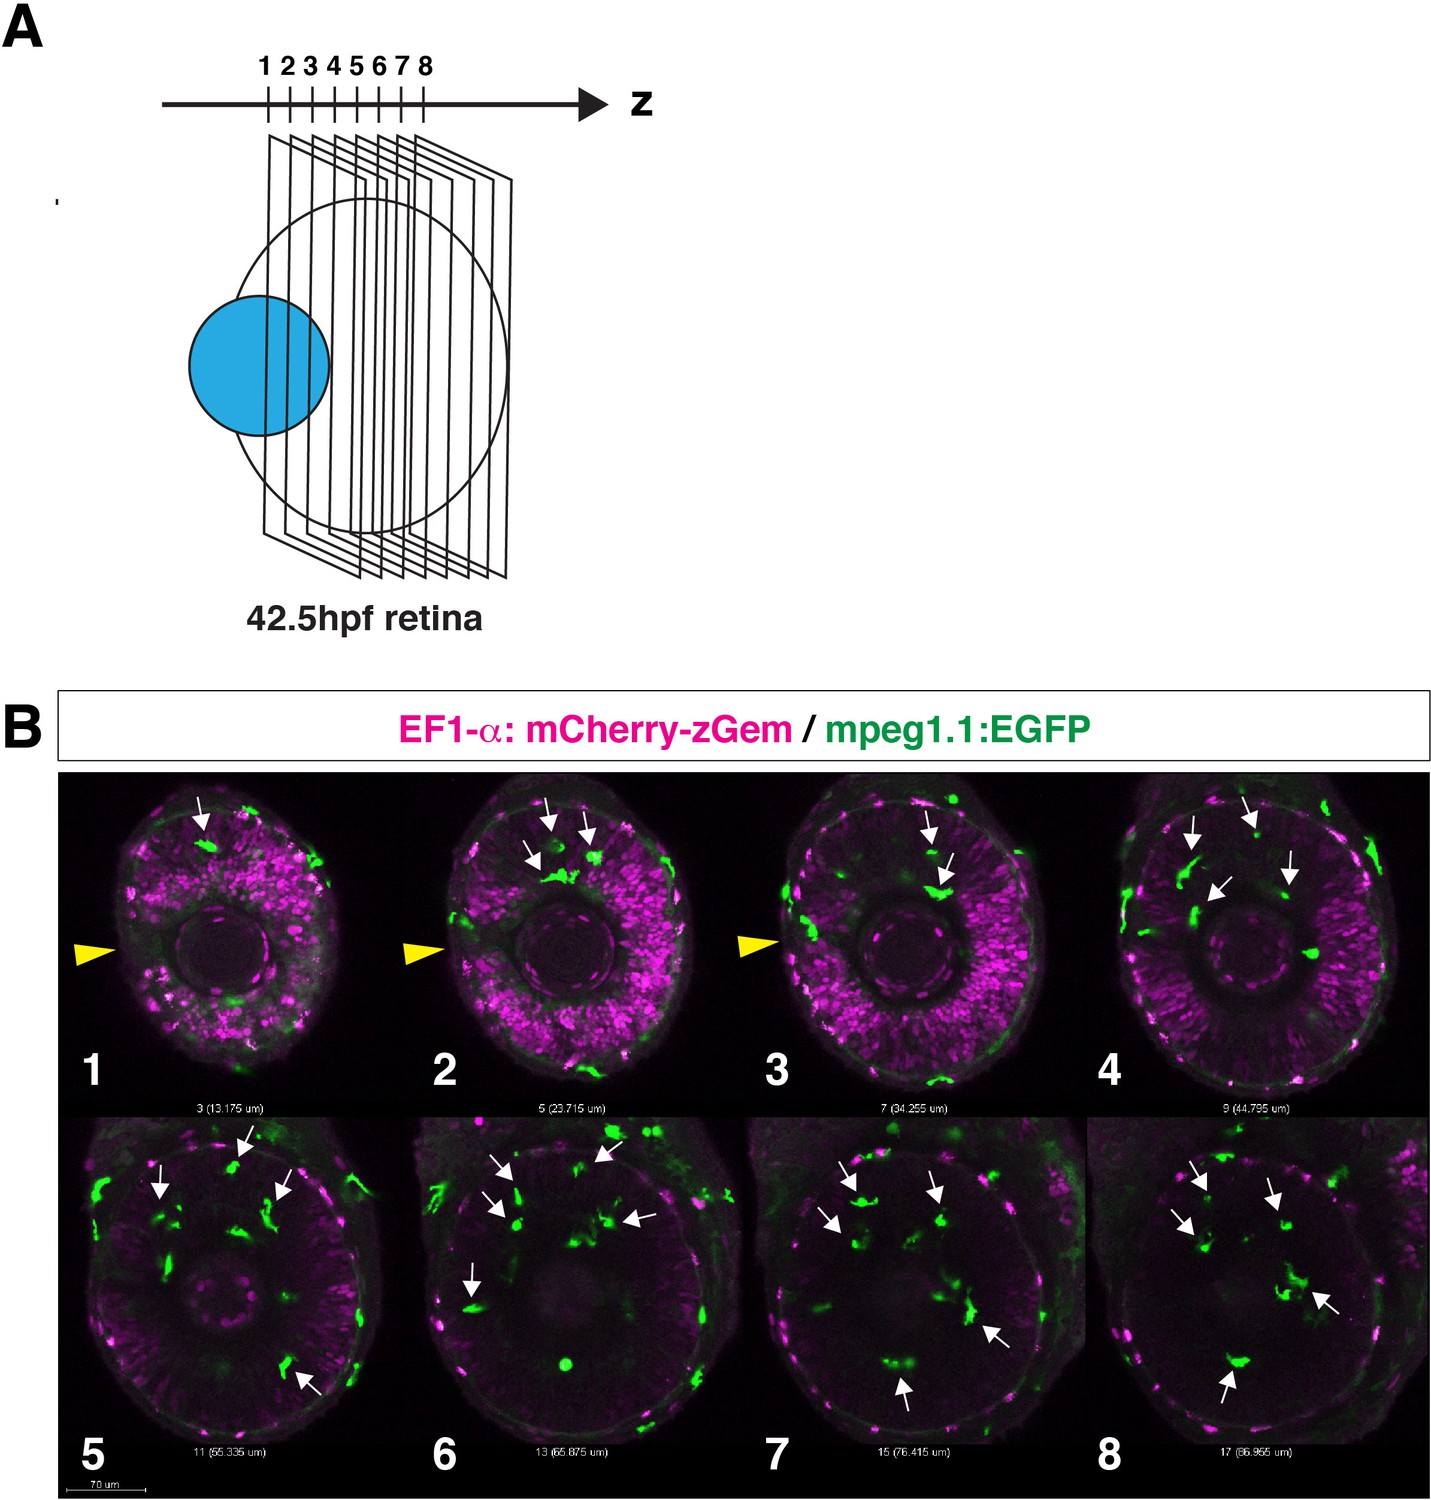
Microglial precursors infiltrate the neural retina through the neurogenic region.
(A) Confocal scanning of the neural retina along the Z-axis. (B) Scanning images of Tg[EF1α:mCherry-Gem; mpeg1.1:EGFP] transgenic retinas. Panels 1–8 indicate the Z axis-position of the confocal scanning plane shown in (A). Yellow arrowheads indicate the choroid fissure. Microglial precursors (green, arrows) infiltrate the neural retina through the mCherry-Gem (magenta)-negative region, suggesting that microglial precursors infiltrate the neural retina through the neurogenic region. Scale bar: 70 μm.
Figure 3—figure supplement 2
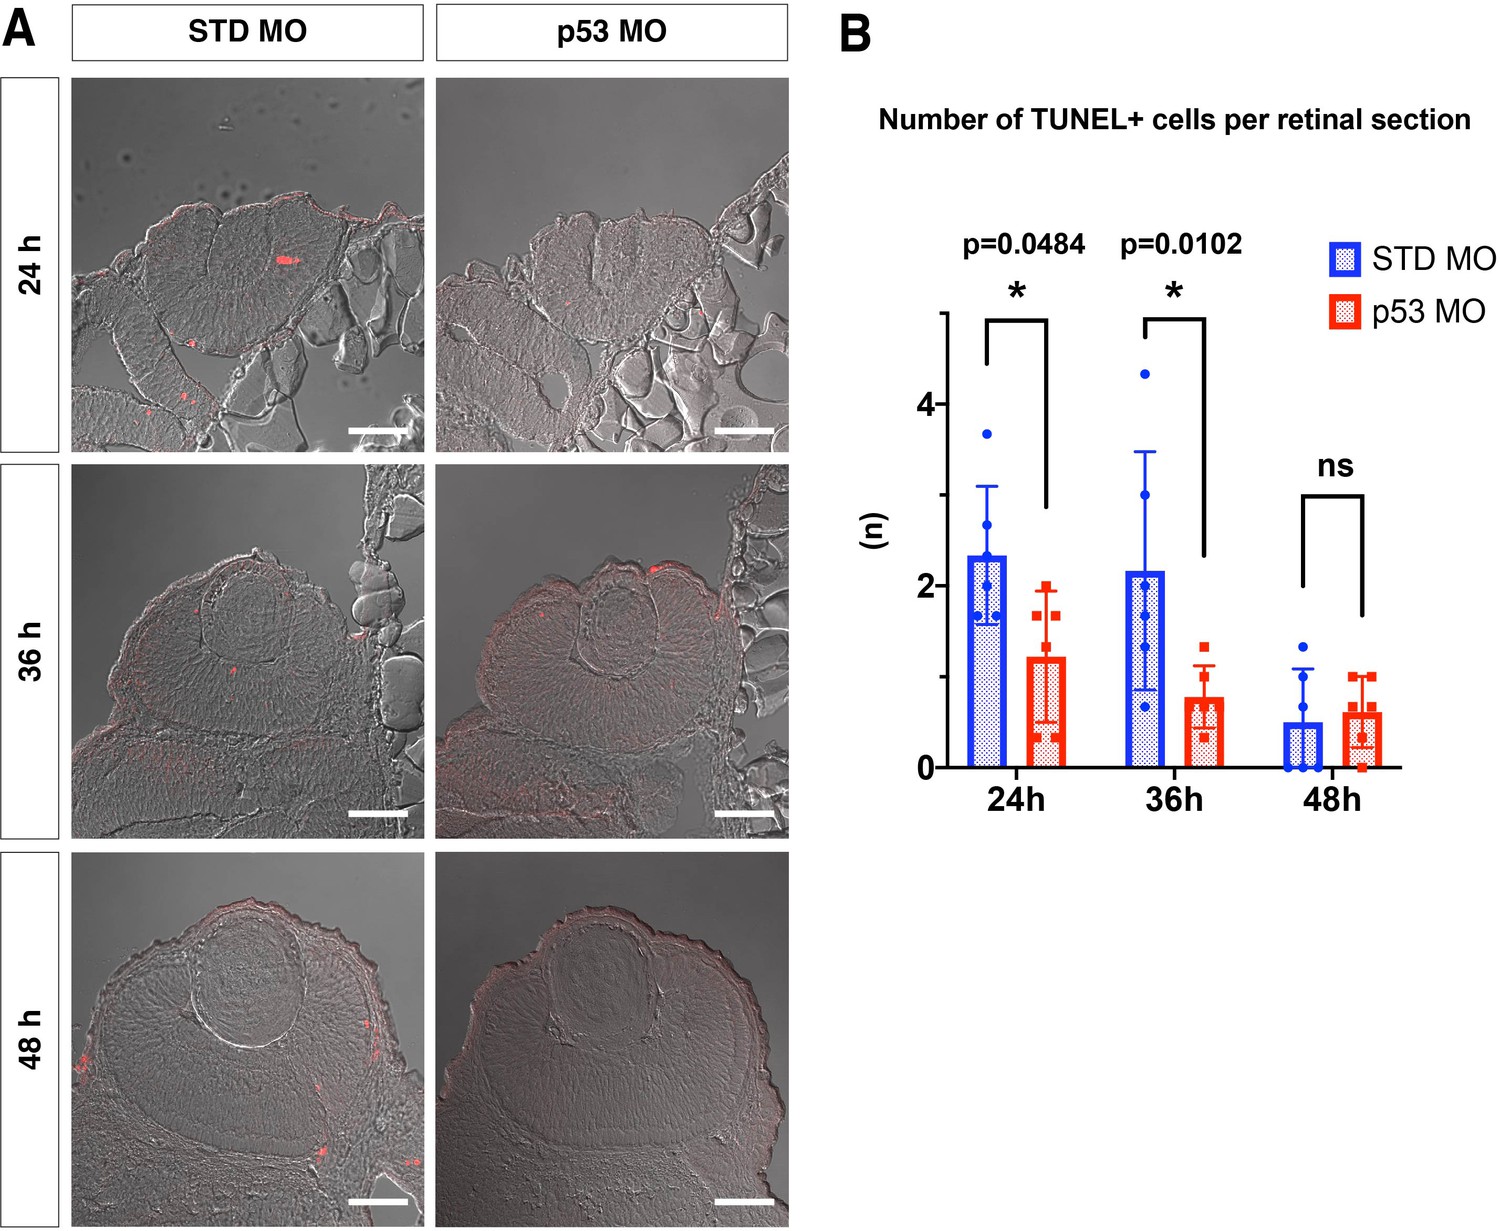
p53 MO effectively inhibits retinal apoptosis in zebrafish.
(A) TUNEL (red) of retinas injected with standard MO and p53 MO at 24, 36, and 48 hpf. Scale bars: 30 μm. (B) The number of TUNEL-positive cells per a retinal section of embryos injected with standard MO and p53 MO at 24, 36, and 48 hpf. The number of TUNEL-positive cells was significantly lower in p53 morphant retinas than in standard MO injected retinas at 24 and 36 hpf. However, the number of TUNEL-positive cells was low in both retinas injected with standard MO and p53 MO at 48 hpf, indicating no statistical difference between them. Bars and lines indicate means ± SD. *p < 0.05.
-
Figure 3—figure supplement 2—source data 1
Data for Figure 3—figure supplement 2B.
- https://cdn.elifesciences.org/articles/70550/elife-70550-fig3-figsupp2-data1-v1.xlsx
Figure 3—figure supplement 3
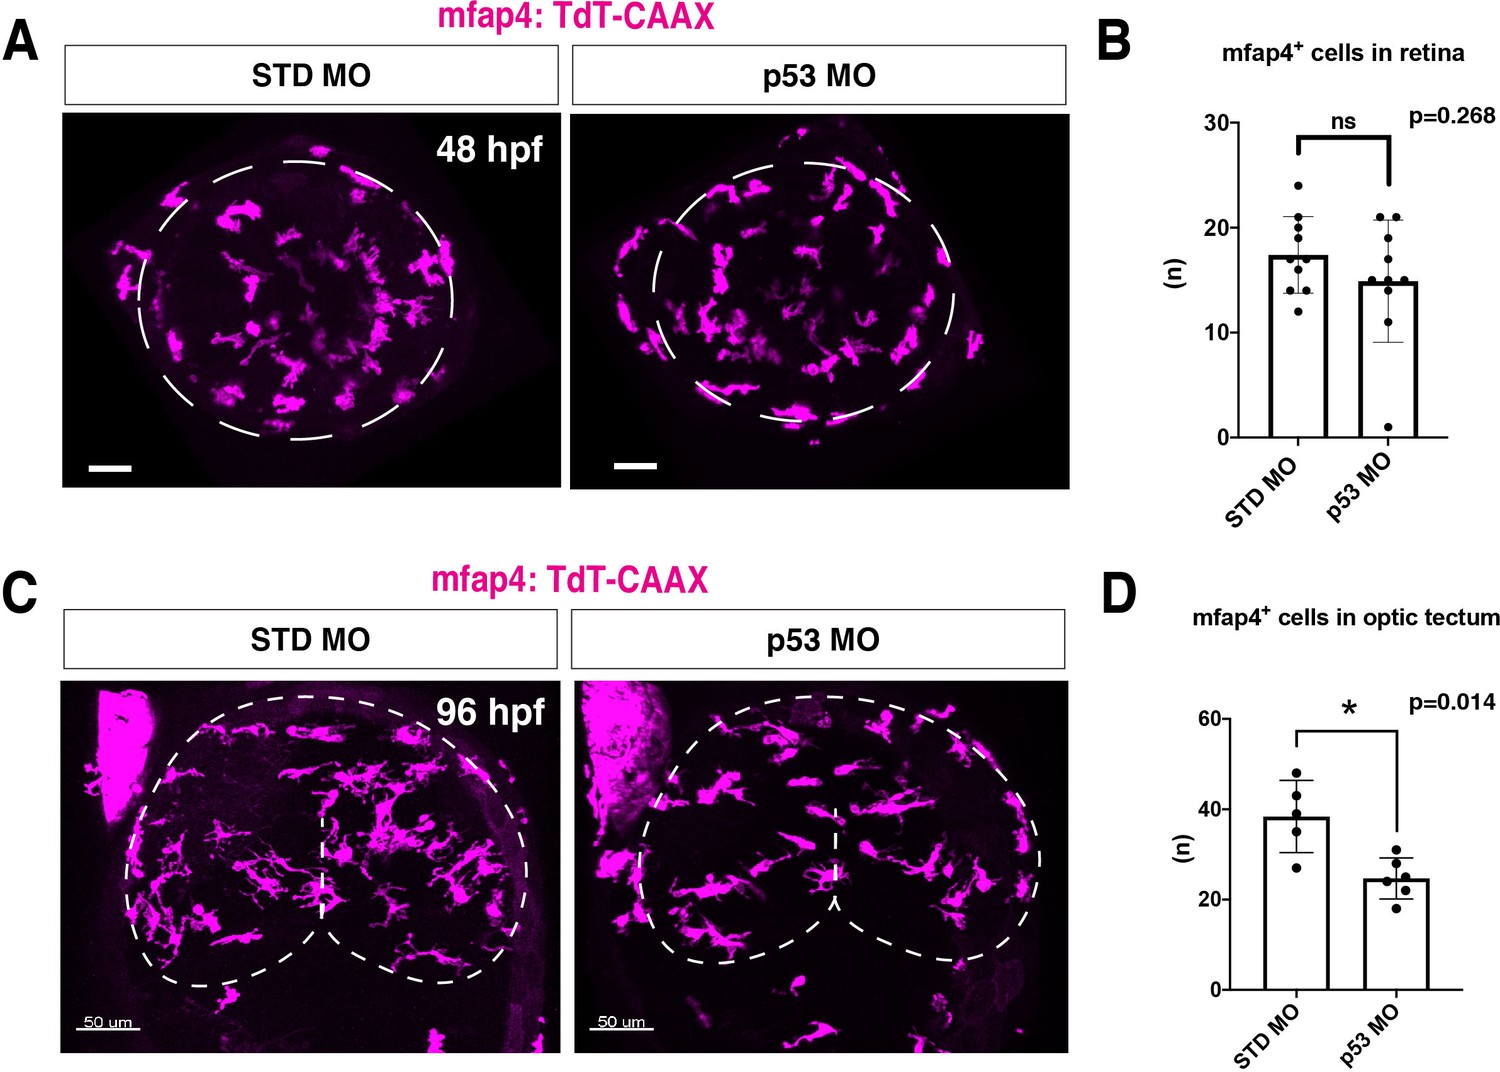
Microglial precursor colonization depends on apoptosis in the optic tectum, but not in the retina.
(A) Confocal scanning images of Tg[mfap4:tdTomato-CAAX] transgenic retinas injected with standard MO and p53 MO at 48 hpf. Scale bars: 30 μm. (B) Histogram of the number of ocular mfap4:tdTomato-CAAX+ cells at 48 hpf. There is no significant difference between standard MO-injected retinas and p53 morphant retinas, suggesting that apoptosis is not a major attractant for microglial precursors migrating to the retina. Bars and lines indicate means ± SD. (C) Confocal scanning images of a Tg[mfap4:tdTomato-CAAX] transgenic optic tectum injected with standard MO and p53 MO at 96 hpf. The optic tectum area is outlined. Scale bars: 50 μm. (D) Histogram of the number of optic tectum-resident mfap4:tdTomato-CAAX+ cells at 96 hpf. The number of optic tectum-resident microglial precursors is significantly lower in p53 morphants, suggesting that microglial precursor colonization of the optic tectum depends on apoptosis. Bars and lines indicate means ± SD. *p < 0.05.
-
Figure 3—figure supplement 3—source data 1
Data for Figure 3—figure supplement 3 B D.
- https://cdn.elifesciences.org/articles/70550/elife-70550-fig3-figsupp3-data1-v1.xlsx
Figure 4 with 8 supplements
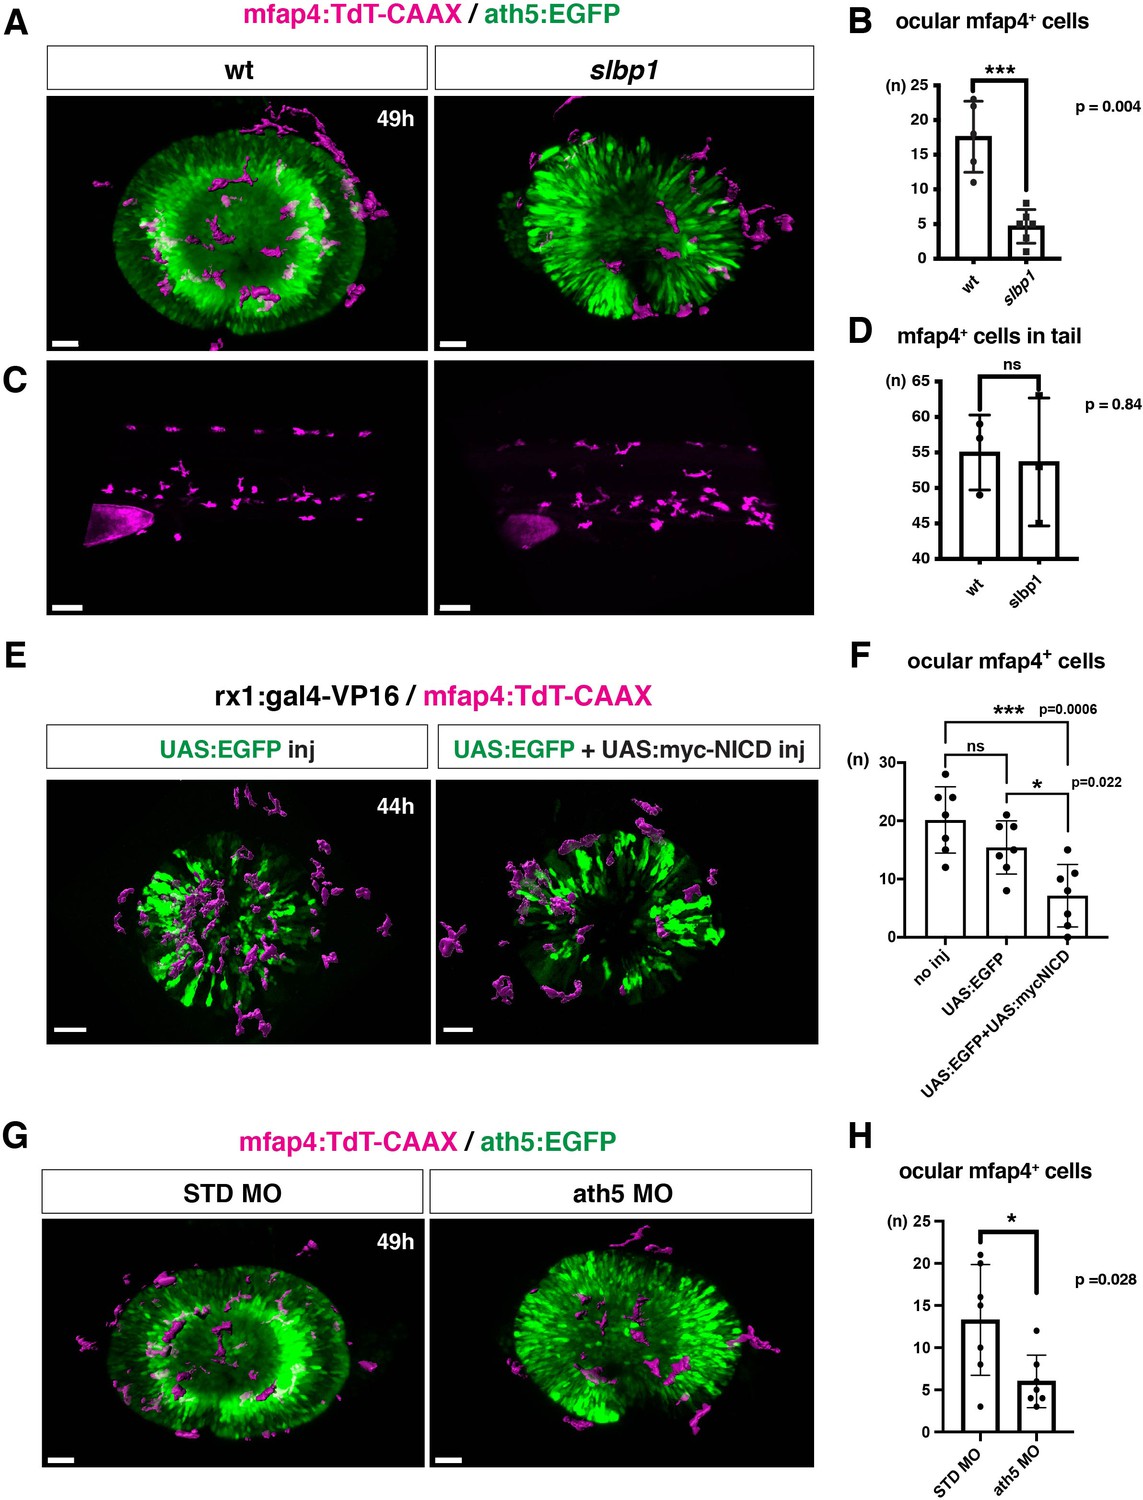
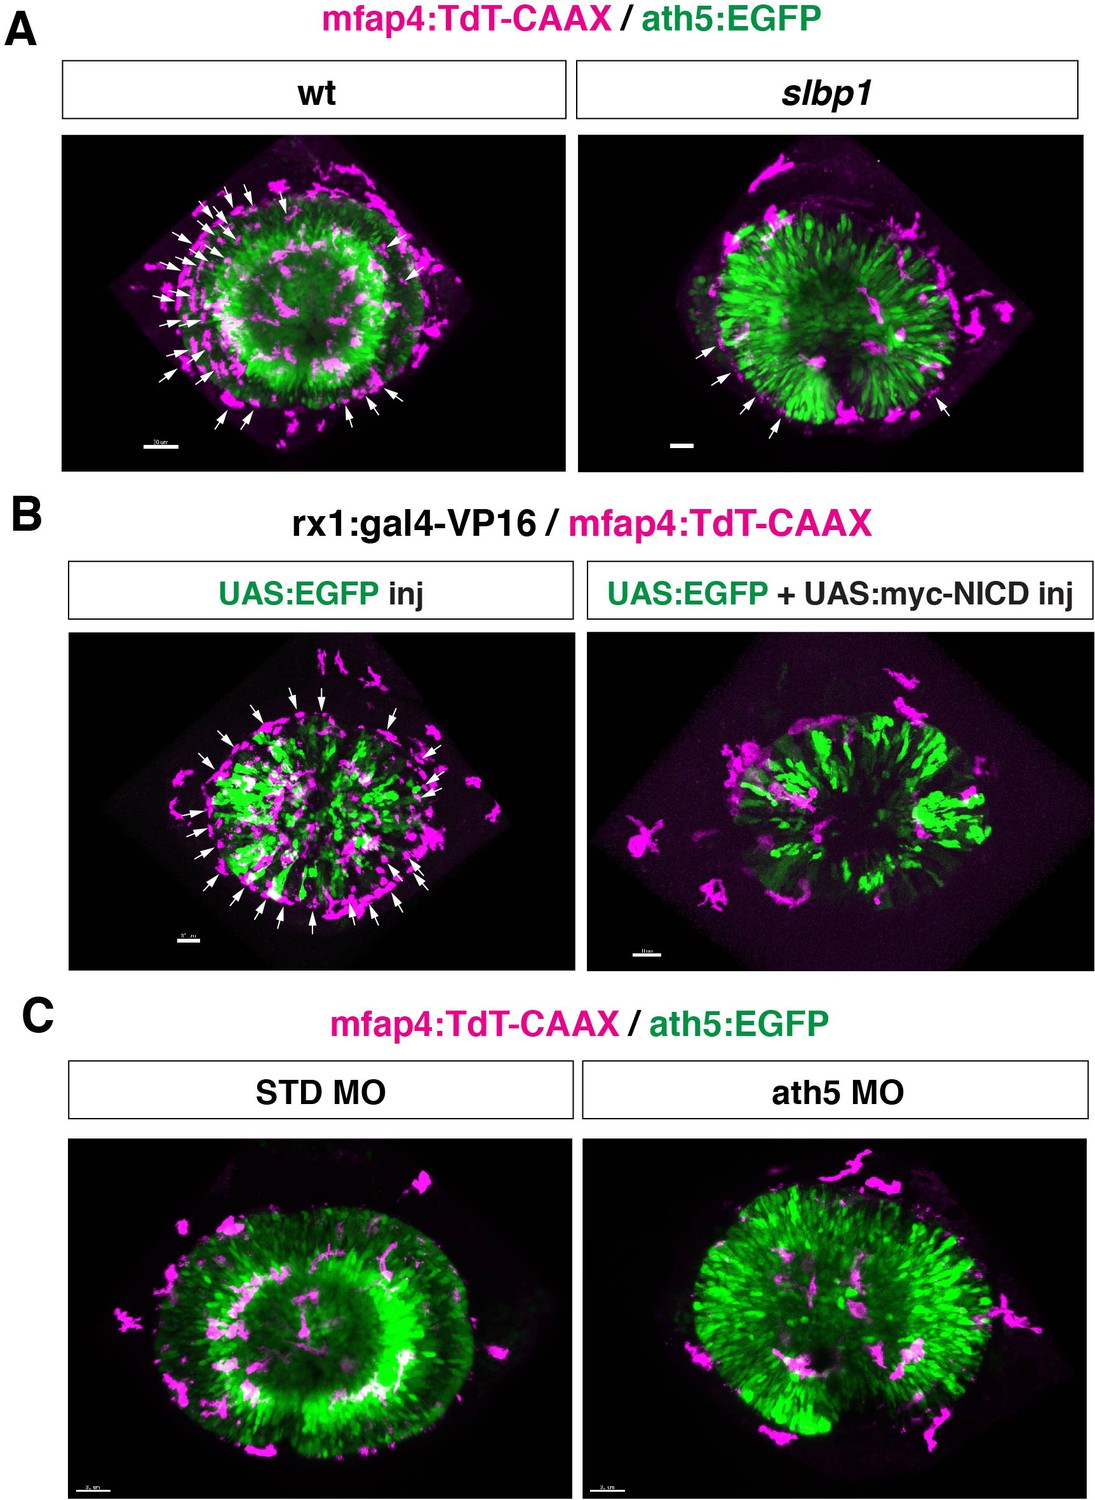
Microglial precursor infiltration into the retina depends on retinal neurogenesis.
(A) Live 3D images of wild-type and slbp1 mutant retinas with Tg[mfap4:tdTomato-CAAX; ath5:EGFP] at 49 hpf. Only mfap4:tdTomato-CAAX-positive ocular microglial precursors and peripheral macrophages are shown as surface-rendered objects. Original images are shown in Figure 4—figure supplement 2A. Scale bar: 30 μm. (B) Histogram of numbers of ocular microglial precursors in slbp1 mutants and wild-type siblings. mfap4-positive microglial precursors are significantly fewer in slbp1 mutants. Bars and lines indicate means ± SD. ***p < 0.001. (C) Live 3D images of wild-type and slbp1 mutant trunk with Tg[mfap4:tdTomato-CAAX; ath5:EGFP] at 49 hpf. Scale bar: 70 μm. (D) Histogram of numbers of trunk macrophages in slbp1 mutants and wild-type siblings. There is no significant difference in mfap4-positive macrophage number in trunks of slbp1 mutants. Bars and lines indicate means ± SD. (E) Live 3D images of retinas of Tg[rx1:gal4-VP16; mfap4:tdTomato-CAAX] embryos injected with one DNA construct encoding UAS:EGFP (left) or two DNA constructs encoding UAS:EGFP; UAS:myc-tagged NICD (right) at 44 hpf. Only mfap4:tdTomato-CAAX-positive ocular microglial precursors and peripheral macrophages are shown as surface-rendered objects. Original images are shown in Figure 4—figure supplement 2B. Scale bar: 30 μm. (F) Histogram of numbers of ocular microglial precursors in rx1:gal4-VP16; UAS:EGFP expressed and rx1:gal4-VP16; UAS:EGFP; UAS:myc-NICD expressed wild-type retinas. mfap4-positive microglia are significantly decreased in myc-NICD expressed retinas, compared with non-injection control and EGFP expressed control retinas. Bars and lines indicate means ± SD. *P < 0.05, ***P < 0.001. (G) Live 3D images of standard MO- and ath5 MO-injected retinas of Tg[mfap4:tdTomato-CAAX; ath5:EGFP] embryos at 49 hpf. Only mfap4:tdTomato-CAAX-positive ocular microglial precursors and peripheral macrophages are shown as surface-rendered objects. Original images are shown in Figure 4—figure supplement 2C. Scale bar: 30 μm. (H) Histogram of numbers of ocular microglial precursors in standard MO and ath5 MO-injected wild-type retinas. mfap4-positive microglial precursors are significantly less numerous in ath5 morphant retinas. Bars and lines indicate means ± SD. *p < 0.05.
-
Figure 4—source data 1
Data for Figure 4B.
- https://cdn.elifesciences.org/articles/70550/elife-70550-fig4-data1-v1.xlsx
-
Figure 4—source data 2
Data for Figure 4D.
- https://cdn.elifesciences.org/articles/70550/elife-70550-fig4-data2-v1.xlsx
-
Figure 4—source data 3
Data for Figure 4F.
- https://cdn.elifesciences.org/articles/70550/elife-70550-fig4-data3-v1.xlsx
-
Figure 4—source data 4
Data for Figure 4H.
- https://cdn.elifesciences.org/articles/70550/elife-70550-fig4-data4-v1.xlsx
Figure 4—figure supplement 1
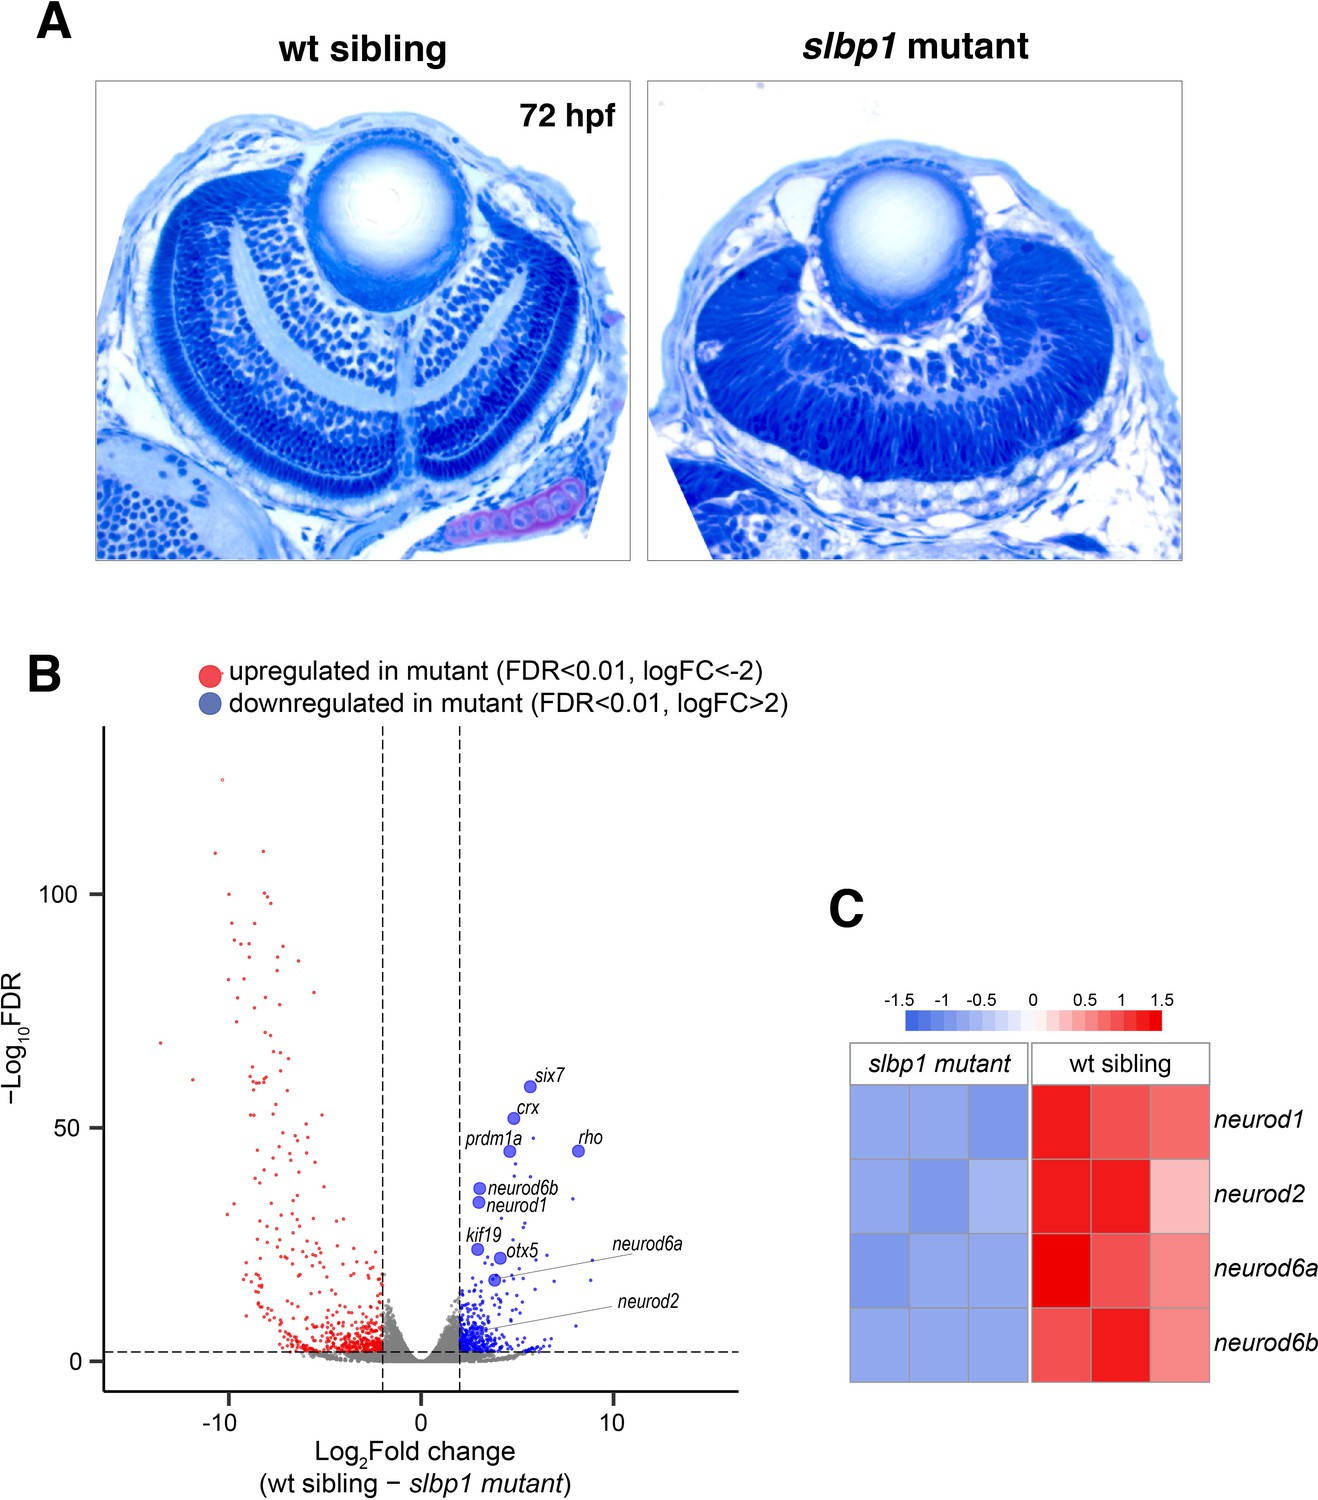
Retinal neurogenesis and cell differentiation are markedly delayed in zebrafish slbp1 mutants.
(A) Plastic sections of wild-type sibling and slbp1 mutant retinas at 72 hpf. In wild-type retinas, retinal lamination is formed, whereas only IPL is emerging in slbp1 mutant retinas, which are equivalent to wild-type retinas at 48 hpf. (B) Volcano plotting of up- (red) and down-regulated (blue) genes in slbp1 mutants, as determined by RNAseq analysis. Only genes of FDR < 0.01 and logFC>|2| are shown. Genes that promote neurogenesis and photoreceptor cell differentiation are downregulated. (C) Heat map of expression of four neurogenic genes; neurod1, neurod2, neurod6a, and neurod6b in wild-type siblings and slbp1 mutants. All four genes are decreased in slbp1 mutants.
Figure 4—figure supplement 2
Original scanning images of Figure 4A, E and G.
(A, B, C) Original confocal 3D scanning images of Figure 4A, E and G, respectively. Figure 4A, E and G show surface-rendered objects of mfap4:tdTomato-CAAX signals, which correspond to ocular microglial precursors and peripheral macrophages surrounding the optic cup. Arrows indicate noise signals derived from iridophore-mediated reflection, which are removed by the surface-rendering tool of Imaris in Figure 4A, E and G (See the legend of Figure 4—figure supplement 3). The number of iridophore-derived noise signals was generally lower in eyes of slbp1 mutants, myc-NICD overexpressing embryos and ath5 morphants than in their controls. It is likely that the timing of iridophore differentiation correlates with retinal development, so a delay of retinal neurogenesis may delay the timing of iridophore appearance. Scale bar: 30 μm for (A, B, C).
Figure 4—figure supplement 3
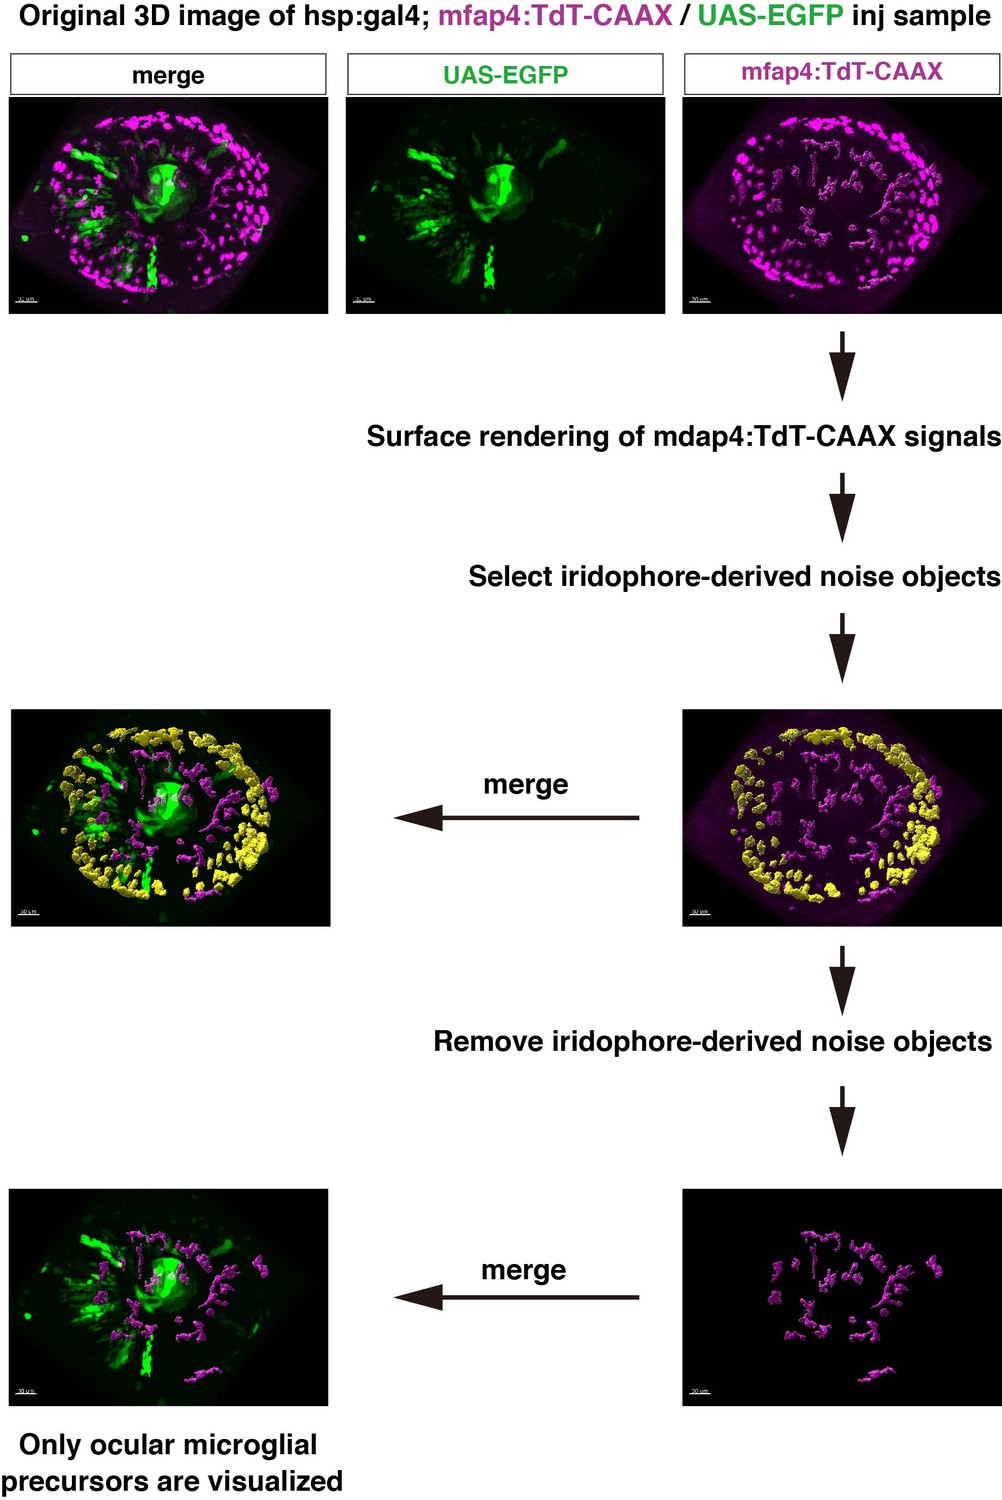
Extraction process of ocular microglial precursors from original 3D scanning images.
Confocal scanning of retinas with mfap4:tdTomato-CAAX after 48 hpf detects noise signals caused by reflection of iridophore pigment cells. In this case, we digitally removed iridophore pigment-derived noise from 3D scanning images. Using the Imaris surface-rendering tool (Bitplane), mfap4:tdTomato-CAAX signals are converted into surface-rendered objects. Surface-rendered objects corresponding to iridophore-derived signals are selected with the editing tool and are eliminated manually. Only mfap4:tdTomato-CAAX signals derived from ocular microglial precursors and peripheral macrophages surrounding the optic cup are retained, and merged to reconstruct 3D images.
Figure 4—figure supplement 4

Retinal apoptosis is increased in zebrafish slbp1 mutants.
(A) TUNEL of wild-type and slbp1 mutant retinas at 48 hpf. The number of TUNEL-positive signals (magenta) was high (n = 14.1 ± 7.4) in slbp1 mutant retinas, whereas it was normally low (n = 1.8 ± 1.3) in wild-type sibling retinas, suggesting that apoptosis is enhanced in slbp1 mutant retinas. Nuclei were counterstained with TOPRO3 (green). Scale bars: 30 μm. (B) The number of TUNEL-positive cells per retinal section. The number is significantly higher in slbp1 mutant retinas than in wild-type sibling retinas. Bars and lines indicate means ± SD. *p < 0.05.
-
Figure 4—figure supplement 4—source data 1
Data for Figure 4—figure supplement 4B.
- https://cdn.elifesciences.org/articles/70550/elife-70550-fig4-figsupp4-data1-v1.xlsx
Figure 4—figure supplement 5

Microglial precursor colonization of the retina is independent of the Cxcl12a signaling pathway.
(A) Anti-acetylated tubulin antibody labeling of 72 hpf retinas injected with standard MO and cxcl12a MO. Arrowheads indicate RGC axons. In cxcl12a morphants, an abnormal trajectory of RGC axons inside the retina. Scale bars: 30 μm. (B) ath5:EGFP expression in frontally viewed heads of embryos injected with standard MO and cxcl12a MO at 72 hpf. ath5:EGFP labels RGCs and their axons, which normally exit from the optic cup and create a chiasm at the midline. cxcl12a morphants show an abnormal trajectory of RGC axons inside the retina (arrowheads). Scale bars: 30 μm. (C) Confocal scanning images of Tg[mpeg1.1:EGFP] transgenic retinas injected with standard control MO and cxcl12a MO at 48 hpf. Scale bars: 30 μm. (D) Histogram of the number of ocular mpeg1.1:EGFP+ cells. There is no significant difference between standard MO-injected retinas and cxcl12a morphant retinas, suggesting that Cxcl12a signaling is not involved in microglial precursor colonization of the retina. Bars and lines indicate means ± SD.
-
Figure 4—figure supplement 5—source data 1
Data for Figure 4—figure supplement 5D.
- https://cdn.elifesciences.org/articles/70550/elife-70550-fig4-figsupp5-data1-v1.xlsx
Figure 4—figure supplement 6

Elimination of microglial precursors does not affect retinal cell differentiation.
Labeling of pu.1 morphant retinas with zpr1 antibody, ath5:EGFP and mfap4:tdTomato-CAAX. mapf4:tdTomato-CAAX+ microglia are absent in pu.1 morphants. However, ath5:EGFP and zrp1 expression are normally observed in pu.1 morphants, suggesting that elimination of microglia does not affect retinal cell differentiation. Scale bar: 30 μm.
Figure 4—figure supplement 7
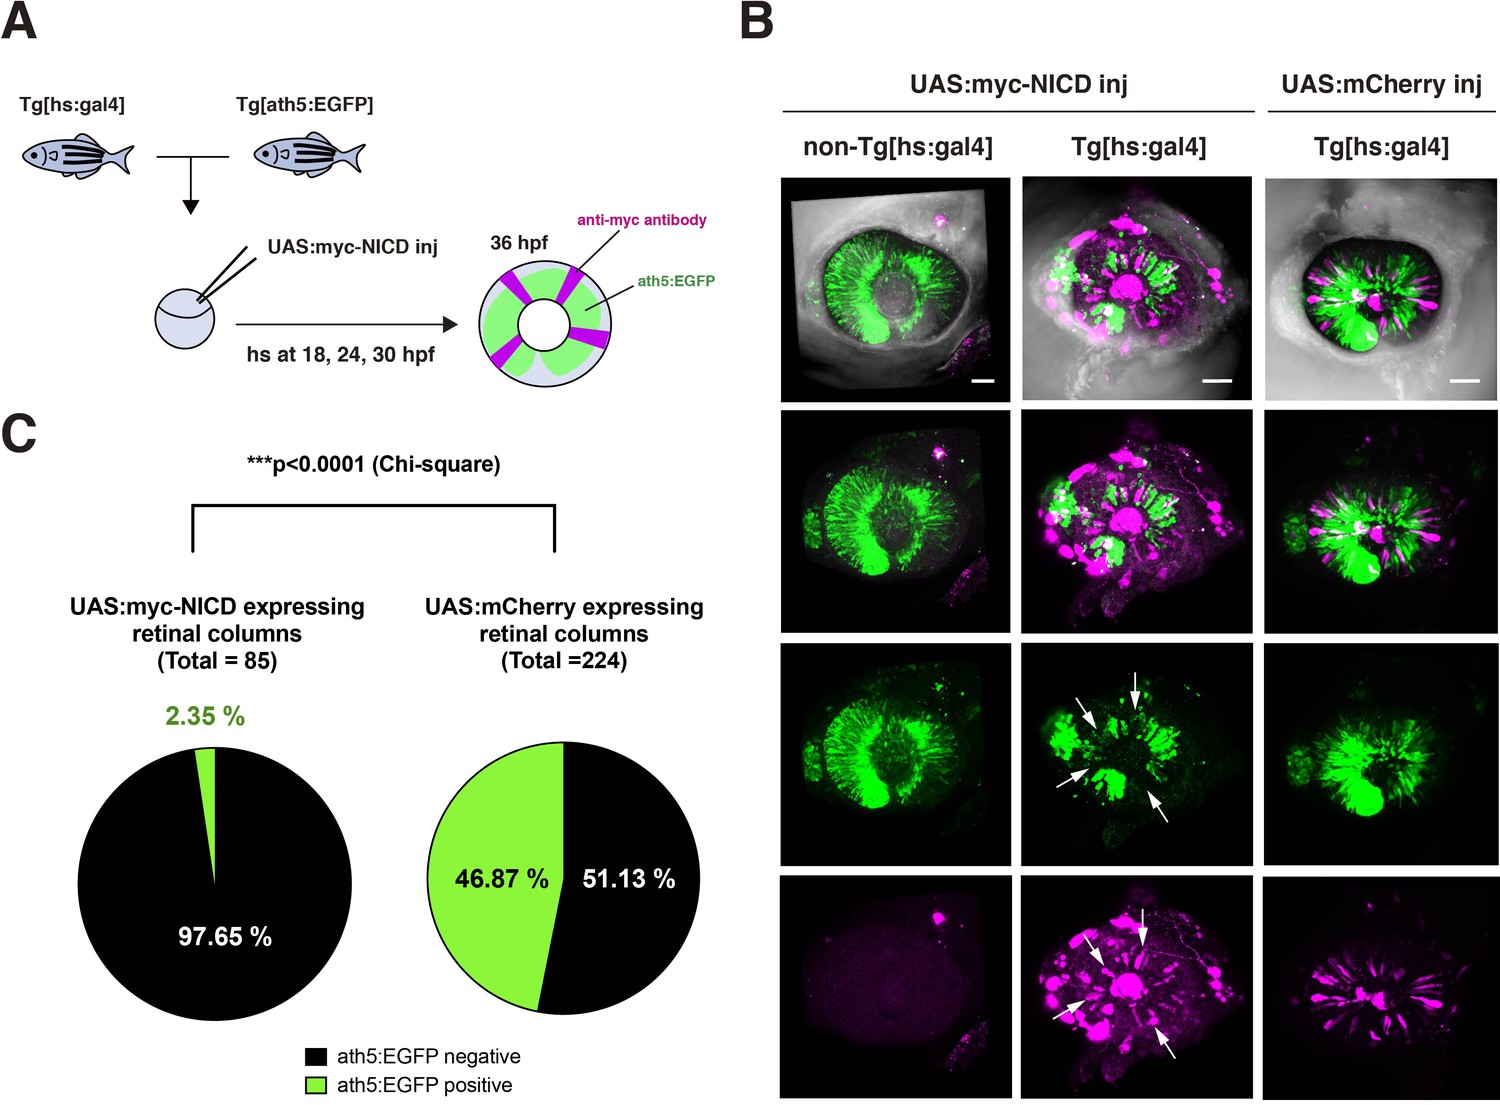
Overexpression of NICD suppresses retinal neurogenesis in zebrafish.
(A) Experimental design of overexpression of NICD in zebrafish retinas. A DNA construct encoding UAS:myc-NICD was injected into fertilized eggs produced by pairwise crosses of Tg[ath5:EGFP] and Tg[hsp:gal4] transgenic fish. Injected embryos were maintained with PTU to prevent melanophore pigmentation and treated with heat shock at 18, 24, and 30 hpf, and fixed with 4 % PFA at 36 hpf. Whole-mount embryos were labeled with anti-myc-tag antibody and anti-EGFP antibody to investigate whether myc-NICD-expressing retinal cells are ath5:EGFP-negative. On average, 50 % of embryos did not have the Tg[hsp:gal4] transgene and were used for negative controls. (B) Labeling of Tg[ath5:EGFP; hsp:gal4] transgenic retinas injected with the UAS:myc-NICD or UAS:mCherry expression construct. We observed that retinal cell columns expressing myc-NICD (magenta) do not express ath5:EGFP (green) (white arrows), whereas retinal cells columns expressing mCherry normally express ath5:EGFP in the neurogenic area. ath5:EGFP normally spread into the whole retina of non-Tg[hsp:gal4] transgenic embryos, which did not express myc-NICD. Scale bars: 40 μm. (C) Percentages of ath5:EGFP-negative and -positive retinal columns expressing myc-NICD (left panel) and mCherry (right panel). Among the 85 retinal columns expressing myc-NICD from five independent embryos, 97.65 % were ath5:EGFP negative. On the other hand, among the 224 retinal columns expressing mCherry from five independent embryos, 53.13 % were ath5:EGFP negative. Since ath5:EGFP is the earliest marker of retinal neurogenesis in zebrafish, overexpression of NICD effectively suppresses retinal neurogenesis. The statistical difference was significant (p < 0.0001, chi square).
-
Figure 4—figure supplement 7—source data 1
Data for Figure 4—figure supplement 7C.
- https://cdn.elifesciences.org/articles/70550/elife-70550-fig4-figsupp7-data1-v1.xlsx
Figure 4—figure supplement 8
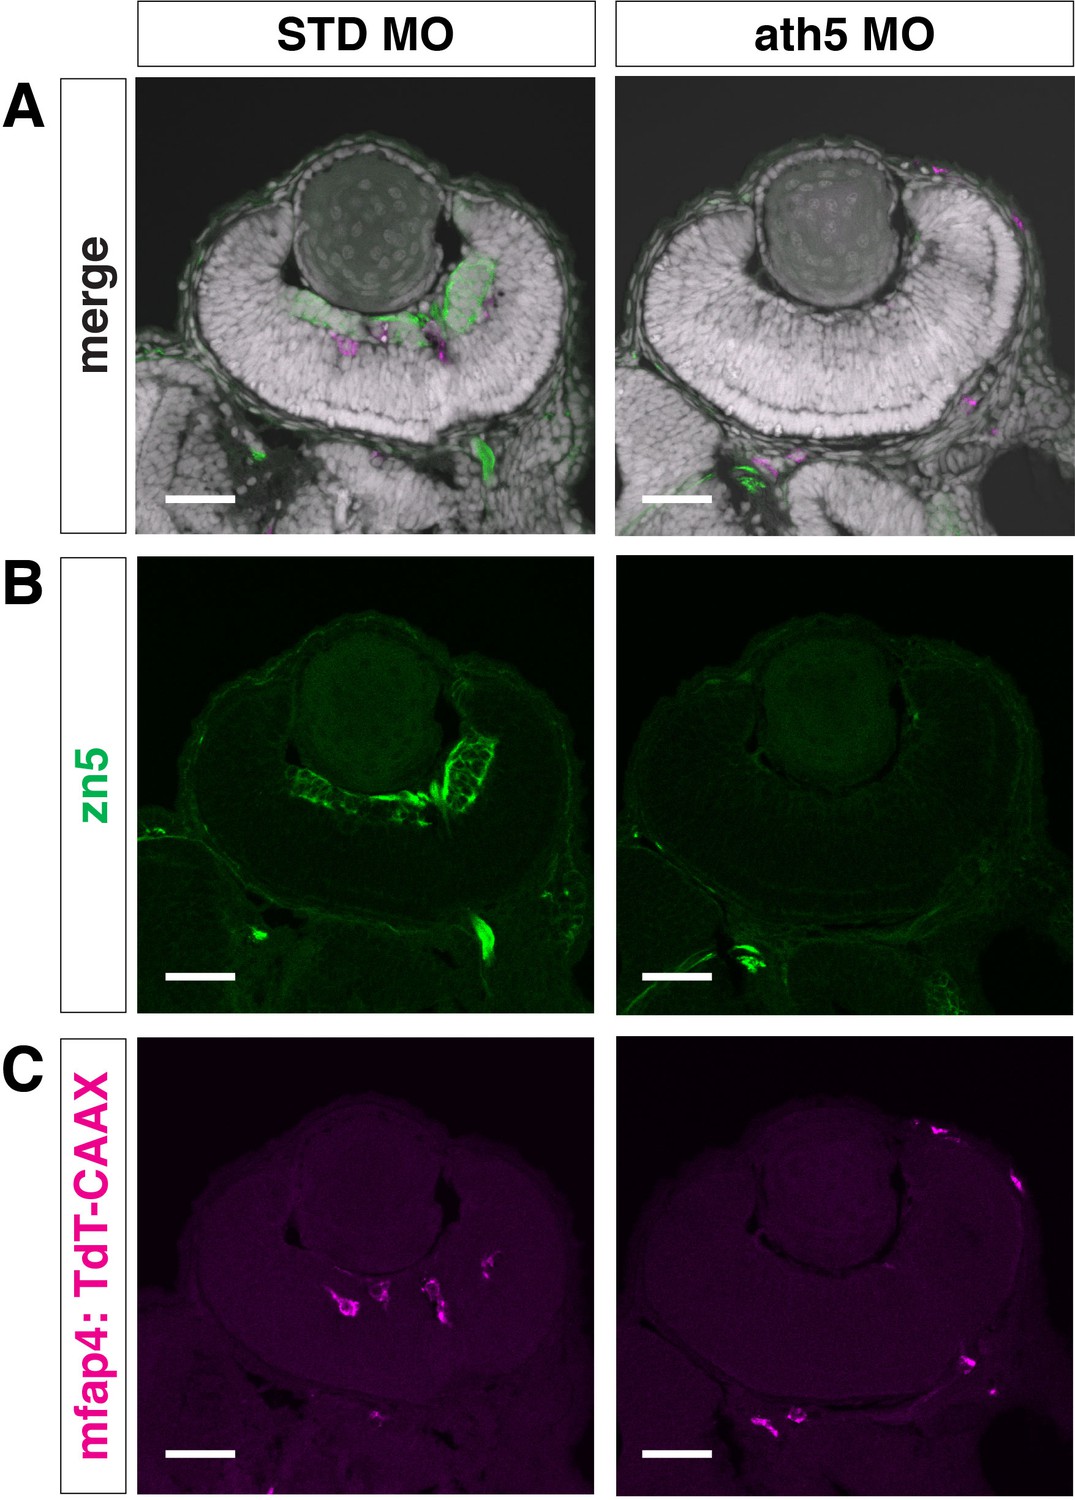
Microglial precursor colonization of the retina is affected in ath5 morphants.
zn5 antibody labeling of 49 hpf Tg[mfap4:TdTomato-CAAX] transgenic retinas injected with standard MO and ath5 MO. Panels (B) and (C) display only green and magenta channels, respectively. RGCs are visualized with zn5 antibody (green) and their differentiation is inhibited in ath5 morphants. The number of ocular microglial precursors (magenta) is drastically reduced in ath5 morphants. Nuclei were counterstained with TOPRO3 (white). Scale bar: 30 μm.
Figure 5 with 1 supplement

Microglial precursors are preferentially associated with neurogenic retinal columns.
(A) Schematic drawing of cell transplantation experiments. Wild-type donor embryos are labeled with Alexa-448-dextran and transplanted into slbp1 mutant recipient embryos at blastula stage. In slbp1 mutant recipient embryos, transplanted wild-type donor cells form retinal cell columns. The host slbp1 mutant line is combined with Tg[mfap4:tdTomato-CAAX], to investigate whether mfap4-positive microglial precursors (magenta) infiltrate the neural retina preferentially through Alexa-448-dextran-labeled, wild-type donor columns (green) in slbp1 mutant recipient embryos. (B) Live images of slbp1 mutant retinas with transplanted wild-type donor retinal cell columns at 48 hpf. Donor wild-type retinal cell columns are labeled with Alexa-488 dextran (green). Host microglial precursors are visualized with the transgene Tg[mfap4:tdTomato-CAAX] (magenta). Dotted circles indicate the outline of the optic cup. Many microglial precursors are associated with wild-type donor retinal columns in slbp1 mutant host retinas (right panel), compared with wild-type sibling host retinas (left panel). Scale bar: 30 μm (C) The fraction of mfap4-positive microglial precursors associated with donor transplanted retinal cell columns versus the total number of microglial precursors in the optic cup. The average fraction of mfap4-positive cells associated with donor retinal cell columns is significantly higher in slbp1 mutant host retinas than in wild-type host retinas. Bars and lines indicate means ± SD. *p < 0.05. (D) The trapping efficiency of mfap4-positive microglial precursors per donor column. The average trapping efficiency is significantly higher in slbp1 mutant host retinas than in wild-type host retinas, suggesting higher affinity of microglial precursors for neurogenic retinal cells. Bars and lines indicate means ± SD. **p < 0.01. (E) Schematic drawing of mosaic expression of NICD in retinas. A mixture of UAS:EGFP and UAS-myc-NICD plasmids was injected into fertilized eggs of the Tg[hsp:gal4; mfap4:tdTomato] transgenic line, which were treated by heat shock at 18 and 30 hpf. At 48 hpf, embryos were fixed to prepare serial retinal sections for imaging analysis. (F) Confocal scanning of retinal sections of Tg[hsp:gal4; mfap4:tdTomato] transgenic embryos injected with plasmids encoding UAS:EGFP or UAS:EGFP+ UAS:myc-NICD. Scale bar: 30 μm. (G) The fraction of mfap4-positive microglial precursors associated with EGFP-expressing retinal cell columns versus the total number of microglial precursors in the optic cup. The average fraction of mfap4-positive cells associated with EGFP-positive retinal columns is significantly lower in retinas injected with UAS:EGFP+ UAS:myc-NICD than with only UAS:EGFP control. Bars and lines indicate means ± SD. ***p < 0.005. (H) The trapping efficiency of mfap4-positive microglial precursors per EGFP-expressing retinal cell columns. The average trapping efficiency is significantly lower in retinas injected with UAS:EGFP+ UAS:myc-NICD than with only UAS:EGFP control, suggesting less affinity of microglial precursors for proliferative NICD-expressing retinal cells. Bars and lines indicate means ± SD. *p < 0.05.
-
Figure 5—source data 1
Data for Figure 5CDGH.
- https://cdn.elifesciences.org/articles/70550/elife-70550-fig5-data1-v1.xlsx
Figure 5—figure supplement 1
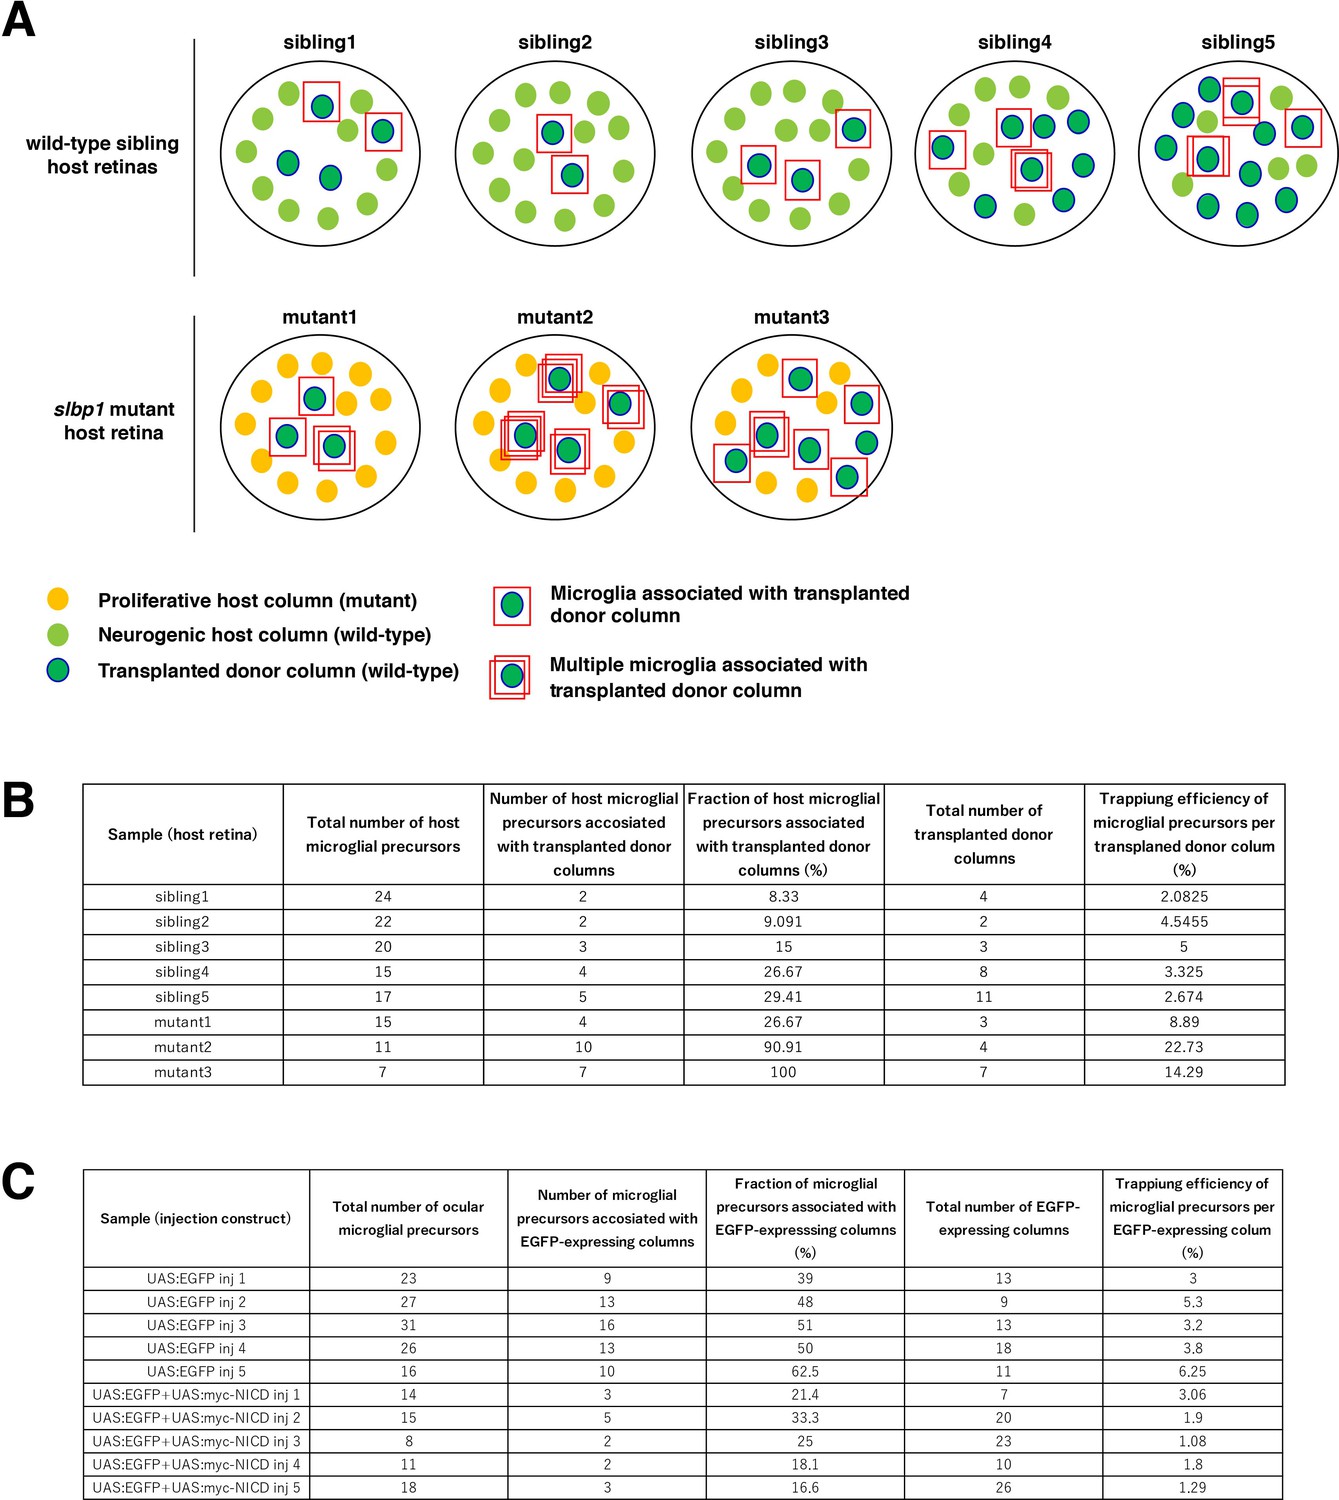
Calculation of trapping efficiency of microglial precursors by retinal columns.
(A) Schematic drawing of five sets of wild-type sibling retinas and three sets of slbp1 mutant host retinas, into which wild-type donor retinal cells were transplanted, and data of which are used for Figure 5A–D. At 48 hpf, slbp1 mutant host retinas consist of proliferative retinal cells (yellow circles), whereas wild-type sibling retinas consists of neurogenic retinal cells (light green circles). Wild-type donor-transplanted columns contain neurogenic retinal cells (green circles). Microglial precursors associated with transplanted donor columns are indicated by red squares. Multiple red squares indicate multiple microglial precursors associated with one transplanted retinal column. (B) Table indicating the total number of host ocular microglial precursors, the number of microglial precursors associated with transplanted donor columns, the percentage of microglial precursors associated with transplanted donor columns relative to total numbers of microglia per host retina, total numbers of transplanted donor columns, and trapping efficiency of microglial precursors per neurogenic donor column. The trapping efficiency of microglial precursors by each neurogenic column is calculated by dividing the percentage of microglial precursors associated with donor columns by the number of donor retinal columns per host retina. These results are shown in Figure 5CD. (C) Table indicating the total number of ocular microglial precursors, the number of microglial precursors associated with EGFP or EGFP/NICD-expressing columns, the percentage of microglial precursors associated with EGFP or EGFP/NICD-expressing columns relative to total numbers of microglial precursors per host retina, total number of EGFP or EGFP/NICD-expressing columns, and trapping efficiency of microglial precursors per EGFP or EGFP/NICD-expressing column. These results are shown in Figure 5GH.
Figure 6 with 3 supplements
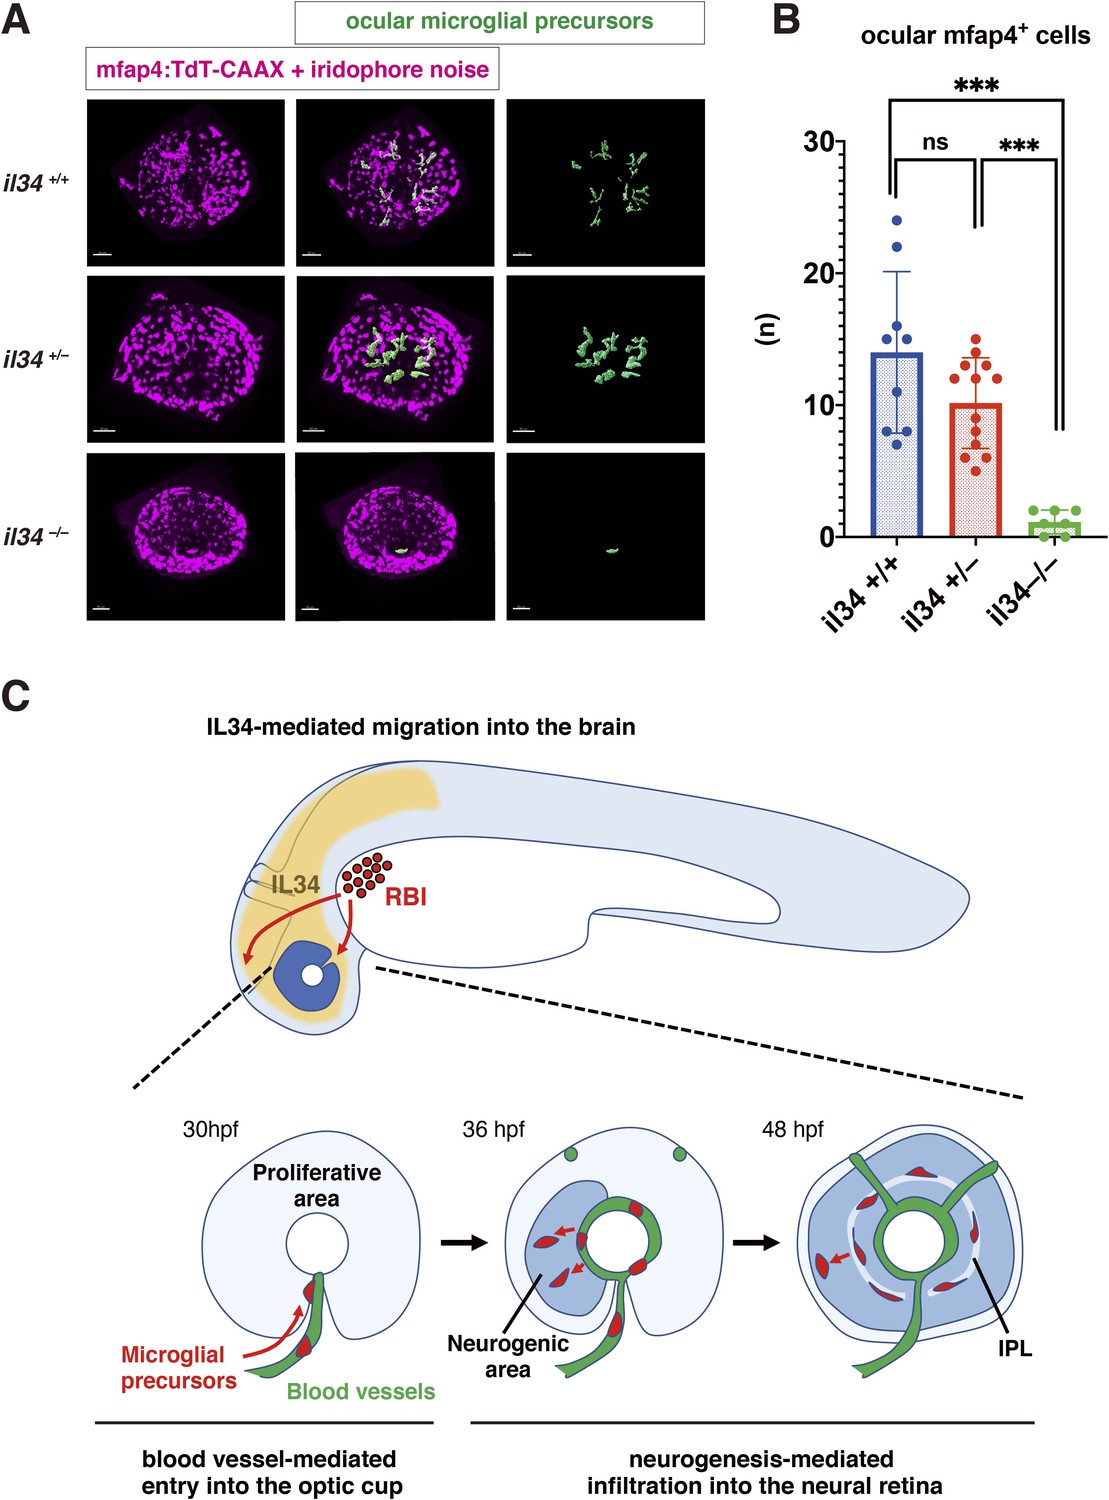
IL34 is required for colonization of the optic cup by microglial precursors.
(A) Confocal 3D scanning of 48 hpf wild-type, il34 heterozygous and homozygous mutant retinas carrying the Tg[mfap4:tdTomato-CAAX] transgene. At 48 hpf, iridophores start to differentiate around the optic cup, which causes a noise signal (magenta) in confocal scanning. Using the surface-rendering tool of Imaris software (Bitplane), we eliminated iridophore-derived noise and extracted mfap4:tdTomato-CAAX signals from ocular microglial precursors (green) (see the legend of Figure 4—figure supplement 3). Scale bar: 50 μm. (B) Histogram of numbers of ocular microglial precursors in wild-type, il34 heterozygous and homozygous mutant retinas at 48 hpf. The number of ocular microglial precursors is almost zero, and very few, if any (one or two), in il34 homozygous mutants, indicating that ocular microglial precursors are significantly reduced in il34 homozygous mutants. The number of ocular microglial precursors is mildly reduced in il34 heterozygous mutants, but does not differ significantly from that of wild-type siblings. Bars and lines indicate means ± SD. ***p < 0.005. (C) A possible model of the guidance mechanism of microglial precursor into zebrafish retina. IL34 is involved in movement of microglial precursors toward the brain. Microglial precursors continue into the optic cup along blood vessels, and subsequently infiltrate the neural retina through the neurogenic area.
-
Figure 6—source data 1
Data for Figure 6B.
- https://cdn.elifesciences.org/articles/70550/elife-70550-fig6-data1-v1.xlsx
Figure 6—figure supplement 1
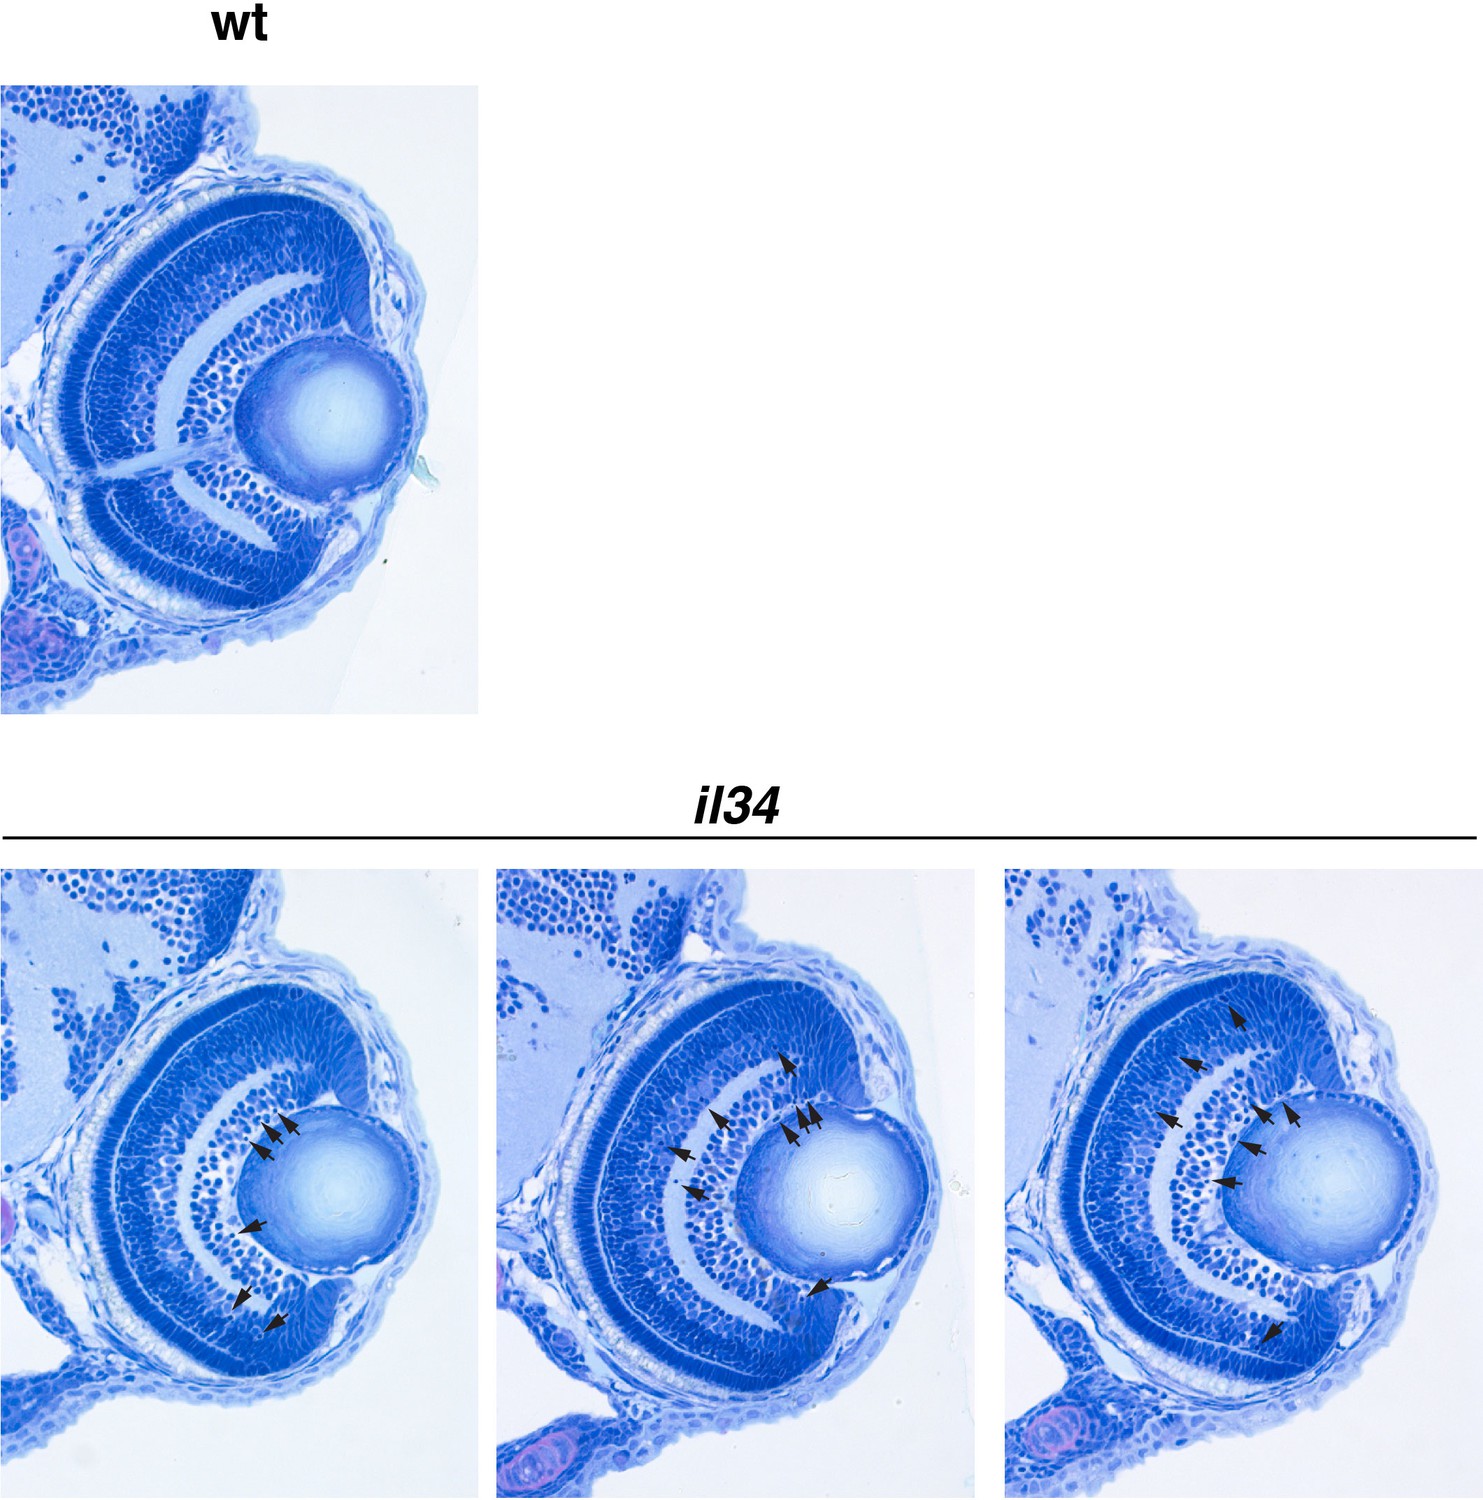
Retinal cell differentiation normally proceeds in il34 mutants.
Wild-type sibling and il34 mutant retinas at 72 hpf. Retinal sections of three independent il34 mutants are shown. Although there were 6–10 pyknotic nuclei (arrows) in RGC and amacrine cell layers in il34 mutants, retinal lamination is normally formed at 72 hpf, indicating that neurogenesis and subsequent cell differentiation normally proceed in il34 mutants.
Figure 6—figure supplement 2
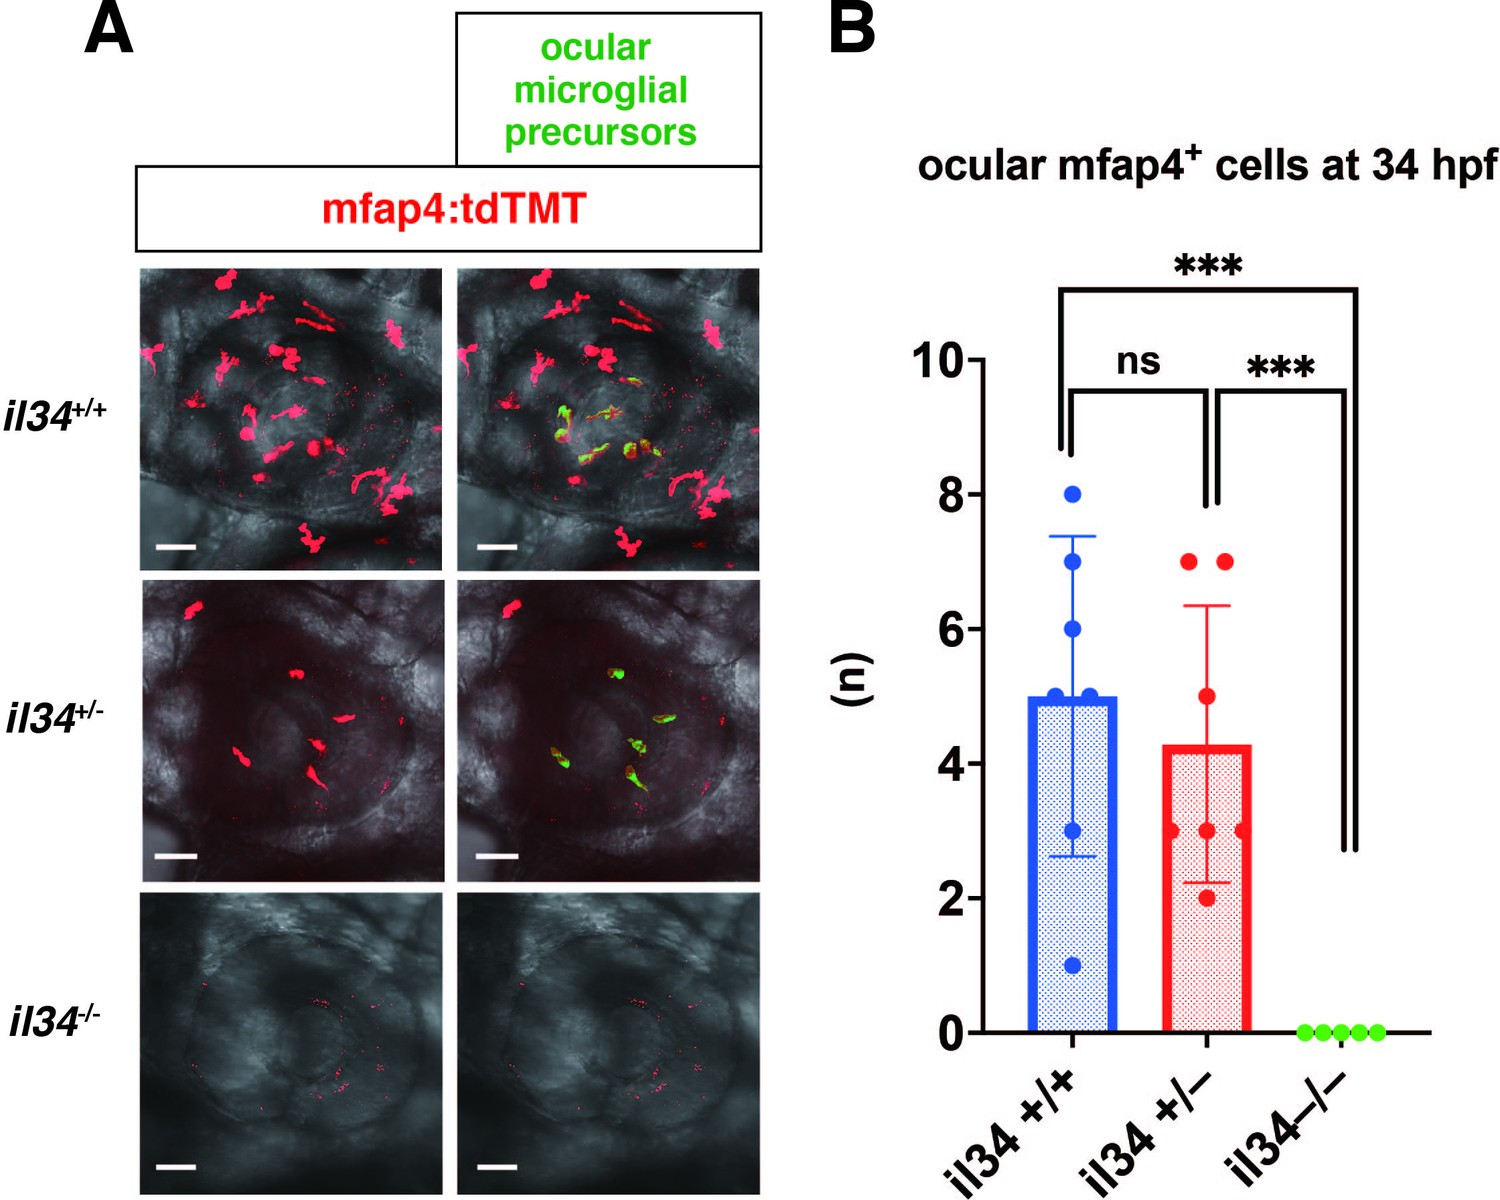
Microglial precursor colonization of the optic cup in il34 mutants.
(A) Confocal 3D scanning images of 34 hpf wild-type, il34 heterozygous, and homozygous mutant retinas carrying the Tg[mfap4:tdTomato-CAAX] transgene. Using the surface-rendering tool of Imaris software (Bitplane), we labeled ocular microglial precursors (green). Scale bar: 40 μm. (B) Histogram of numbers of ocular microglial precursors in wild-type, il34 heterozygous, and homozygous mutant retinas at 34 hpf. The number of ocular microglial precursors is zero in il34 homozygous mutants, and significantly lower than that of wild-type siblings. Bars and lines indicate means ± SD. ***p < 0.005.
-
Figure 6—figure supplement 2—source data 1
Data for Figure 6—figure supplement 2B.
- https://cdn.elifesciences.org/articles/70550/elife-70550-fig6-figsupp2-data1-v1.xlsx
Figure 6—figure supplement 3
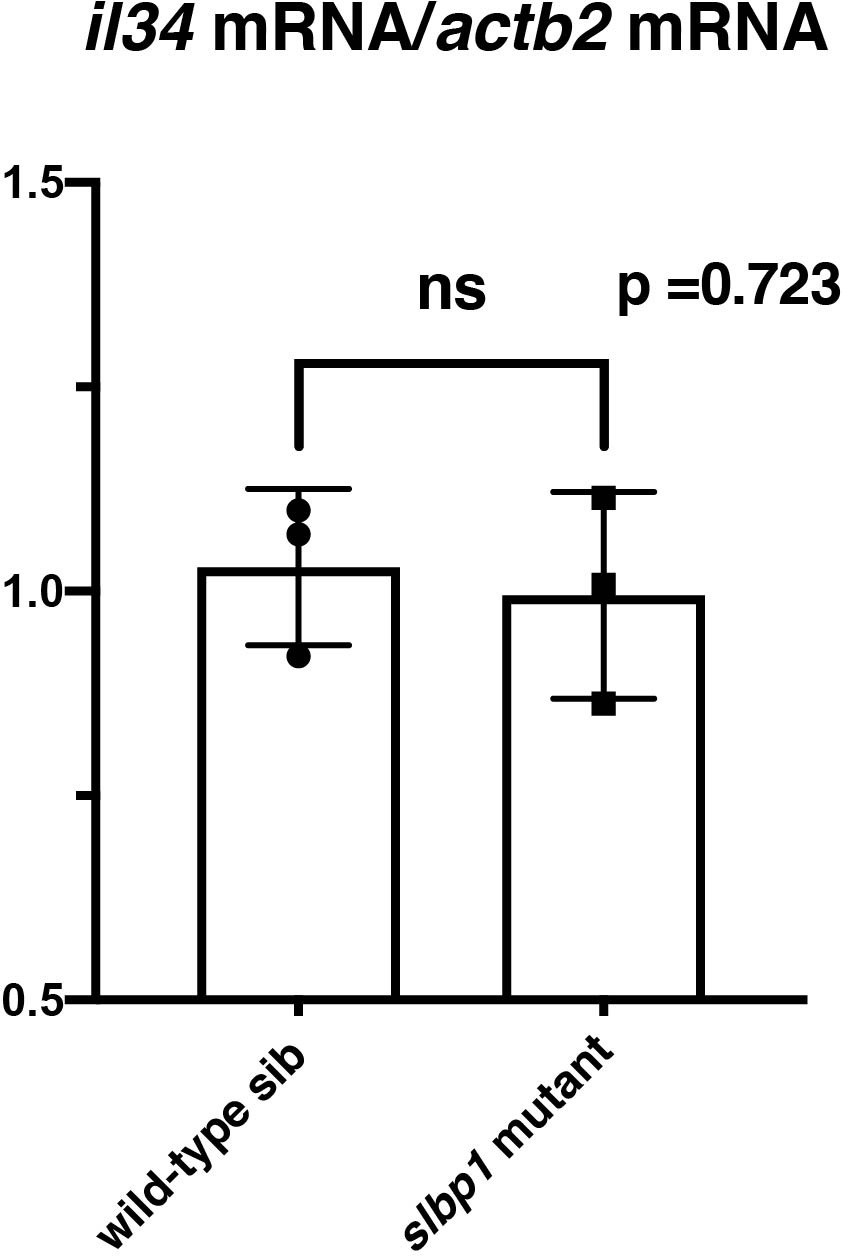
il34 mRNA expression is comparable between wild-type sibling and slbp1 mutant heads.
il34 mRNA expression was evaluated in wild-type siblings and slbp1 mutants at 48 hpf using semi-quantitative PCR. il34 mRNA expression level is normalized against actb2 mRNA expression. There is no significant difference between wild-type siblings and slbp1 mutants. Bars and lines indicate means ± SD.
-
Figure 6—figure supplement 3—source data 1
Data for Figure 6—figure supplement 3.
- https://cdn.elifesciences.org/articles/70550/elife-70550-fig6-figsupp3-data1-v1.xlsx
Videos
Video 1
3D rendering of an eye of Tg[EF1α: mCherry-zGem;mpeg1.1:EGFP] zebrafish embryo at 42 hpf.
mCherry-zGem signals indicate cells in S and G2 phase (magenta), whereas mpeg1.1:EGFP -positive cells are ocular microglial precursors (green). The fraction of mCherry-zGem; mpeg1.1:EGFP double-positive cells in mpeg1.1:EGFP-positive cells is very small, suggesting that almost all microglial precursors are in G1 phase.
Video 2
Live imaging of Tg[kdrl:EGFP; mfap4:tdTomato-CAAX] embryo at 30 hpf.
mfap4:tdTomato-CAAX-positive cells indicate microglial precursors (magenta), whereas kdrl:EGFP-positive cells indicate endothelial cells of blood vessels (green). Microglial precursors are moving on the surface of a developing superficial ocular blood vessel, suggesting that blood vessels act as scaffolds for migration of microglial precursors.
Video 3
Live imaging of Tg[kdrl:EGFP; mfap4:tdTomato-CAAX] embryos from 32 to 36 hpf.
mfap4:tdTomato-CAAX-positive cells indicate microglial precursors (magenta), whereas kdrl:EGFP-positive cells indicate endothelial cells of blood vessels (green). Microglial precursors use blood vessels as scaffolds to migrate into the ocular space, and gradually invade the neural retina. Surface rendering indicates amoeboid microglial precursors, which are attached to the hyaloid loop around the lens and infiltrate the neural retina.
Tables
Appendix 1—key resources table
| Reagent type (species) or resource | Designation | Source or reference | Identifiers | Additional information |
|---|---|---|---|---|
| Strain, strain background (zebrafish, Danio rerio) | Okinawa wild type | PMID:28196805 | ||
| Strain, strain background (zebrafish, Danio rerio) | RIKEN wild type | PMID:12702661 | ZFIN: ZDB- GENO-070802–4 | https://shigen.nig.ac.jp/zebra/ |
| Genetic reagent (zebrafish, Danio rerio) | slbp1rw440 | PMID:25106852 | ZFIN: ZDB-ALT-150115–5 | |
| Genetic reagent (zebrafish, Danio rerio) | irf8st96 | PMID:25615614 | ZFIN: ZDB-ALT-150504–8 | Dr. William Talbot (Stanford University) |
| Genetic reagent (zebrafish, Danio rerio) | il34hkz11 | PMID:30205037 | ZFIN: ZDB-ALT-181210–3 | Dr. Zilong Wen (The Hong Kong University of Science and Technology) |
| Genetic reagent (zebrafish, Danio rerio) | Roy orbison | PMID:28760346 | ZFIN: ZDB- ALT-980203–444 | |
| Genetic reagent (zebrafish, Danio rerio) | Tg[ath5:EGFP] rw021 | PMID:12702661 | ZFIN: ZDB-ALT-050627–2 | |
| Genetic reagent (zebrafish, Danio rerio) | Tg[EF1a:mCherry -zGem] oki011 | PMID:25260917 | ZFIN: ZDB-ALT-150128–2 | |
| Genetic reagent (zebrafish, Danio rerio) | Tg[mpeg1 .1:EGFP] oki053 | This paper | See “Materials and Methods” | |
| Genetic reagent (zebrafish, Danio rerio) | Tg[mfap4 :tdTomato] oki083 | This paper | See “Materials and Methods” | |
| Genetic reagent (zebrafish, Danio rerio) | Tg[kdrl:EGFP] s843Tg | PMID:16251212 | ZFIN: ZDB-ALT-050916–14 | ZIRC |
| Genetic reagent (zebrafish, Danio rerio) | Tg[hsp:gal4]kca4 | PMID:11850174 | ZFIN: ZDB-ALT-020918–6 | Reugels/Campos-Ortega lab (Köln University) |
| Genetic reagent (zebrafish, Danio rerio) | Tg[rx1:gal4-VP16]oki065 | This paper | See “Materials and Methods” | |
| Antibody | zn5 (mouse monoclonal) | ZIRC | ZFIN: ZDB-ATB-081002–19 | IHC (1:100) |
| Antibody | zpr1 (mouse monoclonal) | ZIRC | ZFIN: ZDB-ATB-081002–43 | IHC (1:100) |
| Antibody | Anti-GFP (rabbit polyclonal) | Thermo Fisher Scientific | Cat# A11122 | IHC (1:200) |
| Antibody | Anti-myc tag (mouse monoclonal) | Invitrogen | Cat# R950-25 | IHC (1:250) |
| Antibody | Anti-BrdU (rat monoclonal) | BioRad | Cat# MCA2060 | Monoclonal (BU1/75(ICR1))IHC (1:200) |
| Recombinant DNA reagent | pT2AL200R150G(plasmid) | PMID:16959904 | Dr. Koichi Kawakami(Institute of Genetics) | |
| Recombinant DNA reagent | UAS:EGFP(plasmid) | PMID:11336499 | 10 ng/μL for injection | |
| Recombinant DNA reagent | UAS:mCherry(plasmid) | This paper | 10 ng/μL for injection | |
| Recombinant DNA reagent | UAS:myc-NICD(plasmid) | PMID:10072782 | Reugels/Campos-Ortega lab (Köln University)10 ng/μL for injection | |
| Recombinant DNA reagent | Ptf1a:EGFP(plasmid) | PMID:19732413 | Dr. Francesco Argenton (University of Padova)10 ng/μL for injection | |
| Sequence-based reagent | tnnt2a MO | PMID:11967535 | Morpholino antisense oligos | 5’-CATGTTTGCTCTGATCTGACACGCA-3’Use at 500 μM |
| Sequence-based reagent | p53 MO | PMID:12477391 | Morpholino antisense oligos | 5’-GCGCCATTGCTTTGCAAGAATTG-3’Use at 100 μM |
| Sequence-based reagent | cxcl12a MO | PMID:15716407 | Morpholino antisense oligos | 5’-ACTTTGAGATCCATGTTTGCAGTG-3’Use at 500 μM |
| Sequence-based reagent | pu.1 MO | PMID:15621533 | Morpholino antisense oligos | 5’-GATATACTGATACTCCATTGGTGGT-3’Use at 250 μM |
| Sequence-based reagent | ath5 MO | This paper | Morpholino antisense oligos | 5’-TTCATGGCTCTTCAAAAAAGTCTCC-3’Use at 250 μM |
| Sequence-based reagent | standard MO | other | Morpholino antisense oligos | 5’-CCTCTTACCTCAGTTACAATTTATA-3’Use at the same concentration for each MO experiments |
| Sequence-based reagent | il34 qPCR primer forward | This paper | PCR primers | 5’- TGGTCCAGTCCGAATGCT-3’ |
| Sequence-based reagent | il34 qPCR primer reverse | This paper | PCR primers | 5’- GCTGCACTACTGCACACTGG –3’ |
| Sequence-based reagent | actb2 qPCR primer forward | This paper | PCR primers | 5’- TGTCTTCCCATCCATCGTG –3’ |
| Sequence-based reagent | actb2 qPCR primer reverse | This paper | PCR primers | 5’- TGTCTTCCCATCCATCGTG-3’ |
| Sequence-based reagent | il34 genotyping primer forward | This paper | PCR primers | 5’-TGCAATTAAACAGCCAATGTG-3’ |
| Sequence-based reagent | il34 genotyping primer reverse | This paper | PCR primers | 5’-CTGAGTCACAGCCCTCAAATC-3’ |
| Sequence-based reagent | il34 sequencing primer forward | This paper | PCR primers | 5’-CCATTTGTTTTTACCTGACCAAA-3’ |
| Sequence-based reagent | il34 g sequencing primer reverse | This paper | PCR primers | 5’-GCTAATTGGTGTGGGACGTT-3’ |
| Commercial assay or kit | In Situ Cell Death Detection Kit, Fluorescein | Roche | Cat# 11684795910 | |
| Commercial assay or kit | Sepasol-RNA/Super G | Nacalai tesque | Cat# 09379 | |
| Commercial assay or kit | ReverTra Ace︎ aPCR master mix with gDNA remover | Toyobo | Cat# FSQ-301 | |
| Chemical compound, drug | BrdU | Nacalai tesque | Cat# 05650–95 | |
| Chemical compound, drug | Bodipy ceramide | Thermo Fisher Scientific | Cat# B22650 | |
| Chemical compound, drug | TO-PRO–3 Iodide (642/661) | Thermo Fisher Scientific | Cat# T3605 | |
| Chemical compound, drug | N-Phenyl thiourea (PTU) | Nacalai tesque | Cat# 27429–22 | |
| Chemical compound, drug | Dextran, Alexia Flour-488 | Thermo Fisher Scientific | Cat# D22910 | |
| Software, algorithm | GraphPad Prism | GraphPad Software | Ver 8.2.1 | https://www.graphpad.com/scientific-software/prism/ |
| Software, algorithm | IMARIS | Bitplane | Ver 9.1.2 | http://www.bitplane.com/imaris; RRID: SCR_007370 |
| Software, algorithm | Image-J | NIH | 2.0.0-rc-69/1.52 p | |
| Software, algorithm | Trimomatic | PMID:24695404 | v0.39 | http://www.usadellab.org/cms/?page=trimmomatic |
| Software, algorithm | PRINSEQ lite | PMID:21278185 | v0.20.4 | http://prinseq.sourceforge.net/ |
| Software, algorithm | HISAT2 | PMID:25751142 | v2.1.0 | https://github.com/DaehwanKimLab/hisat2 |
| Software, algorithm | featureCounts | PMID:24227677 | Packaged ub Subread v1.5.2 | http://subread.sourceforge.net/ |
| Software, algorithm | EdgeR | PMID:19910308 | v3.13 | https://bioconductor.org/packages/release/bioc/html/edgeR.html |
| Software, algorithm | EnhancedVolcano package | Blighe et al., 2018 | v1.6.0 | https://github.com/kevinblighe/EnhancedVolcano |
| Software, algorithm | pheatmap package | other | v1.10.12 | https://cran.r-project.org/web/packages/pheatmap/index.html |
Additional files
Download links
A two-part list of links to download the article, or parts of the article, in various formats.
Downloads (link to download the article as PDF)
Open citations (links to open the citations from this article in various online reference manager services)
Cite this article (links to download the citations from this article in formats compatible with various reference manager tools)
Mechanisms underlying microglial colonization of developing neural retina in zebrafish
eLife 10:e70550.
https://doi.org/10.7554/eLife.70550


