Distinct signatures of calcium activity in brain mural cells
- Institute of Pharmacology and Toxicology, University of Zurich, Switzerland
- Neuroscience Center Zurich, University and ETH Zurich, Switzerland
- Department of Neurosurgery, University of Zurich, Switzerland
- Rady Faculty of Health Sciences, College of Pharmacy, Canada
Figures
Figure 1 with 2 supplements
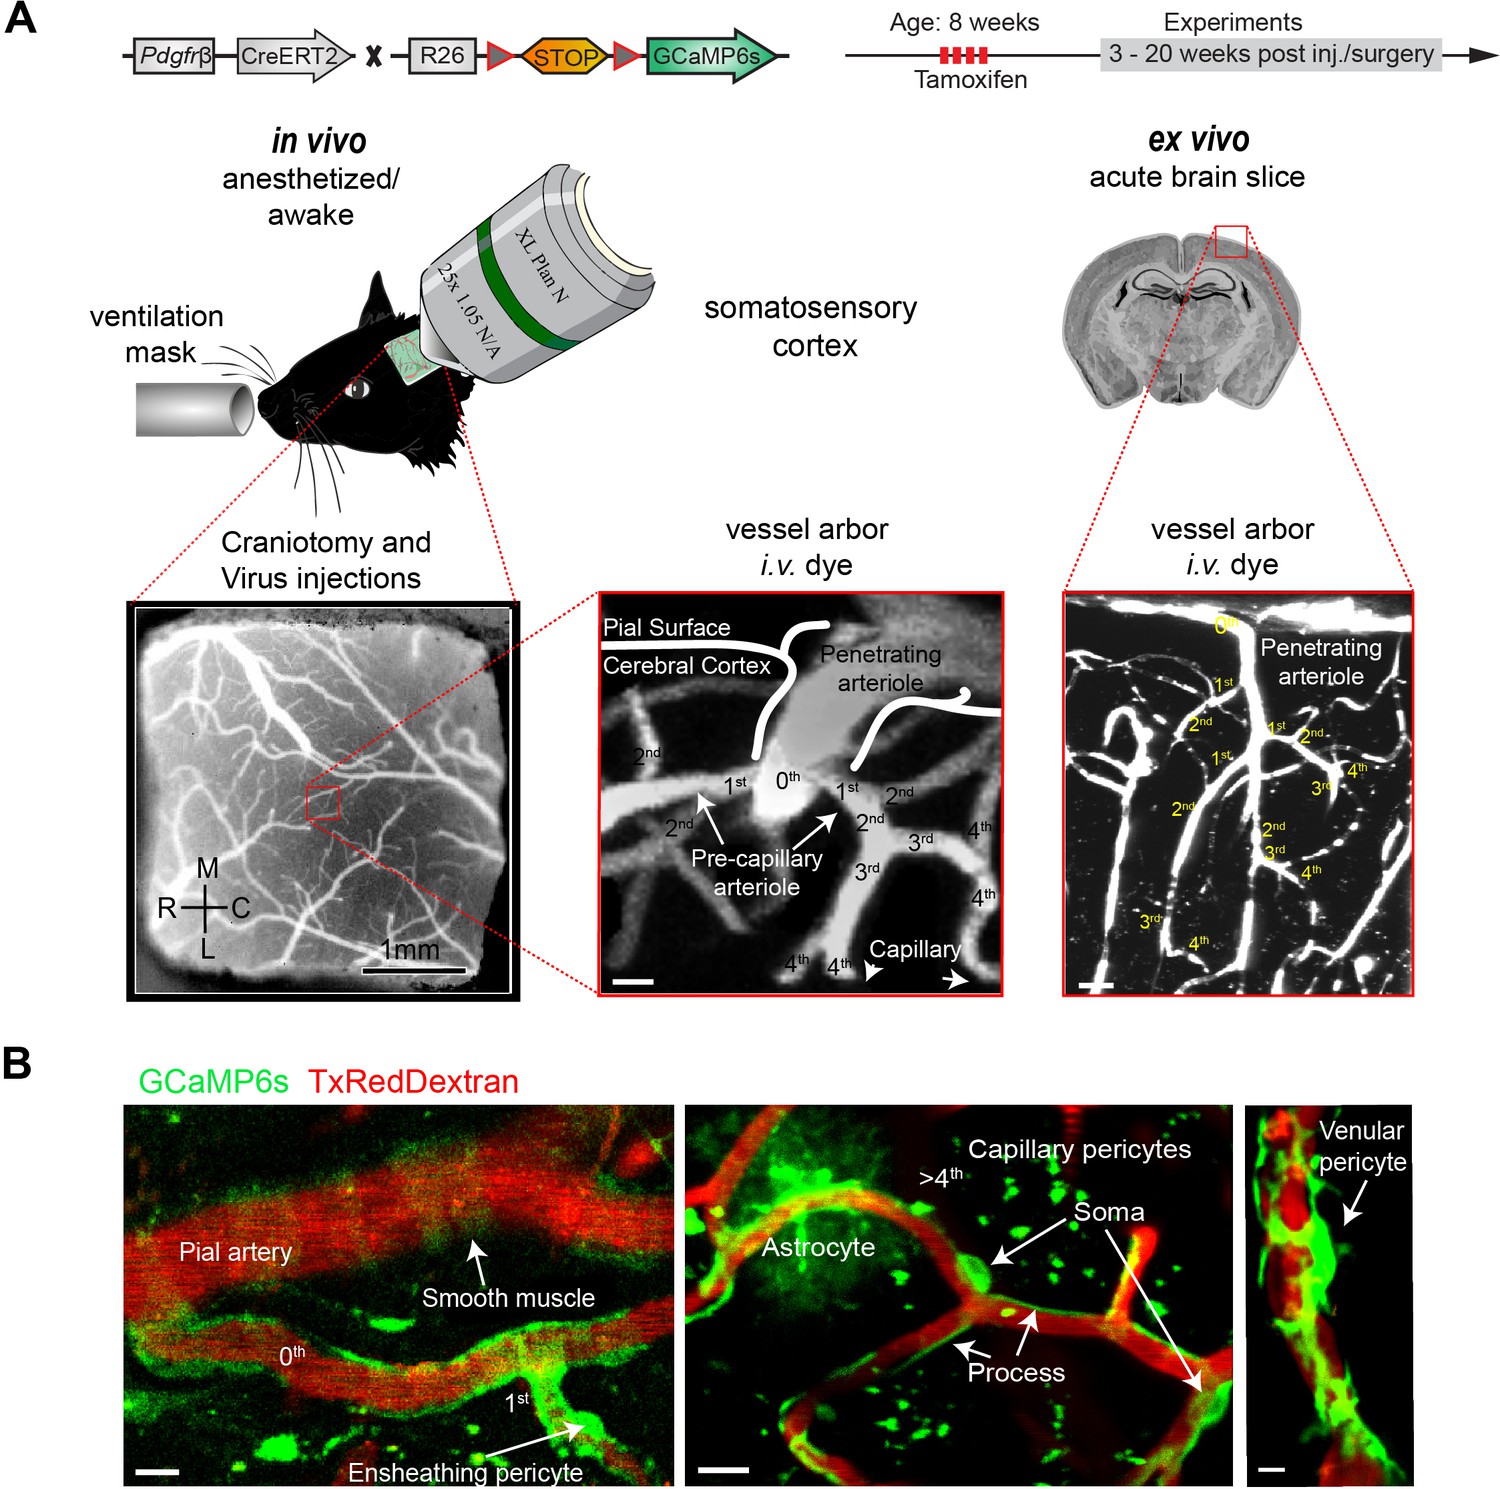
Two-photon calcium imaging of mural cells.
(A) GCaMP6s expression in Pdgfrb-positive cells of Pdgfrb-CreERT2:R26-GCaMP6sf/stop/f transgenic mice, induced by four consecutive Tamoxifen injections. If required, adeno-associated viruses (AAV) were injected before the chronic cranial window implantation over the somatosensory cortex. Images were acquired at a wavelength of 940 nm, and the vasculature was labeled via an intravenous injection (iv.) of 2.5% Texas Red Dextran (70 kDa). In vivo experiments were conducted with awake and anesthetized (1.2% isoflurane, supplied by a ventilation mask) mice. For pharmacologic interventions, acute brain slices of the same mice were prepared. Z-stacks of the vessel arbor were acquired to determine the precise location of the imaged cells along the vasculature. (B) In vivo images of the cortical vasculature showing GCaMP6s (green) labeled mural cells. SMCs are located on pial arteries and ensheathing pericytes on 1st–4th branch order vessels. CPs (consisting of mesh and thin stranded pericytes) are found on vessels of >4th branch order. Occasionally, some astrocytes showed GCaMP6s expression. VPs reside at postcapillary venules. Scale bars: 10 μm. See also Figure 1—figure supplements 1 and 2.
Figure 1—figure supplement 1
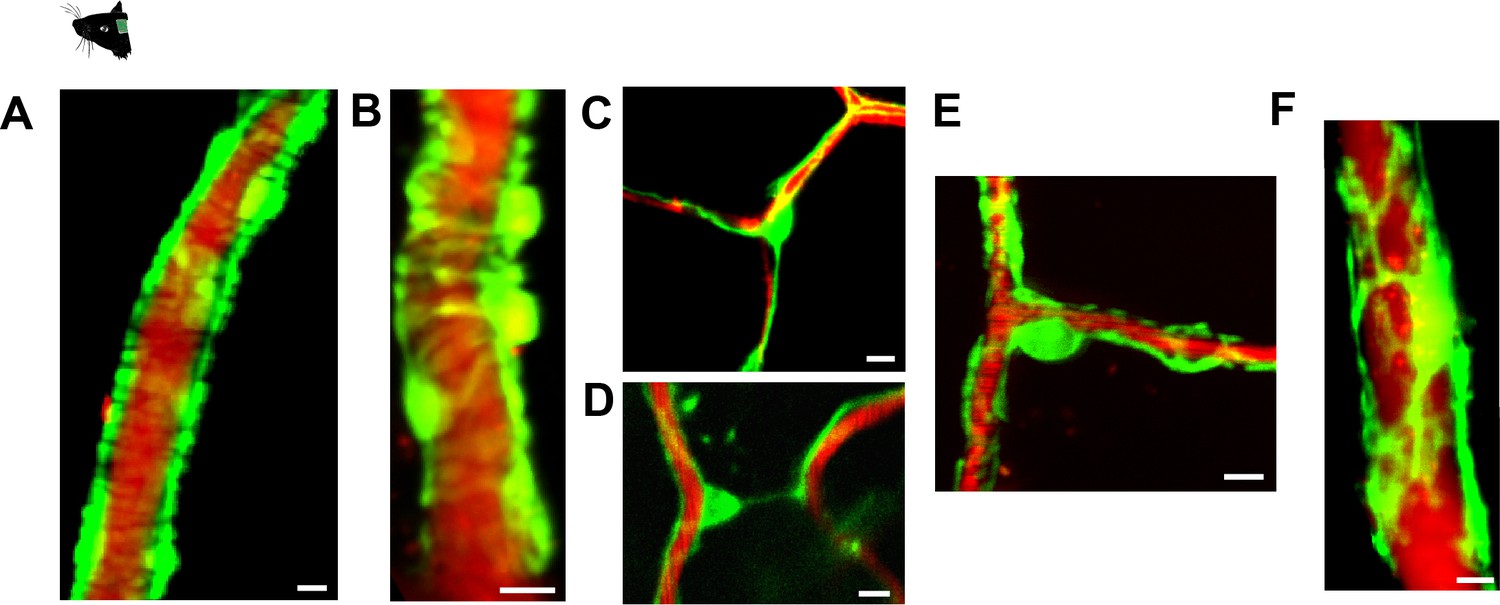
GCaMP6s expression in mural cells of Pdgfrb-CreERT2:R26-GCaMP6sf/stop/f mice.
(A–F): Distinct morphological appearances of mural cells. Blood plasma is stained with 70 kDa Texas Red Dextran. (A) Ring-shaped SMCs enwrapping an artery. (B) EPs enwrapping an arteriole. (C) Thin-strand capillary pericyte on a bifurcation. (D) Thin-strand capillary pericyte interconnecting vessel branches. (E) Mesh pericyte, also categorized as a capillary pericyte, showing net-like process structure. (F) Venular pericyte with stellate morphology on postcapillary venules. Scale bars: 10 μm.
Figure 1—figure supplement 2
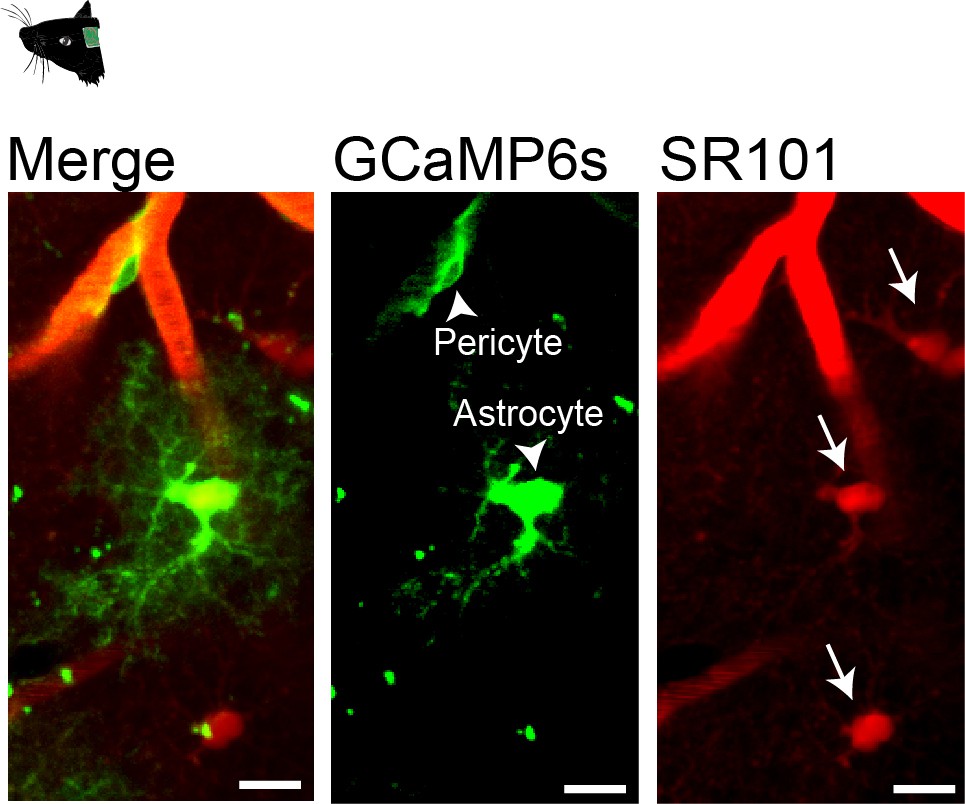
GCaMP6s expression in Pdgfrb-positive astrocytes of Pdgfrb-CreERT2:R26-GCaMP6sf/stop/f mice.
Intravenous injection of sulforhodamine 101, SR101 (100 μl of 5 mM iv.) to identify GCaMP6s-expressing astrocytes. Arrowheads point to GCaMP6s-expressing cells in green (GCaMP6s) channel and arrows point to SR101-stained astrocytes in red (SR101) channel. Scale bars: 10 μm.
Figure 2 with 4 supplements
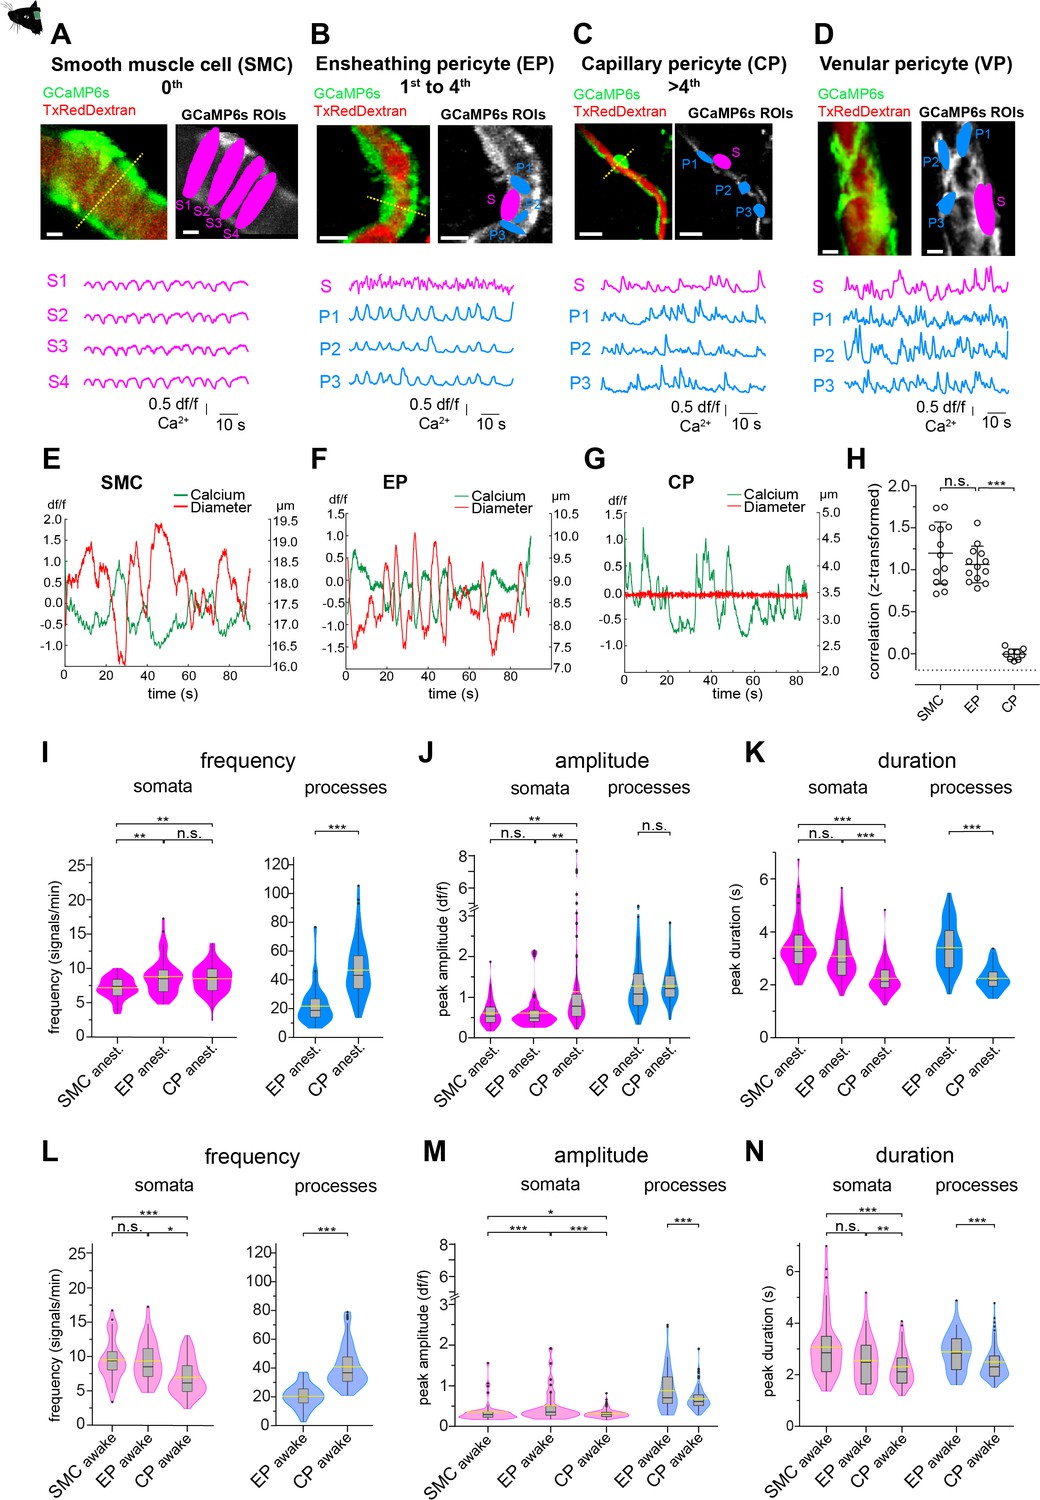
Mural cell calcium dynamics in vivo.
(A–D) Representative images of (A) SMCs, (B) EP, (C) CP, and (D) VP in vivo. Regions of interest (ROIs) for somata (S, magenta) were hand selected. ROIs for processes (P1–3, blue) were found in an unbiased way, employing a MATLAB-based algorithm (see Figure 2—figure supplement 3). Below the images are the normalized time traces of calcium signals of GCaMP6s fluorescence extracted from the corresponding example ROIs. Vessel diameters were measured with line scans across somata (indicated by the dashed yellow lines). Scale bars: 10 µm. (E–G) Plots depicting the relation between cytosolic calcium (green trace) and vessel diameter (red trace) measured simultaneously with line scans along the soma, for (E) SMC, (F) EP, and (G) CP. Traces were centered on the average diameter of the vessel. (H) Comparison of the correlations (Fisher z-transformed) between calcium signals and changes in vessel diameter. Unpaired two-tailed t-tests were performed to compare groups. Individual values with mean ± SD are shown. SMC: n = 13, EP: n = 13, CP: n = 9. t(24) = 1.139, p=0.27; t(20) = 14.21, ***p<0.001. (I–K) Quantification and comparison of baseline calcium signal properties: (I) frequency (signals per minute), (J) peak amplitude (df/f), and (K) duration (s) between SMC, EP, and CP somata and processes of in vivoanest mice, shown as violin/box plots (Tukey whiskers). The dashed yellow lines indicate the mean values of the respective parameters. Statistics were calculated using linear mixed-effects models and Tukey post hoc tests, SMCanest: N = 14, n = 67, EPanest: N = 16, n = 53, CPanest: N = 25, n = 93. *p<0.05, **p<0.01, ***p<0.001. (L–N) Quantification and comparison of baseline calcium signal properties: (L) frequency (signals per minute), (M) peak amplitude (df/f), and (N) duration (s) between SMC, EP, and CP somata and processes of in vivoawake mice, shown as violin/box plots (Tukey whiskers). The dashed yellow lines indicate the mean values of the respective parameters. Statistics were calculated using linear mixed-effects models and Tukey post hoc tests, SMCawake: N = 4, n = 53; EPawake: N = 3, n = 32; CPawake: N = 3, n = 96. *p<0.05, **p<0.01, ***p<0.001. n.s. indicates not significant. See also Figure 2—figure supplements 1–4. Data: Table 1 and Figure 2—source data 1.
-
Figure 2—source data 1
Source data for Figure 2.
- https://cdn.elifesciences.org/articles/70591/elife-70591-fig2-data1-v3.xlsx
Figure 2—figure supplement 1
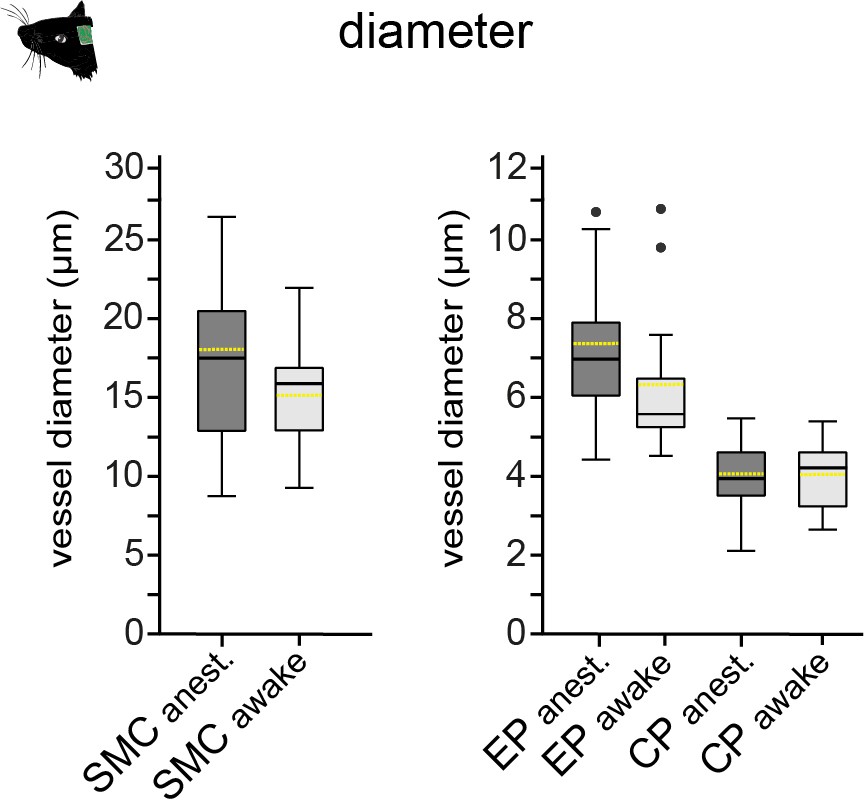
Vascular diameters associated with mural cells in awake and anesthetized mice.
Inner vessel diameters, measured at somata of capillary (awake: 4.1 ± 0.8 µm, n = 27; anesthetized: 4.1 ± 0.7 µm, n = 54) and ensheathing (awake: 6.3 ± 1.6 µm, n = 20; anesthetized: 7.3 ± 1.7 µm, n = 35) pericytes and SMCs (awake: 15.3 ± 3.6 µm, n = 15; anesthetized: 18.0 ± 7.3 µm, n = 33), shown as box plots (Tukey whiskers). The dashed yellow lines indicate the mean values. Data: Figure 2—figure supplement 1—source data 1.
-
Figure 2—figure supplement 1—source data 1
Source data for Figure 2—figure supplement 1.
- https://cdn.elifesciences.org/articles/70591/elife-70591-fig2-figsupp1-data1-v3.xlsx
Figure 2—figure supplement 2
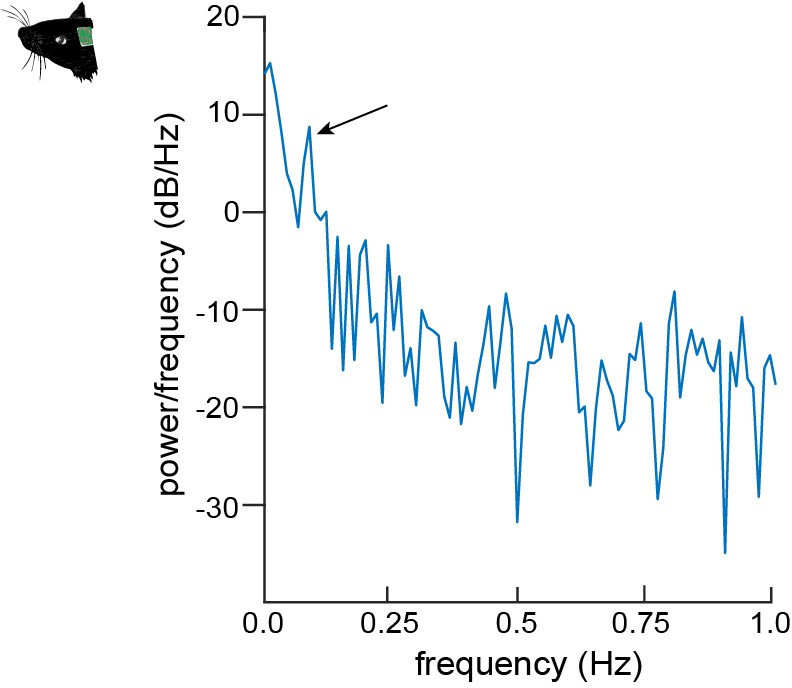
Periodogram of EPs.
Periodogram depicting the Fourier transform of the calcium oscillations of EPs in the ultra-low frequency range. The arrow points to a distinct peak at 0.1 Hz.
Figure 2—figure supplement 3
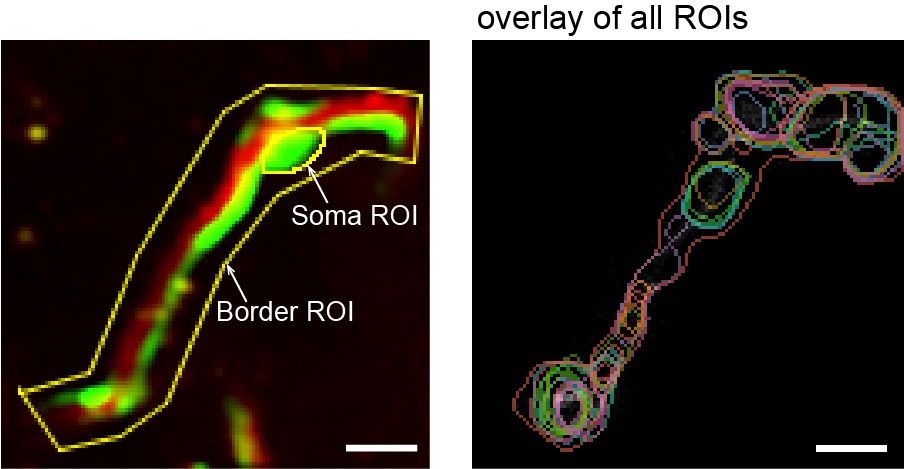
Automatic ROI detection.
Example image of ROI (region of interest) selection by hand in ImageJ. The soma was outlined, and a border ROI was set around the whole pericyte, so as to reduce detection of signals not associated with the observed cell. To the right is a time overlay of all process ROIs found inside the border ROI. Scale bars: 10 μm.
Figure 2—figure supplement 4

Comparison of calcium signal properties of mural cells in awake vs. anesthetized animals.
Quantification and comparison of baseline calcium signal properties: frequency (signals per minute), peak amplitude (dF/F), and duration (s) of (A–C) SMCs, (D–F) EPs, and (G–I) CPs somata and processes in vivo (awake/anesthetized), shown as violin/box plots (Tukey whiskers). The lighter colored plots indicate data from awake mice and the dashed yellow lines indicate the mean values of the respective parameters. Statistics were calculated using linear mixed-effects models and Tukey post hoc tests, SMCanest: N = 14, n = 67; SMCawake: N = 4, n = 53; EPanest: N = 16, n = 53; EPawake: N = 3, n = 32; CPanest: N = 25, n = 93; CPawake: N = 3, n = 96. *p<0.05, **p<0.01, ***p<0.001, n.s. indicates not significant. Data: Figure 2—figure supplement 4—source data 1 .
-
Figure 2—figure supplement 4—source data 1
Source data for Figure 2—figure supplement 4.
- https://cdn.elifesciences.org/articles/70591/elife-70591-fig2-figsupp4-data1-v3.xlsx
Figure 3 with 3 supplements
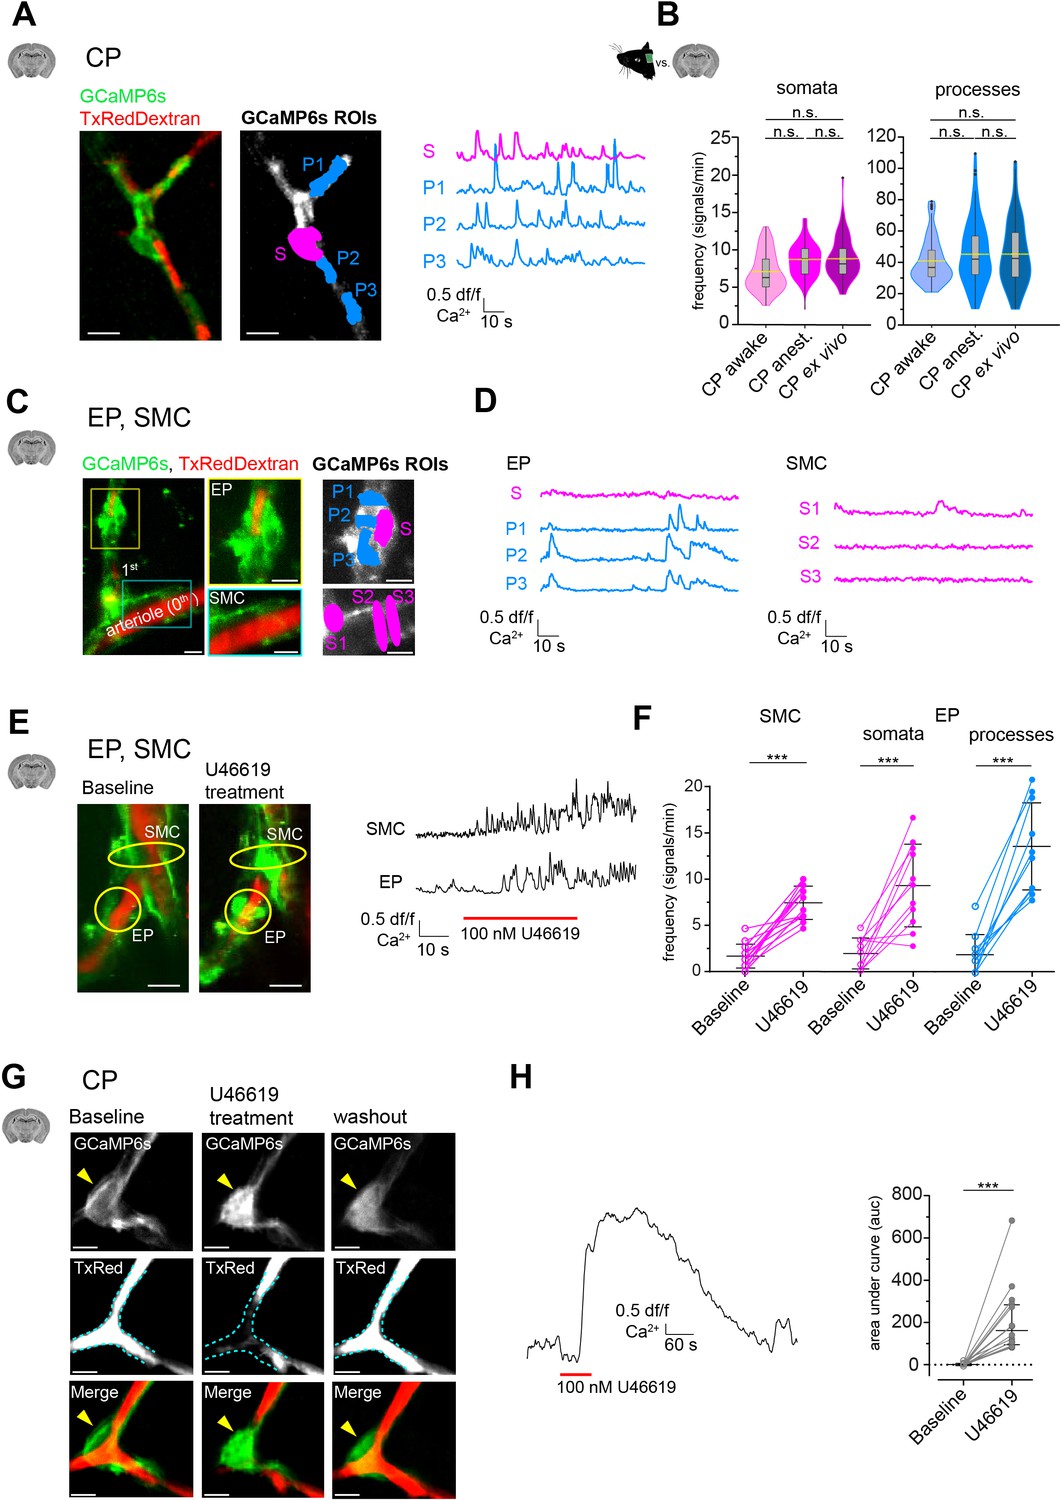
Mural cell calcium dynamics in acute cortical brain slices.
(A) Representative image of a CP ex vivo. In the GCaMP6s channel, ROIs for soma (S, in magenta) and processes (P1–3, in blue) are shown. On the right are the respective normalized traces of calcium signals. (B) Violin/box plots depicting the quantified calcium signal frequency of CPs ex vivo compared to the previously (Figure 2) determined calcium signal frequency in vivo for somata and processes. The dashed yellow lines indicate the mean values. Statistics were calculated using linear mixed-effects models and Tukey post hoc tests, CPawake: N = 3, n = 96; CPanest: N = 25, n = 93; CPex vivo: N = 52, n = 106, n.s. indicates not significant. Scale bars: 10 μm. (C) SMCs and EP ex vivo can be localized similarly to those in vivo by following the vessel branches of a pial artery lying on the surface of the brain slice. Z-stack (20 μm) image of an arteriole and its adjacent 1st-order branch, where SMCs and an EP is located. The yellow box shows a magnified image of the EP and the cyan box shows a magnified image of SMCs. In the GCaMP6s channel, ROIs for soma (S, in magenta) and processes (P1–3, in blue) are shown. (D) Corresponding normalized traces of calcium signals for the EP and SMCs in (C) are shown. (E) Z-stack (20 μm) images of an arteriole and its adjacent 1st-order branch harboring SMCs and an EP (indicated by the yellow circles), before and after U46619 treatment. Next to the images are the corresponding normalized traces of calcium signals for the indicated SMC and EP. (F) Quantifications of the calcium signal frequency in SMC and EP somata and processes, comparing baseline to the U46619 treatment. Data represents individual cells, median and interquartile ranges. Statistics were calculated using two-tailed paired t-tests, SMC: N = 4, n = 14; EP: N = 4, n = 11, ***p<0.001. Scale bars: 10 μm. (G) Time-averaged (10 s) images of a CP before, during U46619 (100 nM) treatment and recovery (30 min washout of U46619). U46619 causes a massive calcium response, which is accompanied by cytoplasmic blebbing and membrane ruffling (yellow arrowhead). The dashed cyan lines in the TxRed images outline the vessel at baseline level to highlight vessel changes during treatment and recovery. (H) A normalized trace of the calcium response of a CP to U46619 (100 nM) is shown. On the right is the quantification of the area under the curve (auc) comparing baseline to U46619 treatment. Data represents individual cells, median and interquartile ranges. Statistics were calculated using a two-tailed Wilcoxon matched-pairs signed rank test. N = 5, n = 16, ***p<0.001. Scale bars: 5 μm. The red line below the calcium trace indicates the time of drug addition. See also Figure 3—figure supplements 1–3. Data: Figure 3—source data 1.
-
Figure 3—source data 1
Source data for Figure 3.
- https://cdn.elifesciences.org/articles/70591/elife-70591-fig3-data1-v3.xlsx
Figure 3—figure supplement 1
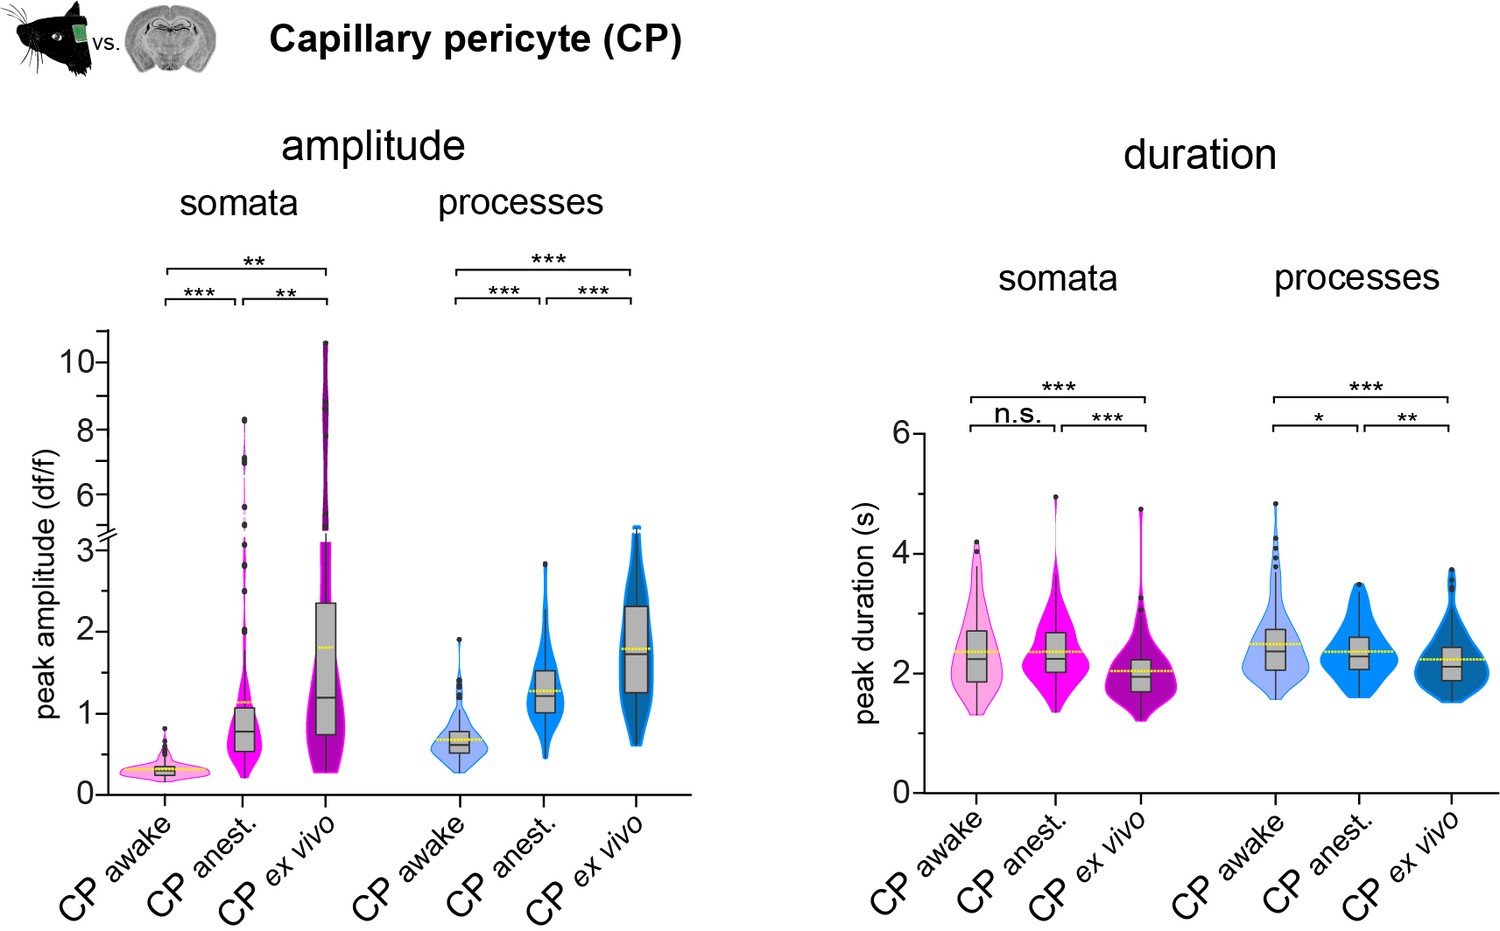
CP calcium signal properties in vivo compared to ex vivo.
Violin/box plots depicting the quantified calcium signal amplitude and duration comparing CPs in vivo (awake and anesthetized) with ex vivo for somata and processes. The dashed yellow lines indicate the mean value of the respective parameter. Statistics were calculated using linear mixed-effects models and Tukey post hoc tests. In vivo: awake, N = 3, n = 96, anesthetized, N = 25, n = 93; ex vivo: N = 52, n = 106. *p<0.05, **p<0.01, ***p<0.001, n.s. indicates not significant. Data: Figure 3—figure supplement 1—source data 1.
-
Figure 3—figure supplement 1—source data 1
Source data for Figure 3—figure supplement 1.
- https://cdn.elifesciences.org/articles/70591/elife-70591-fig3-figsupp1-data1-v3.xlsx
Figure 3—figure supplement 2
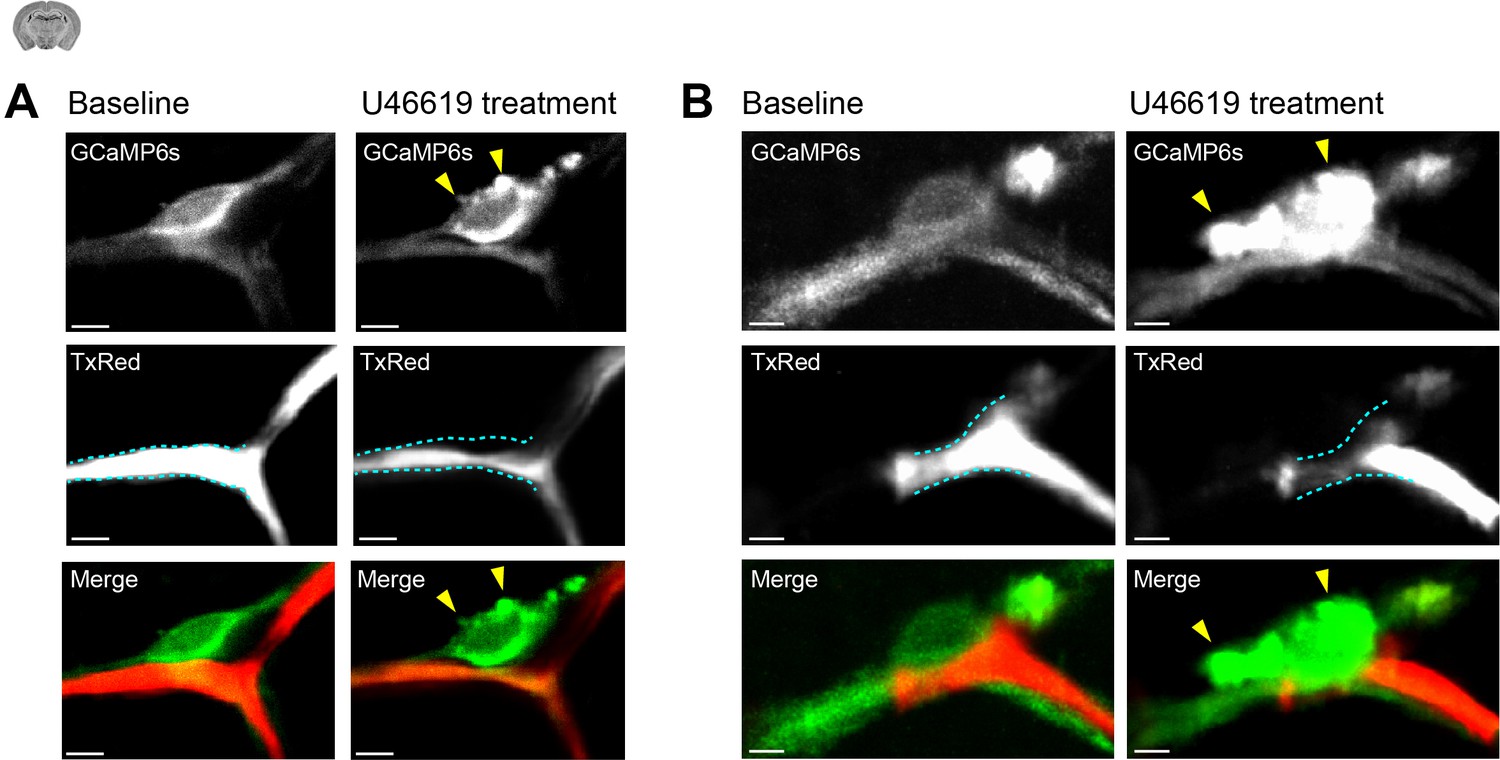
U46619 induced cytoplasmic changes in CPs.
(A, B) Images (15 s, time-averaged) of two CPs showing cellular morphology during baseline and U46619 (100 nM) treatment. Yellow arrowheads point to blebbing/cytoplasmic extrusions occurring during U46619 treatment. The dashed cyan lines in the TxRed images outline the vessel at baseline level to highlight vessel changes during U46619 treatment. Scale bars: 5 μm.
Figure 3—figure supplement 3
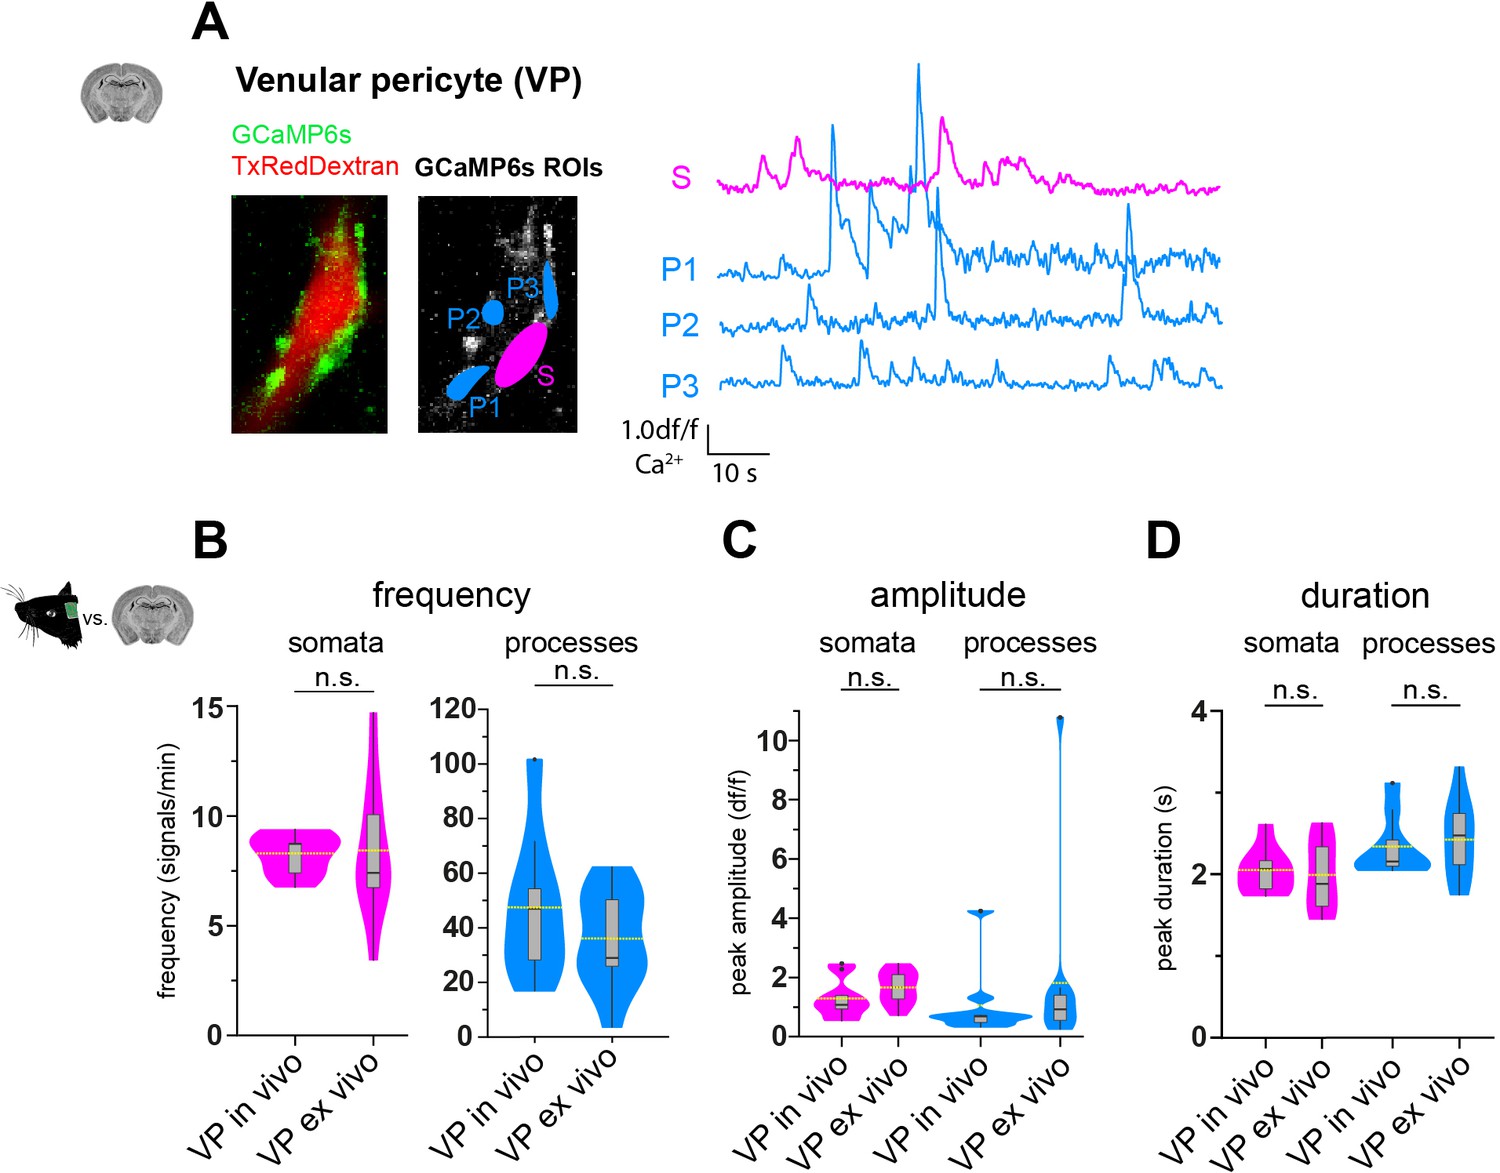
VP calcium signals in vivo compared to ex vivo.
(A) Representative image of a venular pericyte ex vivo. In the GCaMP6s channel, ROIs for soma (S, in magenta) and processes (P1–3, in blue) are shown. The respective normalized traces of calcium signals are shown to the right. (B–D) Violin/box plots depicting the quantified calcium signal (B) frequency, (C) amplitude, and (D) duration comparing in vivo (anesthetized) and ex vivo VPs for somata and processes. The dashed yellow lines indicate the mean value of the respective parameter. Statistics were calculated using linear mixed-effects models and Tukey post hoc tests. In vivo: N = 3, n = 9, ex vivo: N = 6, n = 11. n.s. indicates not significant. Data: Figure 3—figure supplement 3—source data 1.
-
Figure 3—figure supplement 3—source data 1
Source data for Figure 3—figure supplement 3.
- https://cdn.elifesciences.org/articles/70591/elife-70591-fig3-figsupp3-data1-v3.xlsx
Figure 4 with 1 supplement

Modulation of CP calcium signals ex vivo.
(A–C) CP calcium responses to the application of vasomodulators: (A) Endothelin-1 (100 nM), (B) ATP (100 µM), and (C) UDP-Glucose (100 µM).
On top are representative normalized calcium signal traces and below are quantifications of the area under the curve (auc), comparing baseline to the respective treatment. Data represents individual cells, median and interquartile ranges. Statistics were calculated using Wilcoxon matched-pairs signed rank tests. Endothelin-1: N = 3, n = 7, *p=0.02; ATP: N = 4, n = 8, **p=0.008; UDP-Glucose: N = 4, n = 11, ***p<0.001. (D) CP calcium response to application of the L-type voltage-gated calcium channel (L-type VGCC) blocker Nimodipine (100 µM). On top is a representative normalized calcium signal trace and below is the quantification of the signal frequency in somata and processes, comparing baseline to the Nimodipine treatment. Nimodipine was infused 15 min prior to data collection. Data represents individual cells, median and interquartile ranges. Statistics were calculated using two-tailed paired t-tests, N = 4, n = 11. S: t(10) = 2.39, *p=0.04; P: t(10) = 0.1495, p=0.88. (E) CP calcium response to application of the TRPC channel blocker SKF96365 (100 µM) and endstimulus application (U46619, 100 nM). On top is a representative normalized calcium signal trace and below is the quantification of the signal frequency in somata and processes, comparing baseline to the SKF96365 treatment and the quantification of the area under the curve (auc), comparing baseline to endstimulus treatment. Data represents individual cells, median and interquartile ranges. Statistics were calculated using a Wilcoxon matched-pairs signed rank test, N = 3, n = 7. S: *p=0.02; P: *p=0.02, endstim: *p=0.02. The red lines below the traces indicate the addition time of the respective drug. n.s. indicates not significant, *p<0.05, **p<0.01, ***p<0.001. See also Figure 4—figure supplement 1, 2 and 3. Data: Figure 4—source data 1.
-
Figure 4—source data 1
Source data for Figure 4.
- https://cdn.elifesciences.org/articles/70591/elife-70591-fig4-data1-v3.xlsx
Figure 4—figure supplement 1

CP calcium response to application of DMSO (0.2%).
On top is a representative normalized calcium signal trace and below is the quantification of the signal frequency in somata and processes, comparing baseline to DMSO treatment. DMSO was infused 15 min prior to data collection. Data represents individual cells, median and interquartile ranges. Statistics were calculated using two-tailed paired t-tests, N = 3, n = 11. S: t(10) = 0.8195, p=0.43; P: t(10) = 0.1835, p=0.86. n.s. indicates not significant. The red line below the trace indicates the addition time of the drug. Data: Figure 4—figure supplement 1—source data 1 .
-
Figure 4—figure supplement 1—source data 1
Source data for Figure 4—figure supplement 1.
- https://cdn.elifesciences.org/articles/70591/elife-70591-fig4-figsupp1-data1-v3.xlsx
Figure 5 with 2 supplements

Calcium signal drop in all mural cells along a vascular branch in response to neuronal activation.
(A) Z-stack (10 µm) image of a CP inside the area of neurons, expressing hM3D(Gq)-mCherry. (B) Z-stack (75 µm) of a vascular tree with connected capillaries reaching into an area of neurons expressing hM3D(Gq)-mCherry (indicated by the dashed cyan lines), before and during clozapine treatment. Scale bar = 10 µm. (C) Normalized calcium signal trace of a CP to chemogenetic activation of hM3D(Gq) transduced neurons in vivo and the quantification of the calcium signal frequency, comparing baseline to stimulation. Data represents individual cells, median, and interquartile ranges. Statistics were calculated using a Wilcoxon matched-pairs signed rank test for S (***p<0.001) and a two-tailed paired t-test for P (t(15) = 8.815, ***p<0.001), N = 4, n = 16. (D) Images of a CP before and during clozapine treatment. The numbers indicate the vascular diameter in µm. On the right vascular diameters measured at the site of the soma, before (4.1 ± 0.8 µm) and during treatment (4.5 ± 0.7 µm) are shown. Data represents individual cells, mean and standard deviation. Statistics were calculated using a two-tailed paired t-test, t(15) = 3.245, **p=0.005, N = 4, n = 16. Scale bar = 5 µm. (E) Normalized calcium signal trace of an EP (located on a vascular branch connected to capillaries in an area of hM3D(Gq) transduced neurons) to chemogenetic activation of neurons in vivo. On the left quantification of the calcium signal frequency, comparing baseline to stimulation is shown. Data represents individual cells, median and interquartile ranges. Statistics were calculated using a two-tailed paired t-test for S (t(10) = 10.71, ***p<0.001) and a Wilcoxon matched-pairs signed rank test for P (***p<0.001), N = 3, n = 11. (F) Images of two EPs (somata are indicated by yellow arrowheads) before and during clozapine treatment are shown. The numbers indicate the vascular diameter in µm. On the right vascular diameters measured at the site of the soma, before (5.9 ± 1.1 µm) and during treatment (7.5 ± 1.9 µm) are shown. Data represents individual cells, mean and standard deviation. Statistics were calculated using a two-tailed paired t-test, t(10) = 5.375, ***p<0.001, N = 3, n = 11. Scale bar = 5 µm. (G) Normalized calcium signal trace of a SMC (located on a vascular branch connected to capillaries in an area of hM3D(Gq) transduced neurons) to chemogenetic activation of neurons in vivo. On the left quantification of the calcium signal frequency, comparing baseline to stimulation is shown. Data represents individual cells, median and interquartile ranges. Statistics were calculated using a two-tailed paired t-test, t(12) = 16.55, ***p<0.001, N = 3, n = 13. (H) Images of SMCs before and during clozapine treatment are shown. The numbers indicate the vascular diameter in µm. On the right vascular diameter before (14.7 ± 6.6 µm) and during treatment (18.2 ± 8.1 µm) are shown. Data represents individual cells, mean and standard deviation. Statistics were calculated using a two-tailed paired t-test, t(12) = 6.985, ***p<0.001, N = 3, n = 13. Scale bar = 20 µm. See also Figure 5—figure supplements 1 and 2. Data: Figure 5—source data 1.
-
Figure 5—source data 1
Source data for Figure 5.
- https://cdn.elifesciences.org/articles/70591/elife-70591-fig5-data1-v3.xlsx
Figure 5—figure supplement 1
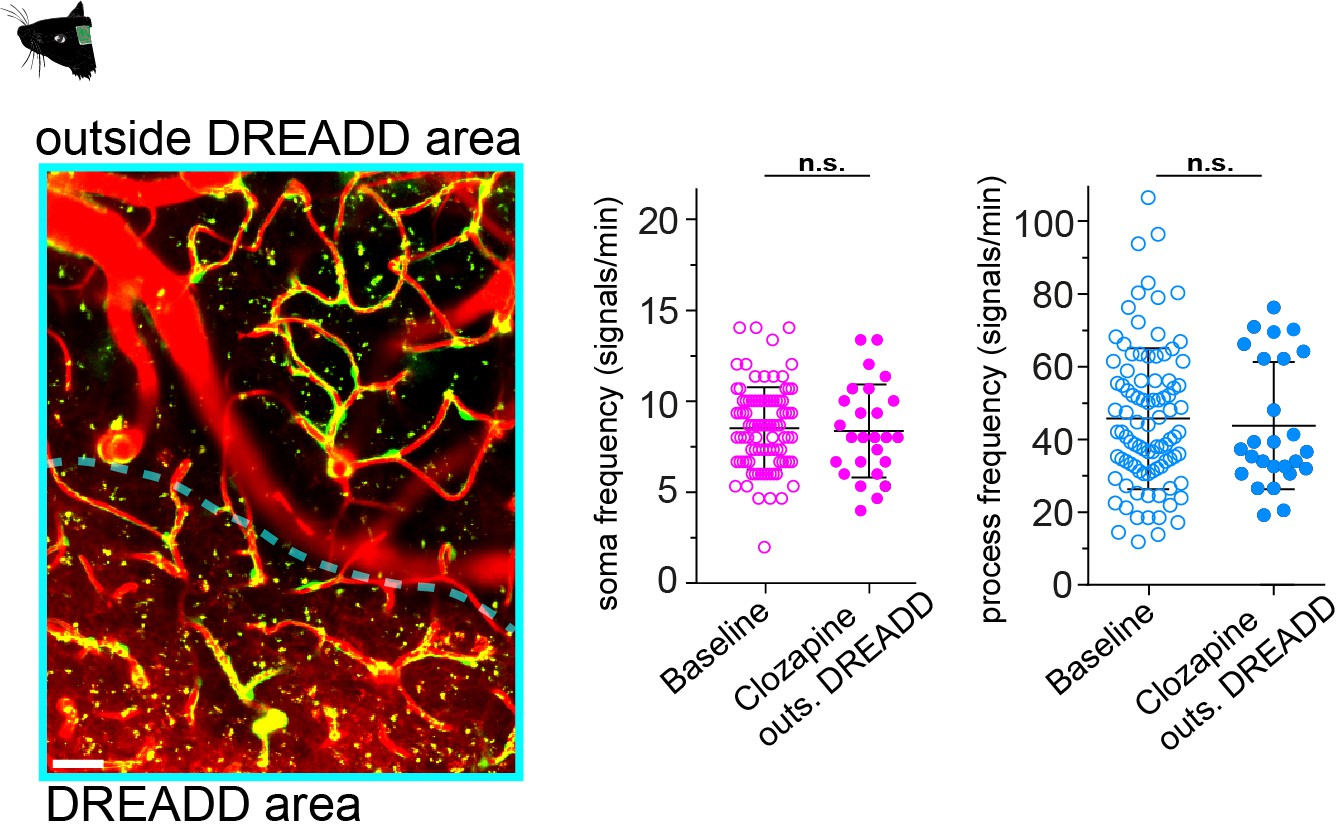
CP calcium frequency is not affected by clozapine.
On the left a z-projection showing an area of neurons transduced by hM3D(Gq)-mCherry (’DREADD area’, encircled by dashed cyan line) and a control region (‘outside DREADD area’). On the right quantifications of the calcium signal frequency for somata and processes, comparing baseline measurements to clozapine treatment (CPs from outside DREADD area) are shown. Data represents individual cells, median and interquartile ranges. Statistics were calculated using linear mixed-effects models and Tukey post hoc tests. Baseline: N = 3, n = 93, clozapine outs. DREADD: N = 9, n = 26, n.s. indicates not significant. Scale bar: 10 μm. Data: Figure 5—figure supplement 1—source data 1.
-
Figure 5—figure supplement 1—source data 1
Source data for Figure 5—figure supplement 1.
- https://cdn.elifesciences.org/articles/70591/elife-70591-fig5-figsupp1-data1-v3.xlsx
Figure 5—figure supplement 2

Recovery of mural cell calcium activity post-clozapine treatment.
(A) Images of two CPs (indicated as CP1 and CP2) before, during clozapine treatment and recovery (1 day post-clozapine treatment). From left to right: Merge, vasculature image (TexasRed channel), mural cell labeling (GCaMP6s channel), calcium trace of the indicated cell (yellow circle). The white numbers in the TexasRed images indicate the vessel diameter in µm measured at the yellow dashed line. Scale bars: 10 µm. (B) Images of an EP and SMCs before, during clozapine treatment and recovery (1 day post-clozapine treatment). From left to right: Merge, vasculature image (TexasRed channel), mural cell labeling (GCaMP6s channel), calcium trace of the indicated cell (yellow circle). The white numbers in the TexasRed images indicate the vessel diameter in µm measured at the yellow dashed line. Scale bars: 10 µm. (C) Images of SMCs before, during clozapine treatment and recovery (1 day post-clozapine treatment). From left to right: Merge, vasculature image (TexasRed channel), mural cell labeling (GCaMP6s channel), calcium trace of the indicated cell (yellow circle). The white numbers in the TexasRed images indicate the vessel diameter in µm measured at the yellow dashed line. Scale bars: 10 µm.
Figure 6 with 3 supplements
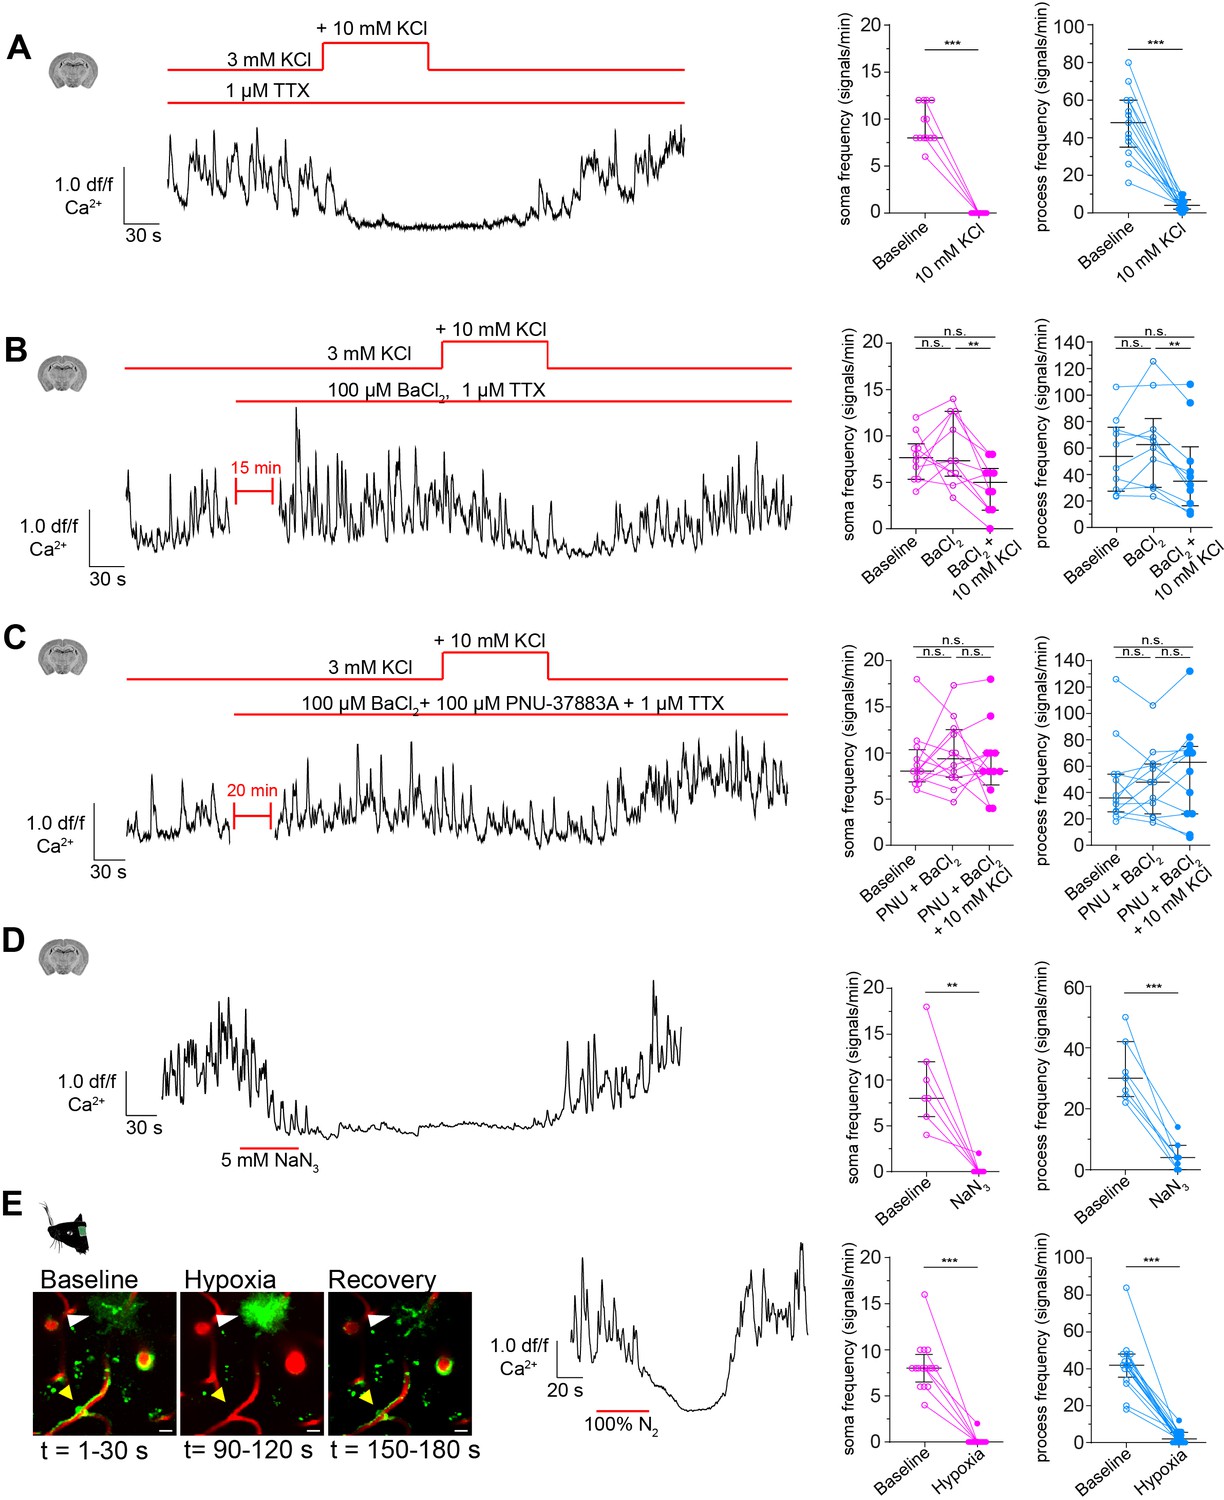
CPs react to increased extracellular potassium.
(A) Calcium response of CPs to a 10 mM rise of extracellular potassium in the presence of TTX (1 µM) ex vivo. A representative normalized calcium signal trace (left) and the quantification of the calcium signal frequency, comparing baseline to treatment (right) are shown. Data represents individual cells, median and interquartile ranges. Statistics were calculated using a Wilcoxon matched-pairs signed rank test (for S) and a two-tailed paired t-test (for P), N = 4, n = 13. S: ***p<0.001; P: t(12) = 8.516, ***p<0.001. (B) Calcium response of CPs to a 10 mM rise of extracellular potassium in the presence of TTX (1 µM) and Kir2 channel blocker BaCl2 (100 µM) ex vivo. A representative normalized calcium signal trace is shown on the left and on the right, the calcium signal frequency is quantified, comparing baseline to pre-treatment (TTX + BaCl2) and additional potassium treatment. Data represents individual cells, median and interquartile ranges. Statistics were calculated using a one-way ANOVA, N = 4, n = 10. S: F(1.796, 16.17) = 5.728, p=0.02, P(baseline vs. BaCl2) = 0.82, p(baseline vs. BaCl2+ KCl) = 0.10, p(BaCl2 vs. BaCl2+ KCl) = 0.009; P: F(1.542, 13.88) = 7.137, p=0.01, p(baseline vs. BaCl2) = 0.31, p(baseline vs. BaCl2+ KCl) = 0.22, P(BaCl2 vs. BaCl2+ KCl) = 0.002. (C) Calcium response of CPs to a 10 mM rise of extracellular potassium in the presence of TTX (1 µM), Kir2 channel blocker BaCl2 (100 µM), and KATP channel blocker PNU-37883A (100 µM) ex vivo. A representative normalized calcium signal trace is shown on the left. On the right, the calcium signal frequency is quantified, comparing baseline to pre-treatment (TTX + BaCl2+ PNU-37883A) and additional potassium treatment. Data represents individual cells, median and interquartile ranges. Statistics were calculated using a one-way ANOVA, N = 4, n = 12. S: F(1.395, 15.35) = 0.2248, p=0.72, P(baseline vs. PNU + BaCl2) = 0.76, p(baseline vs. PNU + BaCl2+ KCl) = 0.99, p(PNU + BaCl2 vs. PNU + BaCl2+ KCl) = 0.77; P: F(1.683, 18.51) = 0.9687, p=0.38, p(baseline vs. PNU + BaCl2) = 0.96, P(baseline vs. PNU + BaCl2+ KCl) = 0.54, P(PNU + BaCl2 vs. PNU + BaCl2+ KCl) = 0.44. (D) Calcium response of CPs to NaN3 (5 mM) ex vivo. A representative normalized calcium signal trace is shown on the left and the quantification of the calcium signal frequency, comparing baseline to NaN3 treatment is shown on the right. Data represents individual cells, median and interquartile ranges. Statistics were calculated using two-tailed paired t-tests, N = 3, n = 7. S: t(6) = 4.824, **p=0.003; P: t(6) = 7.621, ***p<0.001. (E) Calcium response of CPs to an acute hypoxia insult in vivo. On the left, two-photon images show the time course and GCaMP6s fluorescence of the hypoxic insult (yellow arrowhead: capillary pericyte; white arrowhead: astrocyte). Center, a representative normalized calcium signal trace is shown. The calcium signal frequency is quantified on the right. Baseline is compared to hypoxic intervention. Data represents individual cells, median and interquartile ranges. Statistics were calculated using Wilcoxon matched-pairs signed rank tests, N = 4, n = 16. S: ***p<0.001; P: ***p<0.001. The red lines indicate the addition time of the respective drug. See also Figure 6—figure supplements 1–3. Data: Figure 6—source data 1.
-
Figure 6—source data 1
Source data for Figure 6.
- https://cdn.elifesciences.org/articles/70591/elife-70591-fig6-data1-v3.xlsx
Figure 6—figure supplement 1
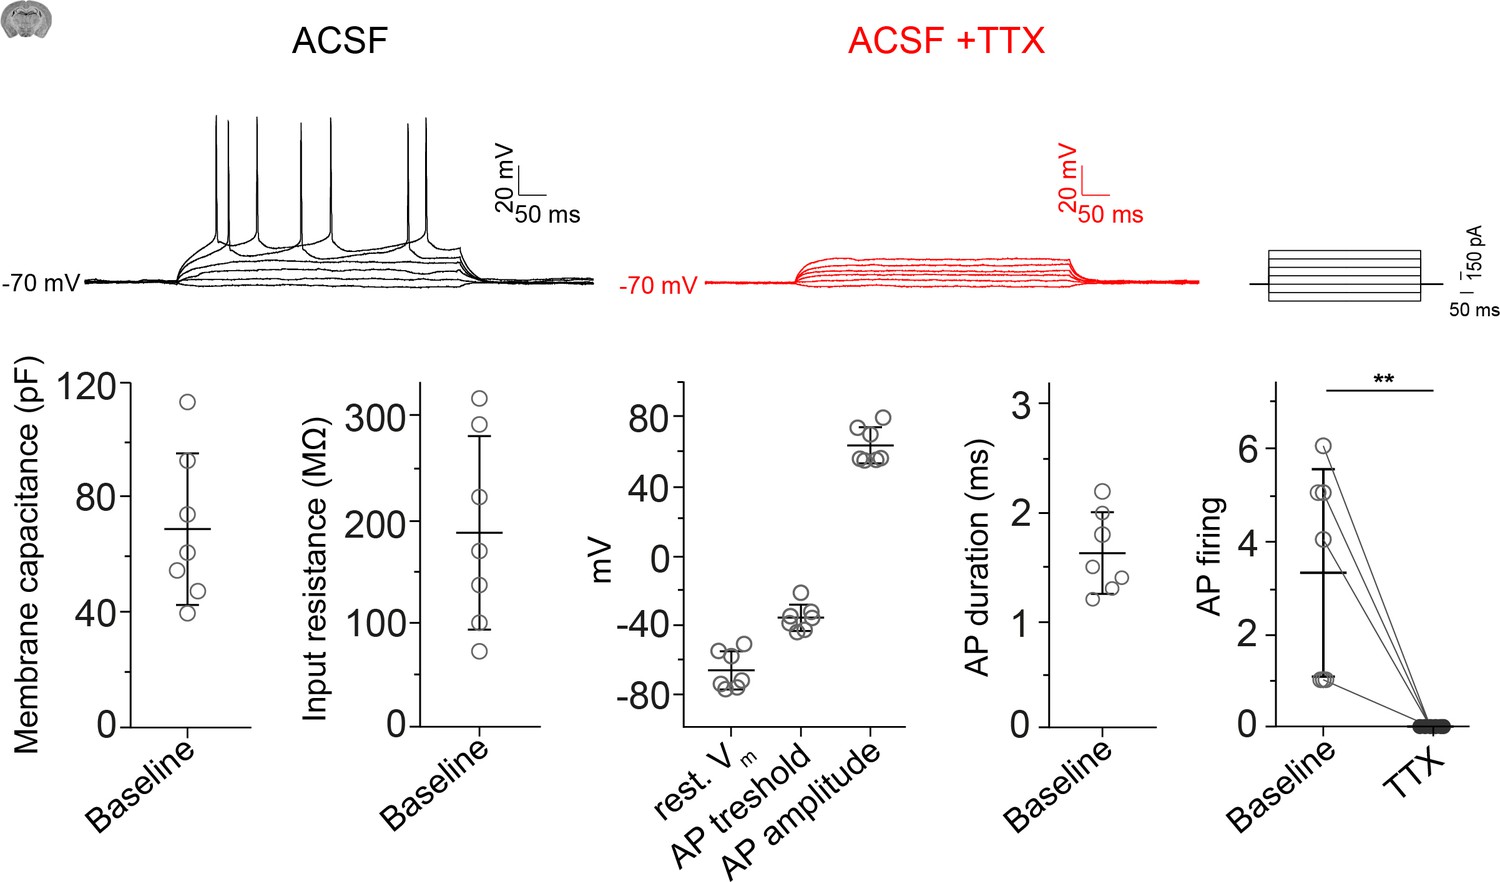
Electrophysiology of cortical L2/3 pyramidal neurons.
On top are electrophysiological profiles of L2/3 cortical pyramidal neurons to 200 pA current steps (500 ms) before and after TTX (1 µM) treatment. Below are values of passive membrane properties including membrane capacitance, input resistance, resting membrane potential and action potential (AP) threshold, amplitude, and duration. The number of AP firing before and after TTX (1 µM) treatment are shown. Data is represented as single cells with mean ± SD. Two-tailed paired t-test, N = 4, n = 7, t(6) = 3.925, **p=0.008. Data: Figure 6—figure supplement 1—source data 1.
-
Figure 6—figure supplement 1—source data 1
Source data for Figure 6—figure supplement 1.
- https://cdn.elifesciences.org/articles/70591/elife-70591-fig6-figsupp1-data1-v3.xlsx
Figure 6—figure supplement 2

CP calcium response to application of TTX (1 µM).
On top is a representative normalized calcium signal trace and below is the quantification of the signal frequency in somata and processes, comparing baseline to the TTX treatment. TTX was infused 5 min prior to data collection. Data represents individual cells, median and interquartile ranges. Statistics were calculated using two-tailed paired t-tests, N = 3, n = 9. S: t(8) = 1.113, p=0.2979; P: t(8) = 0.5425, p=0.6. Data: Figure 6—figure supplement 2—source data 1.
-
Figure 6—figure supplement 2—source data 1
Source data for Figure 6—figure supplement 2.
- https://cdn.elifesciences.org/articles/70591/elife-70591-fig6-figsupp2-data1-v3.xlsx
Figure 6—figure supplement 3
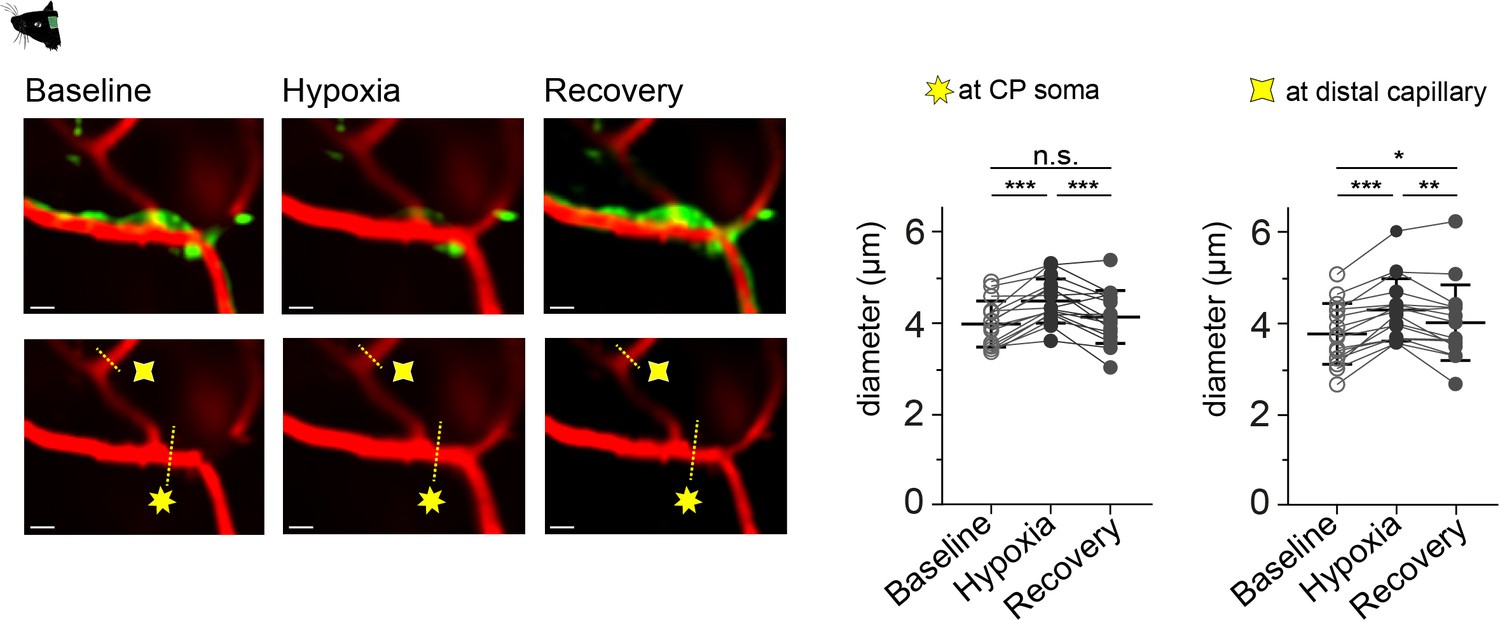
Capillary diameter changes to hypoxic insults.
On the left, time-averaged (20 s) images of a CP (green, GCaMP6s) and capillary branches (red, Texas Red Dextran) during baseline, hypoxia and recovery. The dashed yellow lines indicate the place of diameter measurement and the stars the measurement category (seven point star: at CP soma and four point star: at distal capillary). On the right, quantification of the capillary diameters (mean ± SD) measured at the soma during baseline (4.0 ± 0.5 µm), hypoxia (4.5 ± 0.5 µm) and recovery (4.1 ± 0.6 µm) and at distal capillaries during baseline (3.8 ± 0.7 µm), hypoxia (4.3 ± 0.7 µm) and recovery (4.0 ± 0.8 µm) are shown. Data represents individual points, mean and standard deviation. Statistics were calculated using a two-way ANOVA, N = 4, n = 16, ***p<0.001. Scale bar = 10 µm.Data: Figure 6—figure supplement 3—source data 1.
-
Figure 6—figure supplement 3—source data 1
Source data for Figure 6—figure supplement 3.
- https://cdn.elifesciences.org/articles/70591/elife-70591-fig6-figsupp3-data1-v3.xlsx
Figure 7
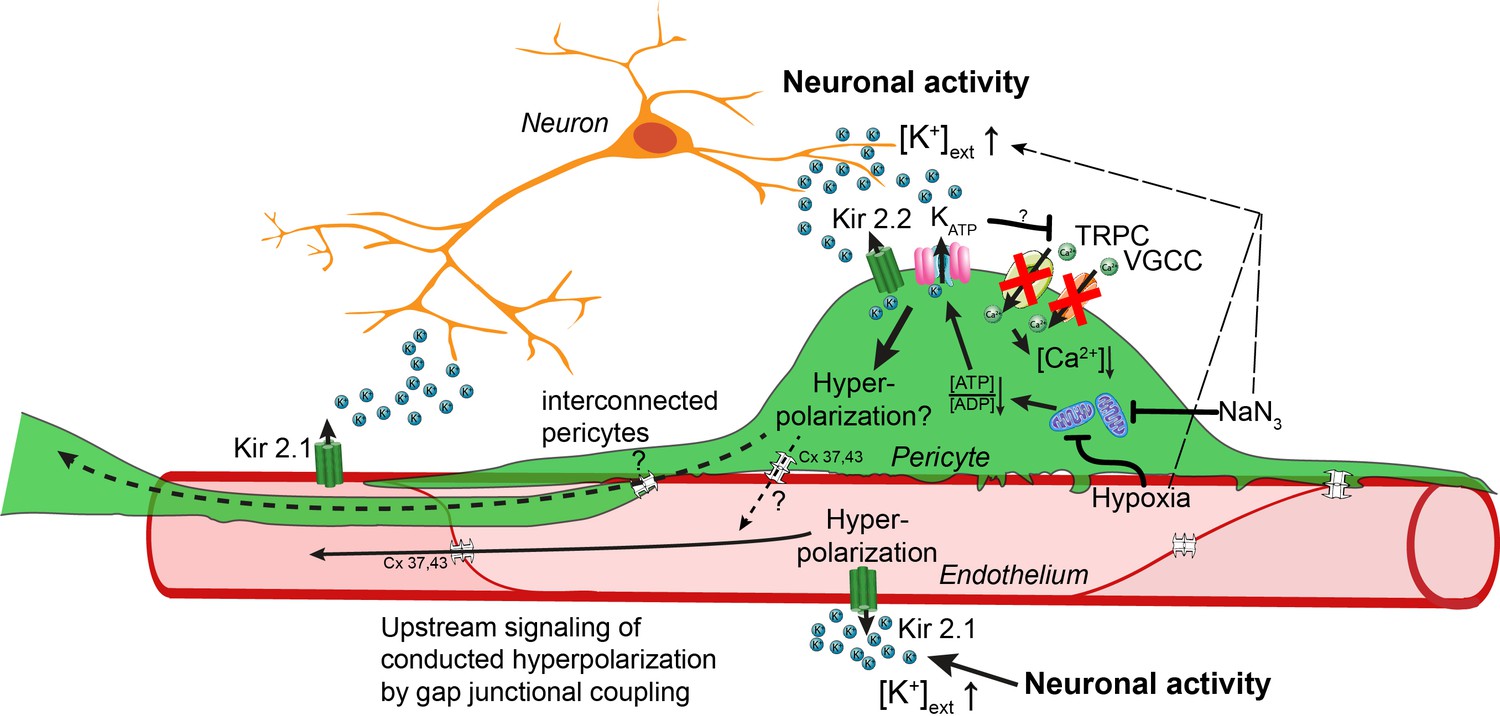
Working model of potassium-induced calcium changes in capillary pericytes.
Neuronal activity leads to the release of potassium into the extracellular space.This rise in potassium [K+] activates Kir2.1 channels on capillary endothelial cells (EC) to induce a retrograde propagating hyperpolarization via gap-junctional coupling (Longden et al., 2017), which leads to upstream dilation of arteries. Elevated neuronal activity and a rise in extracellular potassium decrease calcium signaling in pericytes. Kir2.2 and KATP channels expressed on capillary pericytes (CPs) may induce a hyperpolarization in CPs as recently shown (Sancho et al., 2021). This hyperpolarization would inactivate TRPC and VGCC channels in CPs leading to a drop in calcium signals. Hypoxia or inhibition of respiratory metabolism reduce the [ATP]/[ADP] ratio thereby activating KATP and Kir2.2 channels to induce a hyperpolarization. By gap-junction coupling (Cx 37, 43) between ECs and CPs, the hyperpolarization of the EC–CP capillary unit could be transmitted retrogradely to induce upstream vascular responses.
Author response image 1

Hypothetical experiment to investigate signal transmission between CPs along a vascular branch.
Author response image 2

(i) Confocal image of SMCs showing Merge, GCaMP6s (pdgfrβ-driven), and nuclear DAPI stain.
(ii) Confocal image of an EP/terminal vSMCs showing Merge, GCaMP6s (pdgfrβ-driven), and nuclear DAPI stain. (iii) Confocal image of a CP showing Merge, GCaMP6s (pdgfrβdriven), and nuclear DAPI stain. Yellow arrows point to the respective cell-type. Scale bars: 10 µm.
Author response image 3

Correlation analysis of process and somata transients for ex vivo, anesthetized and awake Ca2+ – measurements.
Grey points represent outlier values.
Videos
Video 1
Basal SMC calcium activity in vivo.
Recorded at 11.84 Hz and played at 45 fps, showing Merge, TxRed, and GCaMP6s channels. Scale bar 5 µm.
Video 2
Basal ensheathing pericyte calcium activity in vivo.
Recorded at 11.84 Hz and played at 45 fps, showing Merge, TxRed, and GCaMP6s channels. Scale bar 10 µm.
Video 3
Basal capillary pericyte calcium activity in vivo.
Recorded at 11.84 Hz and played at 45 fps, showing Merge, TxRed, and GCaMP6s channels. Scale bar 10 µm.
Video 4
Basal venular pericyte calcium activity in vivo.
Recorded at 11.84 Hz and played at 45 fps, showing Merge, TxRed, and GCaMP6s channels. Scale bar 10 µm.
Video 5
Ex vivo application of U46619 (100 nM) leads to a strong calcium response in CPs with cytoplasmic extrusions.
Recorded at 0.75 Hz and played at 20 fps, showing Merge, TxRed, and GCaMP6s channels. Scale bar 10 µm.
Video 6
Chemogenetic activation of hM3D(Gq) DREADD transduced neurons leads to a calcium signal drop in CPs.
Arrows point to CPs. Recorded at 11.84 Hz and played at 45 fps. Scale bar 10 µm.
Video 7
Mural cells at a precapillary branch.
Recorded at 11.84 Hz and played at 45 fps, showing Merge, TxRed, and GCaMP6s channels. Scale bar 10 µm.
Tables
Table 1
Basal calcium signal properties of mural cells in awake and anesthetized animals.
Summary table of calcium signal frequency, amplitude, and duration of different mural cells from awake and anesthetized measurements in vivo. Values are represented as mean ± SD.
| Frequency (signals/min) | Amplitude (df/f) | Duration (s) | ||||
|---|---|---|---|---|---|---|
| Awake | Anesthetized | Awake | Anesthetized | Awake | Anesthetized | |
| SMC | 9.4 ± 3.0 | 7.1 ± 1.6 | 0.3 ± 0.2 | 0.6 ± 0.3 | 3.1 ± 1.3 | 3.4 ± 0.9 |
| EP_Soma | 8.9 ± 3.2 | 8.3 ± 2.8 | 0.5 ± 0.4 | 0.6 ± 0.4 | 2.6 ± 0.9 | 3.0 ± 0.9 |
| EP_Process | 20.2 ± 7.8 | 21.6 ± 12.0 | 0.9 ± 0.5 | 1.3 ± 0.7 | 2.9 ± 0.7 | 3.4 ± 0.9 |
| CP_Soma | 6.9 ± 2.7 | 8.5 ± 2.3 | 0.3 ± 0.1 | 1.1 ± 1.3 | 2.4 ± 0.7 | 2.4 ± 0.6 |
| CP_Process | 39.6 ± 14.5 | 45.7 ± 19.3 | 0.7 ± 0.3 | 1.3 ± 0.4 | 2.6 ± 0.6 | 2.4 ± 0.4 |
Key resources table
| Reagent type (species) or resource | Designation | Source or reference | Identifiers | Additional information |
|---|---|---|---|---|
| Genetic reagent (M. musculus) | B6.Cg-Tg(Pdgfrb-CreERT2)6,096Rha/J | Jackson Laboratory | #029684RRID:IMSR_JAX:029684 | Pdgfrb-CreERT2 |
| Genetic reagent (M. musculus) | Ai96 | Jackson Laboratory | #028866RRID:IMSR_JAX:024106 | GCaMP6s |
| Recombinant DNA reagent | AAV2-hSYN-hM3D (Gq)-mCherry | VVF, UZH Zuerich | ID: v101 | |
| Chemical compound, drug | Tamoxifen | Sigma-Aldrich | Cat. #: T5648 | 10 mg/ml |
| Chemical compound, drug | Isoflurane | Piramal Healthcare | Attane | |
| Chemical compound, drug | Texas Red Dextrane 70 kDa | Life Technologies | Cat. #: D-1864 | 2.5% |
| Chemical compound, drug | Nimodipine | Tocris | Cat. #: 0600 | |
| Chemical compound, drug | Endothelin-1 | Tocris | Cat. #: 1,160 | |
| Chemical compound, drug | TTX citrate | Tocris | Cat. #: 1,069 | |
| Chemical compound, drug | SKF96365 HCl | Tocris | Cat. #: 1,147 | |
| Chemical compound, drug | PNU-37883A HCl | Tocris | Cat. #: 2095 | |
| Chemical compound, drug | U46619 | Tocris | Cat. #: 1932 | |
| Chemical compound, drug | Clozapine | Tocris | Cat. #: 0444 | |
| Chemical compound, drug | UDP-Glucose 2Na+ | Sigma-Aldrich | Cat. #: 94,335 | |
| Chemical compound, drug | ATP | Sigma-Aldrich | Cat. #: A2383 | |
| Chemical compound, drug | DMSO | Sigma-Aldrich | Cat. #: 41,640 | |
| Software, algorithm | R studio | RStudio Team (2020) | v.1.0.136 | http://www.rstudio.com/ |
| Software, algorithm | GraphPad Prism | GraphPad Software La Jolla | V7.0RRID:SCR_002798 | |
| Software, algorithm | Matlab | MathWorks | R2017bRRID:SCR_001622 | |
| Software, algorithm | Matlab code CHIPS | https://ein-lab.github.io/ Barrett et al., 2018 | ||
| Software, algorithm | ImageJ | http://imageJ.nih.gov/ij | 1.53 cRRID:SCR_003070 | |
| Software, algorithm | ImageJ Vessel diameter plugin | PMID:20406650 | v.1.0 | |
| Software, algorithm | ScanImage | Janelia Research Campus | R3.8.1RRID:SCR_014307 | |
| Other | Inline heated perfusion cube | ALA Scientific Instruments | HPC-G | |
| Other | Sapphire glass | UQG Optics | Ø 3 × 3 mm |
Additional files
-
Transparent reporting form
- https://cdn.elifesciences.org/articles/70591/elife-70591-transrepform1-v3.pdf
-
Source code 1
Source Code file for CHIPS.
- https://cdn.elifesciences.org/articles/70591/elife-70591-supp1-v3.zip
Download links
A two-part list of links to download the article, or parts of the article, in various formats.
Downloads (link to download the article as PDF)
Open citations (links to open the citations from this article in various online reference manager services)
Cite this article (links to download the citations from this article in formats compatible with various reference manager tools)
Distinct signatures of calcium activity in brain mural cells
eLife 10:e70591.
https://doi.org/10.7554/eLife.70591


