The hepatic AMPK-TET1-SIRT1 axis regulates glucose homeostasis
- Key Laboratory of Prevention and Treatment of Cardiovascular and Cerebrovascular Diseases of Ministry of Education, Gannan Medical University, China
- School of Pharmacy, Nanchang University, China
- Beijing Institutes of Life Science, Chinese Academy of Sciences, China
- Precision Medicine Center, First Affiliated Hospital of Gannan Medical University, China
- State Key Laboratory of Cellular Stress Biology, Innovation Center for Cell Biology, School of Life Sciences, Xiamen University, China
- School of Basic Medical Sciences, Nanchang University, China
Figures
Figure 1 with 3 supplements
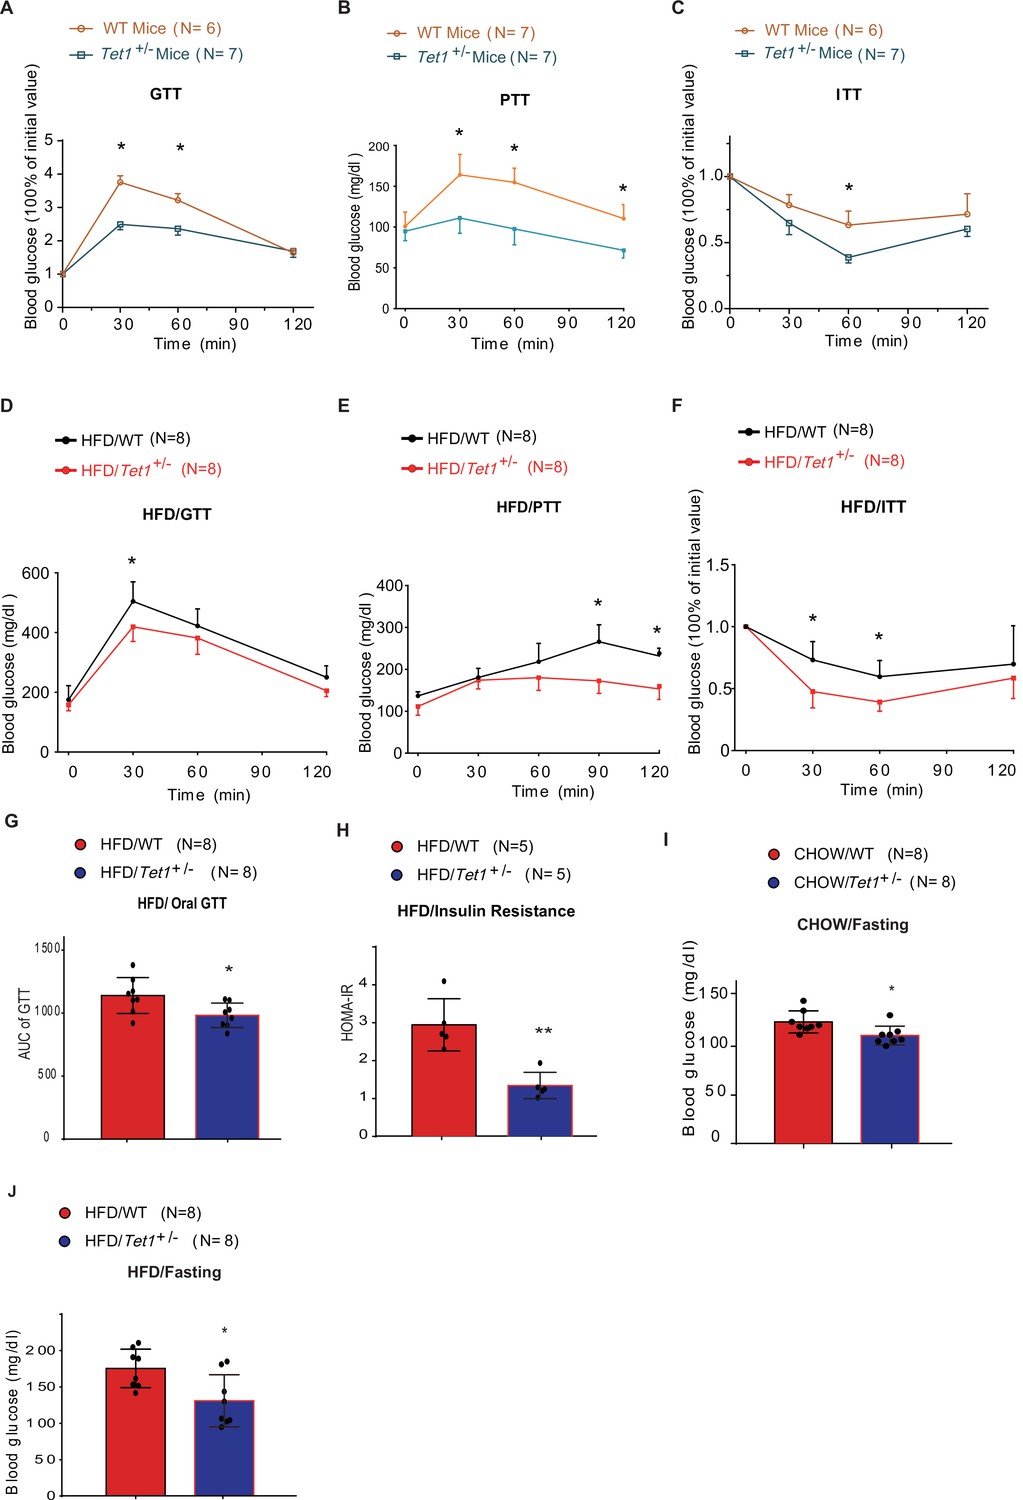
Tet1 deficiency leads to murine glucose metabolism defect.
(A) Glucose tolerance test (GTT) assays in Tet1+/- male mice and wild-type (WT) male mice (*p < 0.05). (B) Pyruvate tolerance test (PTT) assays in Tet1+/- male mice and WT male mice (*p < 0.05). (C) Insulin tolerance test (ITT) assays in Tet1+/- male mice and WT male mice (*p < 0.05). (D) GTT assays in HFD-fed Tet1+/- male mice and WT male mice (*p < 0.05). (E) PTT assays in high-fat diet (HFD)-fed Tet1+/- male mice and WT male mice (*p < 0.05). (F) ITT assays in HFD-fed Tet1+/- male mice and WT male mice (*p < 0.05). (G) Area under the curve (AUC) of oral GTT assays in HFD-fed Tet1+/- male mice and WT male mice (*p < 0.05). (H) Homeostatic Model Assessment for Insulin Resistance (HOMA-IR) assay in HFD-fed Tet1+/- male mice and WT male mice (**p < 0.01). (I) The blood glucose levels in Tet1+/- male mice and WT male mice with fasting for 24 hr (*p < 0.05). (J) The blood glucose levels in HFD-fed Tet1+/- male mice and WT male mice with fasting for 24 hr (*p < 0.05).
Figure 1—figure supplement 1
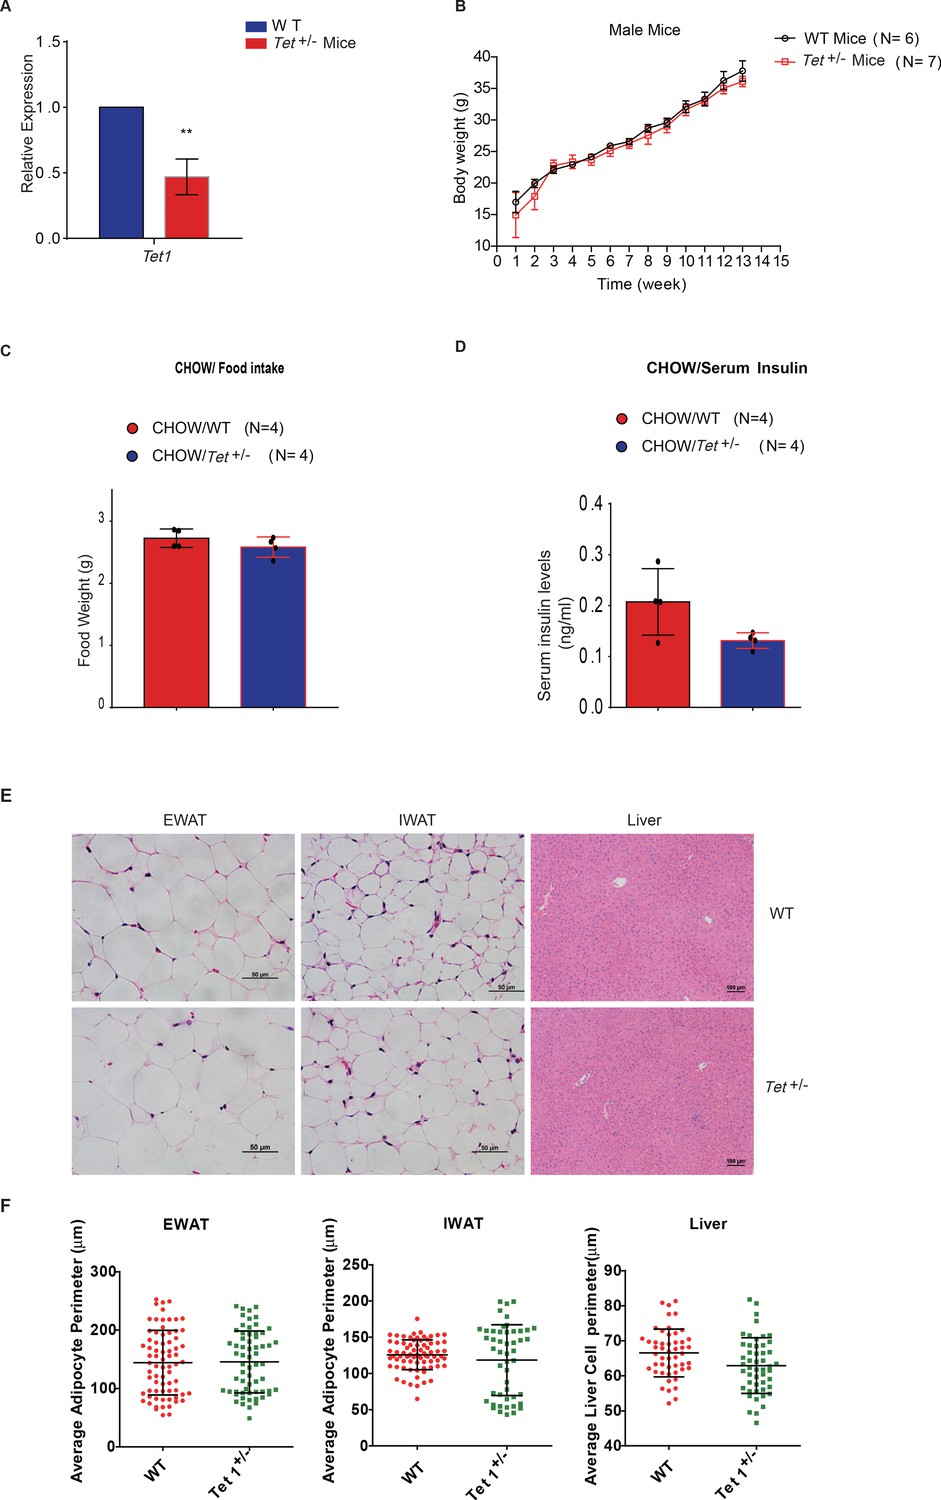
The body weight, food intake, and serum insulin of Tet1+/- mice has no alternation compared with wild-type (WT) mice.
(A) qRT-PCR analysis of the transcriptional expression of Tet1 in Tet1+/- male mice. (B) There is no change in body weight of Tet1+/- male mice and WT male mice. (C) There is no change in the food intake between Chow-fed Tet1+/- male mice and Chow-fed WT male mice. (D) There is no change in serum insulin between Chow-fed Tet1+/- male mice and Chow-fed WT male mice. (E and F) Representative H&E staining of epididymal white adipose tissue (EWAT), inguinal white adipose tissue (IWAT), and liver from WT and Tet1+/- mice and quantification of fiber size (average adipocyte perimeter) (n = 6). Data are expressed as mean ± s.e.m.
Figure 1—figure supplement 2
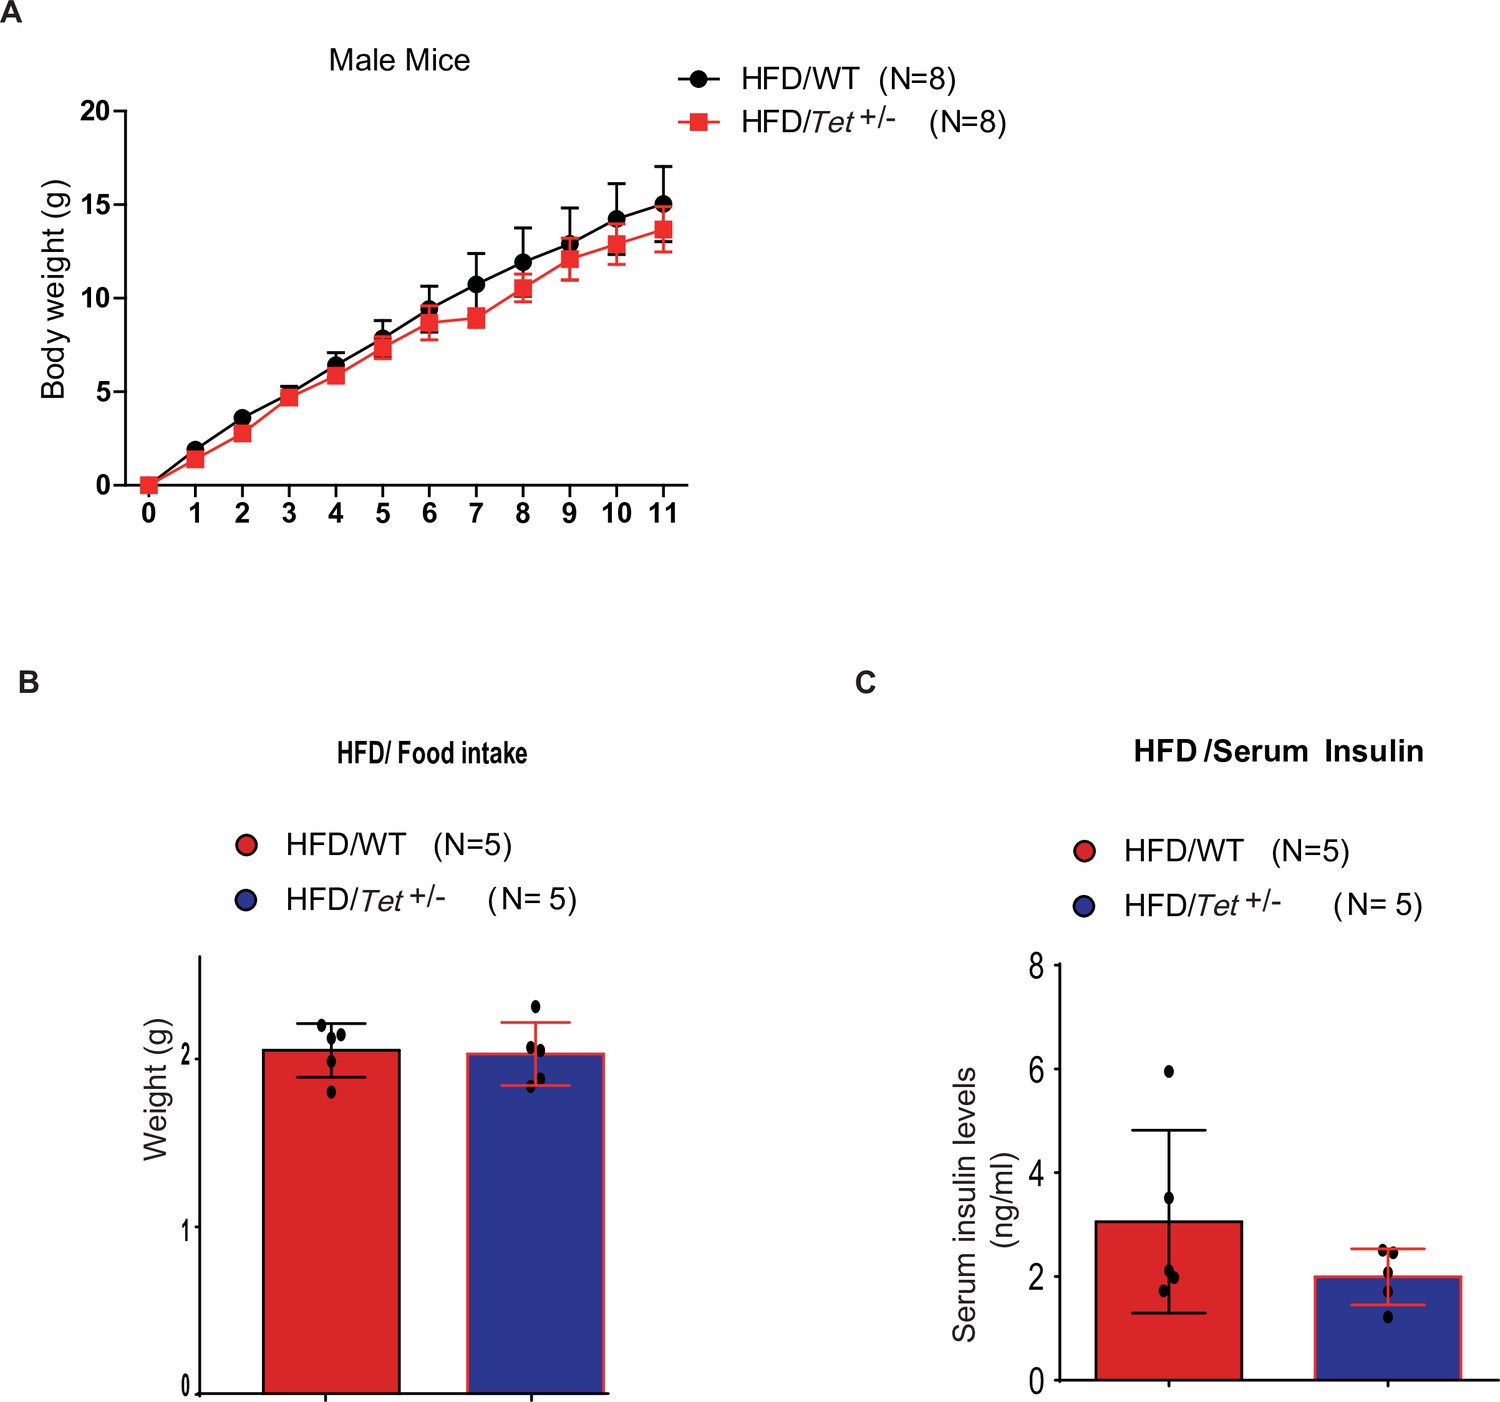
The body weight of high-fat diet (HFD)-fed Tet1+/- mice has no alternation compared with HFD-fed wild-type (WT) mice.
(A) There is no change in body weight of HFD-fed Tet1+/- male mice and HFD-fed WT male mice. (B) There is no change in the food intake between HFD-fed Tet1+/- male mice and HFD-fed WT male mice. (C) There is no change in serum insulin between HFD-fed Tet1+/- male mice and HFD-fed WT male mice.
Figure 1—figure supplement 3
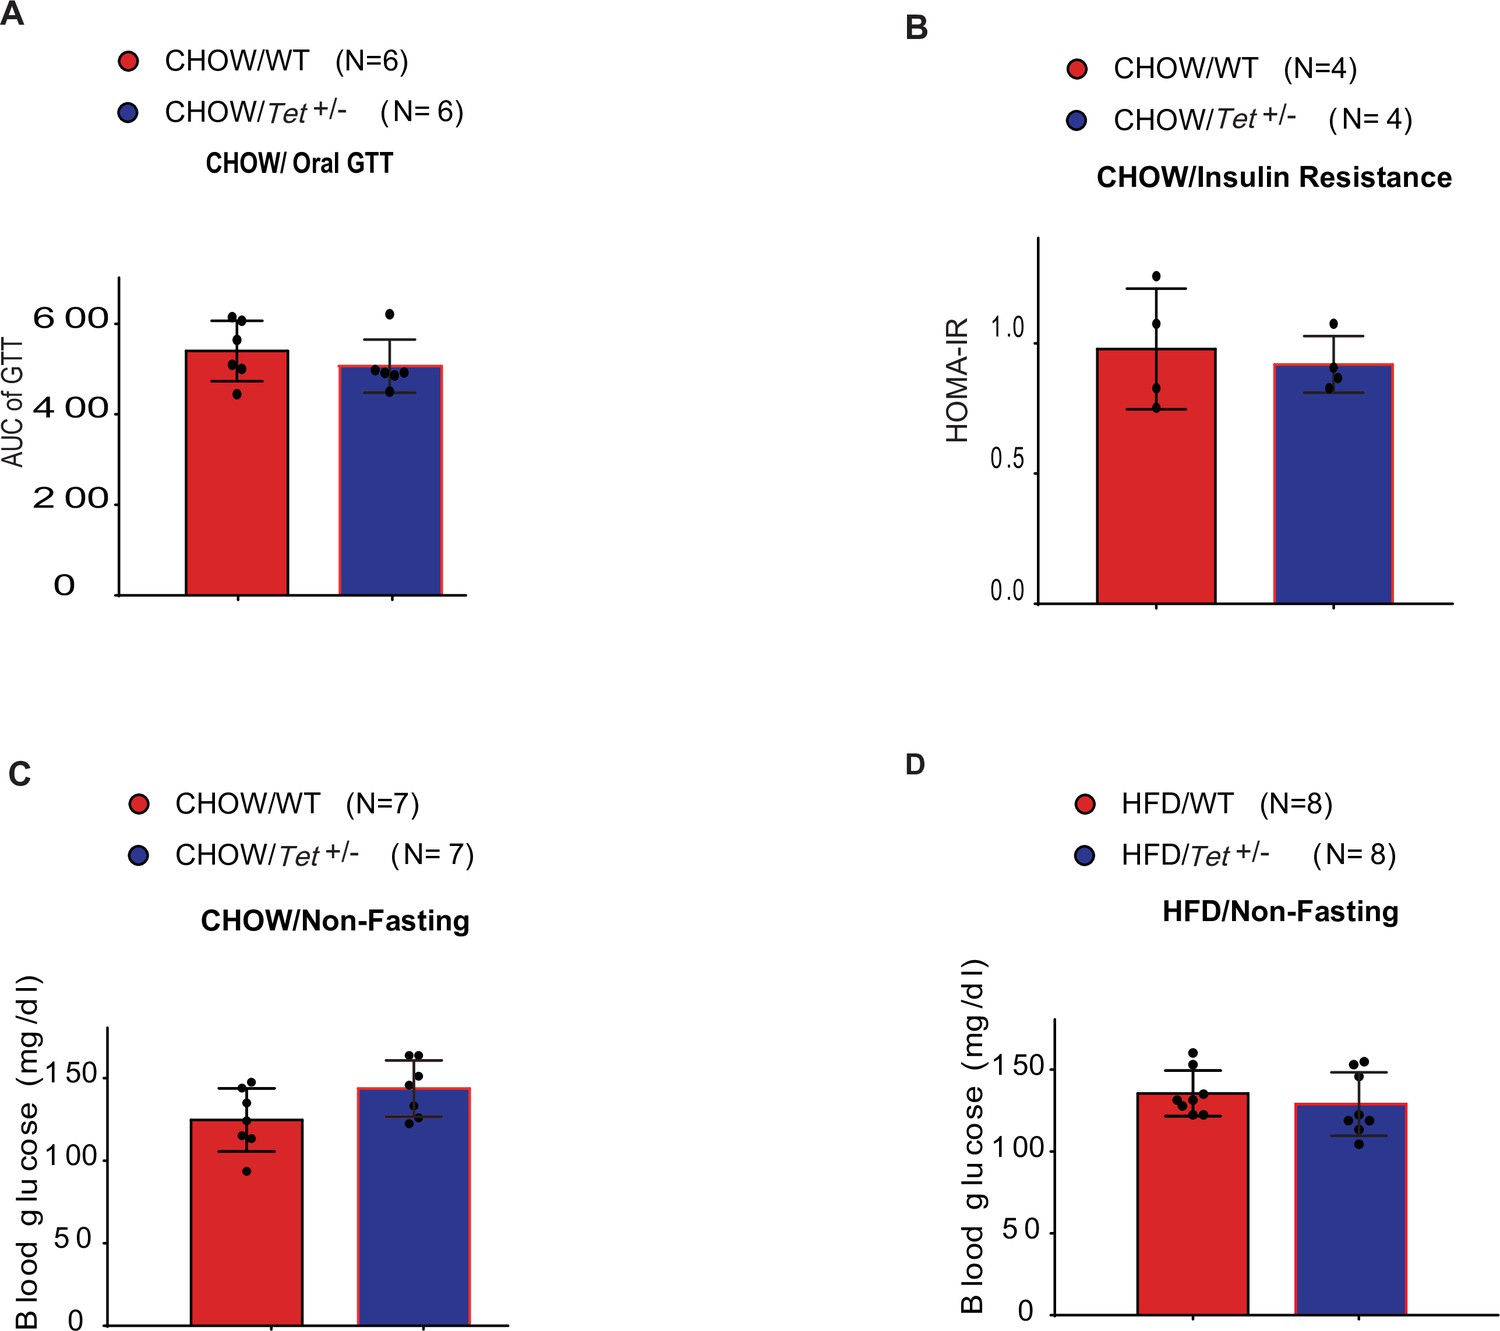
The detection of oral glucose tolerance, insulin resistance, and blood glucose in mice.
(A) Areas under the curve (AUC) for oral glucose tolerance test assays in Chow-fed Tet1+/- male mice and wild-type (WT) male mice. (B) Homeostatic Model Assessment for Insulin Resistance (HOMA-IR) assay in Chow-fed Tet1+/- male mice and WT male mice. (C) The blood glucose levels in Tet1+/- male mice and WT male mice with non-fasting. (D) The blood glucose levels in HFD-fed Tet1+/- male mice and WT male mice with non-fasting.
Figure 2 with 1 supplement
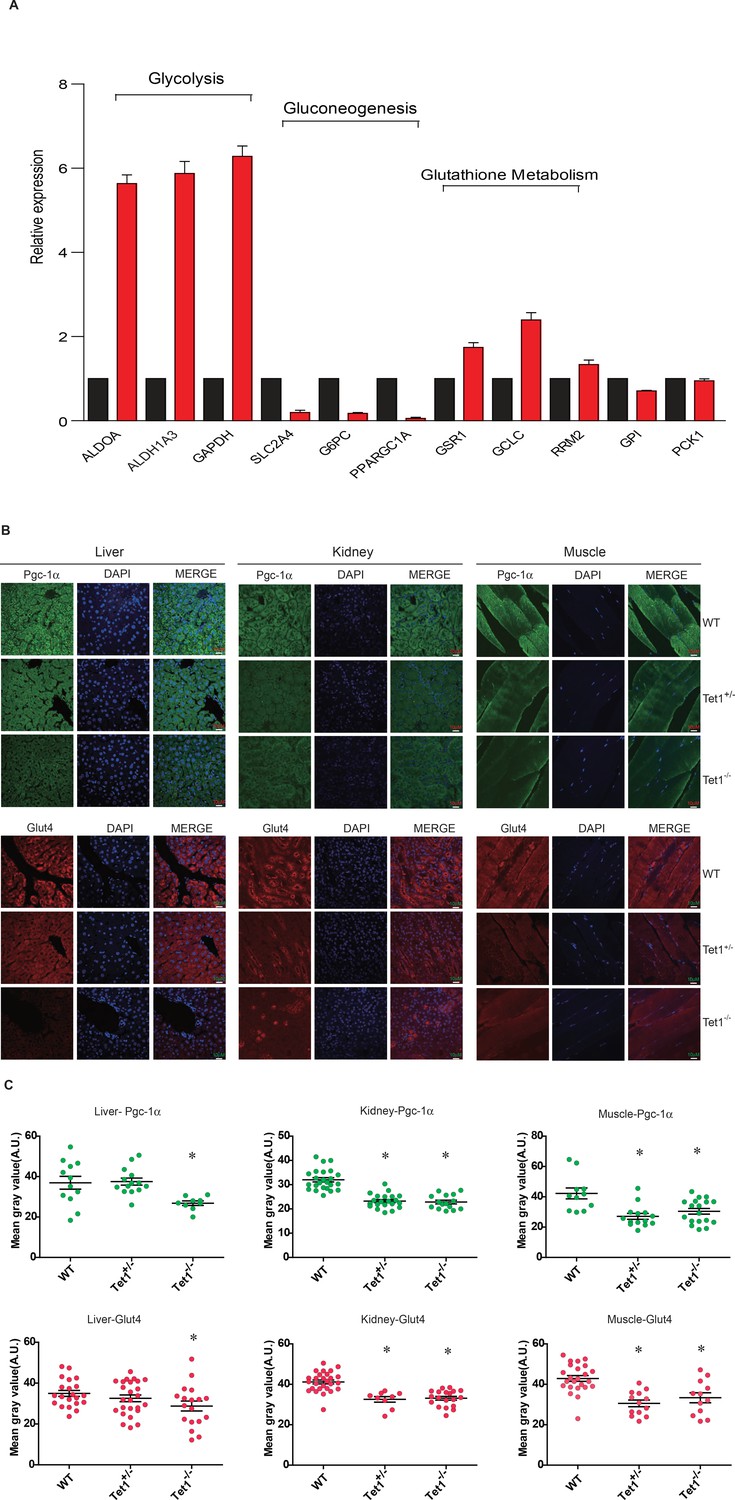
Ten-eleven trans-location methylcytosine dioxygenase 1 (Tet1) regulates gluconeogenesis-related transcription expression.
(A) Transcriptional expression of selected genes in glycolysis, gluconeogenesis, and glutathione metabolism signaling pathways in TET knockdown cells using siRNA. (B and C) Representative immunostaining and quantification of signal intensity of liver, kidney, and skeletal muscle from wild-type (WT) and transgenic mice using Pgc-1α and Glut4 antibodies. The quantification of the immunofluorescent images was employed via ImageJ software (*p < 0.05).
Figure 2—figure supplement 1
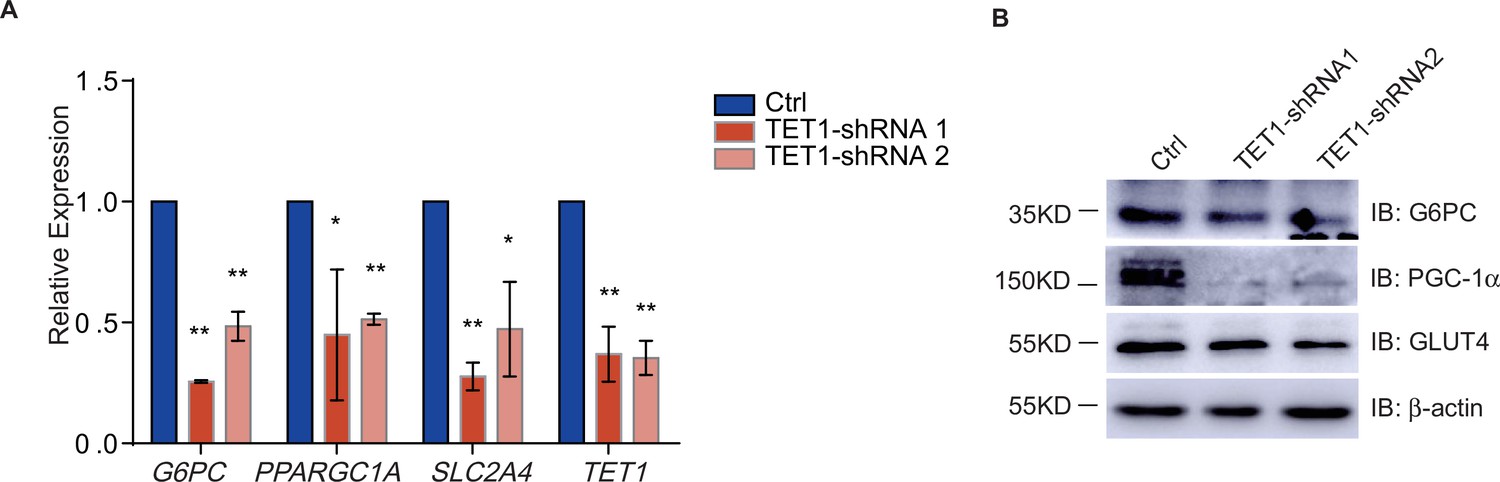
The transcriptional regulation of PPARGC1A, G6PC, and SLC2A4 decreased in ten-eleven translocation methylcytosine dioxygenase 1 (TET1) shRNA knockdown LO2 cells.
(A) Respectively knockdown TET1 expression using TET1 shRNA1 and shRNA2 in LO2 cells. And the transcriptional expression of PPARGC1A, G6PC, SLC2A4, and TET1 genes were down-regulated in TET knockdown cells qRT-PCR analysis (**p < 0.01, *p < 0.05). (B) Western blot analysis of the protein expression of PPARGC1A, G6PC, and SLC2A4 in TET knockdown cells were reduced.
-
Figure 2—figure supplement 1—source data 1
Supplementary Original Data for Figure 2—figure supplement 1B.
- https://cdn.elifesciences.org/articles/70672/elife-70672-fig2-figsupp1-data1-v3.pdf
Figure 3 with 1 supplement
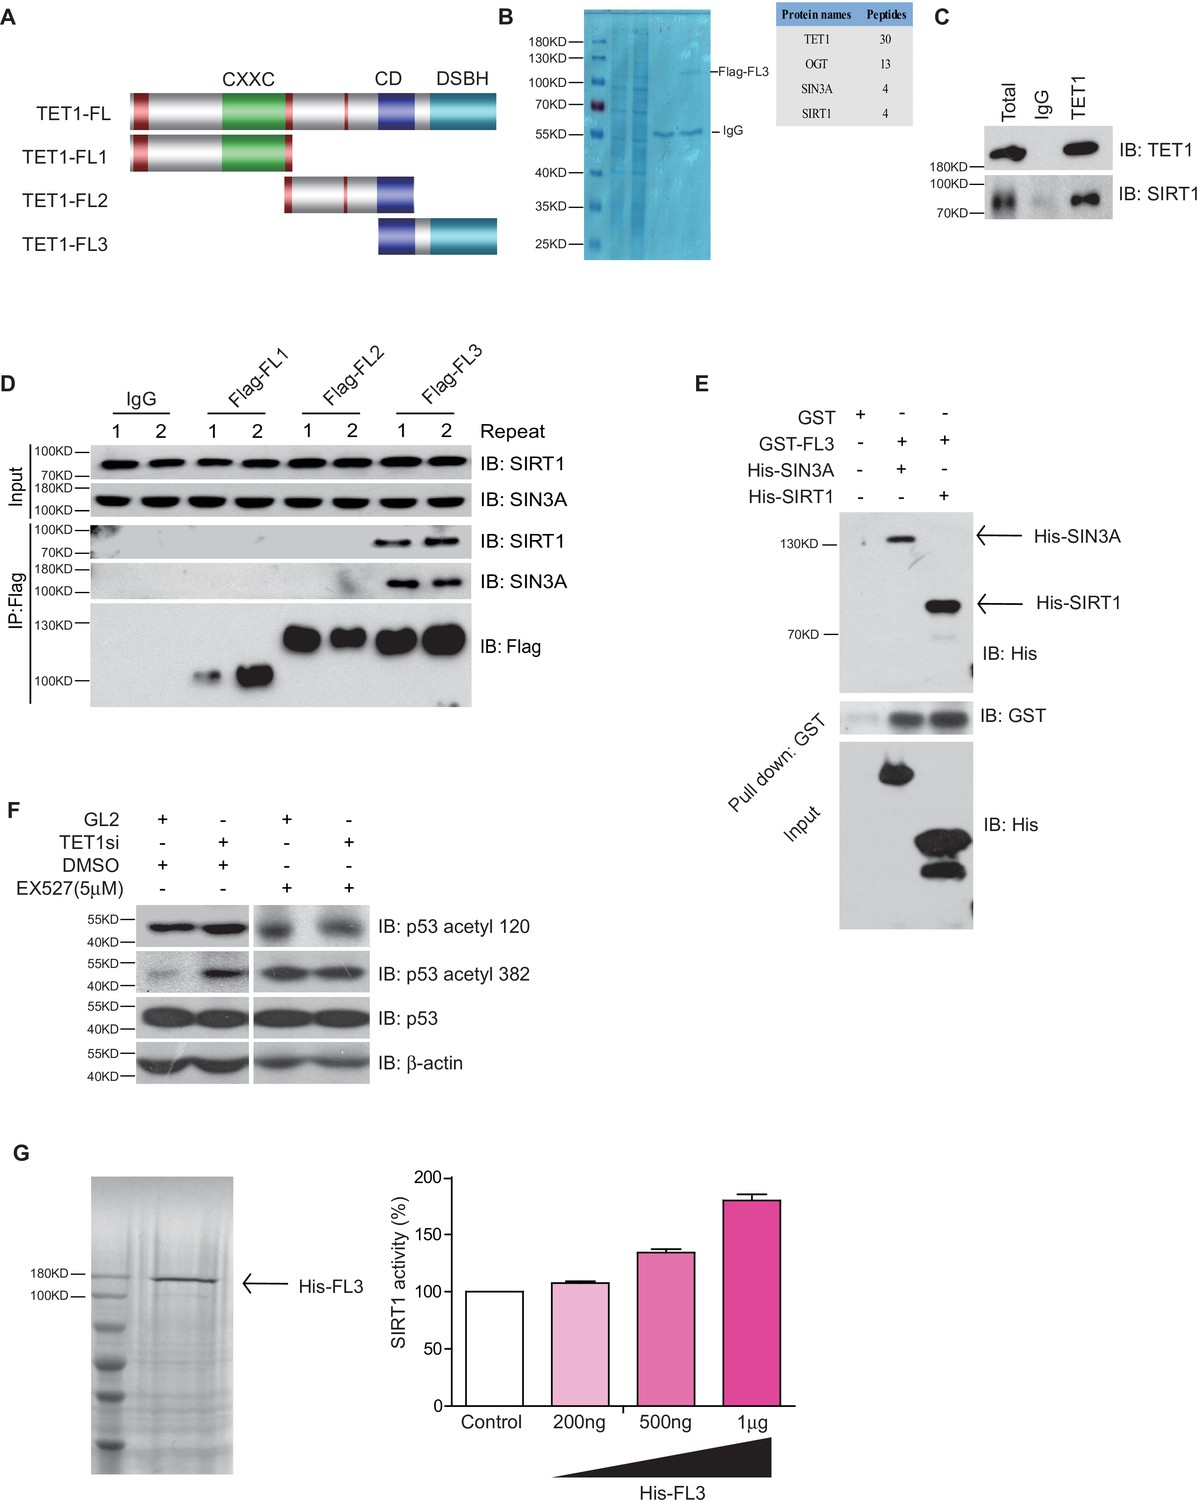
Ten-eleven translocation methylcytosine dioxygenase 1 (TET1) interacts with silent information regulator T1 (SIRT1) via its C-terminal to regulate deacetylase activity.
(A) Schematic representation of TET1 fragments (FL) including Flag-FL1, Flag-FL2, and Flag-FL3 (CXXC: binding CpG islands; CD: cysteine-rich domain; DSBH: double-stranded β-helix). (B) Mass spectrum assays were performed for the immunoprecipitation (IP) samples extracted from HepG2 cells using TET1 or SIRT1 antibodies. The overlapped area shown in Venn map represents the interaction proteins immunoprecipitated by TET1 or SIRT1. (C) TET1 shown interacting with SIRT1 by immunoprecipitation TET1 antibody. (D) TET1-FL3 shown interacting with SIRT1 and SIN3A using protein IP in TET1 fragments overexpressing cells. SIN3A is a co-factor of SIRT1 treated as a positive control. Each sample was performed in duplicate. (E) GST and GST-FL3 were expressed in BL21 cells and purified following pGEX-GST-vector’s manual. His-SIRT1 and His-SIN3A were also expressed in BL21 and purified. Pull-down assays were performed using a GST-tag antibody. (F) Western blot analysis of the extracts in TET1 knockdown HepG2 cells and EX527-treated HepG2 cells using specific antibodies as indicated. (G) The deacetylase activity of SIRT1 was determined by incubating with 200 ng, 500 ng, and 1 μg His-FL3 for 1 hr. His-FL3 was expressed in BL21 cells and purified following pTrc-His-vector’s manual.
Figure 3—figure supplement 1
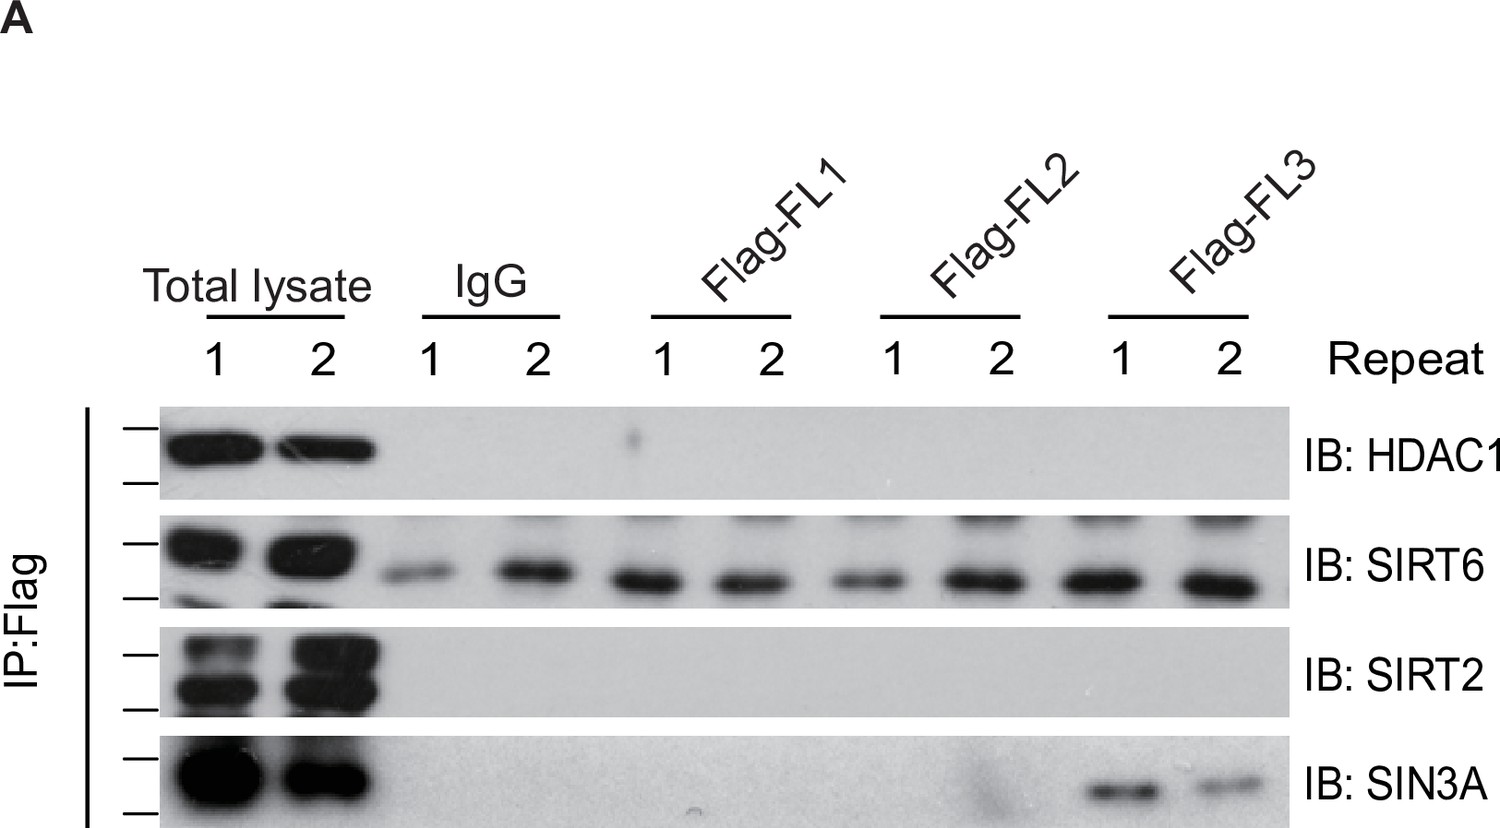
Ten-eleven translocation methylcytosine dioxygenase 1 (TET1) cannot interact with HDAC1, silent information regulator T2 (SIRT2), and SIRT6.
(A) TET1 fragments were shown no interaction with HDAC1, SIRT2, and SIRT6 using protein immunoprecipitations (IPs) in TET1 fragments overexpressing cells, respectively. Each sample repeats twice.
Figure 4
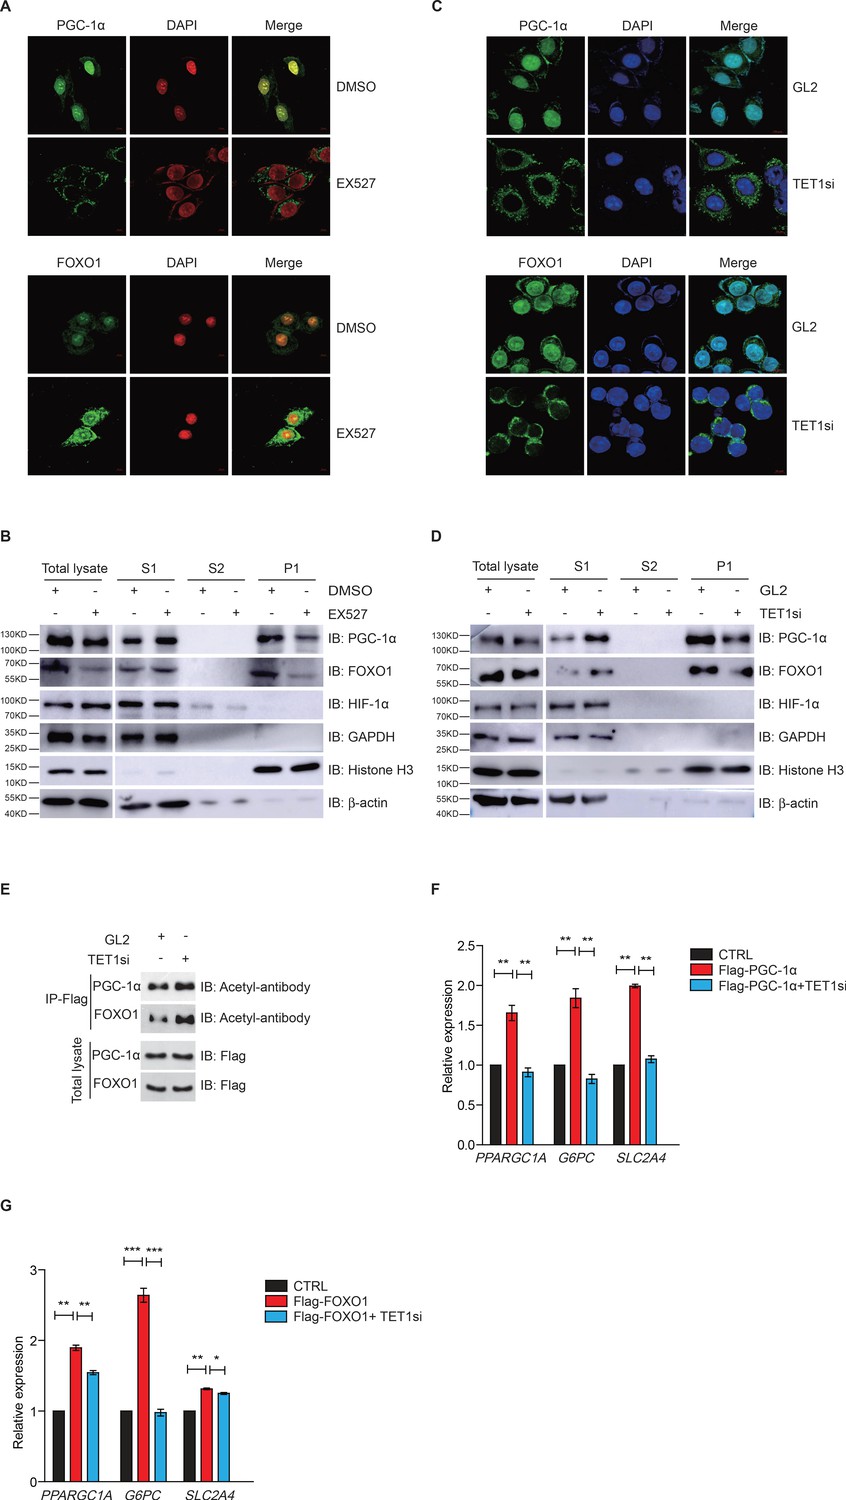
Ten-eleven translocation methylcytosine dioxygenase 1 (TET1)-dependent silent information regulator T1 (SIRT1) activity regulates PGC-1α and FOXO1 translocalization.
(A) Immunofluorescence staining of the translocalization of PGC-1α or FOXO1 in EX527-treated HepG2 cells. Nuclei were stained with DAPI. (B) Western blot analysis of the fractions in EX527-treated HepG2 cells using antibodies. S1, S2, and P1 mean the proteins in the cytoplasm, nucleus soluble proteins, and chromatin binding proteins, respectively. (C) Immunofluorescence staining of the translocalization of PGC-1α or FOXO1 in TET1-depleted or negative control (GL2) HepG2 cells. Nuclei were stained with DAPI. (D) Western blot analysis of the fractions in TET1 knockdown HepG2 cells using antibodies. (E) Western blot analysis of protein immunoprecipitations in Flag- PGC-1α or Flag-FOXO1 overexpressing cells using acetyl antibodies. (F) qRT-qPCR analysis of PPARGC1A, G6PC, and SLC2A4 mRNA levels in PGC-1α overexpressed HepG2 cells, with or without TET1 knockdown (**p < 0.01). (G) qRT-qPCR analysis of PPARGC1A, G6PC, and SLC2A4 mRNA levels in FOXO1 overexpressed HepG2 cells, with or without TET1 knockdown (*p < 0.05, **p < 0.01, ***p < 0.001).
Figure 5 with 3 supplements
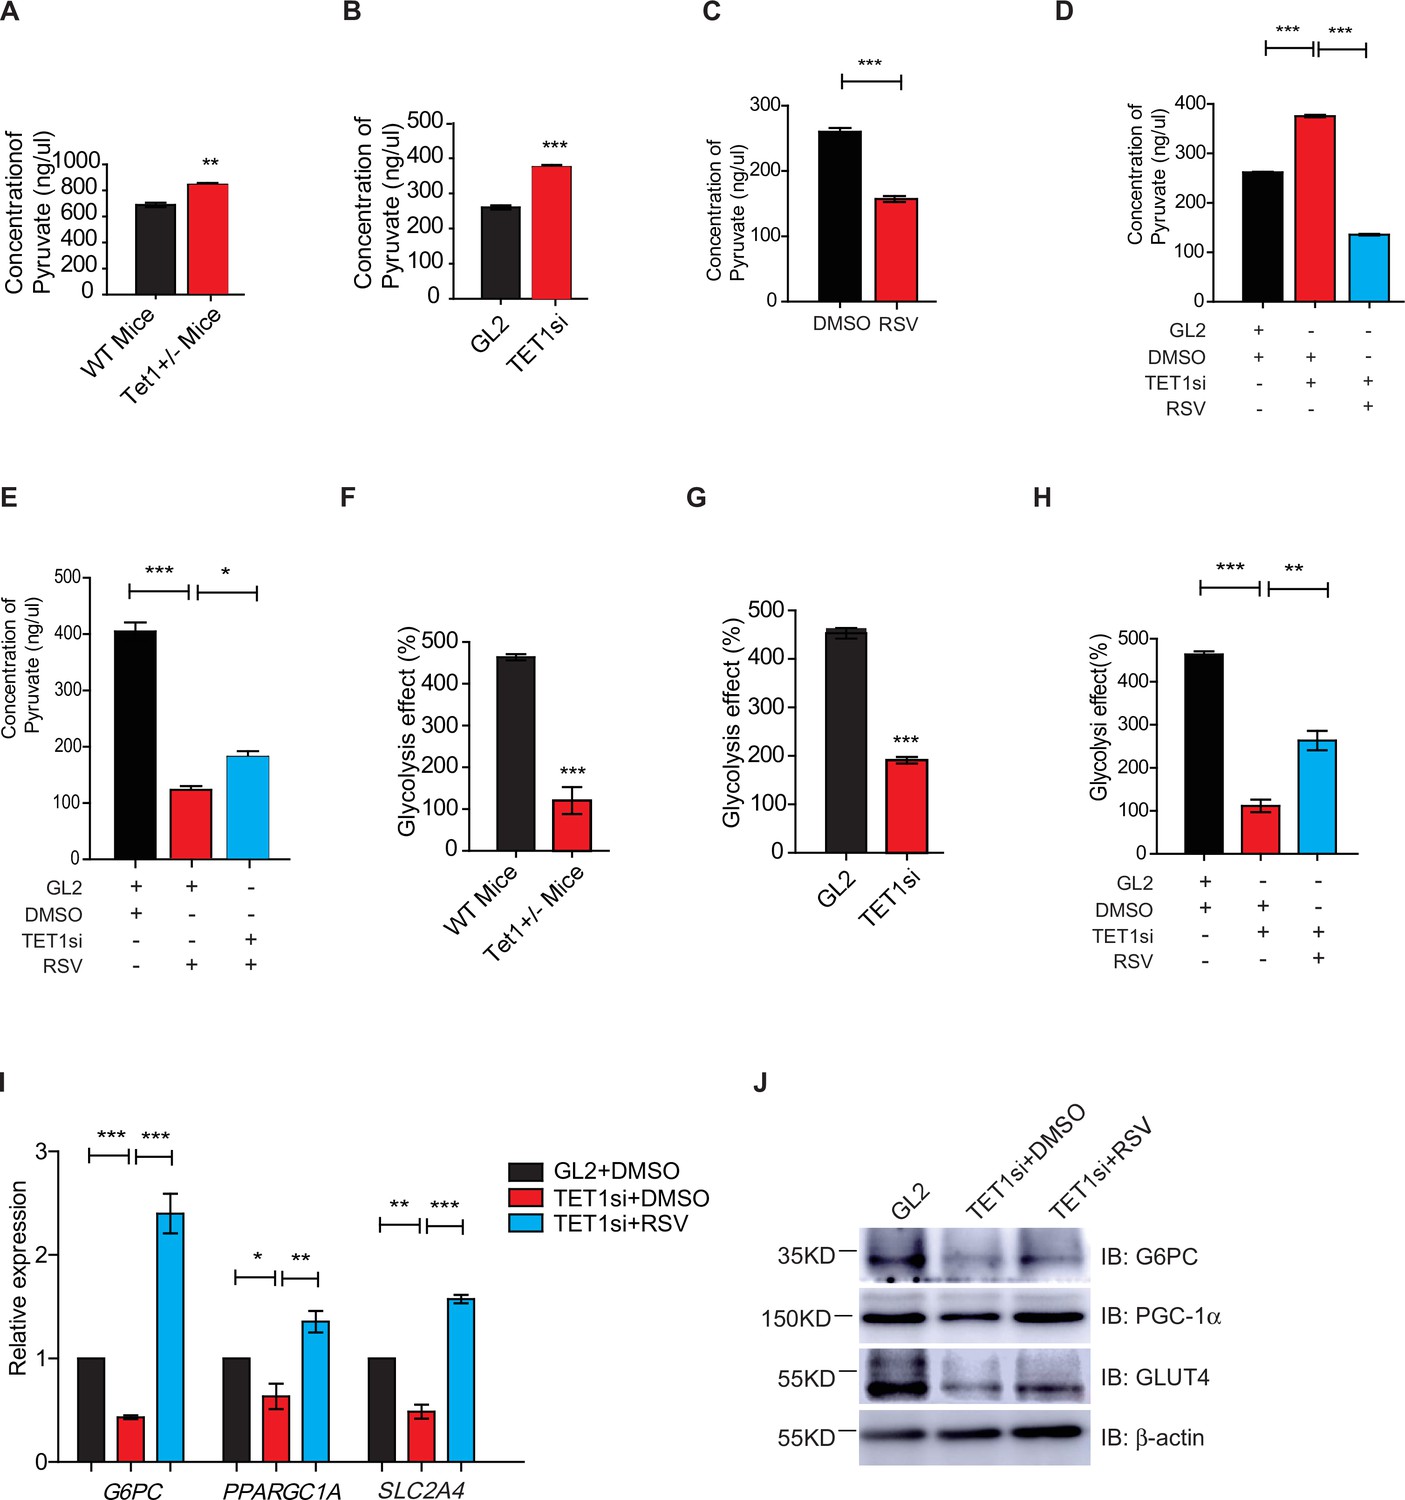
Silent information regulator T1 (SIRT1) activator resveratrol (RSV) rescues the ten-eleven translocation methylcytosine dioxygenase 1 (Tet1)-depleted cellular defect.
(A) Comparison of the pyruvate level in liver cells between Tet1+/- mice with wild-type (WT) mice (**p < 0.01). (B) Comparison of the pyruvate level in HepG2 cells between TET1-depleted cells and the control (***p < 0.001). (C) Comparison of the pyruvate level in RSV-treated and DMSO-treated HepG2 cells (***p < 0.001). (D) Comparison of the pyruvate level among control HepG2 cells, TET1-depleted HepG2 cells, and TET1-depleted HepG2 cells after RSV treatment (***p < 0.001). (E) Comparison of the pyruvate level among control HepG2 cells, RSV-treated HepG2 cells, and TET1-depleted HepG2 cells after RSV treatment (*p < 0.05, ***p < 0.001). (F and G) Comparison of glycolysis effect in Tet1+/- mice liver tissue and the control, or in TET1-depleted HepG2 cells and the control (***p < 0.001). (H) Comparison of glycolysis effect among control HepG2 cells, RSV-treated HepG2 cells, and TET1-depleted HepG2 cells after RSV treatment (**p < 0.01, ***p < 0.001). (I) Comparison of the transcriptional expression among control HepG2 cells, TET1-depleted HepG2 cells, and TET1-depleted HepG2 cells after RSV treatment (*p < 0.05, **p < 0.01, ***p < 0.001). (J) Western blot analysis of the protein expression of PPARGC1A, G6PC, and SLC2A4 among control HepG2 cells, TET1-depleted HepG2 cells, and TET1-depleted HepG2 cells after RSV treatment.
-
Figure 5—source data 1
Supplementary Original Data - Figure 5J.
- https://cdn.elifesciences.org/articles/70672/elife-70672-fig5-data1-v3.pdf
Figure 5—figure supplement 1
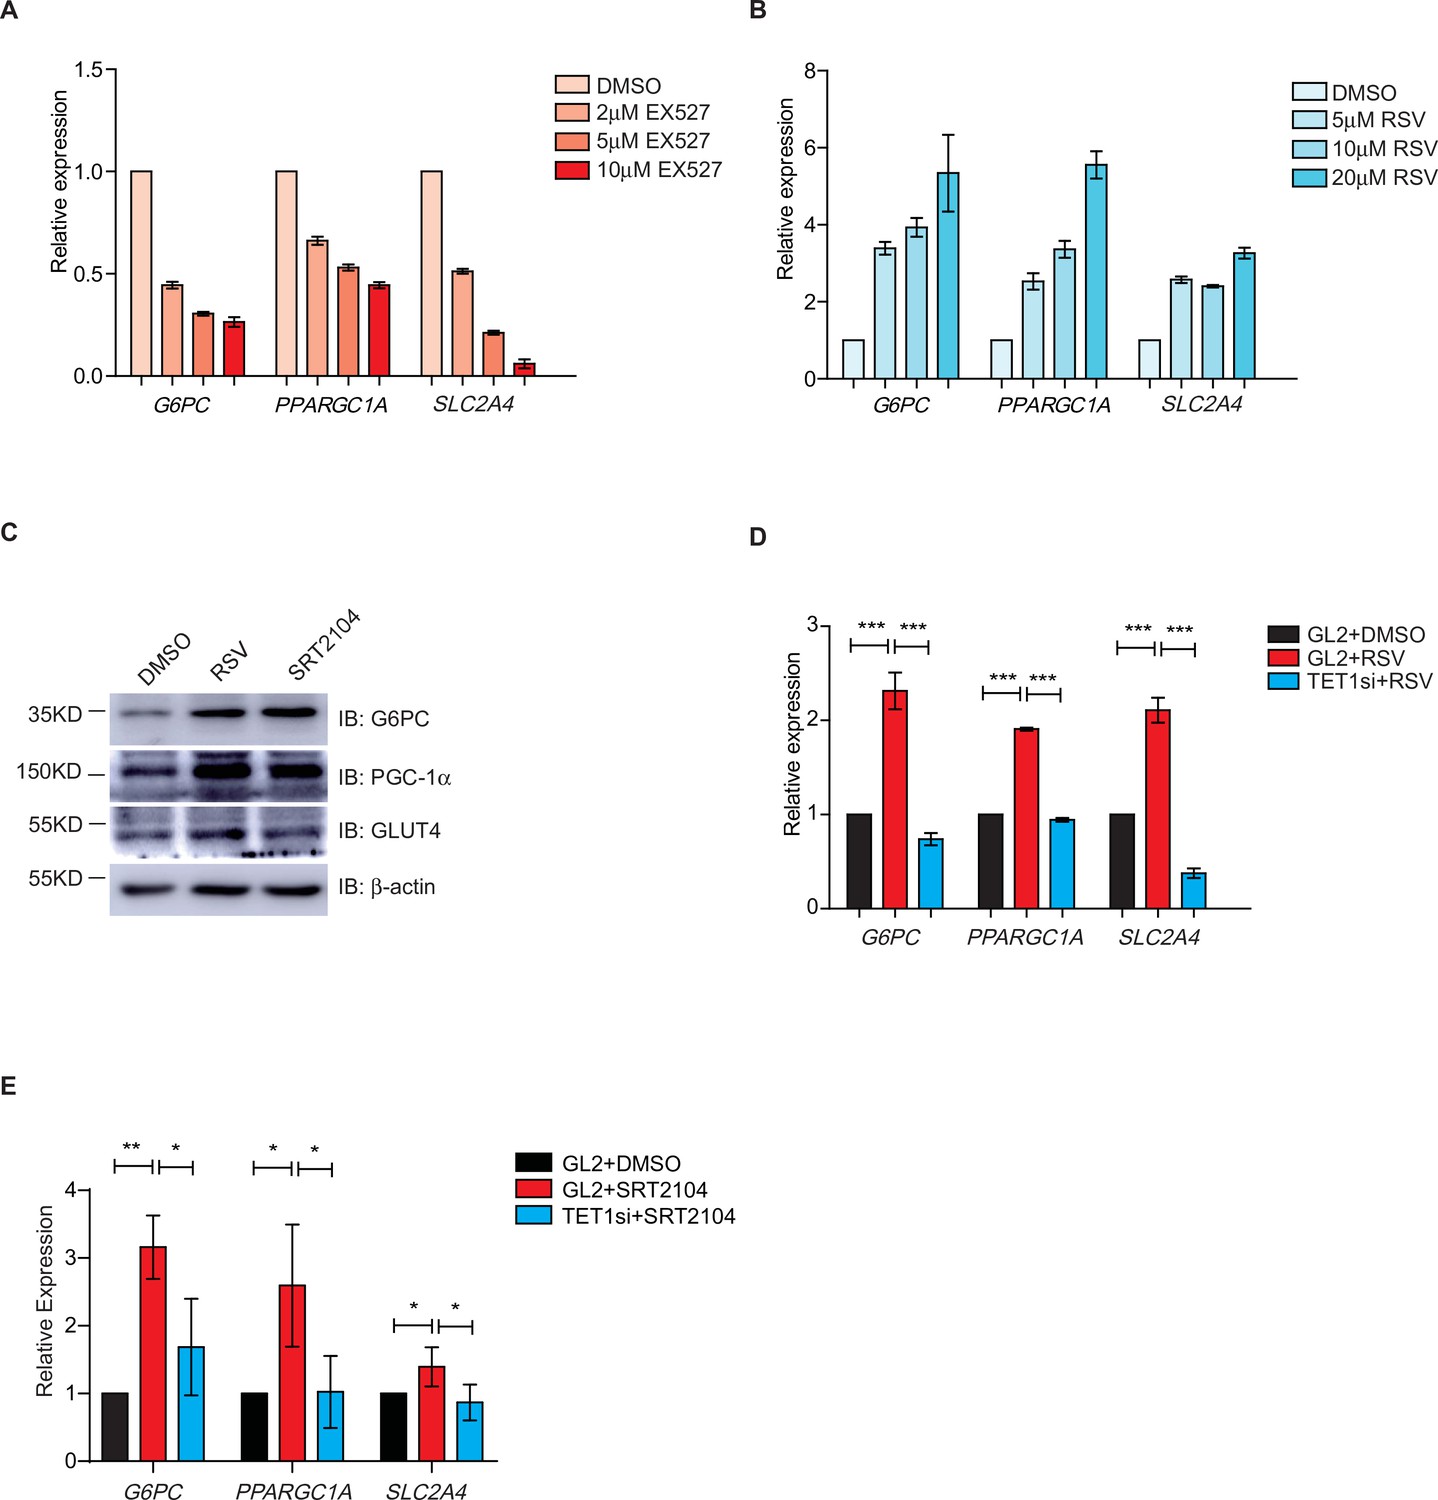
The transcriptional expression of G6PC, PPARGC1A, and SLC2A4 are regulated via silent information regulator T1 (SIRT1) deacetylase activity.
(A) qRT-PCR analysis of the transcriptional expression of G6PC, PPARGC1A, and SLC2A4 were down-regulated dosage dependent on EX527. (B) qRT-PCR analysis of the transcriptional expression of G6PC, PPARGC1A, and SLC2A4 were up-regulated dosage dependent on resveratrol (RSV). (C) Western blot analysis of the protein expression of PPARGC1A, G6PC, and SLC2A4 in RSV-treated and SRT2104-treated cells, respectively. (D) Comparison of the transcriptional expression among control HepG2 cells, RSV-treated HepG2 cells, and TET1-depleted HepG2 cells after RSV treatment (***p < 0.001). (E) Comparison of the transcriptional expression among control HepG2 cells, SRT2104-treated HepG2 cells, and TET1-depleted HepG2 cells after SRT2104 treatment (**p < 0.01, *p < 0.05).
-
Figure 5—figure supplement 1—source data 1
Supplementary Original Data Figure 5—figure supplement 1C.
- https://cdn.elifesciences.org/articles/70672/elife-70672-fig5-figsupp1-data1-v3.pdf
Figure 5—figure supplement 2
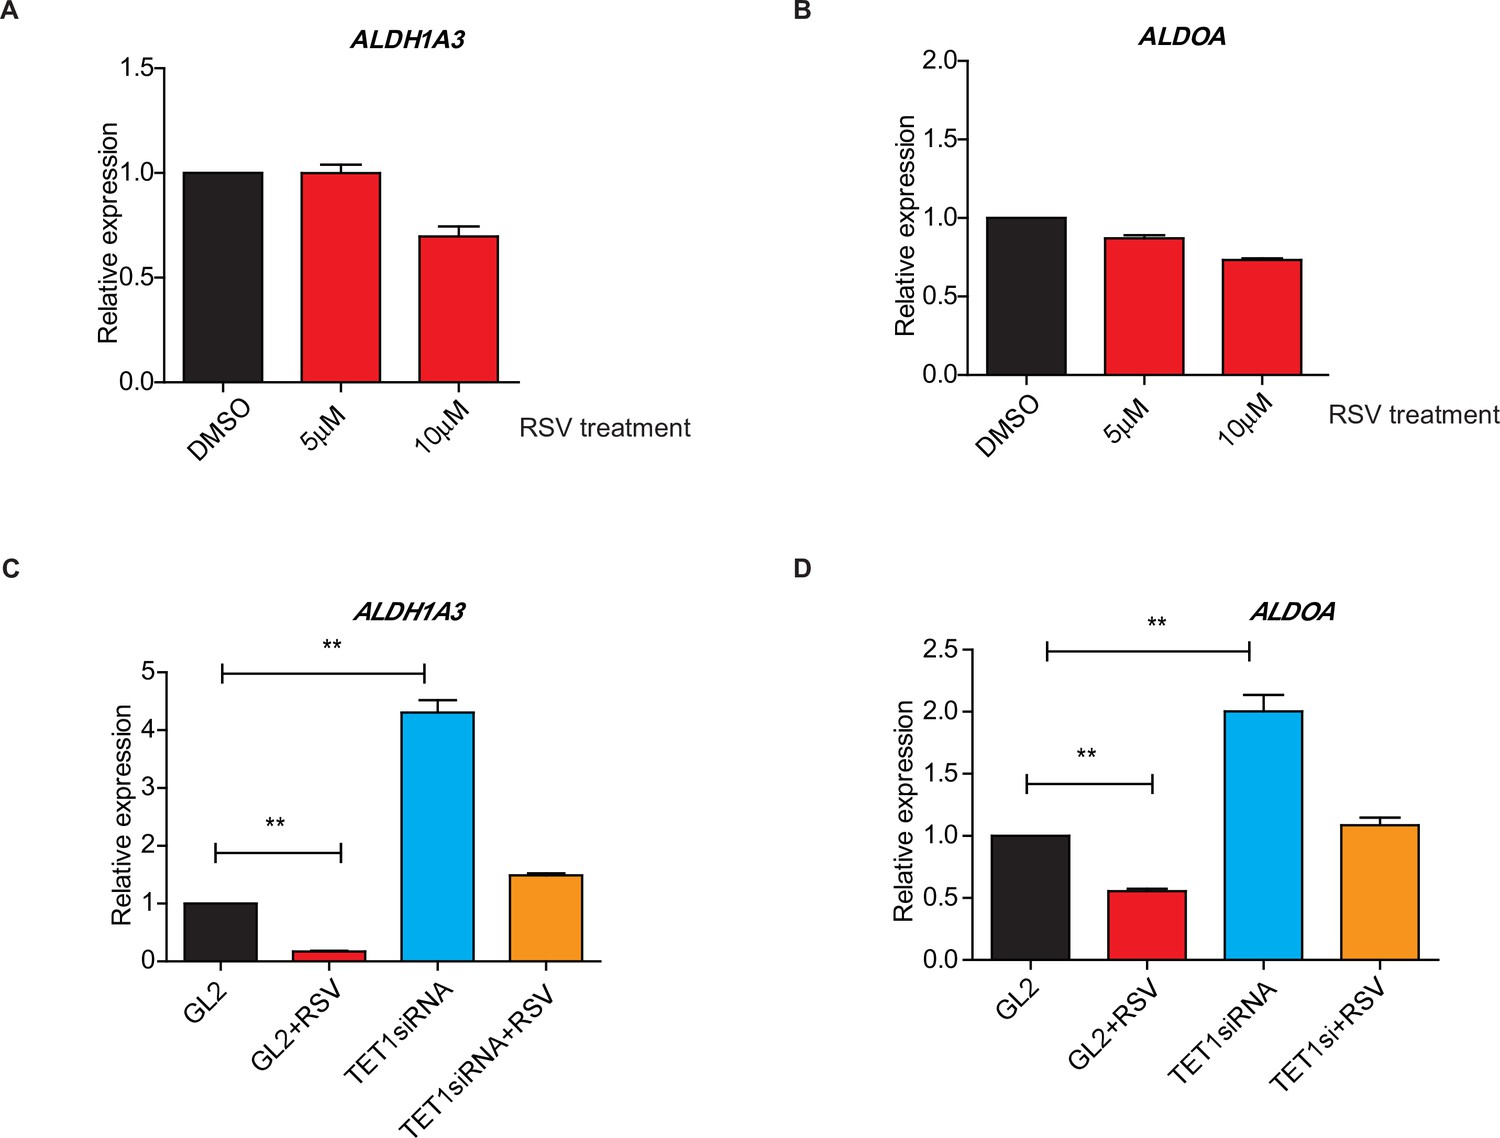
Ten-eleven translocation methylcytosine dioxygenase 1 (TET1) regulates gluconeogenic gene expression via silent information regulator T1 (SIRT1) activity.
(A and B) qRT-PCR analysis of the transcriptional expression of the selected important genes in gluconeogenesis, including ALDH1A3 and ALDOA, with a dosage treatment of resveratrol (RSV) in HepG2 cells for 8 hr as indicated. (C and D) Comparison of the transcriptional expression among control HepG2 cells, RSV-treated HepG2 cells, TET1-depleted HepG2 cells, and TET1-depleted HepG2 cells after RSV treatment, as indicated.
Figure 5—figure supplement 3
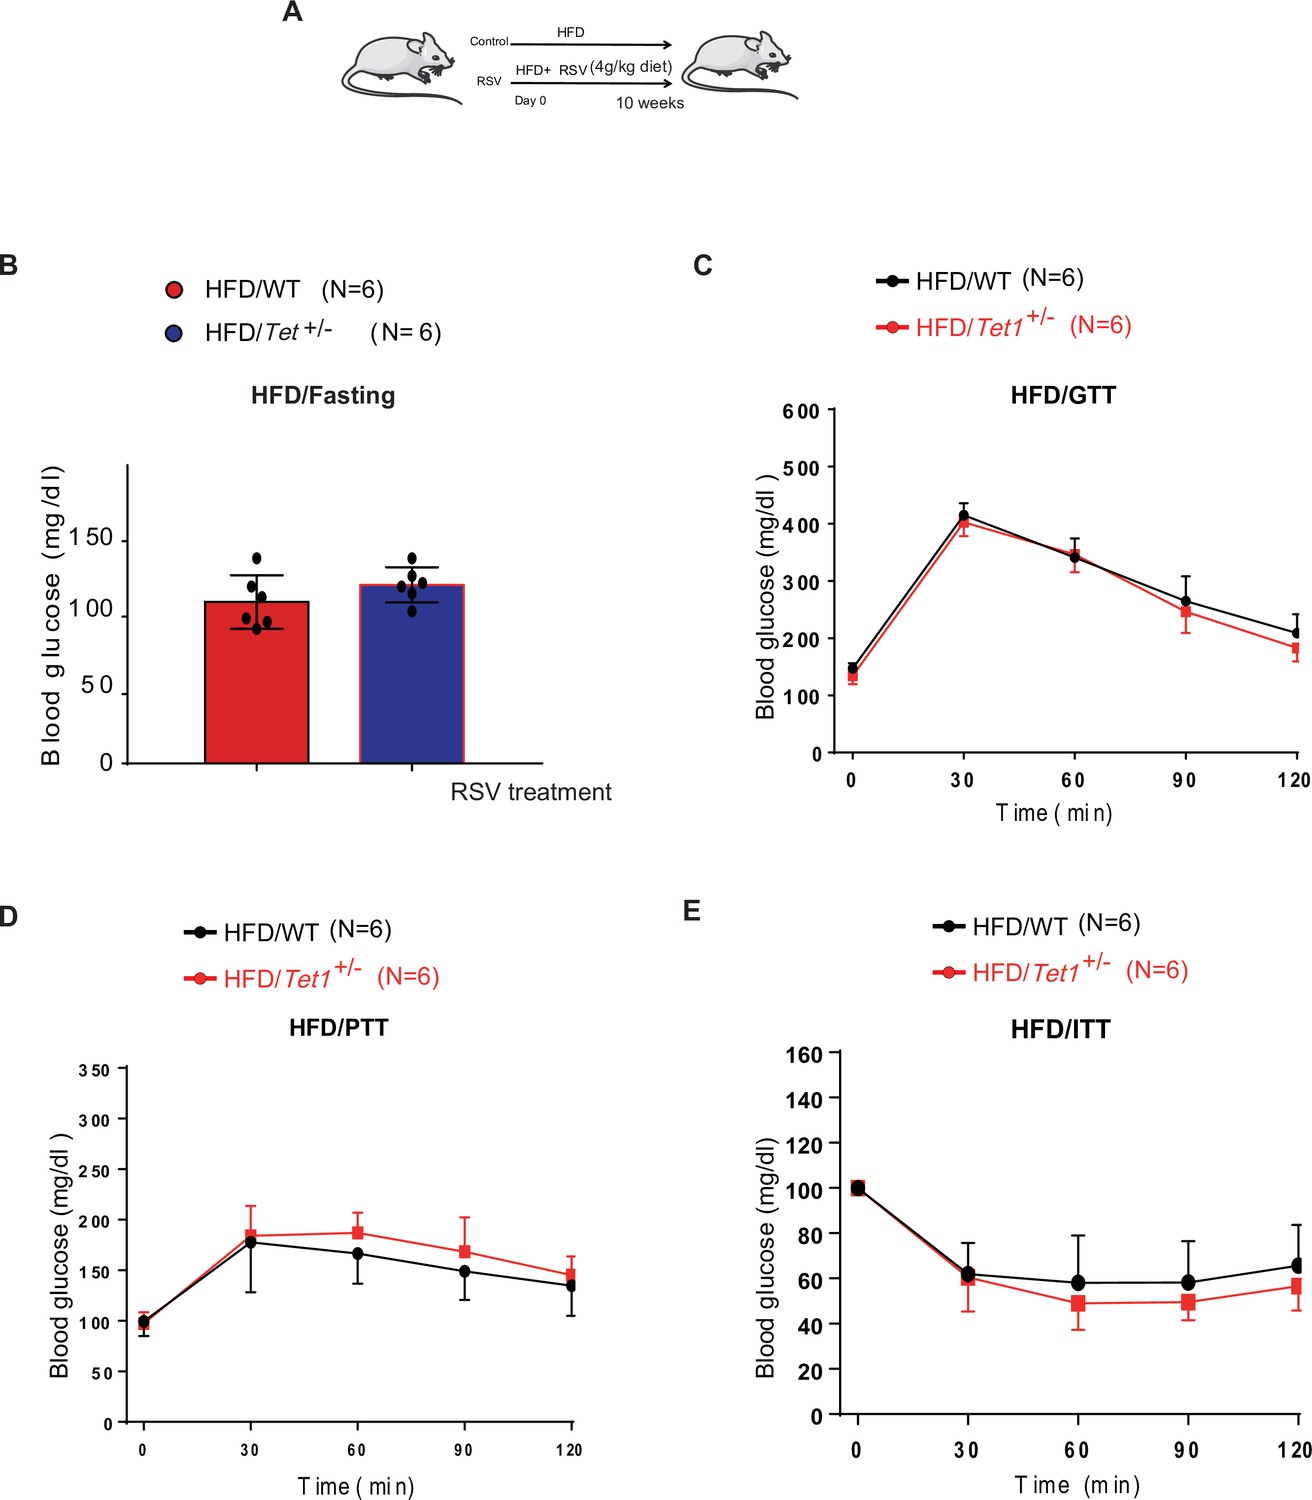
Resveratrol (RSV) could rescue the decrease of glucose level, the defects in glucose and insulin tolerance, and gluconeogenesis of Tet1+/- mice.
(A) The schedule of RSV treatment in high-fat diet (HFD)-fed Tet1+/- male mice and HFD-fed wild-type (WT) male mice. (B) The blood glucose levels in Tet1+/- male mice and WT male mice with fasting after RSV treatment. (C) Glucose tolerance test (GTT) assays in HFD-fed Tet1+/- male mice and WT male mice after RSV treatment. (D) Pyruvate tolerance test (PTT) assays in HFD-fed Tet1+/- male mice and WT male mice after RSV treatment.(E) Insulin tolerance test (ITT) assays in HFD-fed Tet1+/- male mice and WT male mice after RSV treatment.
Figure 6 with 1 supplement
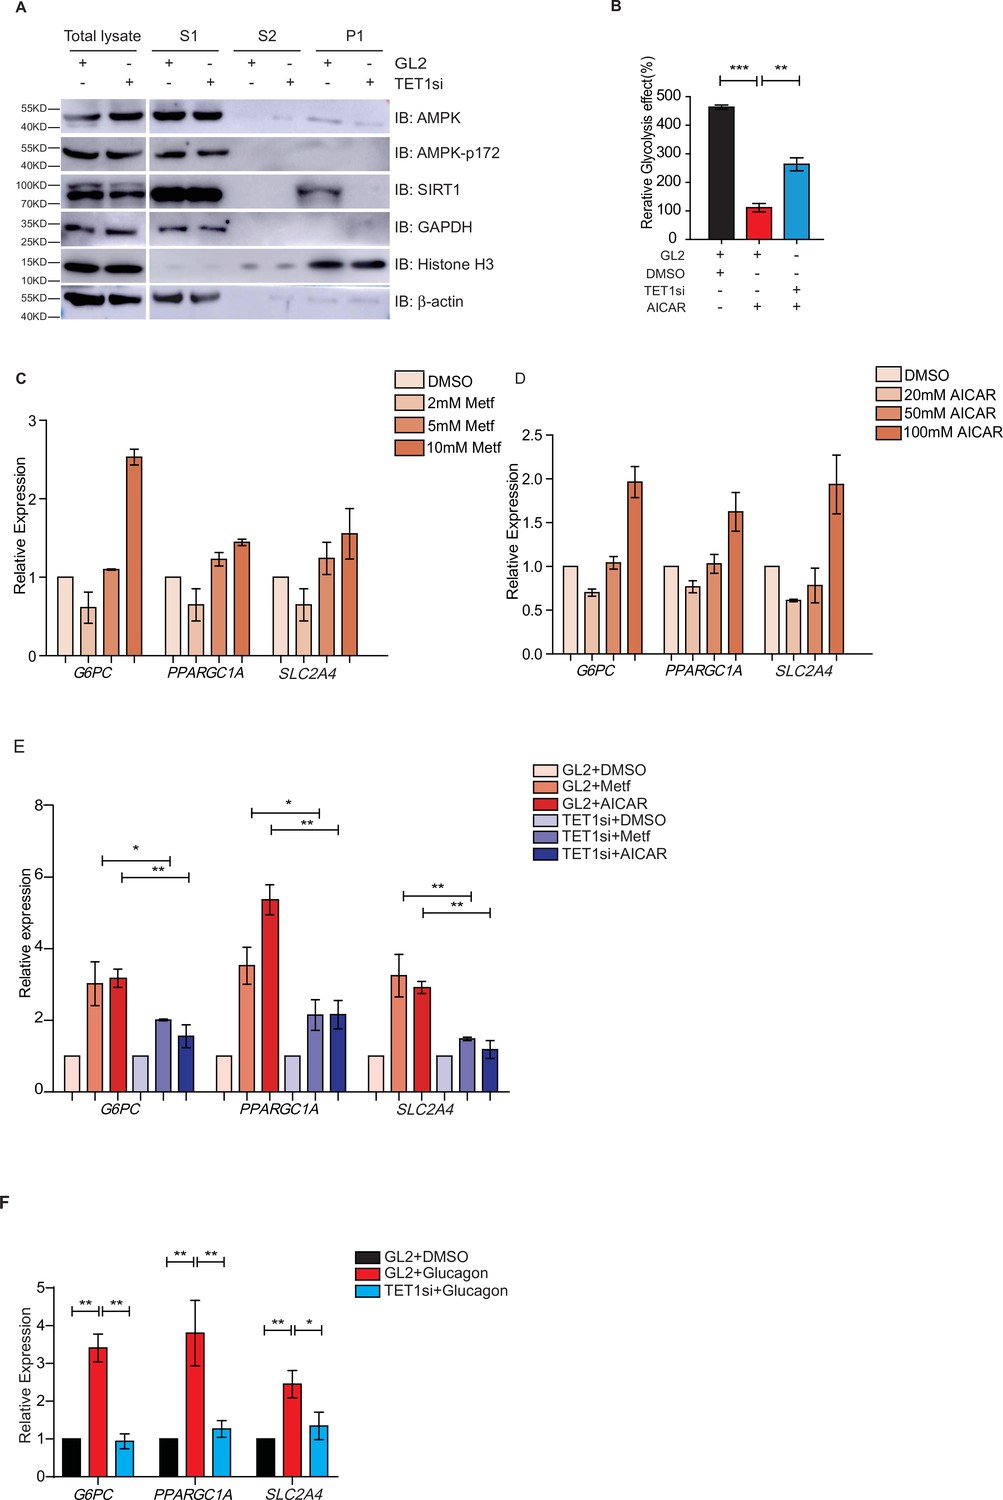
Ten-eleven translocation methylcytosine dioxygenase 1 (TET1) depletion blocks gluconeogenic gene expression activation induced by adenosine 5’-monophosphate-activated protein kinase (AMPK).
(A) Western blot analysis of the fractions in TET1 knockdown HepG2 cells using indicated antibodies. (B) Comparison of the effect on glycolysis among control HepG2 cells, 5-aminoimidazole-4-carboxamide ribonucleoside (AICAR)-treated HepG2 cells, and TET1-depleted HepG2 cells after AICAR treatment (*p < 0.05, ***p < 0.001). (C) qRT-PCR analysis of the transcriptional expression of the selected genes in gluconeogenesis, including PPARGC1A, G6PC, and SLC2A4, with a dosage treatment of metformin in HepG2 cells for 8 hr (*p < 0.05, **p < 0.01, ***p < 0.001). (D) qRT-PCR analysis of the transcriptional expression of the selected genes in gluconeogenesis, including PPARGC1A, G6PC, and SLC2A4, with a dosage treatment of AICAR in HepG2 cells for 8 hr (*p < 0.05, **p < 0.01). (E) Comparison of the transcriptional expression among control HepG2 cells, metformin or AICAR-treated HepG2 cells, and TET1-depleted HepG2 cells after metformin or AICAR treatment, (*p < 0.05, **p < 0.01). (F) Comparison of the transcriptional expression among control HepG2 cells, glucagon (0.1 nM)-treated HepG2 cells, and TET1-depleted HepG2 cells after glucagon treatment. (*p < 0.05, **p < 0.01).
Figure 6—figure supplement 1
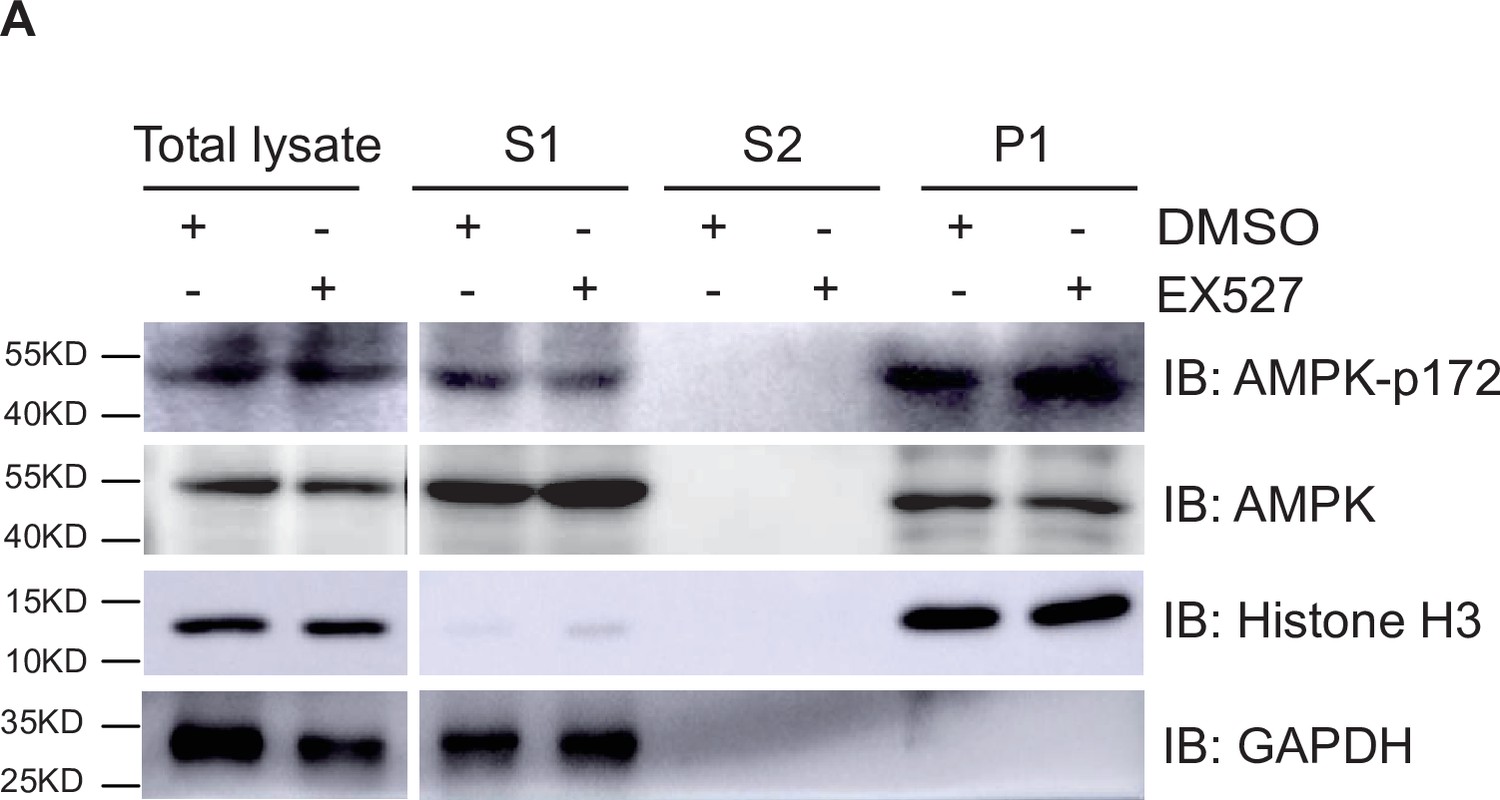
Silent information regulator T1 (SIRT1) cannot affect the localization and activation of adenosine 5’-monophosphate-activated protein kinase (AMPK).
(A) Western blot analysis of the fractions in EX527-treated HepG2 cells using antibodies as indicated. S1, S2, and P1 mean the proteins in the cytoplasm, nucleus soluble proteins, and chromatin binding proteins, respectively.
Figure 7 with 1 supplement
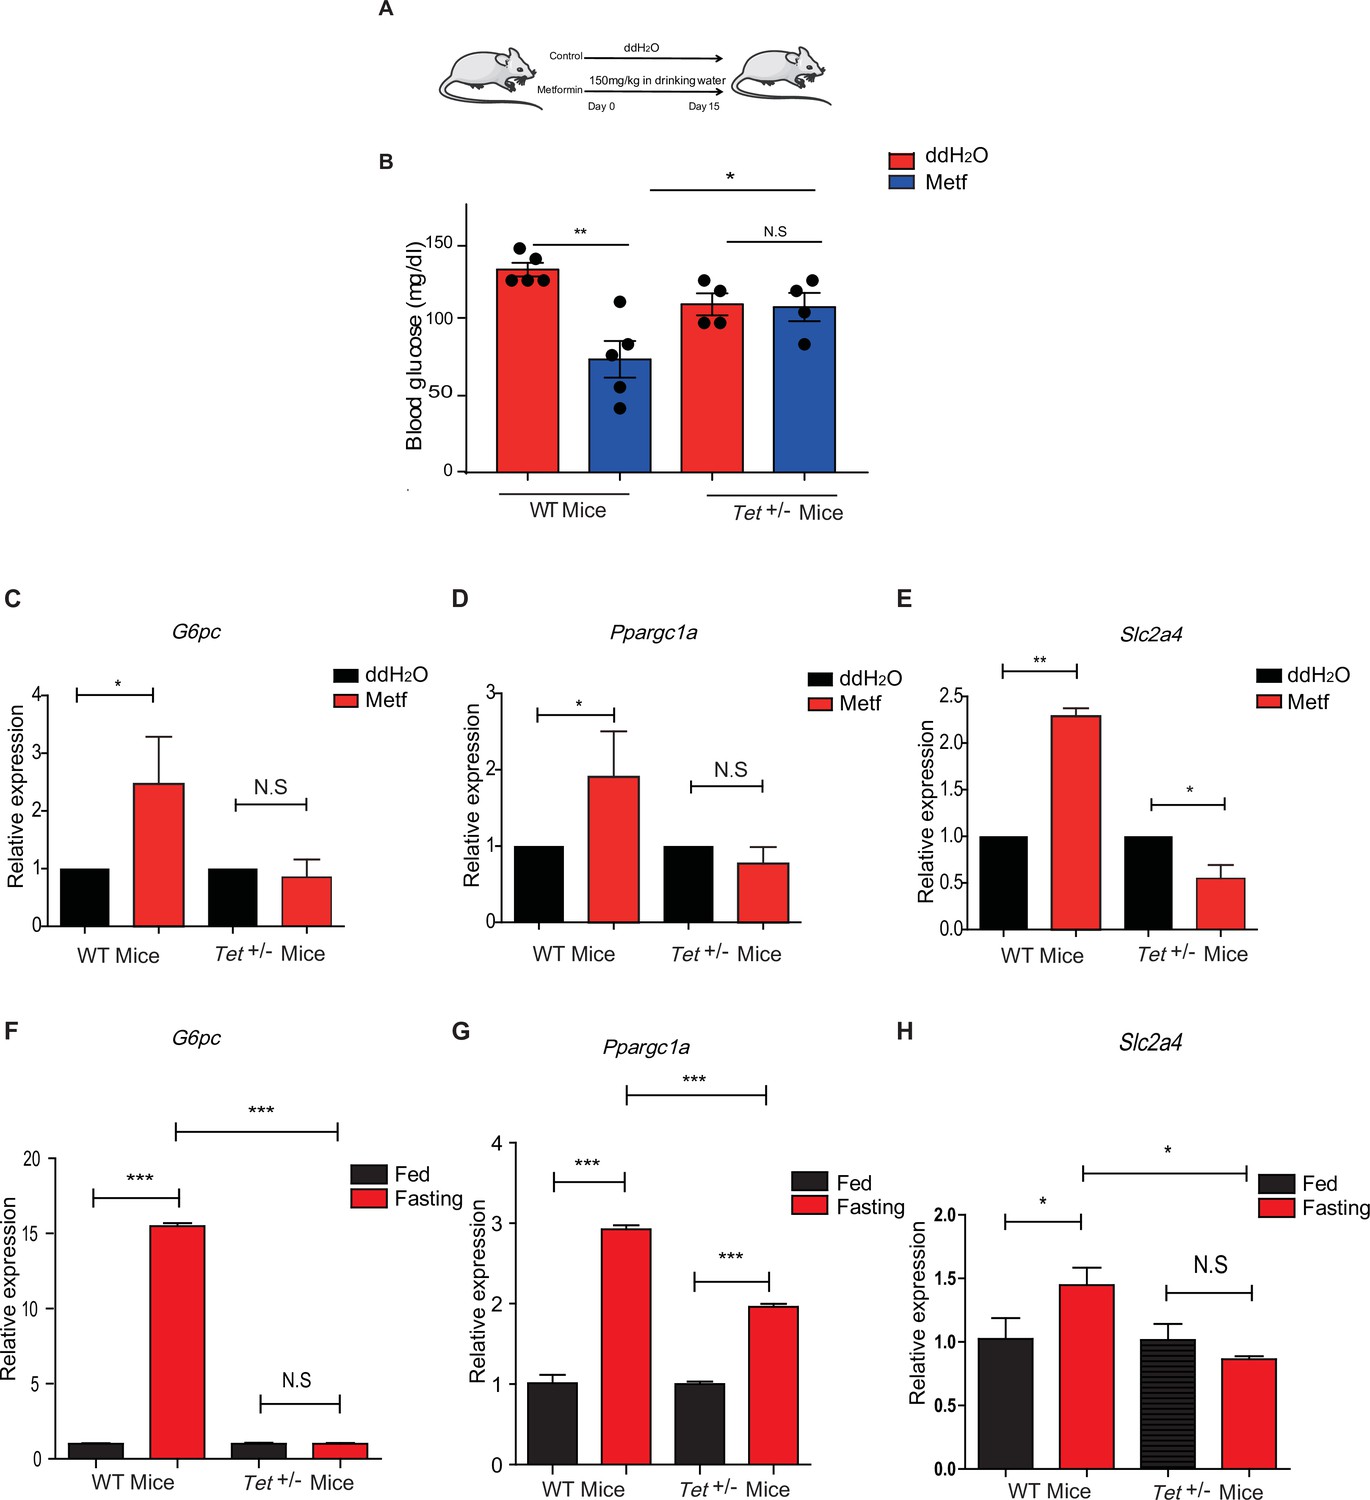
Metformin or fasting affects ten-eleven translocation methylcytosine dioxygenase 1 (Tet1) regulation of gluconeogenesis-related transcriptional expression.
(A) The schedule of metformin treatment in Tet1+/- male mice and wild-type (WT) male mice. (B) The glucose levels of Tet1+/- male mice and WT male mice before and after metformin treatment (*p < 0.05, **p < 0.01, N = 5). (C, D, and E) Comparison of the transcriptional expression of G6pc, Ppargc1a, and Slc2a4 genes between Tet1+/- mice with WT mice before and after metformin treatment (*p < 0.05, **p < 0.01). Normalization of Tet1+/- mice and WT mice as the control. (F, G, and H) Comparison of the transcriptional expression of G6pc, Ppargc1a, and Slc2a4 genes via qRT-PCR analysis between Tet1+/- mice with WT mice before and after the fasting for 24 hr (*p < 0.05, ***p < 0.001, NS means p > 0.05). Normalization of Tet1+/- mice and WT mice as the control.
Figure 7—figure supplement 1
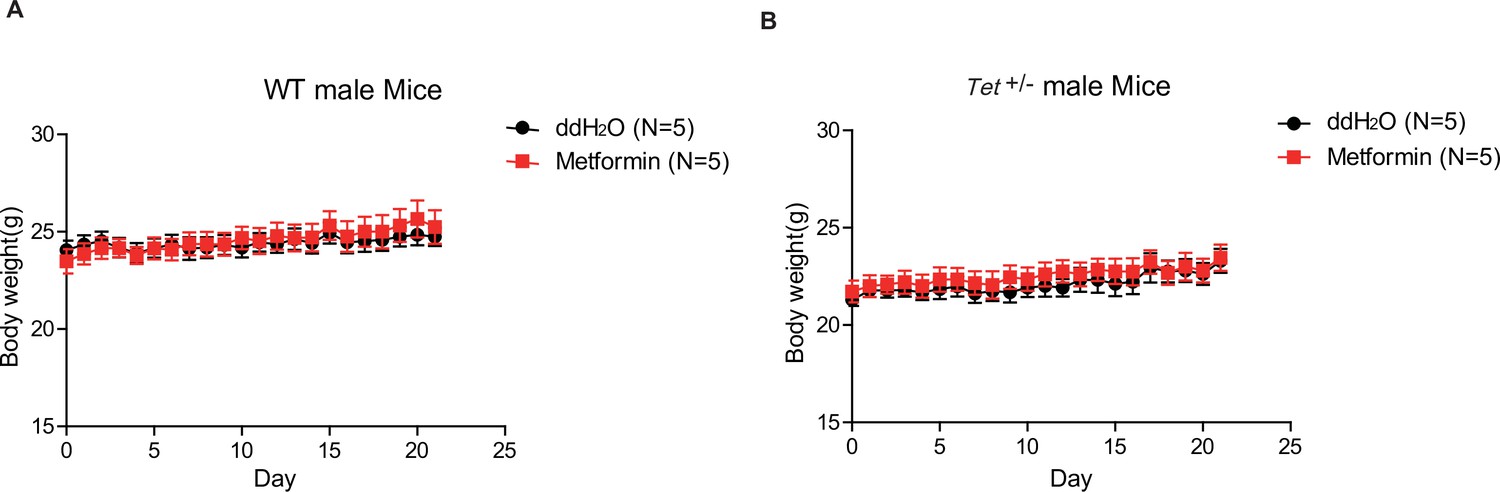
The body weight of Tet1+/- mice has no alternation compared with wild-type (WT) mice with or without metformin treatment.
(A) There is no change in body weight of metformin-treated WT male mice compared to the control. (B) There is no change in body weight of metformin-treated Tet1+/- male mice compared to the control.
Figure 8 with 1 supplement
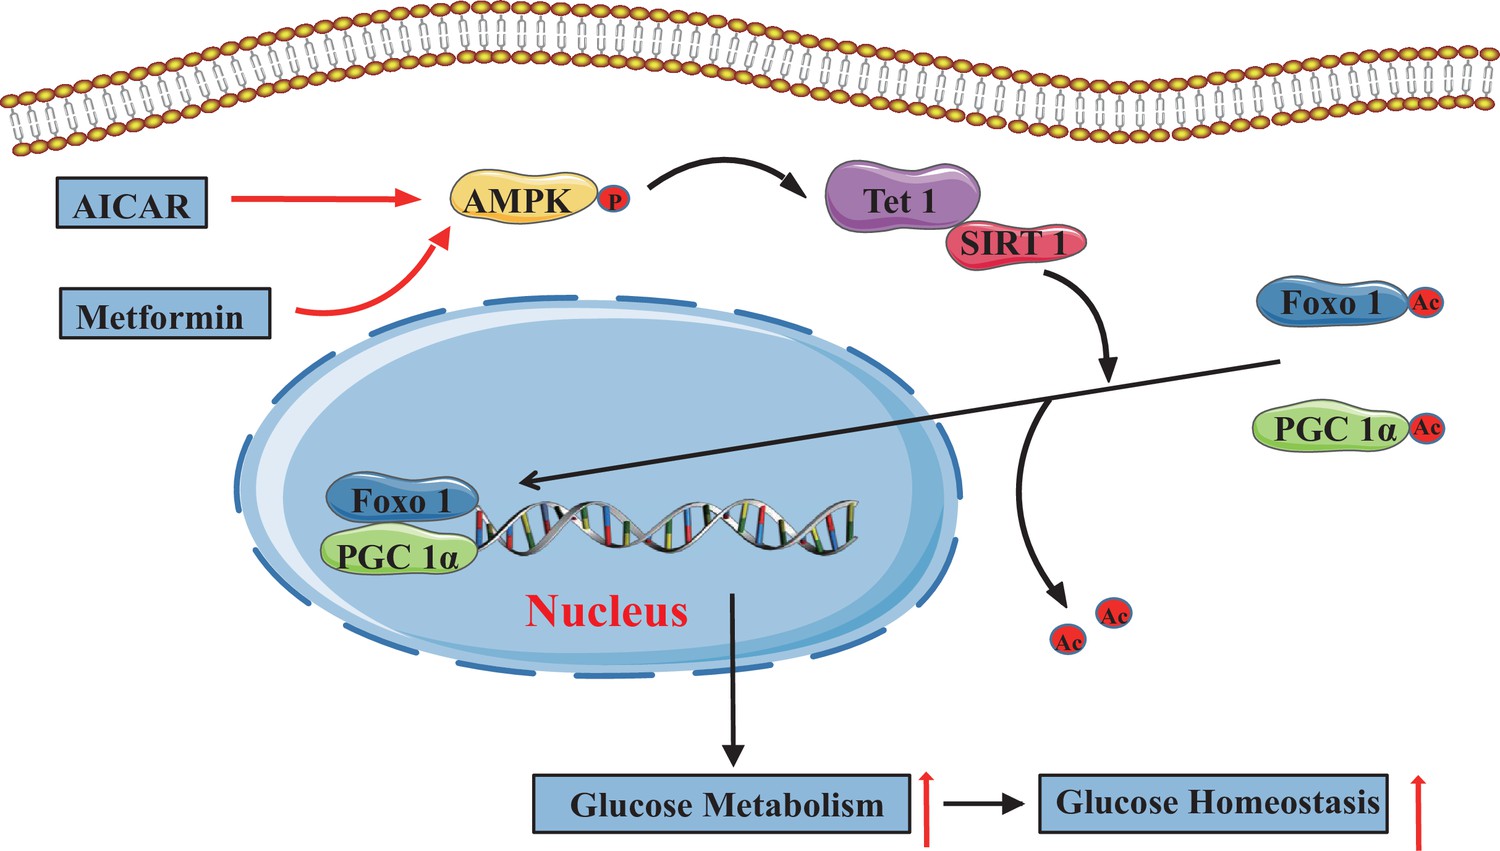
The adenosine 5’-monophosphate-activated protein kinase (AMPK)/ten-eleven translocation methylcytosine dioxygenase 1 (TET1)/silent information regulator T1 (SIRT1) axis in hepatic glucose metabolism.
Model showing the mechanism of the AMPK-TET1-SIRT1 axis regulating the deacetylation-dependent translocalization of PGC-1α and FOXO1 from the cytoplasm to the nucleus, which contributes to glucose homeostasis via hepatic glucose metabolism.
Figure 8—figure supplement 1
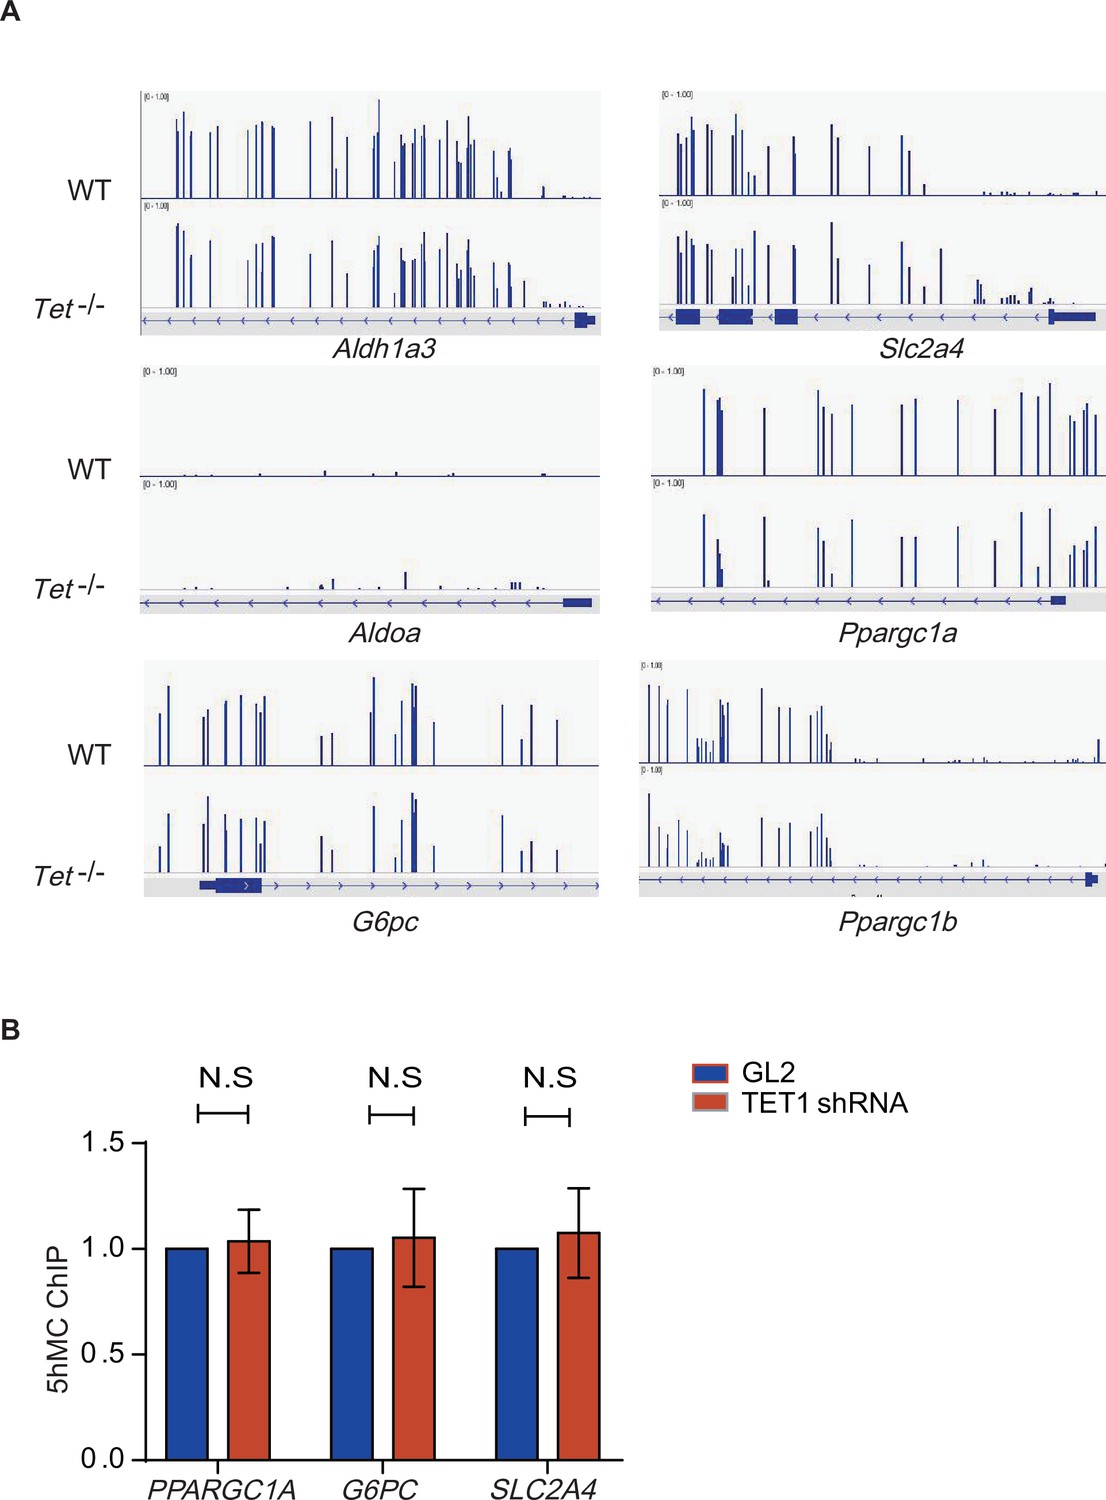
5-Hydroxymethylcytosine (5hMC) in the promoters of some gluconeogenic genes has no change in in ten-eleven translocation methylcytosine dioxygenase 1 (TET1) shRNA-inhibited LO2 cells.
(A) IGV map presented DNA methylation signals in promoter regions of some genes, including Aldh1a3, Slc2a4, Aldoa, G6pc, Ppargc1a, and Ppargc1b. (B) The binding of 5hMC on the promoters of PPARGC1A, G6PC, and SLC2A4 genes in TET1 shRNA-inhibited LO2 cells by hMeDIP-qPCR assay.
Tables
Key resources table
| Reagent type (species) or resource | Designation | Source or reference | Identifiers | Additional information |
|---|---|---|---|---|
| Gene (Homo sapiens [human]) | TET1 | GenBank | RC218608 | cDNA were purchased from Origene Corp. |
| Gene (Homo sapiens [human]) | SIRT1 | GenBank | NM_012238 | |
| Gene (Homo sapiens [human]) | SIN3A | GenBank | NM_001145357 | |
| Cell line (Homo sapiens [human]) | HepG2 cell line | ATCC | HB-8065 | |
| Cell line (Homo sapiens [human]) | LO2 cell line | Cellosaurus | CVCL_6926 | |
| Cell line (Homo sapiens [human]) | HEK293T cell line | ATCC | CRL-11268 | |
| Transfected construct (human) | TET1 shRNA #1; shRNA #2 | lentivirus vector pLKO_SHC201 | Cat# SHC201 | Sequence: shRNA#1: CCCAGAAGATTT AGAATTGAT shRNA#2: CCTCCAGTCTT AATAAGGTTA |
| Transfected construct (human) | siRNA to TET1(SMARTpool) | Dharmacon/Thermo Fisher Scientific | Cat# D-014635 | |
| Transfected construct (human) | siRNA: non-target in control (GL2 Duplex) | Dharmacon/Thermo Fisher Scientific | 1022070 | |
| Sequence-based reagent | G6PC. S | This paper | RT-PCR primers | GCAGGTGTATAC TACGTGATGGT |
| Sequence-based reagent | G6PC. A | This paper | RT-PCR primers | GACATTCAAGC ACCGAAATCTG |
| Sequence-based reagent | PPARGC1A. S | This paper | RT-PCR primers | TGACTGGCGTC ATTCAGGAG |
| Sequence-based reagent | PPARGC1A. A | This paper | RT-PCR primers | CCAGAGCAG CACACTCGAT |
| Sequence-based reagent | SLC2A4. S | This paper | RT-PCR primers | GGGAAGGAAA AGGGCTATGCTG |
| Sequence-based reagent | SLC2A4. A | This paper | RT-PCR primers | CAATGAGGAAC CGTCCAAGAATG |
| Sequence-based reagent | TET1. S | This paper | RT-PCR primers | GGAATGGAAG CCAAGATCAA |
| Sequence-based reagent | TET1. A | This paper | RT-PCR primers | ACTCCCTAAG GTTGGCAGTG |
| Sequence-based reagent | PCK1.S | This paper | RT-PCR primers | ATCCCCAAAAC AGGCCTCAG |
| Sequence-based reagent | PCK1. A | This paper | RT-PCR primers | ACGTACATGGT GCGACCTTT |
| Sequence-based reagent | ACTB. S | This paper | RT-PCR primers | TACTGCCCTG GCTCCTAGCA |
| Sequence-based reagent | ACTB. A | This paper | RT-PCR primers | GCCAGGATAGA GCCACCAATC |
| Antibody | Anti-SIRT1 (Rabbit polyclonal) | Millipore | Cat# 05–1243 | WB (1:2000) |
| Antibody | Anti-TET1 (Rabbit polyclonal) | Millipore | Cat# 09–872 | WB (1:1000) |
| Antibody | Anti-SIN3A (Rabbit polyclonal) | Abcam | Cat# ab3479 | WB (1:2000) |
| Antibody | Anti-AMPK (Rabbit polyclonal) | Abcam | Cat# ab3759 | WB (1:2000) |
| Antibody | Anti-AMPK T172 (Rabbit polyclonal) | Cell Signaling | Cat# 2535 | WB (1:2000) |
| Antibody | Anti-p53 (Rabbit polyclonal) | Abcam | Cat# ab26 | WB (1:2000) |
| Antibody | Anti-p53 acetyl 382 (Rabbit polyclonal) | Abcam | Cat# ab75754 | WB (1:2000) |
| Antibody | Anti-FOXO1 (Rabbit polyclonal) | Abcam | Cat# ab52857 | WB (1:2000)IF (1:500) |
| Antibody | Anti-PGC-1α (Rabbit polyclonal) | Abcam | Cat# ab54481 | WB (1:2000)IF (1:500) |
| Antibody | Anti-Histone H3 (Mouse monoclonal) | Abcam | Cat# ab1791 | WB (1:4000) |
| Antibody | Anti-lysine acetylated antibody (Rabbit polyclonal) | Cell Signaling | Cat# 9441 | WB (1:2000) |
| Antibody | Anti-LaminB (Rabbit polyclonal) | Santa Cruz | Cat# sc-6216 | WB (1:4000) |
| Antibody | Anti-GAPDH (Mouse monoclonal) | Santa Cruz | Cat# sc-32233 | WB (1:4000) |
| Antibody | Anti-5hMC (Rabbit polyclonal) | Active Motif | Cat# AB_2630381 | IP 4 µg/1 mg total lysate |
| Chemical compound, drug | Metformin | Sigma Aldrich | Cat# PHR108 | |
| Chemical compound, drug | AICAR | Sigma Aldrich | Cat# A9978 | |
| Chemical compound, drug | RSV | Sigma Aldrich | Cat# R5010 | |
| Chemical compound, drug | EX527 | Sigma Aldrich | Cat# E7034 | |
| Chemical compound, drug | SRT2104 | SellectChem | Cat# S7792 | |
| Commercial assay or kit | Pyruvate Assay Kit | Sigma Aldrich | Cat# MAK071 | |
| Commercial assay or kit | Glucose (Go) Assay Kit | Sigma Aldrich | Cat# GAGO20 | |
| Commercial assay or kit | SIRT1 Activity Assay Kit | Abcam | Cat# ab156065 | |
| Software, algorithm | SPSS; Image J | SPSS; Image J | RRID:SCR_002865; RRID:SCR_003070 | |
| Strain, strain background (Escherichia coli) | BL21(DE3) | Sigma Aldrich | CMC0016 | |
| Other | DAPI stain | Invitrogen | D1306 | (1 µg/ml) |
| Other | Lipo3000 | Invitrogen | Cat# L3000001 | |
| Other | Tet1 Knockout mice | Jackson | Cat# 017358 |
Additional files
-
Transparent reporting form
- https://cdn.elifesciences.org/articles/70672/elife-70672-transrepform1-v3.docx
-
Supplementary file 1
List of primers.
- https://cdn.elifesciences.org/articles/70672/elife-70672-supp1-v3.docx
Download links
A two-part list of links to download the article, or parts of the article, in various formats.
Downloads (link to download the article as PDF)
Open citations (links to open the citations from this article in various online reference manager services)
Cite this article (links to download the citations from this article in formats compatible with various reference manager tools)
The hepatic AMPK-TET1-SIRT1 axis regulates glucose homeostasis
eLife 10:e70672.
https://doi.org/10.7554/eLife.70672


