The roles of history, chance, and natural selection in the evolution of antibiotic resistance
- Department of Microbiology and Molecular Genetics, School of Medicine, University of Pittsburgh, United States
- Department of Psychology, Carnegie Mellon University, United States
- Center for Evolutionary Biology and Medicine, University of Pittsburgh, United States
Figures
Figure 1 with 1 supplement
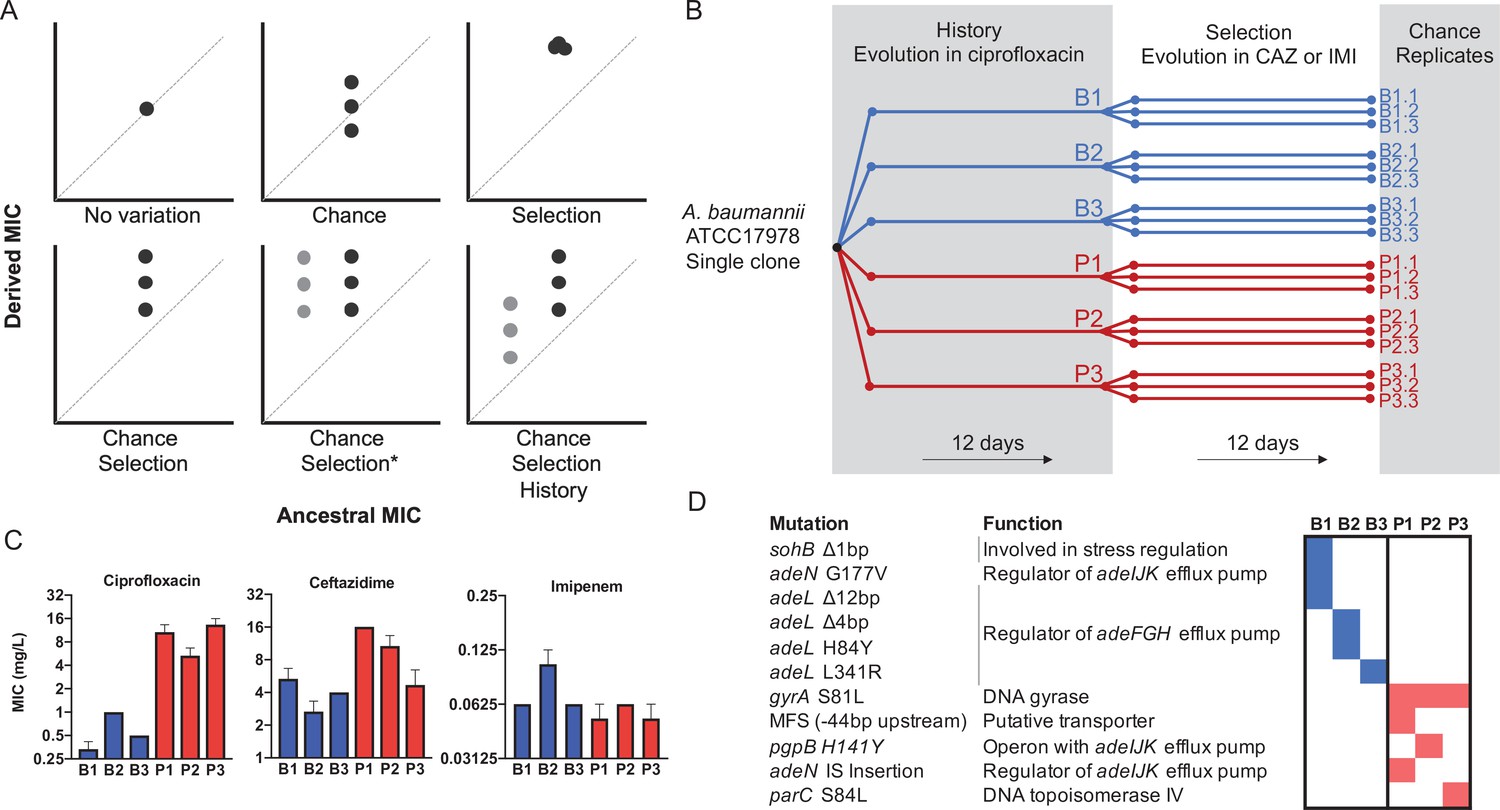
Experimental design to differentiate history, chance, and selection including starting genotypes and AMR phenotypes.
(A) Potential outcomes of replicate evolved populations estimated by the resistance level before and after the antibiotic treatment. Grey and black symbols denote starting clones with different resistance levels. A more detailed description of this design is in the Methods section, modified from Travisano et al., 1995. The asterisk denotes the case in which chance and selection both erase historical effects. (B) Six different clones with distinct genotypes and CIP susceptibility were used to found new replicate populations that evolved in increasing CAZ or IMI for 12 days (Santos-Lopez et al., 2019). (C) MIC of the six ancestors in CIP, CAZ and IMI (± SEM). (D) Ancestral genotypes prior to the selection phase.
-
Figure 1—source data 1
Concentrations of CAZ and IMI (mg/L) added to the broth at different intervals of the evolution experiments.
- https://cdn.elifesciences.org/articles/70676/elife-70676-fig1-data1-v2.docx
-
Figure 1—source data 2
Minimum inhibitory concentration (MIC) values for all ancestors and evolved clones by treatment.
- https://cdn.elifesciences.org/articles/70676/elife-70676-fig1-data2-v2.csv
Figure 1—figure supplement 1
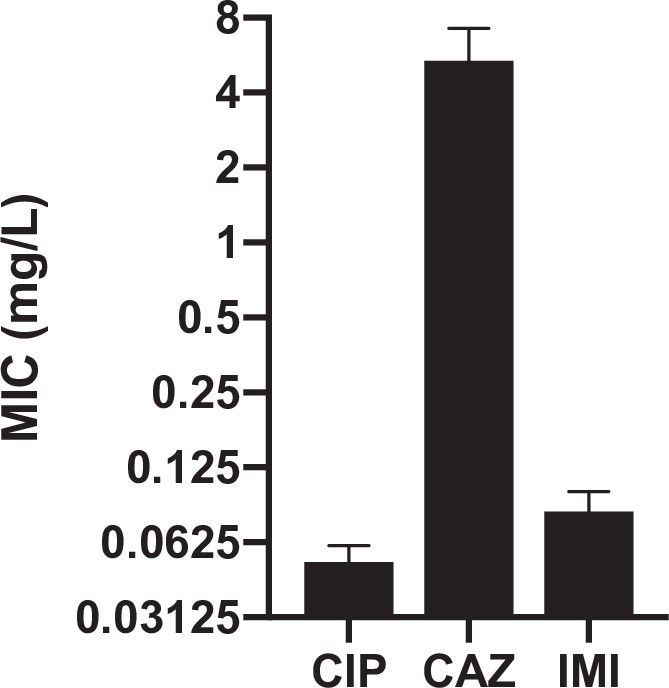
Resistance levels to ciprofloxacin, ceftazidime and imipenem of the ancestral strain prior to being propagated in the historical phase under increasing concentrations of CIP.
Figure 2 with 1 supplement
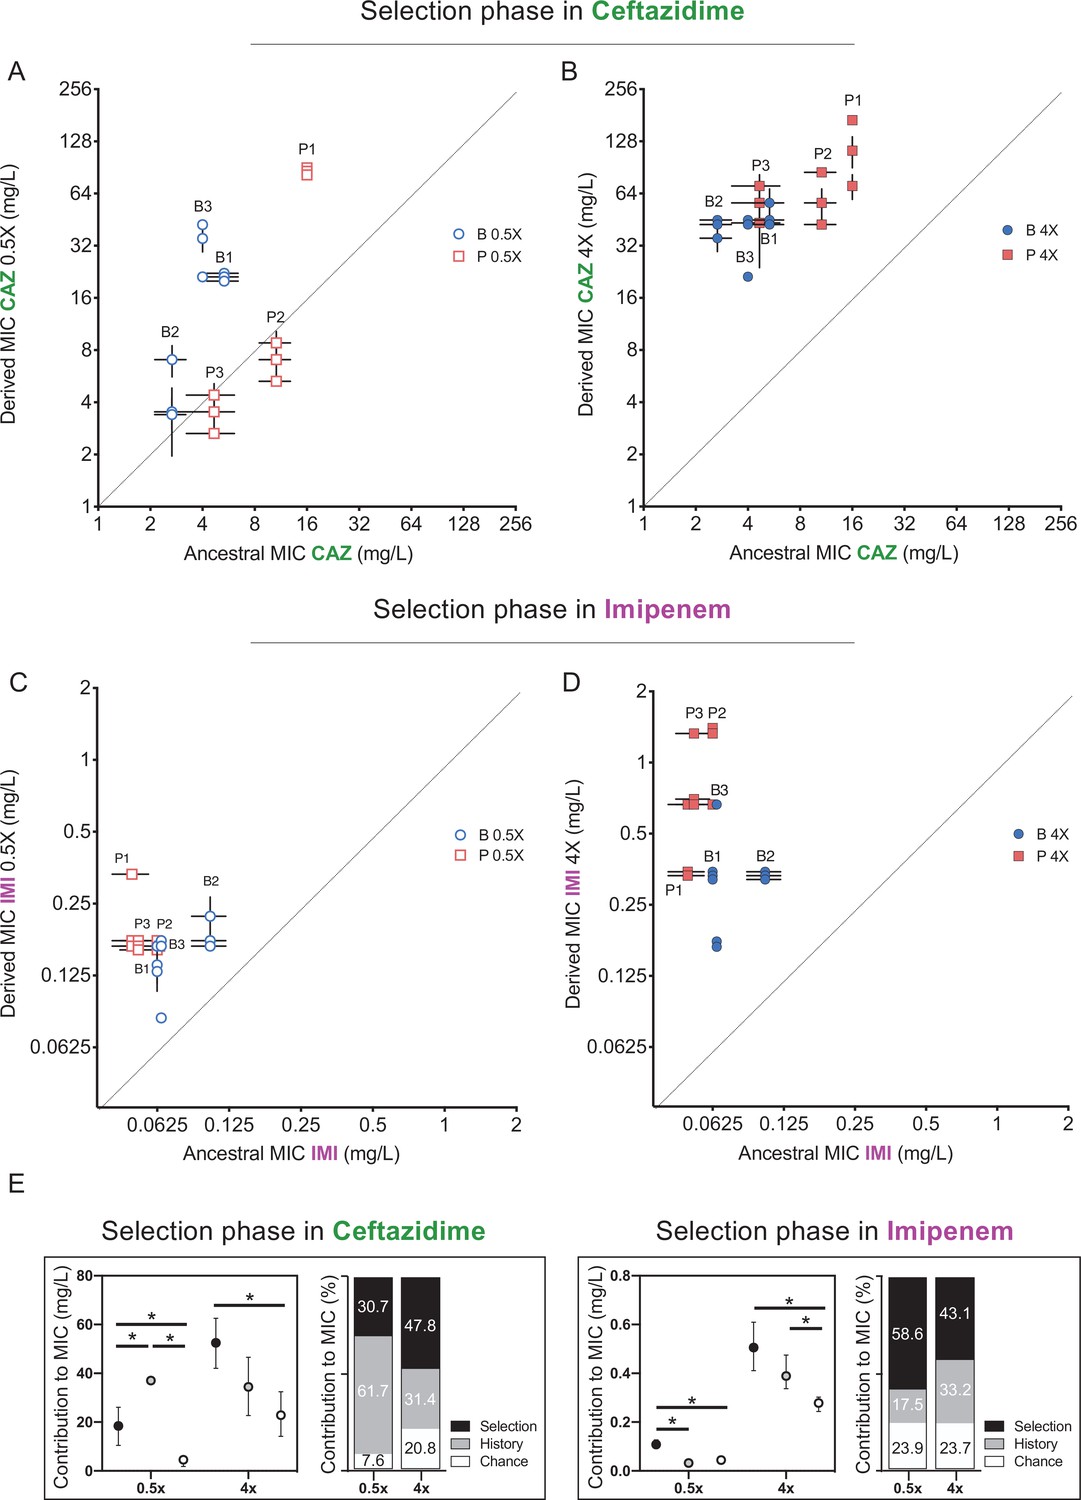
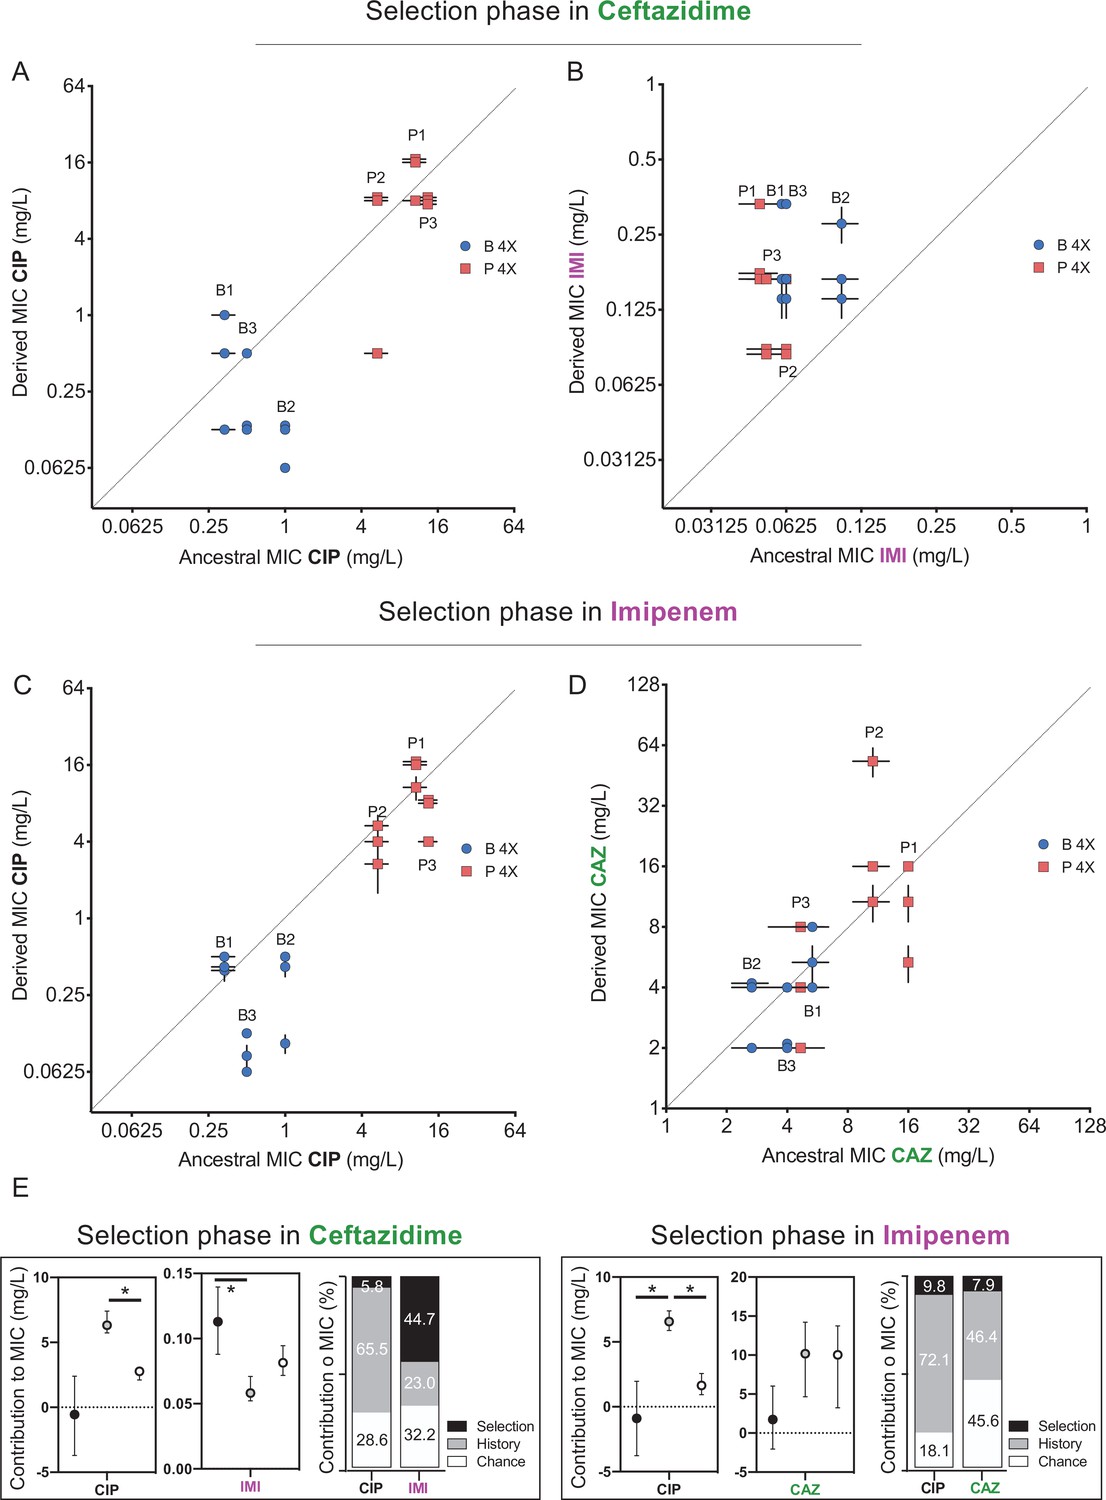
Effects of history, chance, and selection on the evolution of CAZ or IMI resistance after 3 days at 0.5x MIC.
(A, C) and after 12 days of increasing concentrations (B, D). Empty and filled symbols (3 days, left; and 12 days, right) represent CAZ or IMI MIC after 3 and 12 days of evolution. Blue symbols evolved from B ancestors were isolated from prior biofilm selection; red squares were evolved from P ancestors with a prior history in planktonic culture. Some symbols representing identical data points are jittered to be visible. MICs were measured in triplicate and shown± SEM. All populations increased CAZ resistance at day 3 (nested one-way ANOVA, Tukey’s multiple comparison tests MIC day 0 vs. MIC day 3, p=0.0080 q = 4.428, df = 51) and at the end of the experiment (nested one-way ANOVA Tukey’s multiple comparison tests MIC 0 vs. MIC day 12, p≤0.0001, q = 11.12, df = 51). All populations increased IMI resistance at day 12 but not at early timepoints (day 3) (nested one-way ANOVA Tukey’s multiple comparison tests MIC at day 0 vs. MIC at day 12, p<0.0001, q = 9.519, df = 51; MIC at day 0 vs. MIC at day 3, p=0.3524, q = 1.969, df = 51). (E) Absolute and relative contributions of each evolutionary force. Error bars indicate 95% confidence intervals. Asterisks denote p<0.05.
-
Figure 2—source data 1
Estimated statistics for history, chance, and selection forces.
By means of a nested linear mixed model, the estimated coefficients representing the forces are shown, in addition to the confidence intervals at a α = 0.05 significance level generated by bootstrapping and the Bayes factors computed by a Bayesian analysis. BF10 is the ratio between the probabilities of the alternative and null model and therefore, it measures the degree of evidence of including the force. BF10 < 1 null evidence, 3 > BF10 > 1 weak evidence, 20 > BF10 > 3 positive evidence, 150 > BF10 > 20 strong evidence, BF10 > 150 very strong evidence. This is also source data for Figure 3.
- https://cdn.elifesciences.org/articles/70676/elife-70676-fig2-data1-v2.xlsx
Figure 2—figure supplement 1
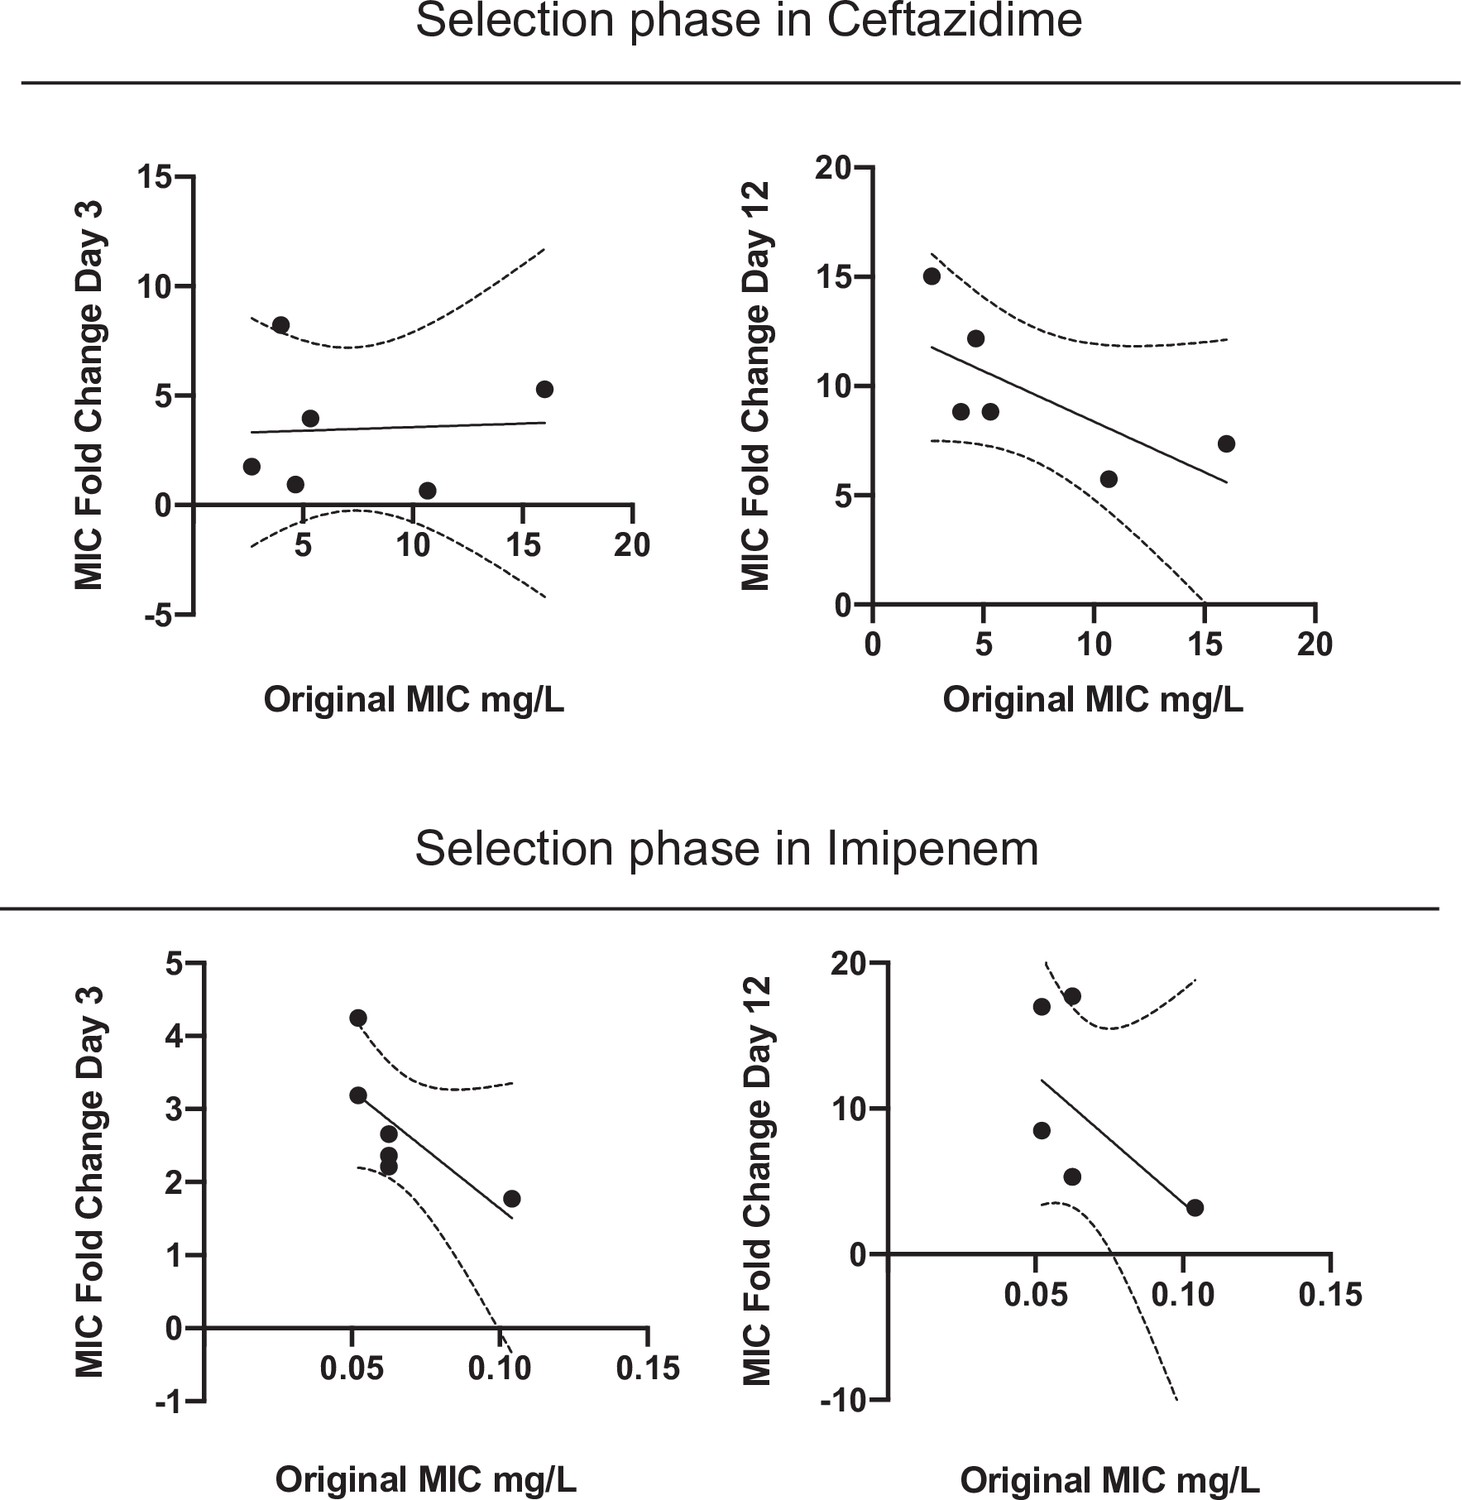
Correlation between ancestral MIC and increase of CAZ (top) and IMI (bottom) resistance after 3 and 12 days evolving in the presence of CAZ (left and right panels, respectively).
There are three possible outcomes by correlating the original MIC and the fold dilution change: (1) a negative correlation, in which the populations with lower initial MICs increased their resistance level more than populations with higher MICs, which implies that the selection erased the previous effects of history; (2) a positive correlation indicates that initial differences in MIC were magnified by selection; and (3) a lack of correlation indicates that the effect of history did not change before and after selection. Evolving in presence of CAZ, no correlation was found after three days of antibiotic treatment (Spearman r = –0.08, p=0.919), but the increases in resistance levels and time were negatively correlated with the starting values at day 12 (Spearman r = –0.84, p=0.044) (Figure 2B and ). Evolving in the presence of IMI, increases in resistance levels and time were negatively correlated at day 3 (Spearman r = –0.9258, p=0.033) but not at day 12 (Spearman r = –0.6262, p=0.1833).
Figure 3
Collateral resistance caused by history, chance, and selection.
Panel (A) shows CIP resistance and (B) shows IMI resistance following 12 days of CAZ treatment. Panel (C) shows CIP resistance and (D) shows CAZ resistance following 12 days of IMI treatment. Blue symbols: populations evolved from B (biofilm-evolved) ancestors; red squares: populations evolved from P ancestors (planktonic-evolved). Some symbols representing identical data points are jittered to be visible. MICs were measured in triplicate and shown ± SEM. (E) Contributions of each evolutionary force. Error bars indicate 95% confidence intervals. Asterisks denote p<0.05.
Figure 4 with 1 supplement
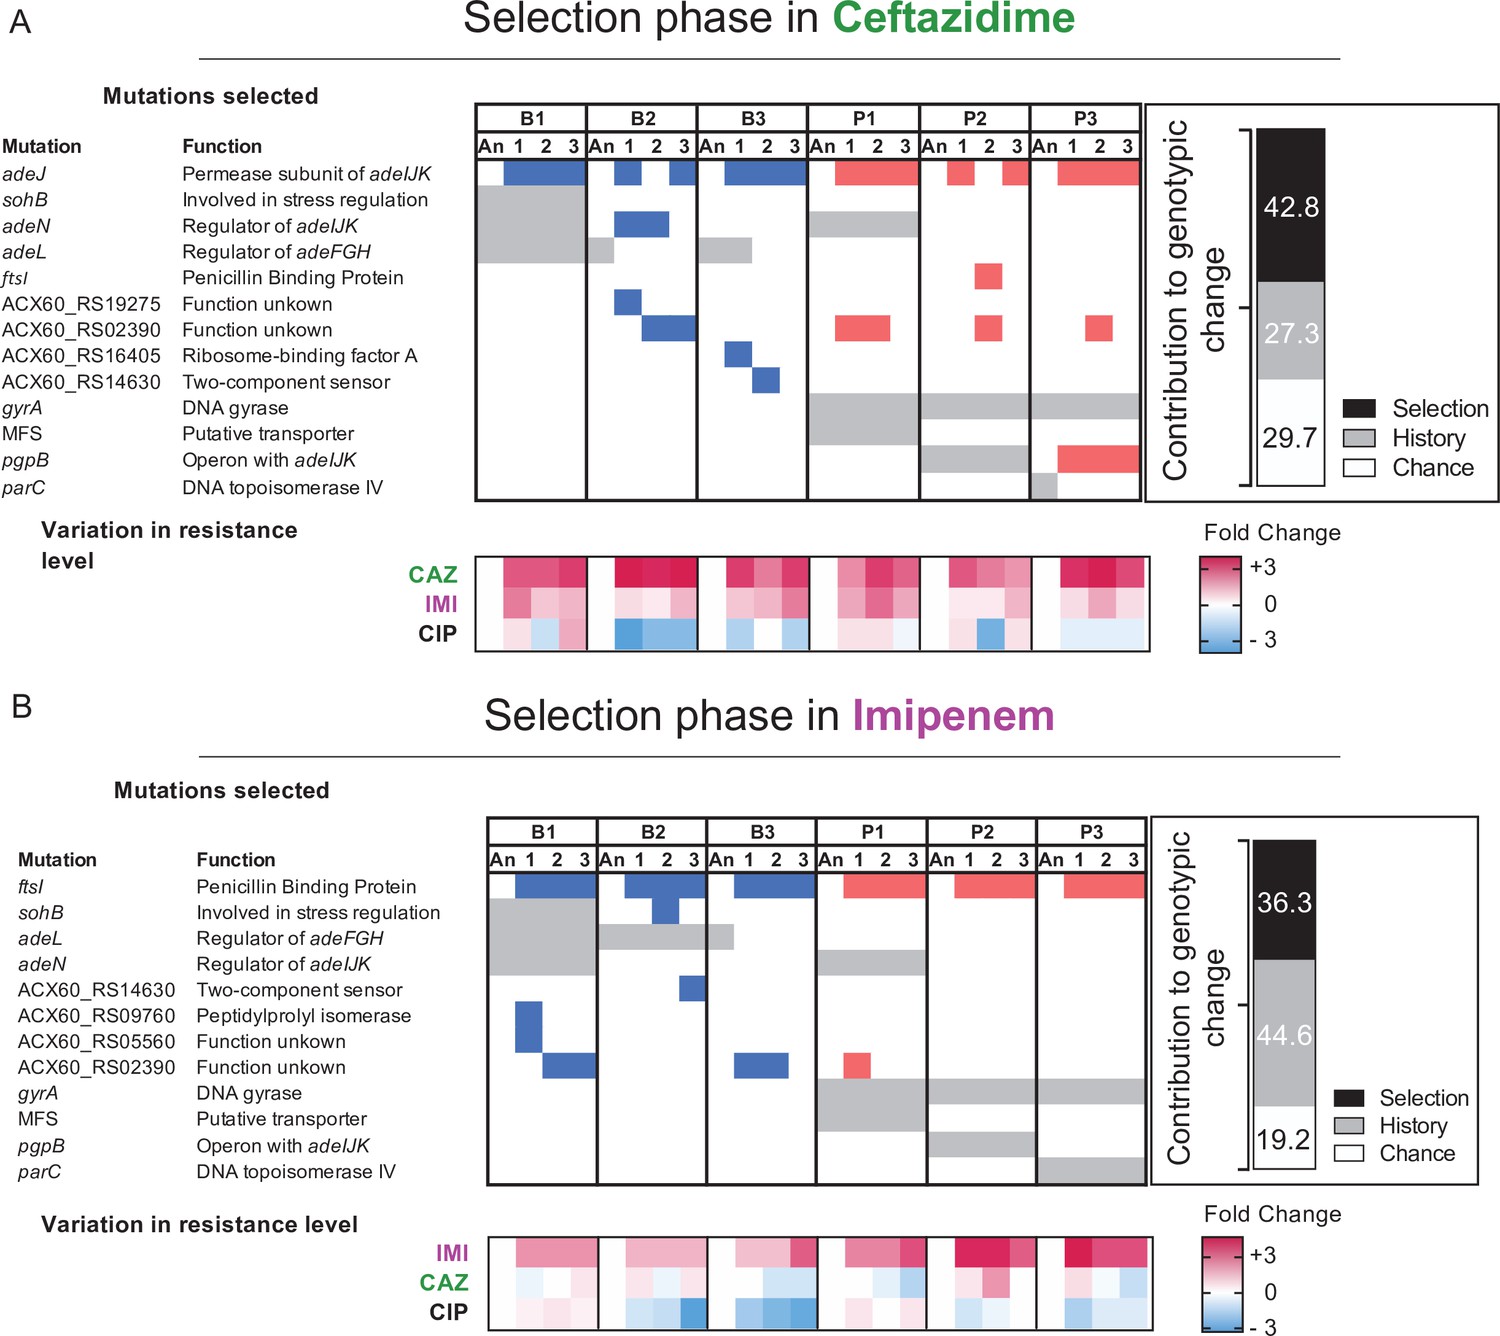
Mutated genes in the populations evolving in presence of a new antibiotic.
Each column represents a population propagated in CAZ (A) or in IMI (B). Grey shading indicates the mutated genes present in the ancestral clones derived from the “history phase”. Blue and red denote mutated genes after the ‘selection phase’ in CAZ or IMI and if those lines experienced prior planktonic selection (red) or biofilm growth (blue). Only genes in which mutations reached 75% or greater frequency or that became mutated in more than one population are shown here. A full report of all mutations is in Figure 4—source data 1. The relative contributions of history, chance, and selection to these genetic changes are shown in the insets. Below: log2 changes in evolved resistance for each population shown as a heatmap summarizing the data from Figures 2 and 3.
-
Figure 4—source data 1
Putative driver mutations and resistance levels of the replicate populations after 12 days evolving in presence of CAZ or IMI.
The average resistance levels (mg/L) and SEM are shown in the table. Replicates highlighted acquired the same mutation.
- https://cdn.elifesciences.org/articles/70676/elife-70676-fig4-data1-v2.docx
-
Figure 4—source data 2
Complete list of mutated genes from the sequenced populations and clones.
- https://cdn.elifesciences.org/articles/70676/elife-70676-fig4-data2-v2.xlsx
Figure 4—figure supplement 1
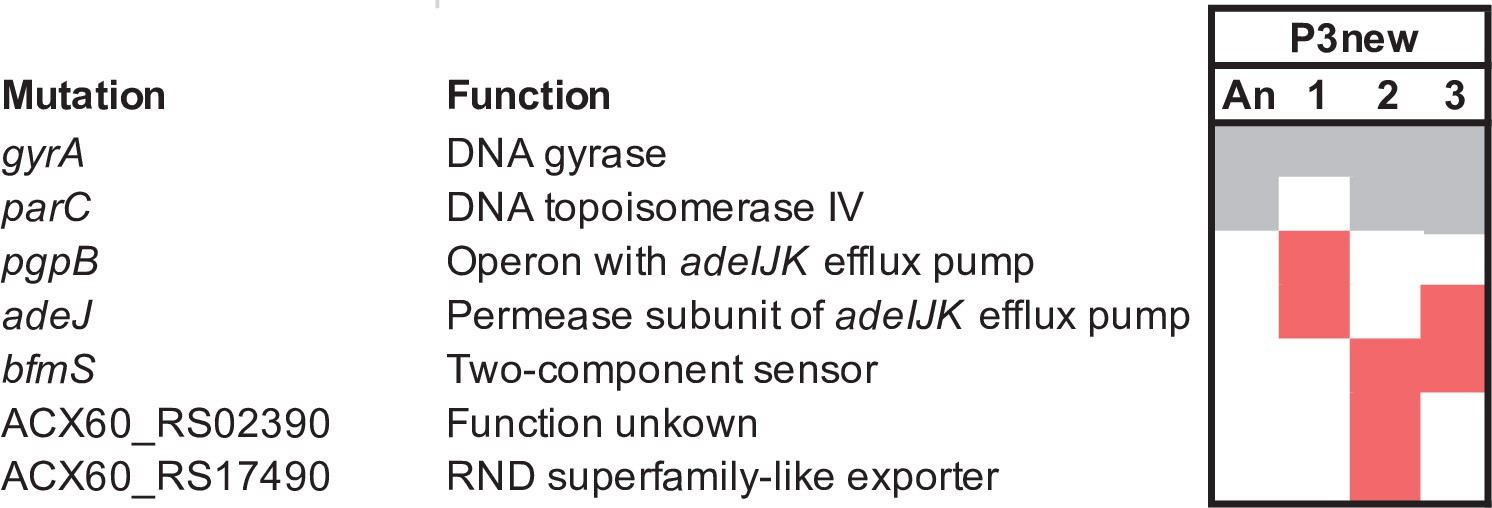
Mutated genes in the P3 evolving in the presence of CAZ.
Each column represents a population propagated in CAZ. Gray shading indicates the mutated genes present in the ancestral clones derived from the ’history phase‘. Red denote mutated genes after the ’selection phase’ in CAZ. Only genes in which mutations reached 75% or greater frequency or that became mutated in more than one population are shown here.
Figure 5
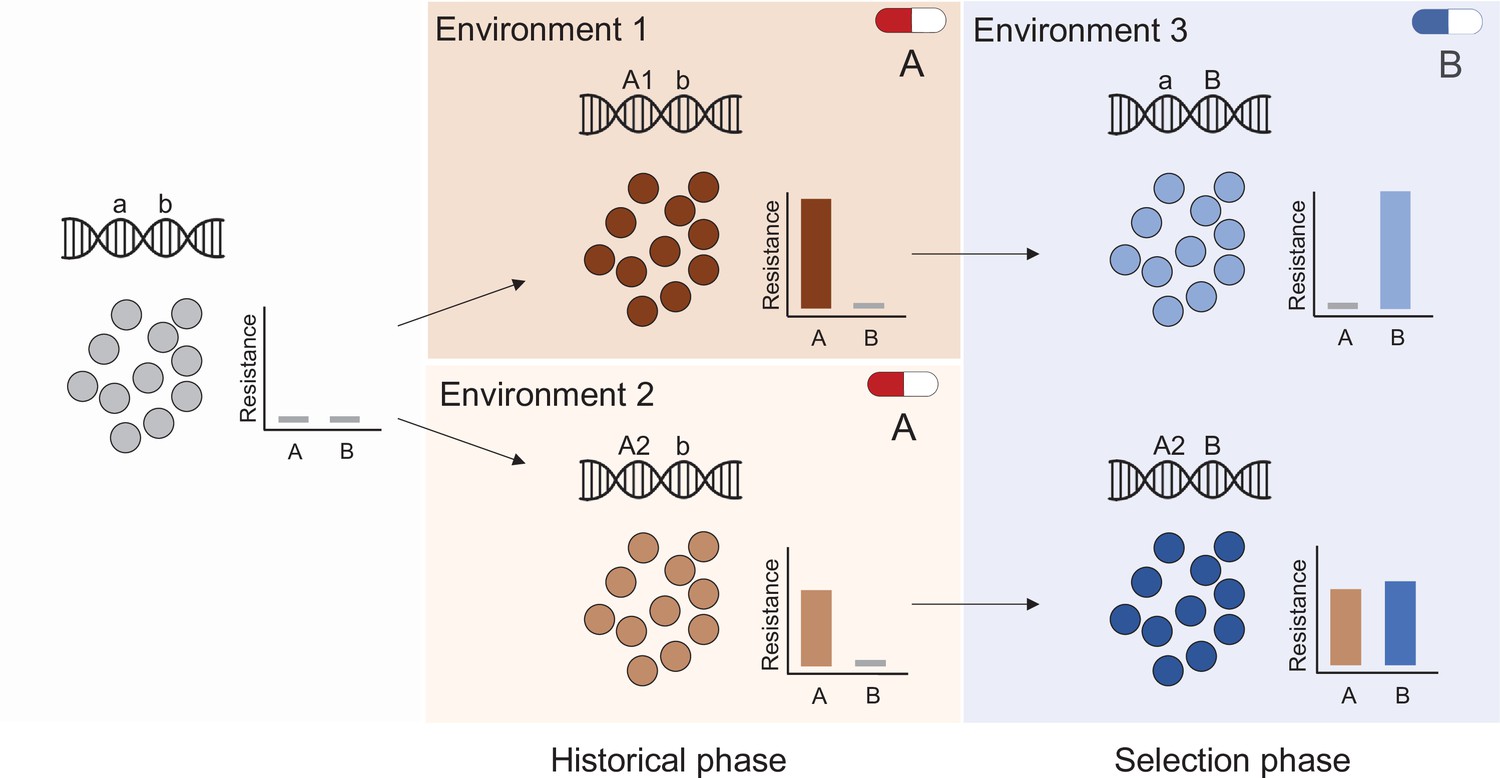
Evolutionary history and natural selection determine the evolution of antibiotic resistance.
A sensitive population (left panel) is subjected to two successive treatments (antibiotic A and antibiotic B, middle and right panels respectively). First, the population was treated with antibiotic A in either of two different environments (middle panel top and bottom) that selected different genotypes (mutations A1 and A2) with distinct resistance phenotypes (middle panel insets). During subsequent exposure to a second antibiotic (B), this evolutionary history determined resistance levels (right panel) to both drugs A and B, for instance resulting in the loss of resistance to drug A (top right panel).
Additional files
-
Supplementary file 1
List of deposited sequences from clones and populations and the corresponding accession numbers.
- https://cdn.elifesciences.org/articles/70676/elife-70676-supp1-v2.xlsx
-
Transparent reporting form
- https://cdn.elifesciences.org/articles/70676/elife-70676-transrepform1-v2.docx
Download links
A two-part list of links to download the article, or parts of the article, in various formats.
Downloads (link to download the article as PDF)
Open citations (links to open the citations from this article in various online reference manager services)
Cite this article (links to download the citations from this article in formats compatible with various reference manager tools)
The roles of history, chance, and natural selection in the evolution of antibiotic resistance
eLife 10:e70676.
https://doi.org/10.7554/eLife.70676


