Plant Trans-Golgi Network/Early Endosome pH regulation requires Cation Chloride Cotransporter (CCC1)
- School of Agriculture, Food and Wine, Waite Research Institute, ARC Centre of Excellence in Plant Energy Biology, University of Adelaide, Waite Campus, Australia
- School of Biosciences, University of Melbourne, Australia
- Department of Cell and Systems Biology, University of Toronto, Canada
Figures
Figure 1
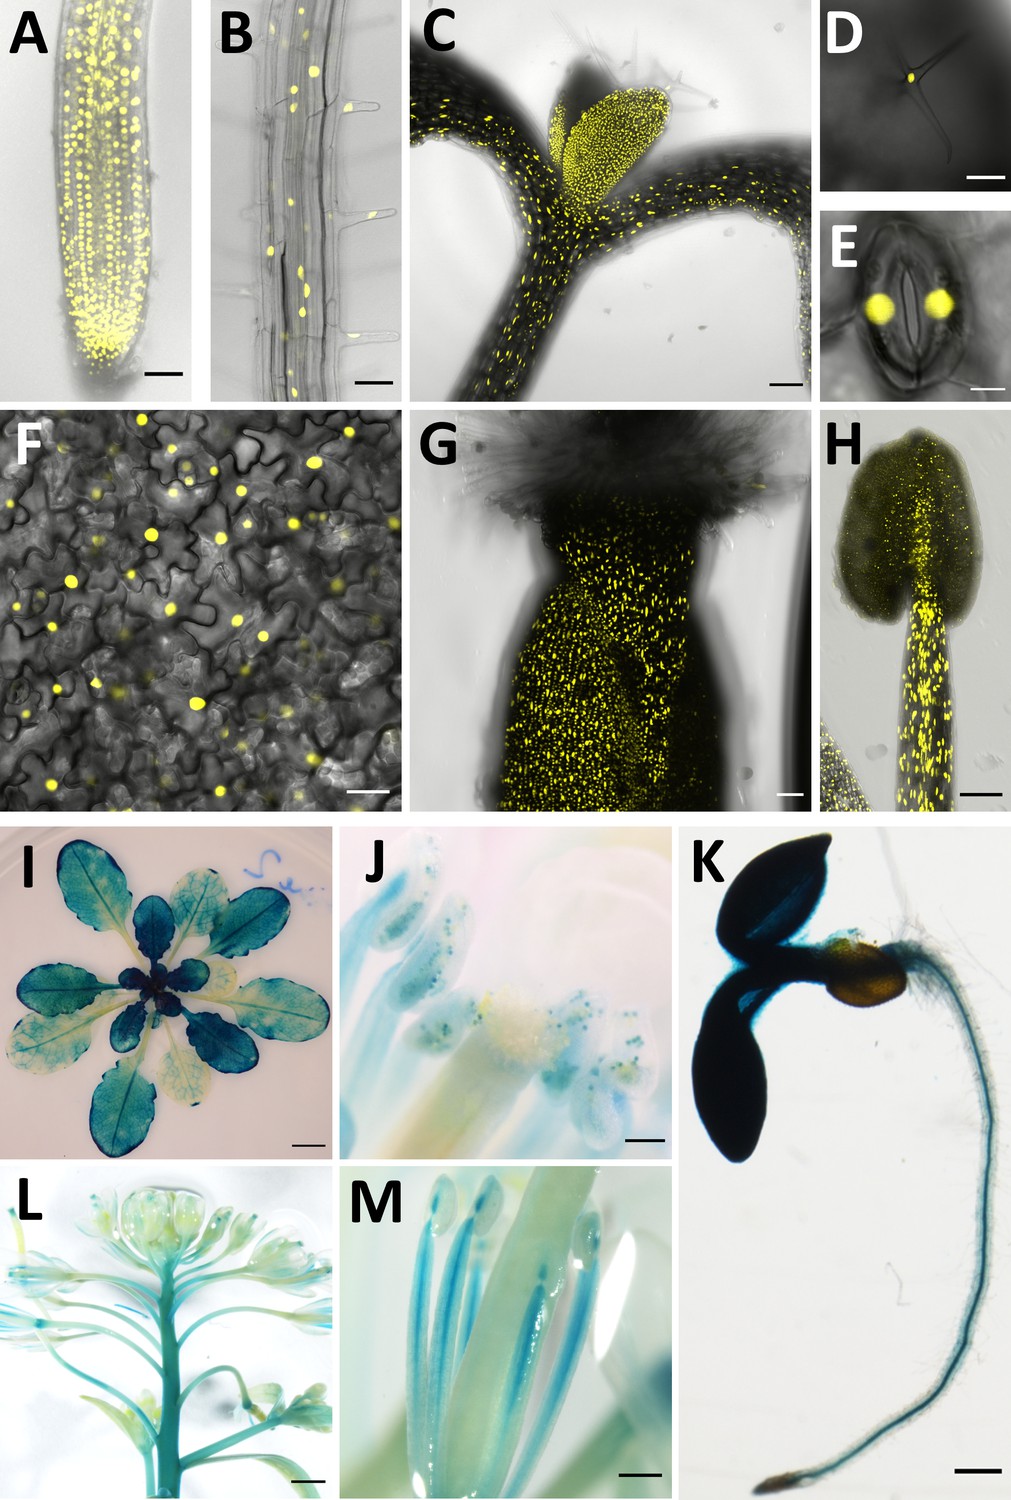
CCC1 is expressed ubiquitously.
CCC1 promoter-driven expression of either NLS-Venus (yellow, bright YFP variant with a nuclear localisation signal) or ẞ-glucuronidase (blue GUS staining). (A–H) NLS-Venus expression indicating CCC1 promoter activity in all root cells, including (A) the root tip, (B) root epidermal cells; (C) hypocotyl; all leaf cells including (D) trichomes, (E) guard cells, and (F) leaf epidermal and mesophyll cells; and reproductive organs (G) gynoecium, and (H) stamen tissues. (I–M) GUS staining indicating promoter activity predominantly in (I) younger leaves, (J) pollen, (K) root stele, (L) floral stem, and (M) stamen. Scale bars are 50 µm (images A, B, G), 100 µm (images C, D, H, J), 5 µm (image E), 20 µm (image F), 5 mm (image I), 200 µm (images K, M) and 1000 µm (image L).
Figure 2 with 1 supplement

ccc1 plants show defects in cell elongation.
(A) Top image, ccc1 (right) have smaller shoots and deformed leaves compared to wildtype (left) plants. Plants grown 26 days in short day, scale bar is 2 cm. Bottom image, ccc1 (right) have shorter primary roots compared to wildtype (left) plants. Plants grown 14 days in long day, scale bar is 2 cm. (B–C) Root epidermal cells are shorter in ccc1. n > 13 plants. Images are maximum intensity projections of cell wall autofluorescence. Scale bars are 50 µm. (D–E) ccc1 plants have shorter root hairs. n > 900 root hairs of >30 plants. Scale bars are 200 µm. (F) ccc1 plants do not develop collet hairs. Scale bars are 500 µm. Boxplots show range; median, first and third quartile are indicated. One-way ANOVA used to determine p. * indicates p < 0.05, **** indicates p < 0.0001.
-
Figure 2—source data 1
Data analysed and presented in Figure 2 and supplement.
- https://cdn.elifesciences.org/articles/70701/elife-70701-fig2-data1-v3.xlsx
Figure 2—figure supplement 1
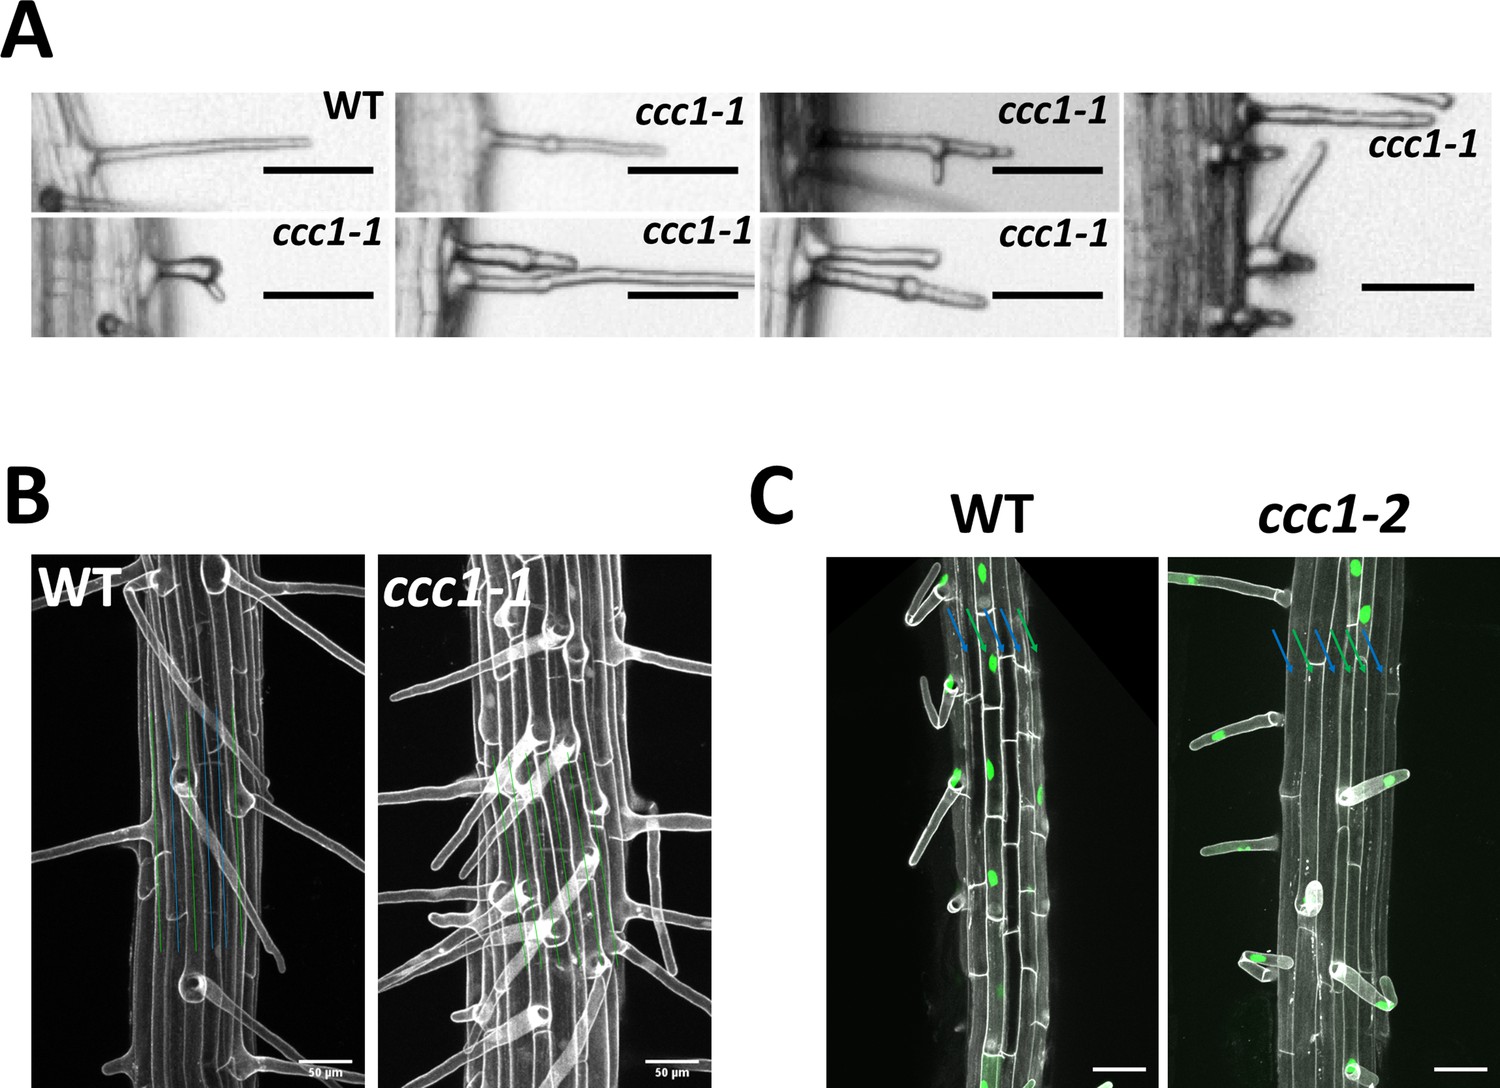
CCC1 is important for collet hair elongation and normal trichoblast development.
(A) A very small number of ccc1 root hairs display forking and branching. Scale bars are 50 µm. (B–C) ccc1 roots do not exhibit the classic cell file patterning of trichoblast and atrichoblast cell files observed in Arabidopsis. Cell files containing root hairs are marked with a green line while those that do not have root hairs are marked with a blue line. (B) Images are maximum intensity projections, imaging cell wall autofluorescence (white). Scale bars are 50 µm. (C) The trichoblast marker PRP3::H2B-2xmCherry (mCherry in green) confirms the appearance of adjacent trichoblasts in ccc1 and their trichoblast cell identify. Images are maximum intensity projections using cell wall autofluorescence (white). Scale bars are 50 µm.
Figure 3 with 1 supplement
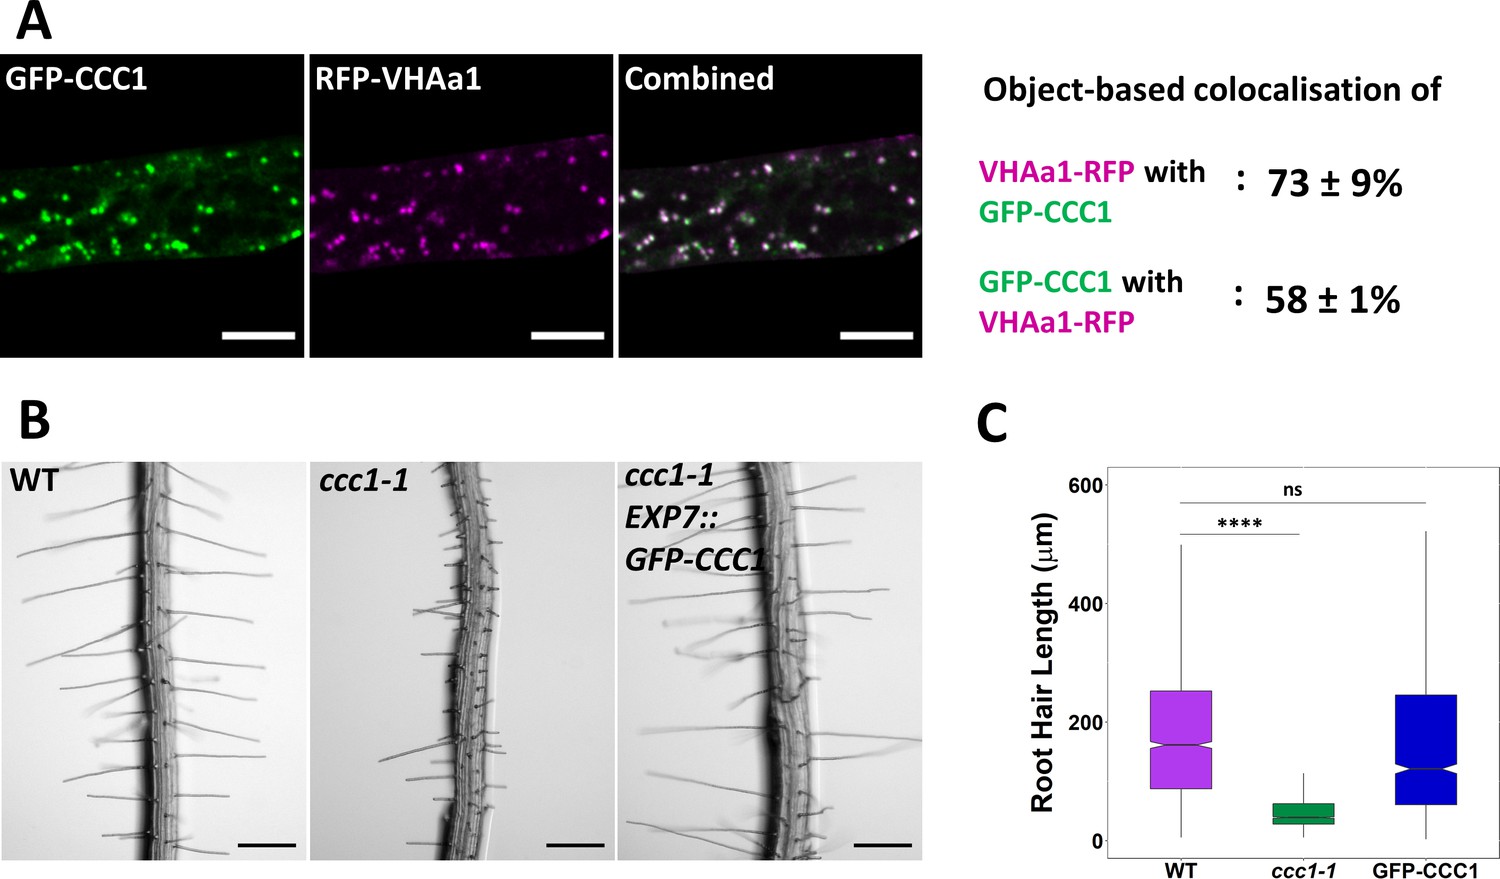
Stably expressed GFP-CCC1 is functional and localised to the trans-Golgi-network/early endosome (TGN/EE).
(A) GFP-CCC1 (green) and VHAa1-RFP (magenta) colocalise. Colocalisation was calculated using DiAna object-based colocalisation plugin in ImageJ; Pearson’s coefficient was also calculated as 0.86 ± 0.055. Error is standard deviation. n = 15 cells of five plants. Scale bars are 10 µm. Images are single representative optical sections from a stack. (B–C) Expression of GFP-CCC1 rescues ccc1 root hair length defects. n > 1300 root hairs. Scale bars are 200 µm. Boxplot shows range; median, first and third quartile are indicated. One-way ANOVA used to determine p. **** indicates p < 0.0001.
-
Figure 3—source data 1
Data analysed and presented in Figure 3 and supplement.
- https://cdn.elifesciences.org/articles/70701/elife-70701-fig3-data1-v3.xlsx
Figure 3—figure supplement 1
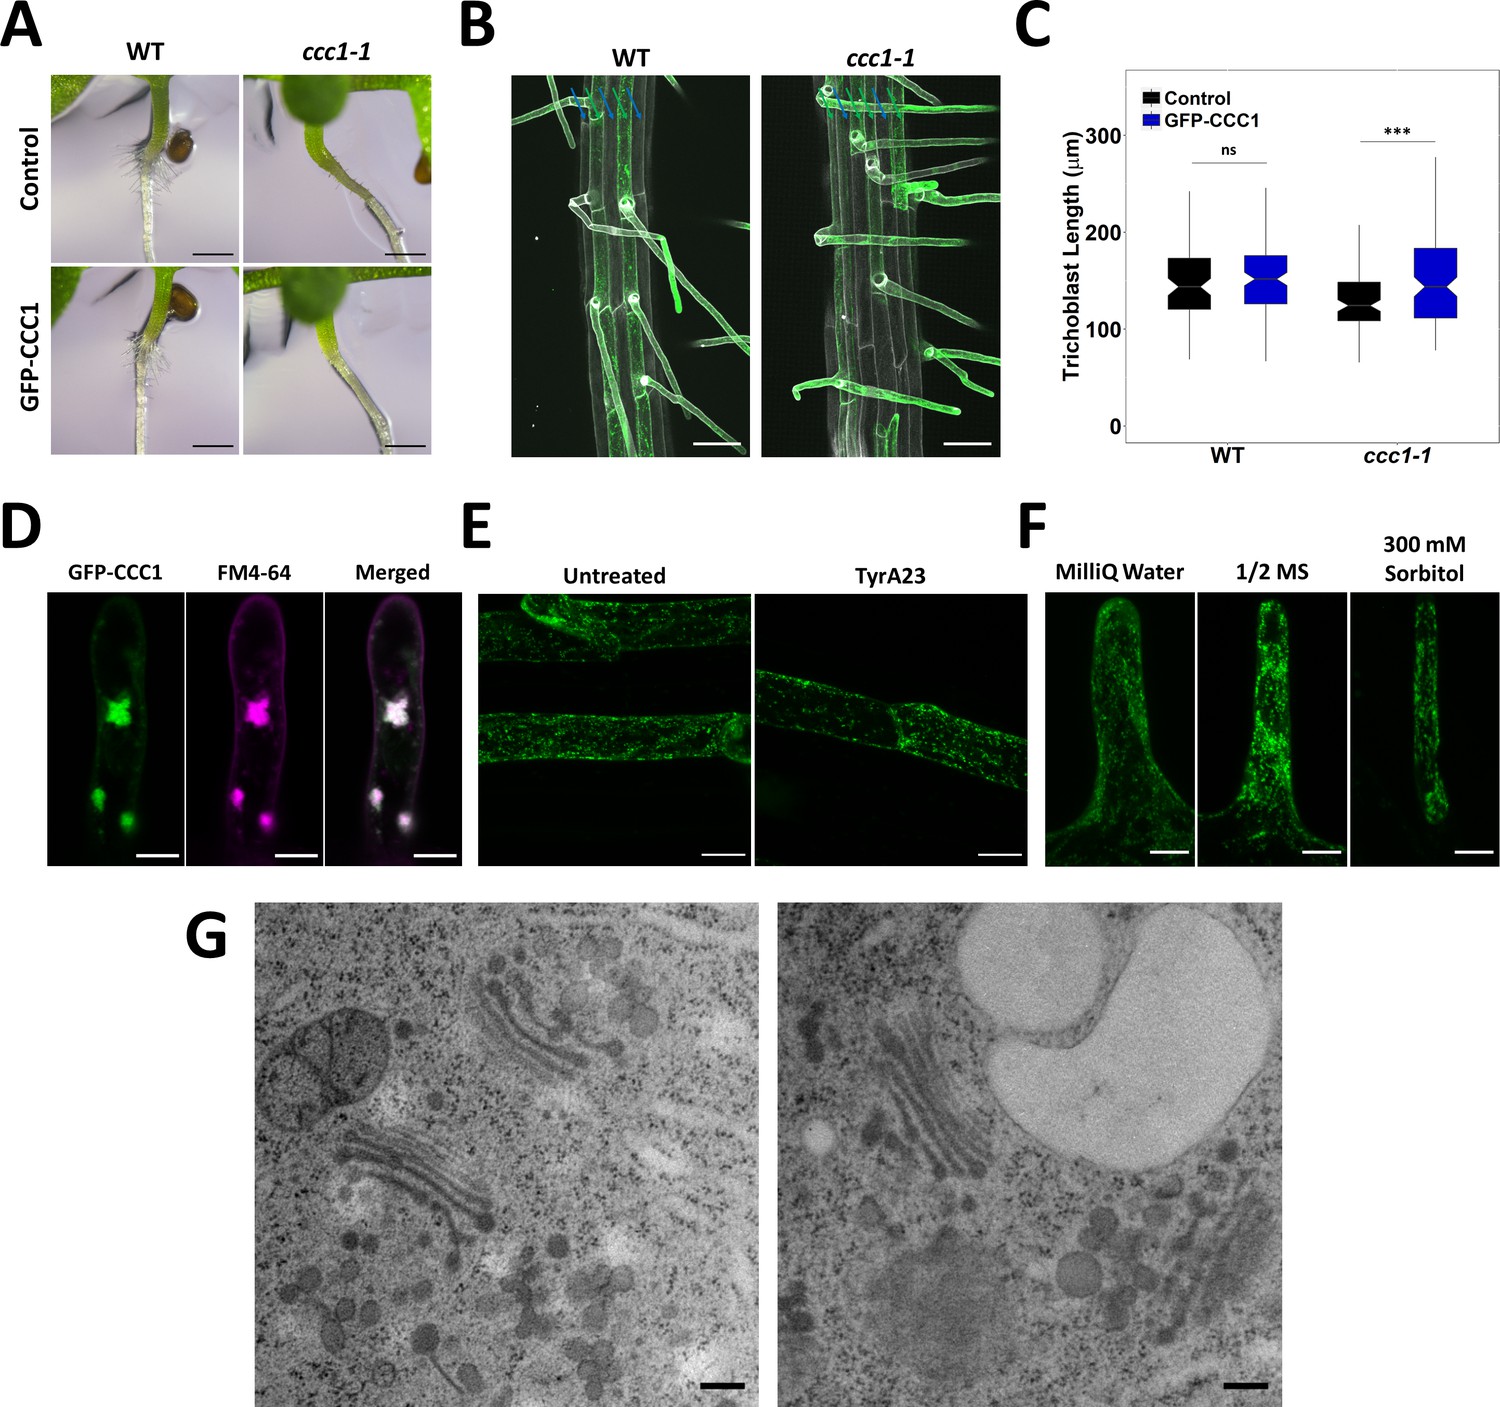
GFP-CCC1 is localised to the endomembrane system and neither pharmacological treatment nor osmotic shock alters localisation.
(A) Expression of GFP-CCC1 in trichoblasts with the EXP7 promoter does not affect collet hair formation. Scale bars are 500 µM. (B) Expression of GFP-CCC1 (green) in trichoblasts does not rescue the trichoblast patterning phenotype in ccc1 plants. Cell files containing trichoblasts denoted with a green arrow while those without marked with blue. Cell wall autofluorescence (white) used to image root. Scale bars are 50 µm. (C) Expression of GFP-CCC1 (green) in trichoblasts rescues the reduced epidermal cell length in ccc1 plants and had no effect on cell length in wildtype. n > 80 cells from 12 roots. (D) After treating roots with 4 µM FM4-64 (magenta) for 5 min and 25 µM brefeldin A (BFA) for 1 hr, GFP-CCC1 (green) and FM4-64 are both observed in the core of the BFA body. The image is a maximum intensity projection. Scale bars are 10 µm. (E) Treating roots with 50 µM of tyrphostin A23 (TyrA23) for 30 min did not result in plasma membrane (PM) signal of GFP-CCC1 (green). Images are maximum intensity projections of mature root epidermal cells. Scale bars are 20 µm. (F) Neither hyper- nor hypo-osmotic stress changed GFP-CCC1 localisation. Images are maximum intensity projections of root hairs equilibrated in 1/2 MS solution before being moved to MilliQ water or 300 mM sorbitol for 5 min. Scale bars are 10 µm. (G) Representative transmission electron microscopy (TEM) images of high-pressure frozen, freeze substituted early elongation zone root epidermal cells, showing Golgi and TGN/EE morphology in wildtype (left) and ccc1 (right). Scale bars are 200 nm. Boxplot shows range; median, first and third quartile are indicated. One-way ANOVA used to determine p. * indicates p < 0.05, *** indicates p < 0.001.
Figure 4 with 1 supplement
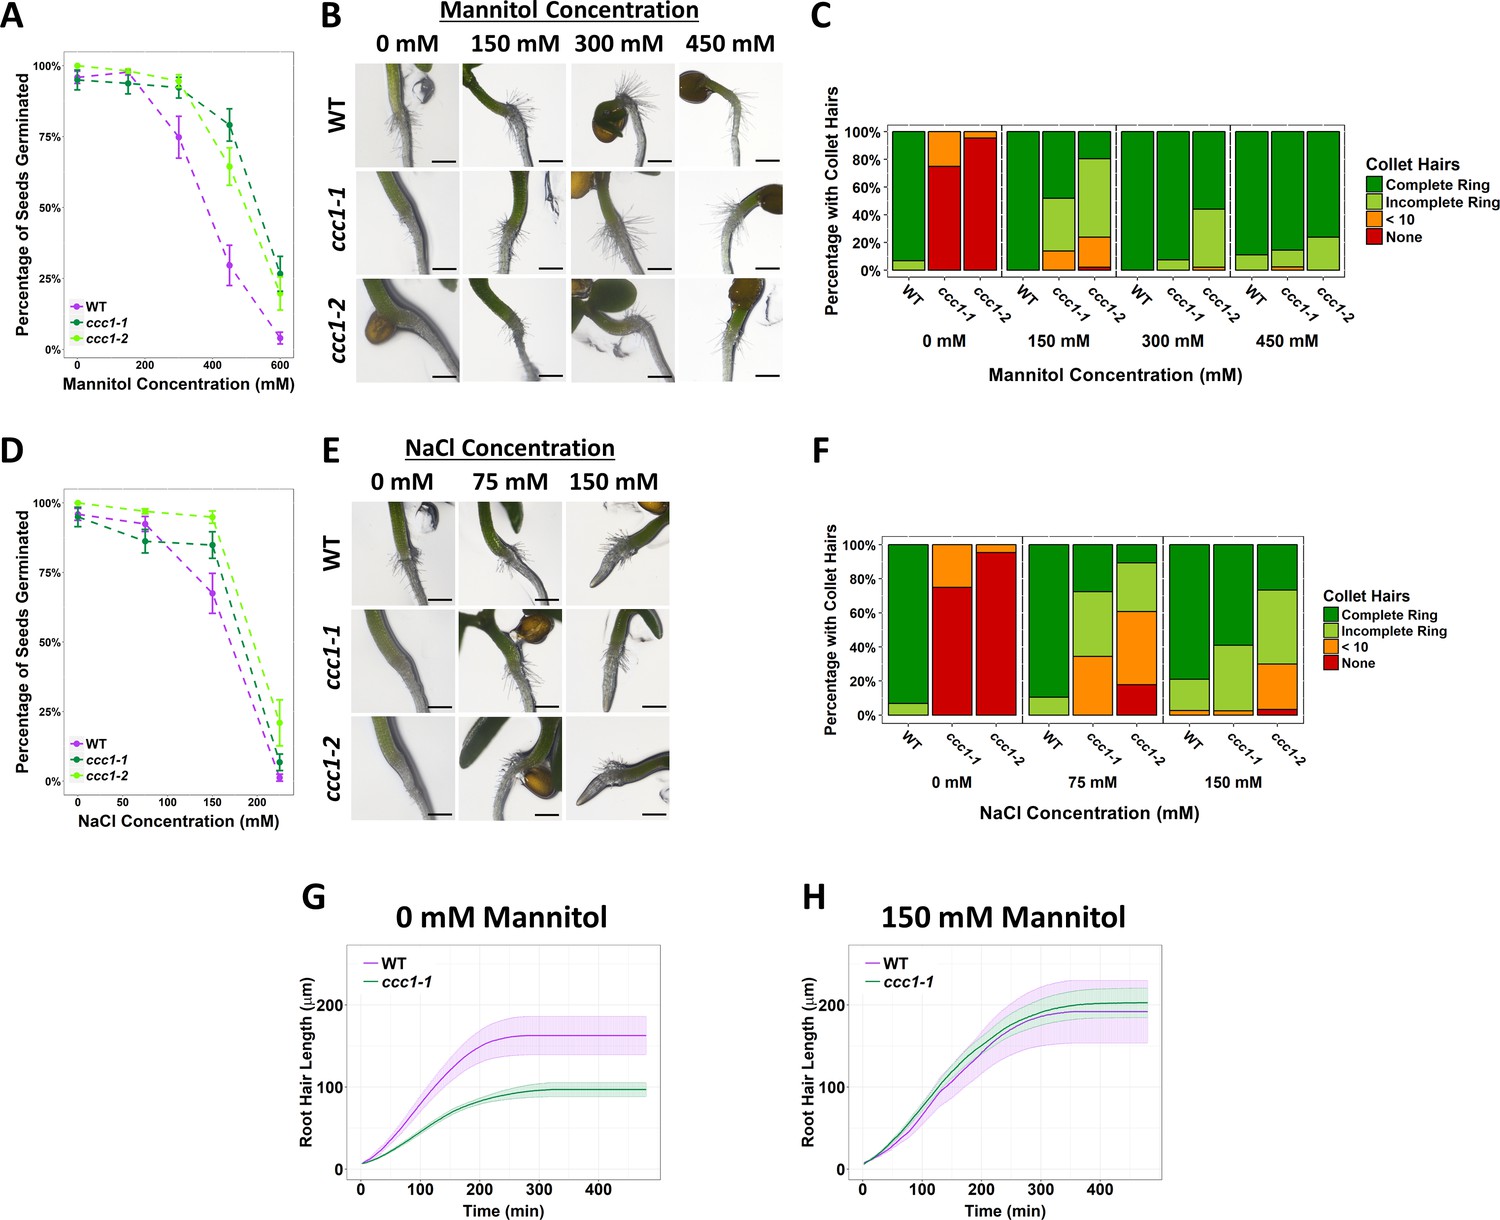
Increased external osmolarity rescues cell elongation defects in ccc1.
(A, D) A higher percentage of ccc1 seeds germinate on media with a higher osmolarity, adjusted with increasing (A) mannitol or (D) NaCl concentrations. Number of germinated seeds assessed 6 days after imbibition. n > 90 seeds. (B–C, E–F) Collet hair formation in ccc1 is rescued on media with a higher osmolarity. n > 9 plants for 450 mM treatments, >30 plants for all other treatments. Scale bars are 300 µm. Germination and collet hair assays with mannitol, sorbitol, and NaCl were performed together and therefore share the same control (0 mM). (G–H) The slower rate of root hair elongation in ccc1 is rescued when grown in media with 150 mM mannitol (see Videos 3–6). Under control conditions, between 50 and 100 min after initiation, wildtype roots hairs elongated at a rate of 0.88 ± 0.27 µm min–1 compared with a rate of 0.47 ± 0.08 µm min–1 in ccc1.
-
Figure 4—source data 1
Data analysed and presented in Figure 4 and supplement.
- https://cdn.elifesciences.org/articles/70701/elife-70701-fig4-data1-v3.xlsx
Figure 4—figure supplement 1
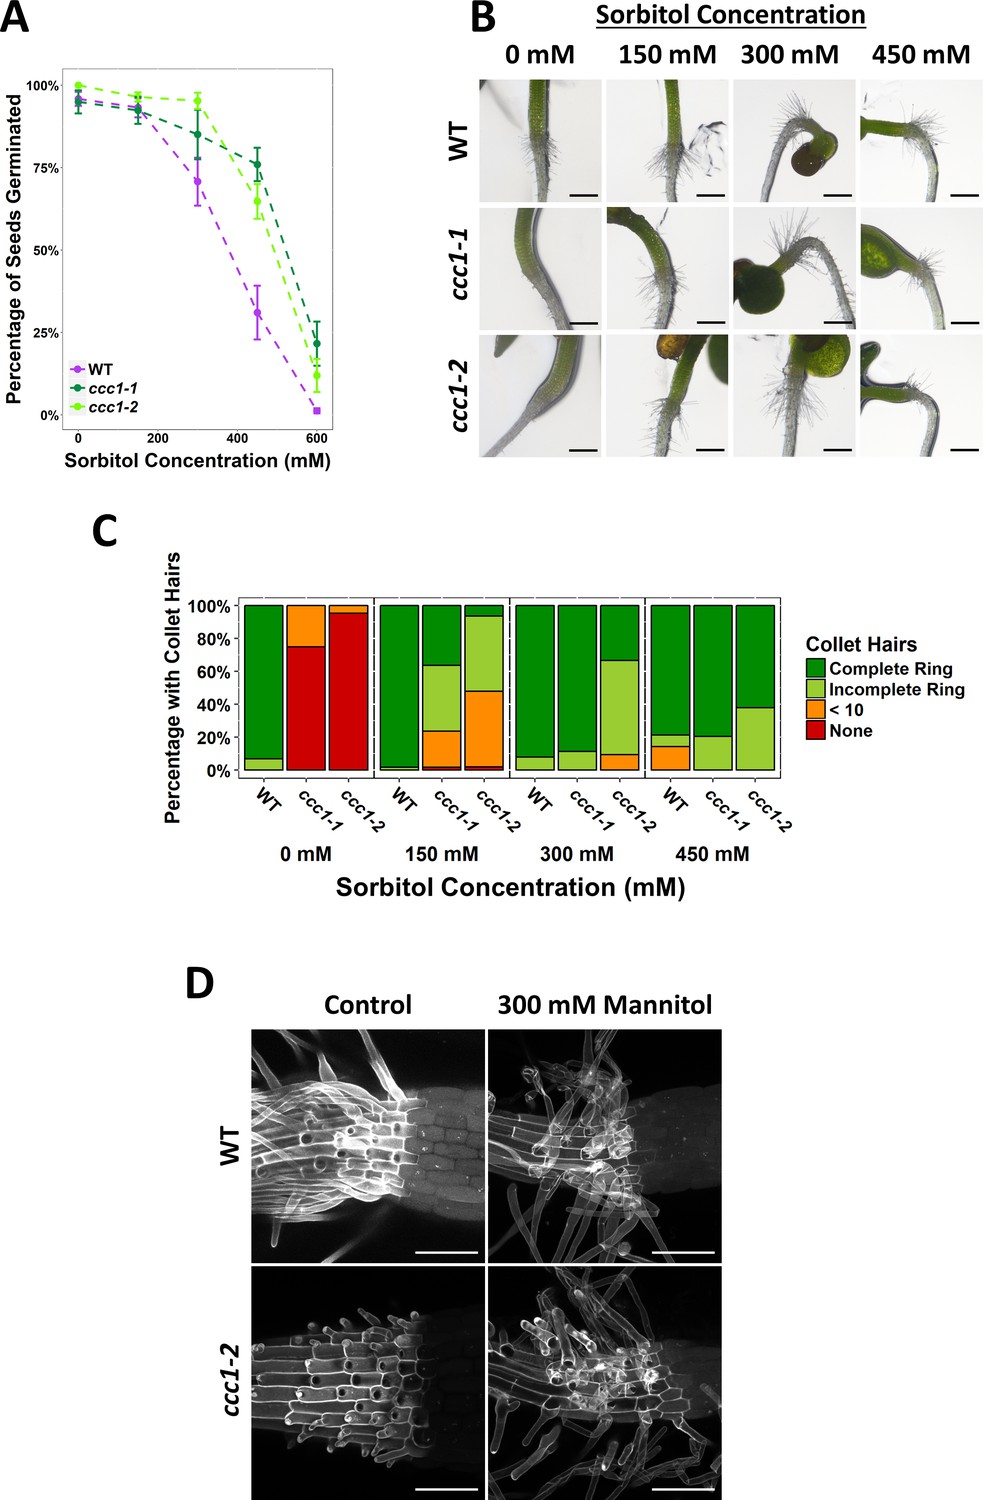
Germination of ccc1 seeds is tolerant to osmotic stress imposed by sorbitol and ccc1 root hair elongation is rescued on sorbitol.
(A) A higher percentage of ccc1 seeds germinate on media with a higher osmolarity, adjusted with sorbitol. The number of germinated seeds assessed 6 days after imbibition. n > 90. (B) Collet hair formation in ccc1 is rescued on media with a higher osmolarity. n > 9 plants for 450 mM treatments, >30 plants for all other treatments. Scale bars are 300 µm. Germination and collet hair assays with mannitol, sorbitol, and NaCl were performed together and therefore share the same control (0 mM). (D) Collet hair initiation sites are visible below the hypocotyl in ccc1 roots. Elongation of collet hairs is rescued when grown under hyperosmotic conditions. Images are maximum intensity projections of cell wall autofluorescence (white) taken between the root and hypocotyl. Scale bars are 100 µm.
Figure 5
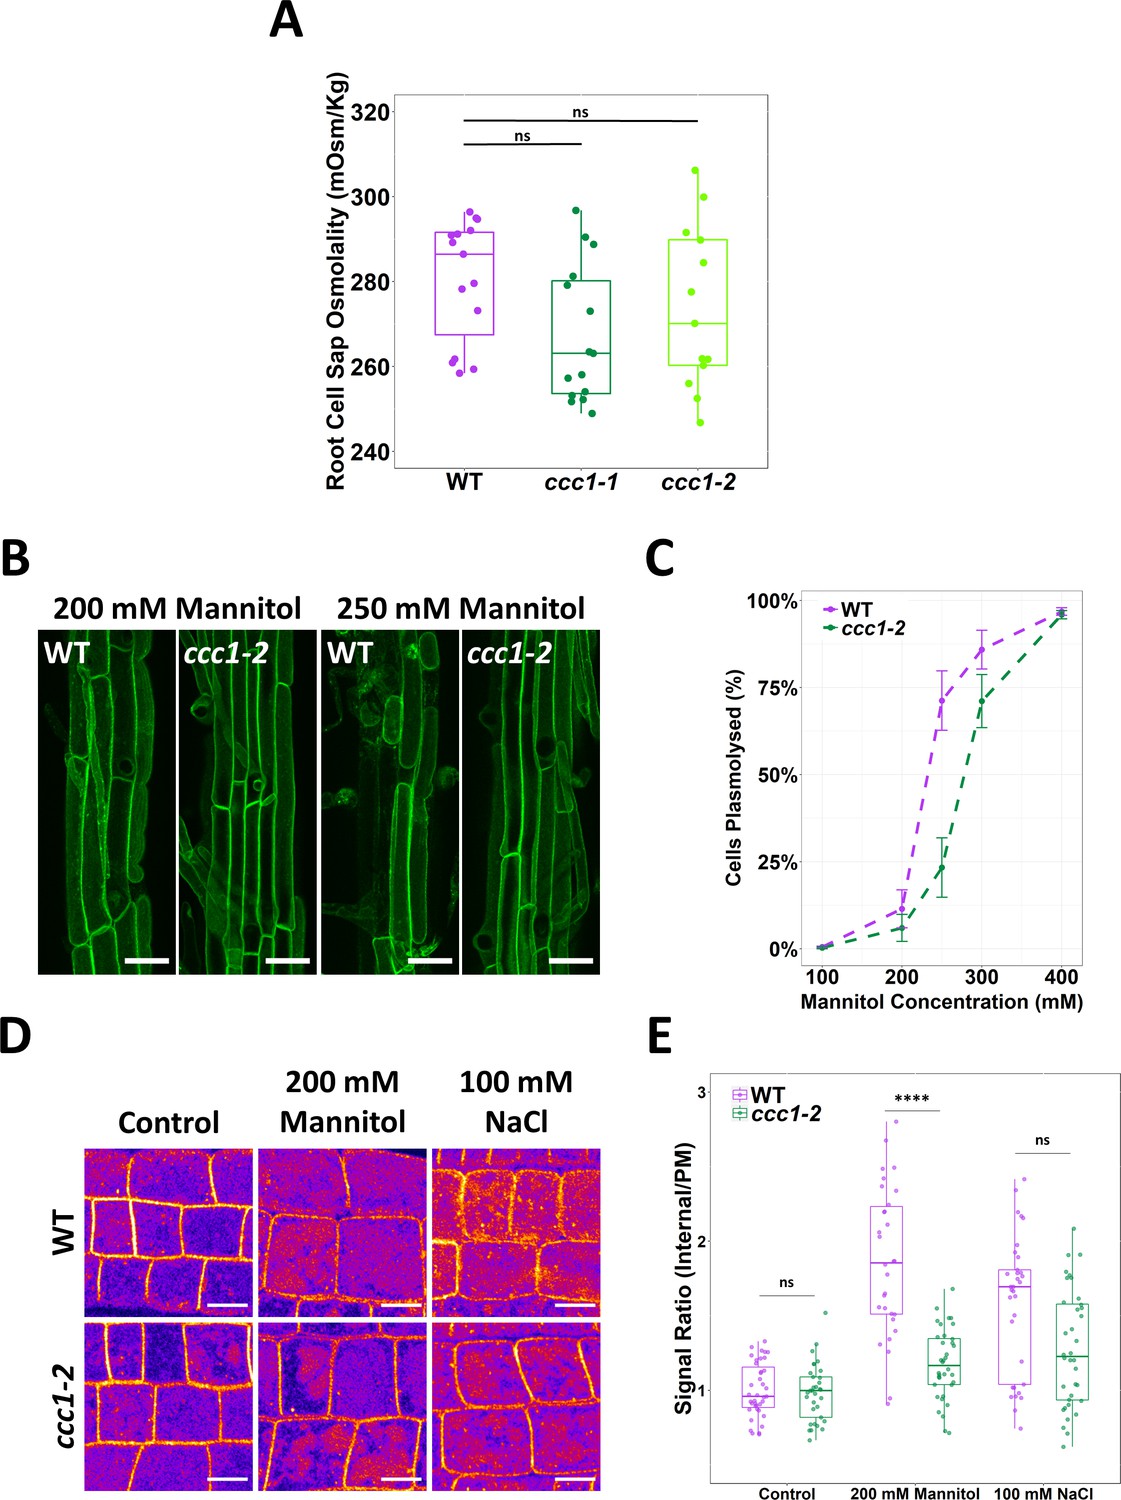
ccc1 root cells do not have a higher osmolality but are more tolerant to plasmolysis.
(A) The cell sap osmolality of whole root fluid was measured using a freeze point osmometer; no difference between wildtype and ccc1 cell sap osmolality was found. n = 13–15. (B–C) ccc1 root epidermal cells require a higher external mannitol concentration to induce incipient plasmolysis. Plasmolysed and non-plasmolysed cells were counted 1 hr after treatment. The plasma membrane (PM) of cells was visualised with the PM marker, GFP-LIT6b (green). Forty cells were assessed per plant, 12 plants were counted for each genotype/treatment. Scale bars are 40 µM. (D–E) The internalisation of PIP2;1-GFP in response to osmotic (200 mM mannitol) and salt (100 mM NaCl) shock treatment was assayed in root epidermal cells of the elongation zone. ccc1 has a reduced PIP2;1-GFP internalisation after osmotic shock as compared to wildtype. Plants were imaged 30 min after treatment. A signal ratio of internal and PM signal was used to measure internalisation. Data presented relative to wildtype control. n > 45. Scale bars are 10 µM. Boxplot shows range; median, first and third quartile are indicated. One-way ANOVA used to determine p. **** indicates p < 0.0001.
-
Figure 5—source data 1
Data analysed and presented in Figure 5.
- https://cdn.elifesciences.org/articles/70701/elife-70701-fig5-data1-v3.xlsx
Figure 6 with 1 supplement
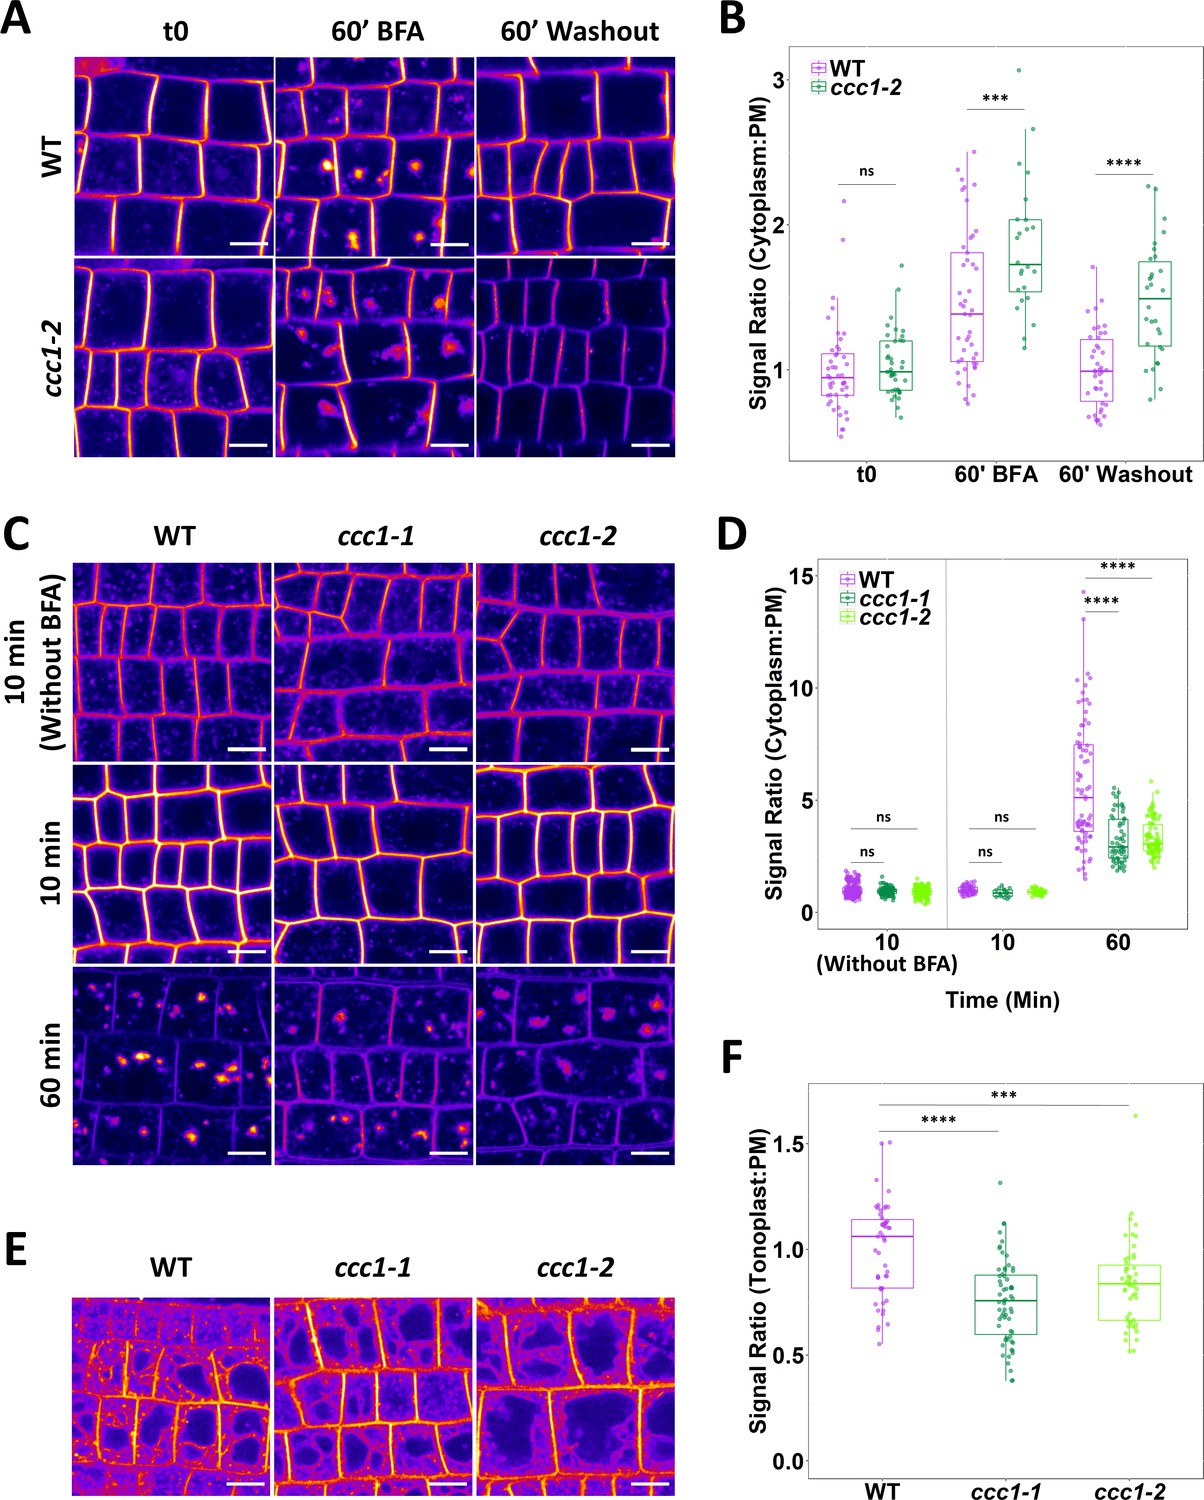
Loss of CCC1 leads to defects in exocytosis and endocytic trafficking.
(A–B) ccc1 root epidermal cells show a reduced recovery of PIN2-GFP cytoplasm:PM signal ratio after a 60 min treatment with 25 µM brefeldin A (BFA). n > 24 cells, 3 cells measured per plant. (C–D) Endocytic trafficking of the membrane dye FM4-64 (red), measured as an increase in the cytoplasm:PM ratio, is reduced in ccc1 lines while endocytosis, measured with a separate set of experiments without the use of BFA, was unchanged in ccc1. Plants were kept in 25 µM BFA for the duration of the experiment. n > 56 cells of >9 plants. (E–F) Trafficking of FM4-64 to the vacuole in the absence of BFA, measured as an increase of the tonoplast:PM signal ratio, is reduced in ccc1 lines. n > 51 cells of >18 plants. Boxplots show range; median, first and third quartile are indicated. Points represent individual measurements. All images are single representative optical sections. All data presented relative to wildtype under control conditions. One-way ANOVA used to determine p. *** indicates p < 0.001, **** indicates p < 0.0001. All scale bars are 10 µm.
-
Figure 6—source data 1
Data analysed and presented in Figure 6 and supplement.
- https://cdn.elifesciences.org/articles/70701/elife-70701-fig6-data1-v3.xlsx
Figure 6—figure supplement 1
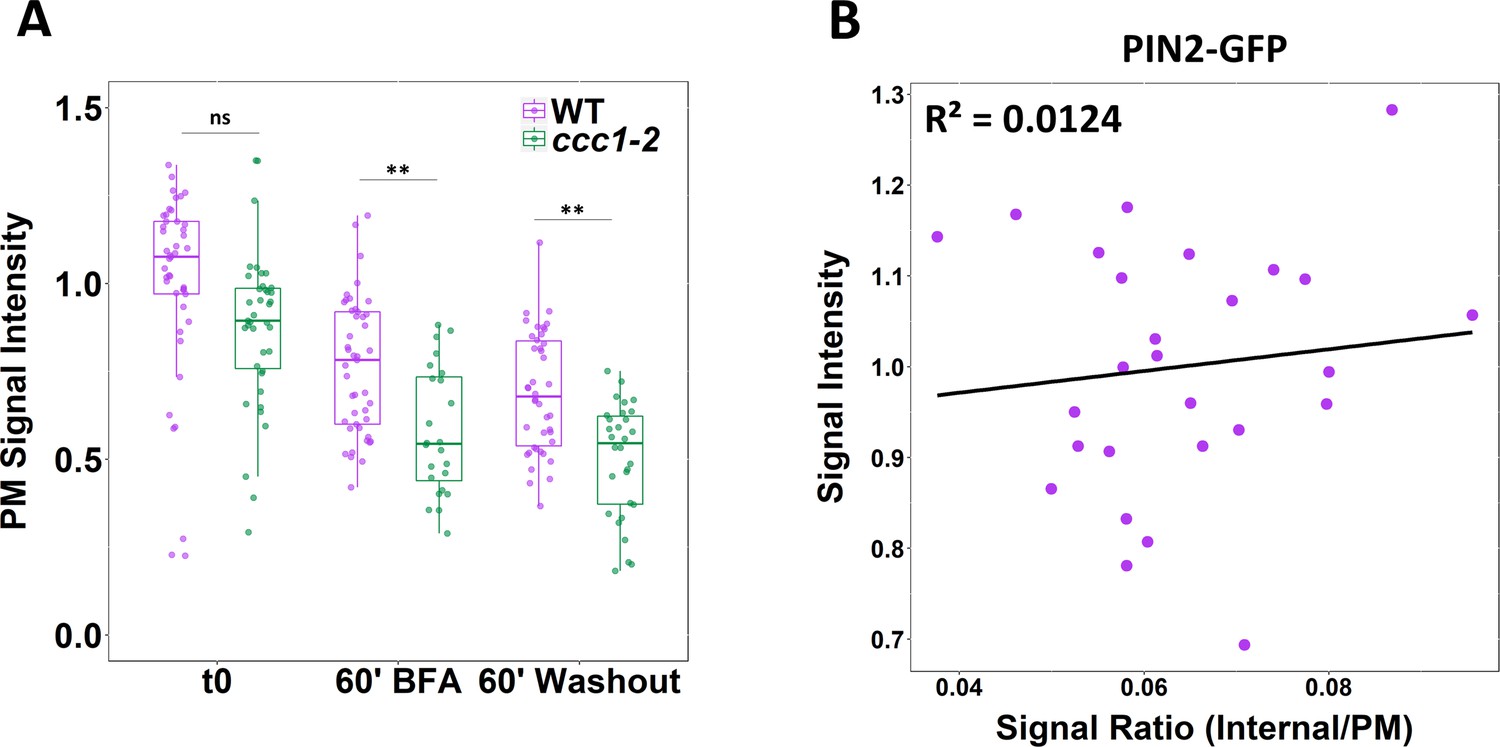
PIN2-GFP fluorescence on the plasma membrane (PM) is lower in ccc1 and trafficking defects in ccc1 are not pre-trans-Golgi-network/early endosome (TGN/EE).
(A) The average fluorescence of PIN2-GFP at the PM on the basal side of root epidermal cells (displayed in Figure 6A) is lower in ccc1 cells. (B) The total fluorescence of markers used for trafficking assays does not correlate with the signal ratio. Plot displays total fluorescence and signal ratio of PIN2-GFP from wildtype plants, under the t0 treatment, from a single repetition of the experiment. Treatments and genotypes are not mixed to prevent the artificial creation of correlation. Boxplot shows range; median, first and third quartile are indicated. One-way ANOVA used to determine p. * indicates p < 0.05, ** indicates p < 0.01.
Figure 7 with 3 supplements
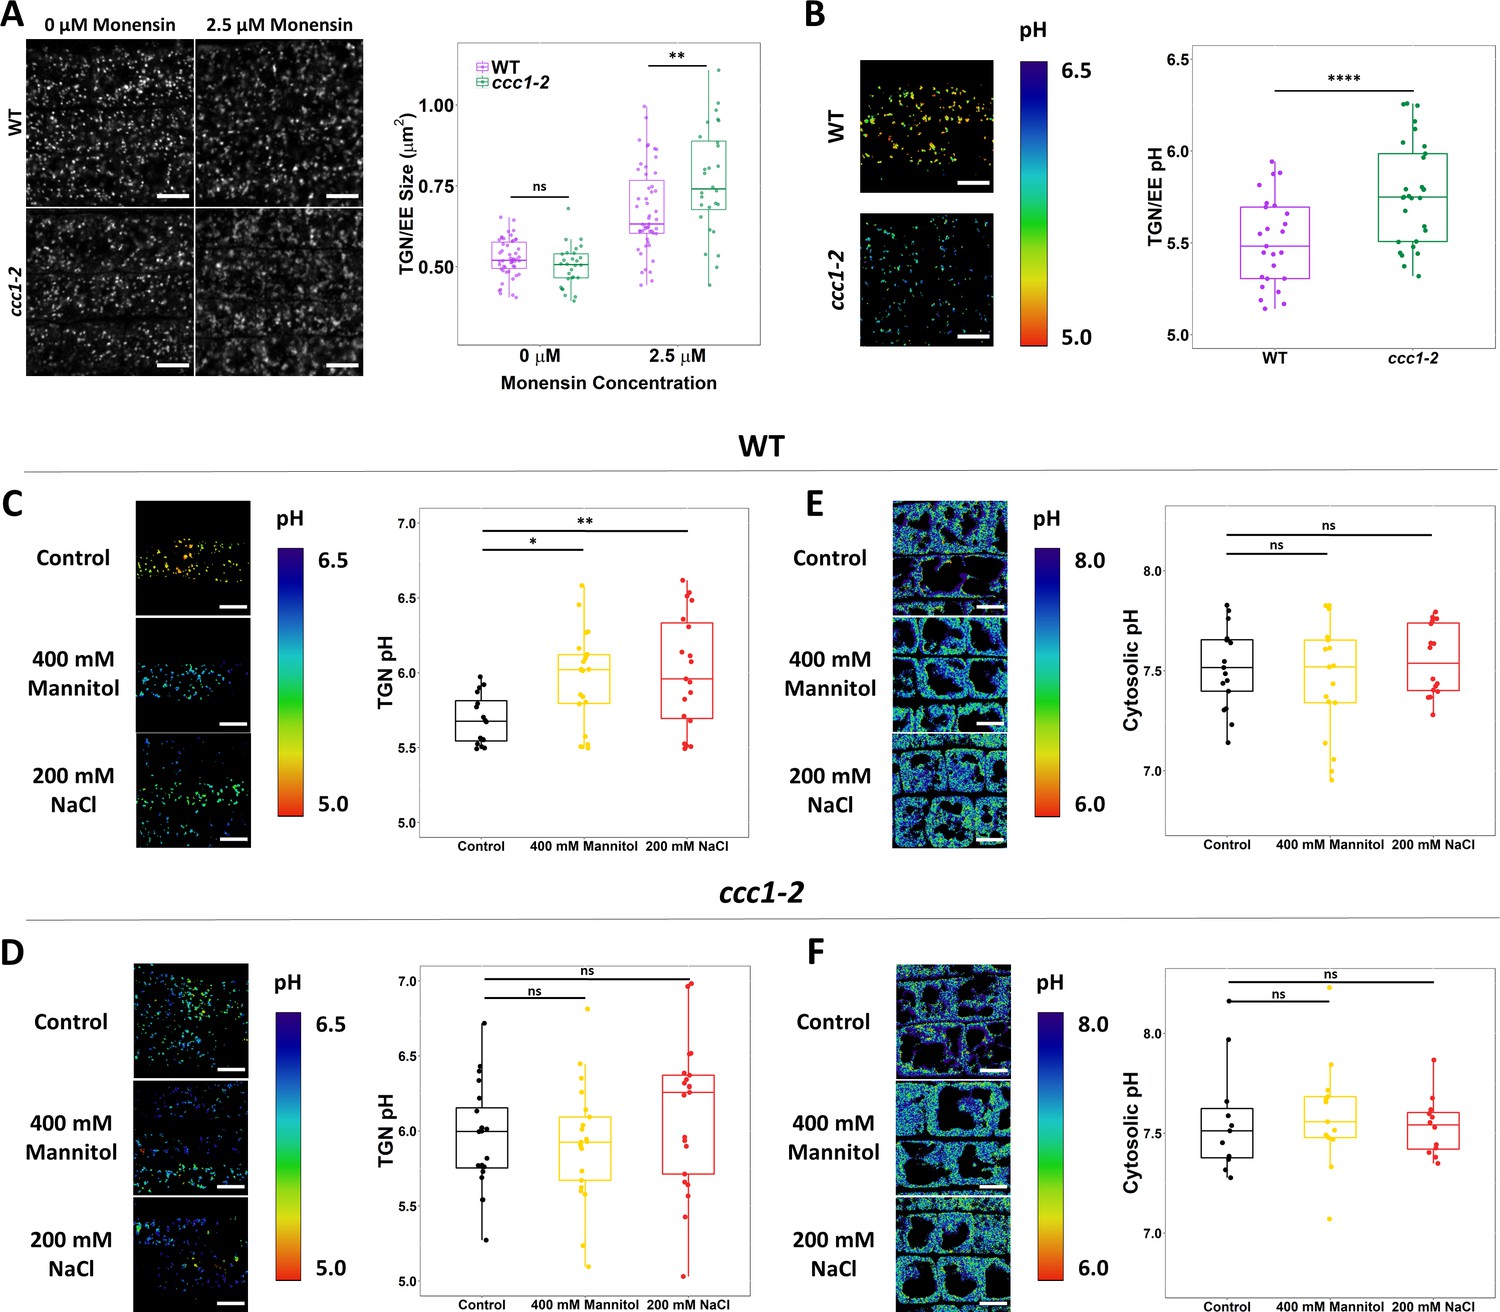
CCC1 is required for regulation of trans-Golgi-network/early endosome (TGN/EE) luminal conditions and luminal pH change in response to osmotic shock.
(A) Osmotically induced TGN/EE swelling due to cation influx is more severe in ccc1 epidermal root cells after 15 min of treatment with 2.5 µM monensin. TGN/EE are visualised through stable expression of VHAa1-RFP (white) in wildtype and ccc1 backgrounds. n > 28 plants. Scale bars are 10 µm. Images are single representative optical sections. (B–D) Stable expression of the TGN/EE lumen pH sensor pHusion in wildtype and ccc1 backgrounds. (C) The pH of ccc1 TGN/EE is 0.3 pH units higher compared to wildtype in root epidermal cells. n > 26. (D) The pH of wildtype TGN/EE increased by 0.3 in response to 15 min treatments with 400 mM mannitol and 200 mM NaCl. n > 16. (E) The same treatments resulted in no change to the pH of ccc1 TGN/EE. n > 16. (E–F) Stable expression of the cytosolic pH sensor pHGFP in wildtype and ccc1 backgrounds. There is no significant pH difference between the two genotypes in root epidermal cells. The cytosolic pH of both (E) wildtype and (F) ccc1 was unchanged in response to osmotic and salt shock. n > 13. pH with both sensors was calculated using calibration curves performed with each set of experiments. Images show the ratio of GFP/RFP of the pH sensor SYP61-pHusion in the TGN/EE lumen and emission ratio for the pHGFP cytosolic sensor as a colour range, using the inverted ‘physics’ look-up table in ImageJ. Scale bars are 10 µm. Calibration curves for pH sensors displayed in Figure 7—figure supplement 2. Boxplots show range; median, first and third quartile are indicated. Points represent individual measurements. One-way ANOVA used to determine p. * indicates p < 0.05, ** indicates p < 0.01, **** indicates p < 0.0001.
-
Figure 7—source data 1
Data analysed and presented in Figure 7 and supplements.
- https://cdn.elifesciences.org/articles/70701/elife-70701-fig7-data1-v3.xlsx
Figure 7—figure supplement 1
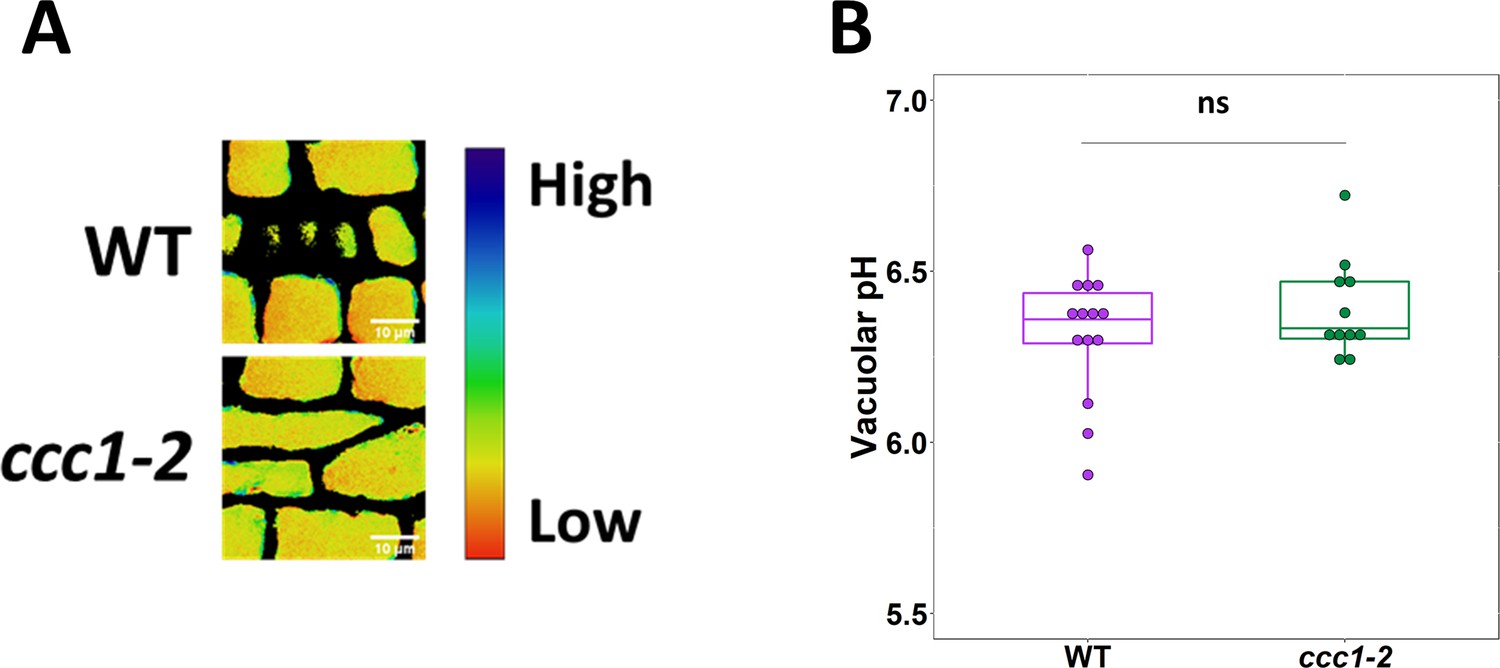
Loss of CCC1 does not impact vacuolar pH.
(A–B) The pH of ccc1 vacuoles is similar to wildtype in root epidermal cells, measured using the dye BCECF. Images show the emission ratio of the two BCECF excitations which were used to measure pH. n > 11 plants. Scale bars are 10 µm. Boxplot shows range excluding outliers; median and first and third quartile are indicated. Points represent individual measurements. Student’s t-tests comparing ccc1 to wildtype. * indicates p < 0.05.
Figure 7—figure supplement 2
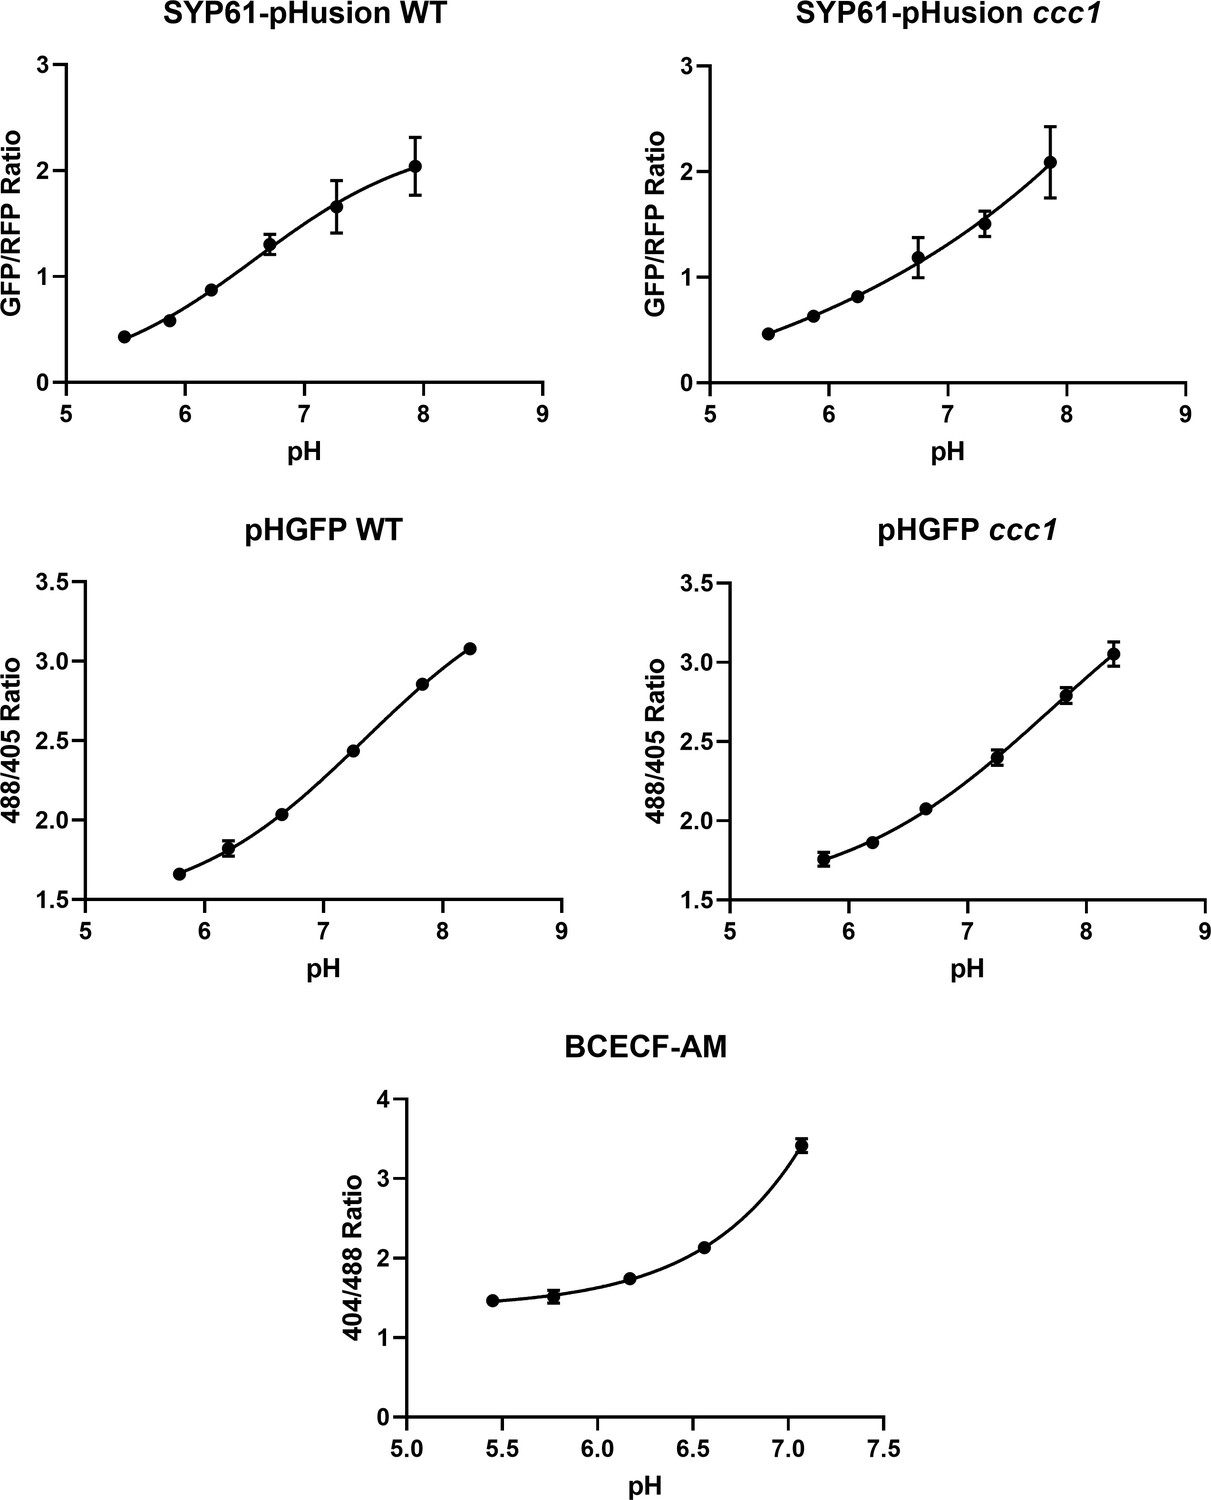
Calibration curves of SYP61-pHusion, pHGFP, and BCECF-AM.
Calibrations were performed in epidermal root cells of the elongation zone. Error bars not displayed are smaller than the points. n = 6 plants.
Figure 7—figure supplement 3
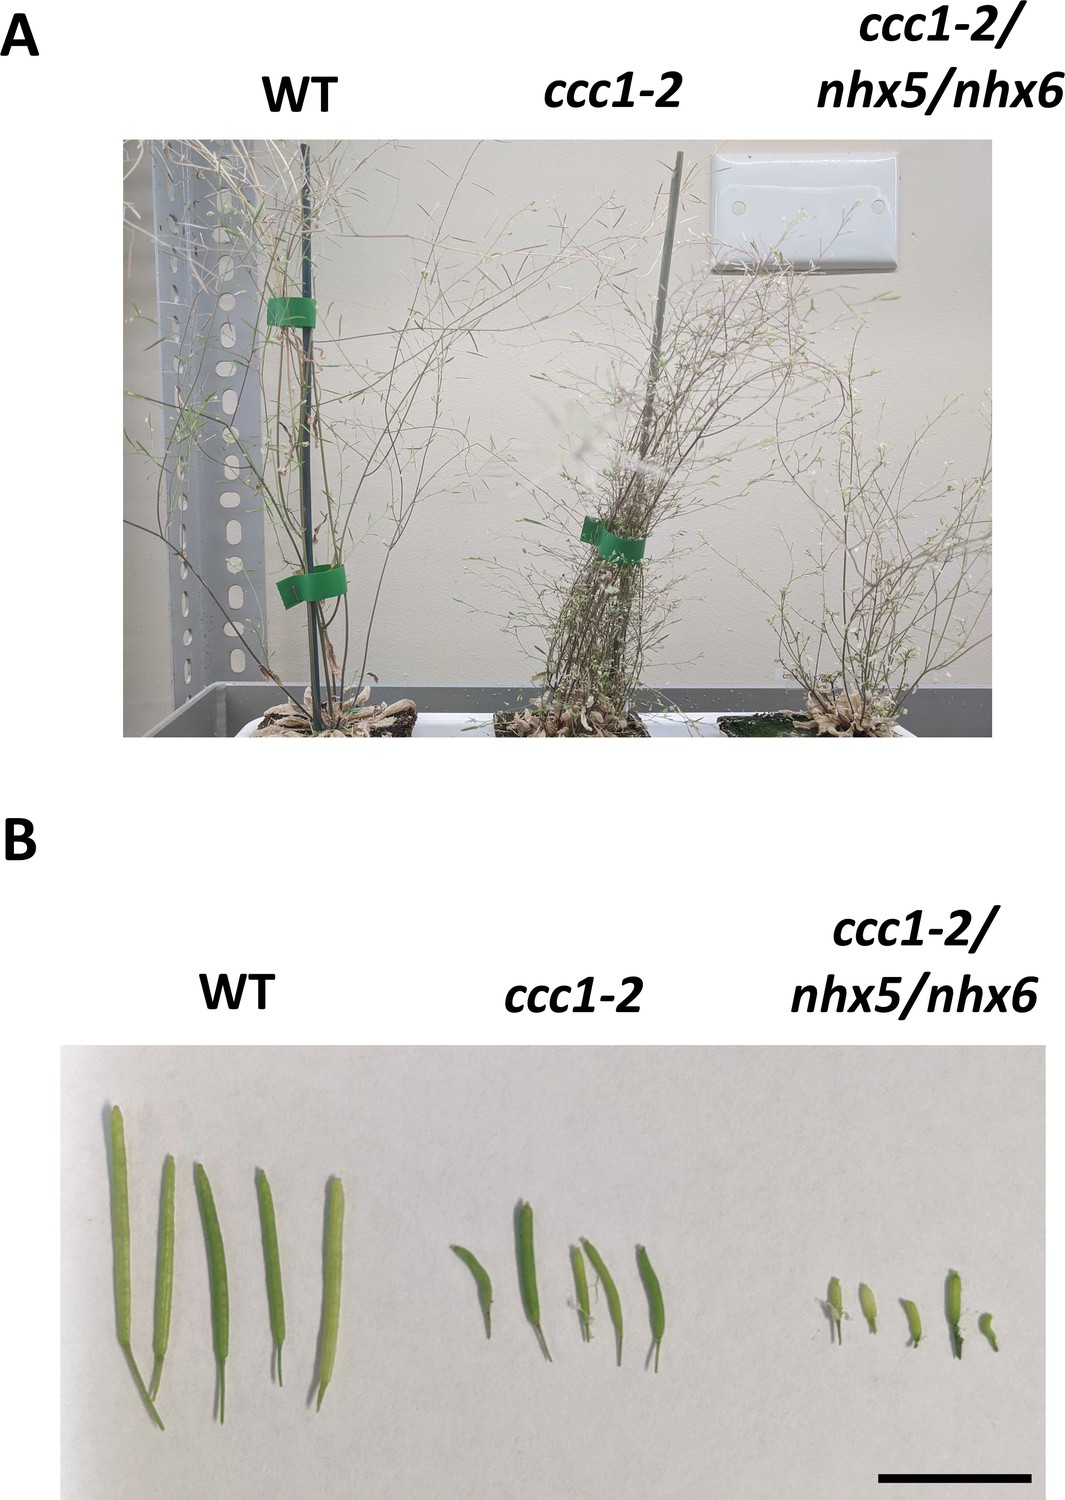
ccc1/nhx5/nhx6 produce no viable seeds.
A single ccc1/nhx5/nhx6 triple mutant was recovered. (A) The plant was smaller than both wildtype and ccc1-2 and (B) produced no viable seeds. Scale bar is 10 mm.
Figure 8

Proposed model of ion and pH regulation in the trans-Golgi-network/early endosome (TGN/EE).
The V-H+-ATPase proton pump, the cation-proton exchangers NHX5 and NHX6, and the anion-proton exchanger CLCd are important for acidification and fine-tuning of the pH regulation in the TGN/EE lumen. CCC1 provides a cation and anion efflux mechanism, completing the regulatory transport circuit.
Videos
Video 1
Time-lapse showing movement of GFP-CCC1 labelled subcellular compartments in a root hair.
GFP-CCC1 localises to motile intracellular organelles, expression driven with EXP7 promoter. Time series of the root hair was taken through the centre plane of the root hair. 20 s shown per second at 10 frames per second.
Video 2
Time-lapse showing movement of GFP-CCC1 labelled subcellular compartments in a root epidermal cell.
GFP-CCC1 localises to motile intracellular organelles, expression driven with EXP7 promoter. Time series was imaged below the radial plasma membrane (PM). 20 s shown per second at 10 frames per second.
Video 3
Wildtype control.Time-lapse of root hair elongation.
48 min shown per second at 24 frames per second. See also Figure 4G.
Video 4
ccc1 control Time-lapse of root hair elongation.
ccc1 root hairs elongate slower than wildtype under control conditions. 48 min shown per second at 24 frames per second. See also Figure 4G.
Video 5
Wildtype 150 mM mannitol.Time-lapse of root hair elongation.
48 min shown per second at 24 frames per second. See also Figure 4H.
Video 6
ccc1 150 mM mannitol.Time-lapse of root hair elongation.
While ccc1 root hairs elongate slower than wildtype under control conditions they elongate at the same speed as wildtype when grown on media containing 150 mM mannitol. 48 min shown per second at 24 frames per second. See also Figure 4.
Additional files
-
Supplementary file 1
Supplementary information.
(a) Experimental approaches taken to detect subcellular localisation of CCC1 protein. (b) Strategies to isolate a double ccc1-2 det3 or a triple ccc1-2 nhx5-2 nhx6-3 mutant
- https://cdn.elifesciences.org/articles/70701/elife-70701-supp1-v3.docx
-
Transparent reporting form
- https://cdn.elifesciences.org/articles/70701/elife-70701-transrepform1-v3.docx
Download links
A two-part list of links to download the article, or parts of the article, in various formats.
Downloads (link to download the article as PDF)
Open citations (links to open the citations from this article in various online reference manager services)
Cite this article (links to download the citations from this article in formats compatible with various reference manager tools)
Plant Trans-Golgi Network/Early Endosome pH regulation requires Cation Chloride Cotransporter (CCC1)
eLife 11:e70701.
https://doi.org/10.7554/eLife.70701


