Elevated FBXO45 promotes liver tumorigenesis through enhancing IGF2BP1 ubiquitination and subsequent PLK1 upregulation
- Key Laboratory of Hepatobiliary and Pancreatic Surgery, Institute of Hepatobiliary Surgery, Southwest Hospital, Third Military Medical University (Army Medical University), China
Figures
Figure 1 with 1 supplement
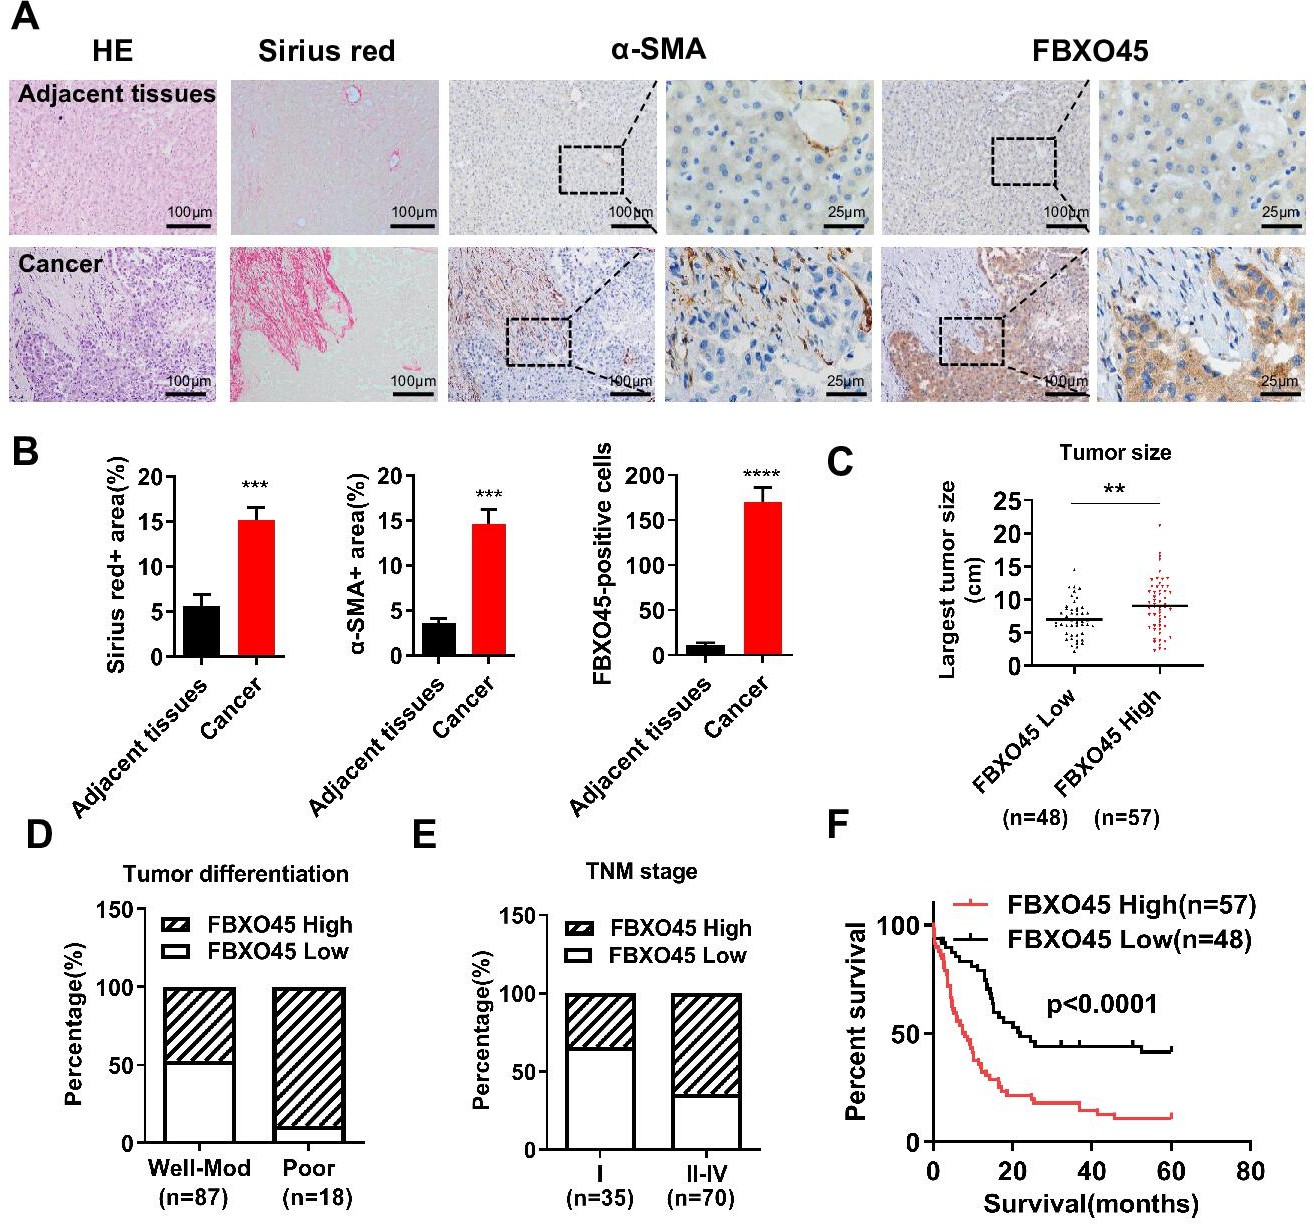
FBXO45 is associated with poor survival in HCC patients.
(A, B) Tissue sections of HCC and matched adjacent tissues from patients were subjected to HE staining, Sirius red staining, or IHC staining for ɑ-SMA and FBXO45. Representative images are shown (A). The proportions of Sirius red-positive, ɑ-SMA-positive, and FBXO45-positive areas were quantified (B). Data are represented as the mean± SEM, n=5, ***p≤0.001, ****p≤0.0001. (C–E) The relationships between FBXO45 protein expression and tumor size (C), tumor differentiation (D), and TNM stage (E) were evaluated. (F) The association between the FBXO45 protein expression and overall survival of HCC patients was determined. Data are represented as the mean± SEM, **p≤0.01. HCC, hepatocellular carcinoma.Figure 1—source data 1 for A; Figure 1—source data 2 for B.
-
Figure 1—source data 1
Clinical and pathological data from HCC patient.
HCC, hepatocellular carcinoma.
- https://cdn.elifesciences.org/articles/70715/elife-70715-fig1-data1-v2.xlsx
-
Figure 1—source data 2
FBXO45 is associated with poor survival in HCC patients.
HCC, hepatocellular carcinoma.
- https://cdn.elifesciences.org/articles/70715/elife-70715-fig1-data2-v2.xls
Figure 1—figure supplement 1
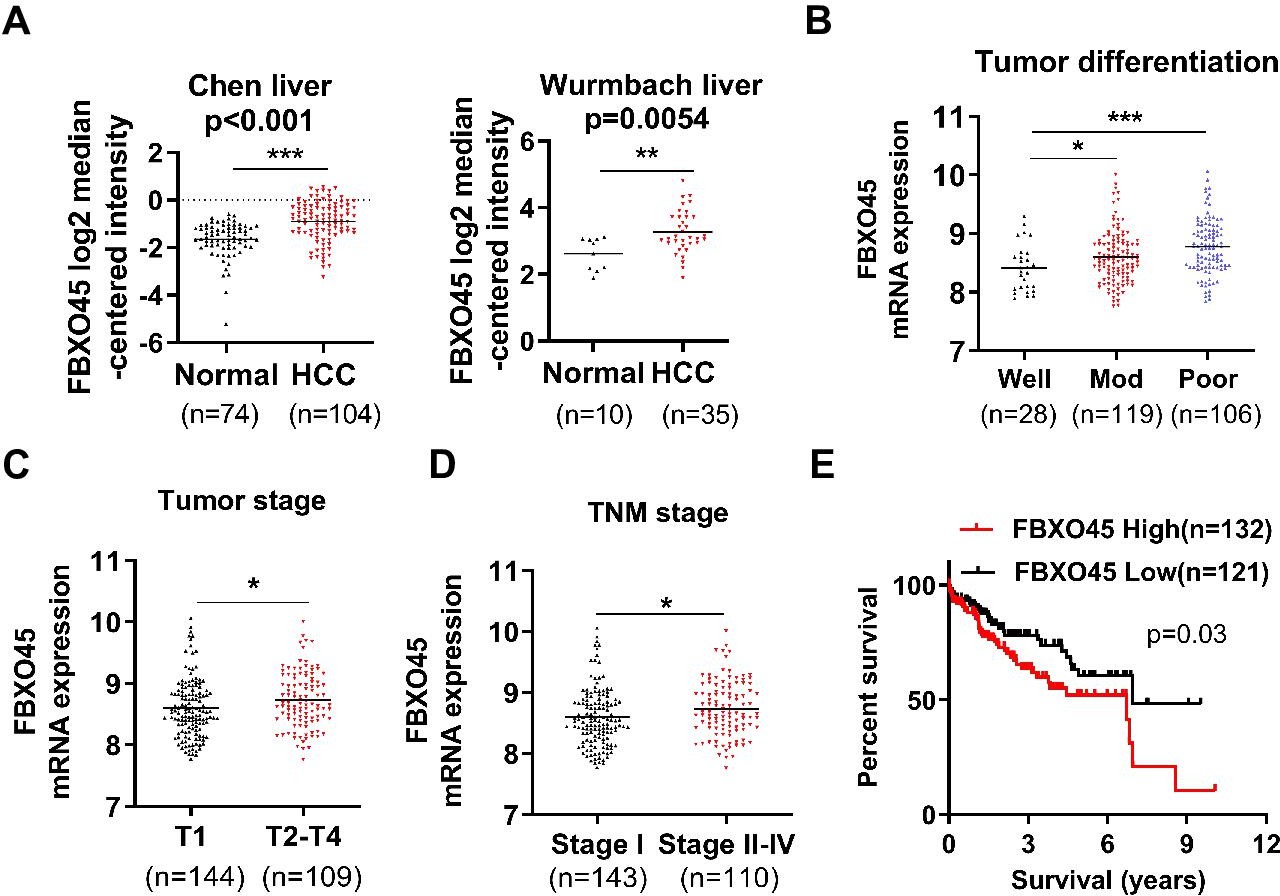
FBXO45 mRNA level is associated with poor survival in HCC patients.
(A) The FBXO45 mRNA level was elevated in liver tumors. Data are from the studies by Chen et al., 2002; Wurmbach et al., 2007. (B–D) Data for a total of 253 patients with HCC were downloaded from the TCGA database. The relationships between the transcription of FBXO45 and tumor differentiation (B), tumor stage (C), or TNM stage (D) were analyzed. (E) The association between FBXO45 mRNA expression and overall survival in 253 HCC patients was evaluated. *p≤0.05, **p≤0.01, ***p≤0.001. HCC, hepatocellular carcinoma; TCGA, The Cancer Genome Atlas.
Figure 2 with 1 supplement
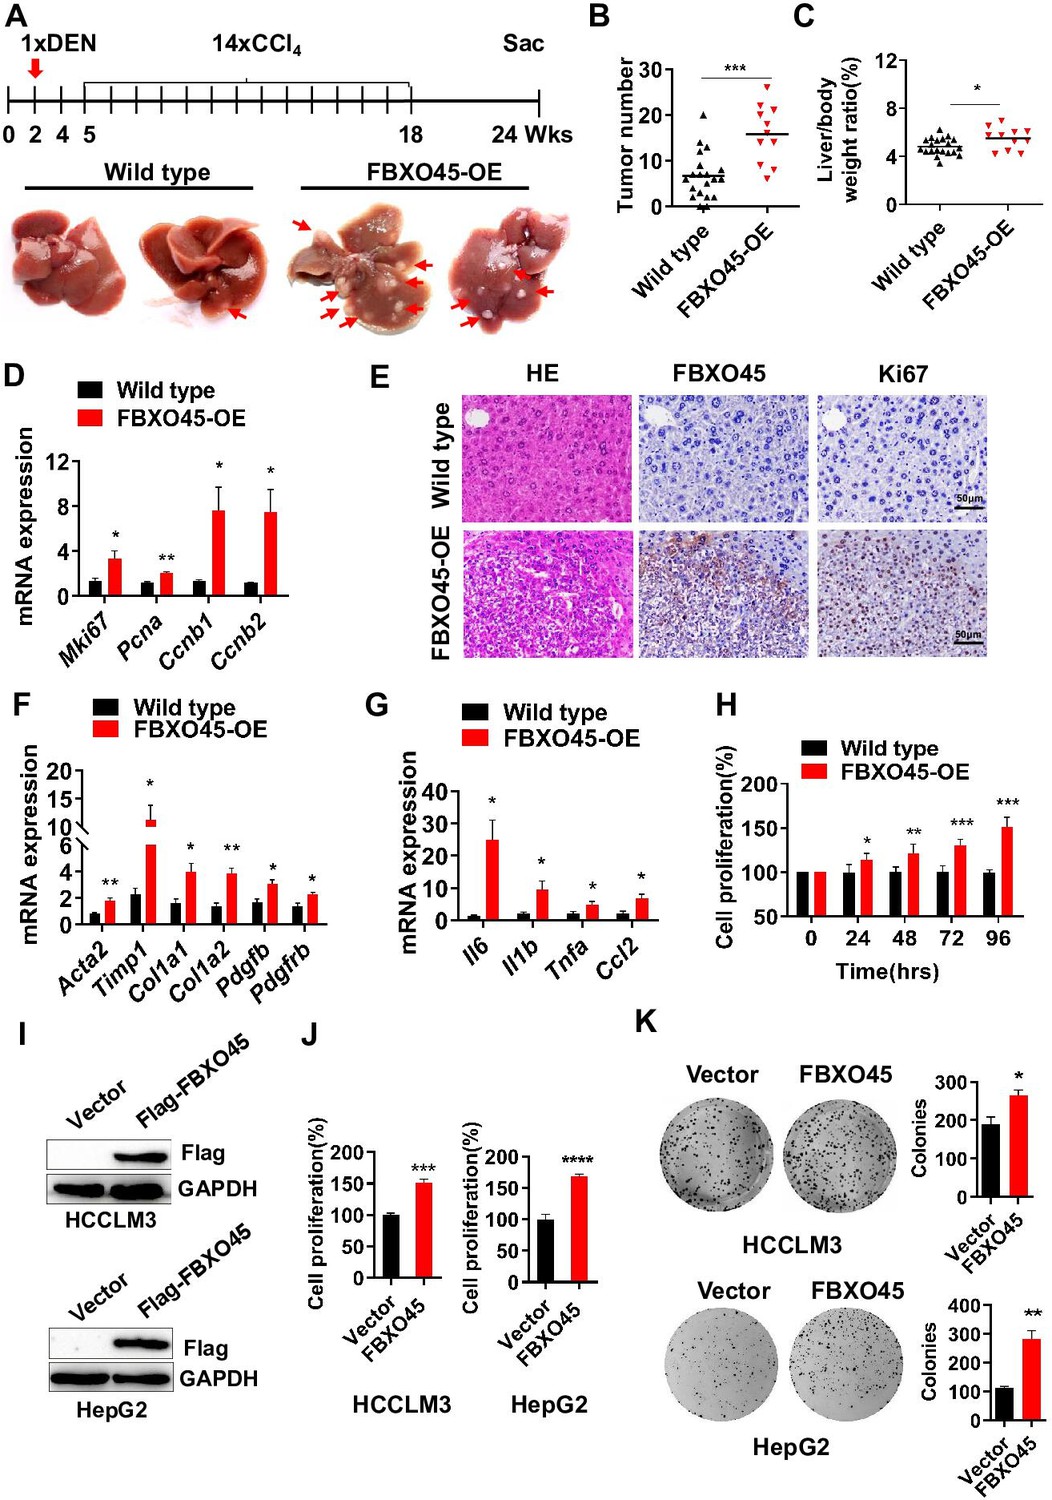
FBXO45 promotes hepatocarcinogenesis in mice.
(A–C) FBXO45-OE (n=11) and wild-type (n=20) male mice were injected with DEN at the age of 2 weeks, followed by 14 injections of CCl4; the mice were sacrificed at 24 weeks of age. Representative images (A), tumor number (B), and the liver/body weight ratio (C) are shown. Arrows indicate tumors; *p≤0.05, ***p≤0.001. (D–G) Mice were treated as described for (A–C). The transcription of proliferation-related genes (Mki67, Pcna, Ccnb1, and Ccnb2) (D), fibrotic genes (Acta2, Timp1, Col1a1, Col1a2, Pdgfb, and Pdgfrb) (F), and inflammatory markers (Il6, Il1b, Tnfa, and Ccl2) (G) in whole-liver tissues was assessed by qPCR. An IHC staining assay with the indicated antibodies was shown (E). Data are represented as the mean± SEM, n=6, *p≤0.05, **p≤0.01, ***p≤0.001. (H) The primary cells were isolated from different tumors from different mice. FBXO45-OE primary hepatocytes grew faster than wild-type cells in a time-dependent manner. Data are represented as the mean± SEM, n=5, *p≤0.05, **p≤0.01, ***p≤0.001. (I–K) HCCLM3 and HepG2 cells were transfected with an empty vector or Flag-FBXO45 plasmids for 48 hr. A portion of cells were reseeded into 96-well plates and cell proliferation was analyzed by a CCK-8 assay after 48 h. (J) The other portion of cells were plated into six-well plates and colonies counted after 9–13 days. (K) Data are represented as the mean± SEM, n=6 (J), n=3 (K). *p≤0.05, **p≤0.01, ***p≤0.001, ****p≤0.0001. Figure 2—source data 1 for B, C, D, F, G, H, J and K.
-
Figure 2—source data 1
FBXO45 promotes hepatocarcinogenesis in mice.
- https://cdn.elifesciences.org/articles/70715/elife-70715-fig2-data1-v2.xls
Figure 2—figure supplement 1
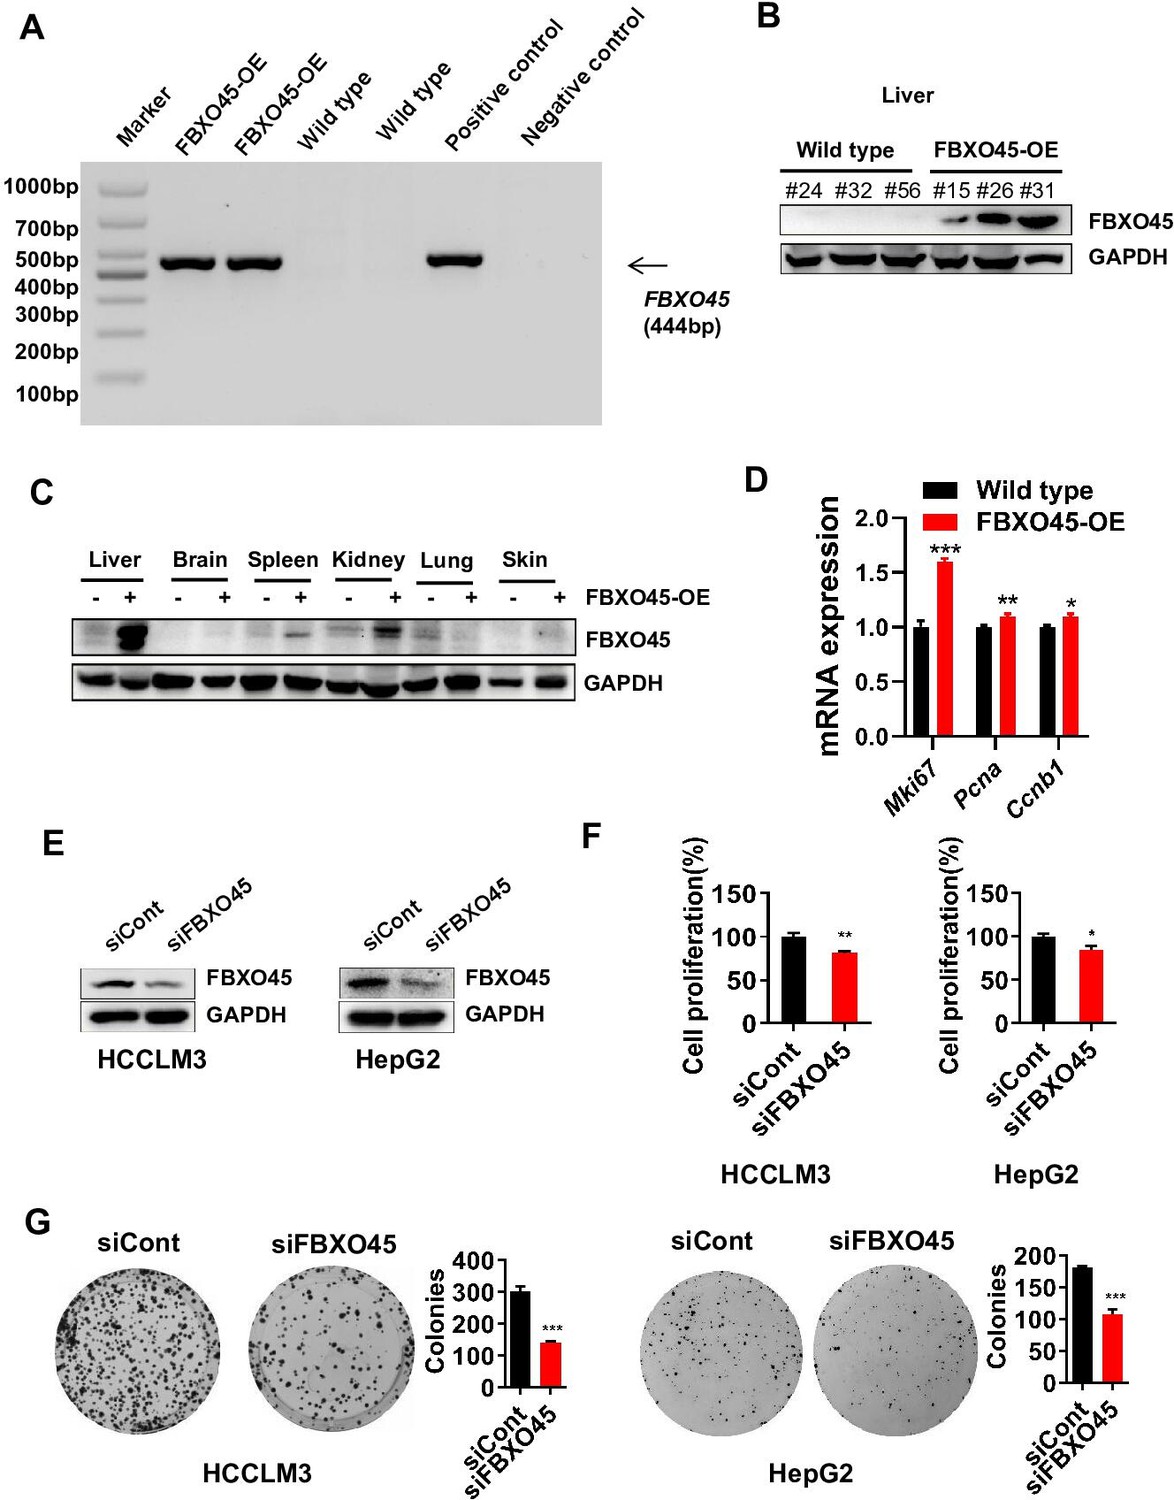
FBXO45 silencing inhibits the proliferation of HCC cells.
(A–C) The detection of the FBXO45 expression in FBXO45-OE and wild-type mice by PCR genotyping in liver (A) and Western blot analysis in different tissues (B, C). (D) Comparison of the proliferation markers Mki67, Pcna, and Ccnb1 in wild-type and FBXO45-OE primary hepatocytes is shown. (E–G) HCCLM3 or HepG2 cells were transfected with siControl or siRNA targeting FBXO45 (siFBXO45) for 48 hr. siRNA knockdown efficiency was analyzed by Western blot analysis (E). Cell proliferation was analyzed by a CCK-8 assay (F) and colony formation assay (G). Data are represented as the mean± SEM; n=3 (D, G), n=6 (F). *p≤0.05, **p≤0.01, ***p≤0.001. HCC, hepatocellular carcinoma. Figure 2—figure supplement 1—source data 1 for D, F and G.
-
Figure 2—figure supplement 1—source data 1
FBXO45 silencing inhibits the proliferation of HCC cells.
HCC, hepatocellular carcinoma.
- https://cdn.elifesciences.org/articles/70715/elife-70715-fig2-figsupp1-data1-v2.xls
Figure 3 with 2 supplements
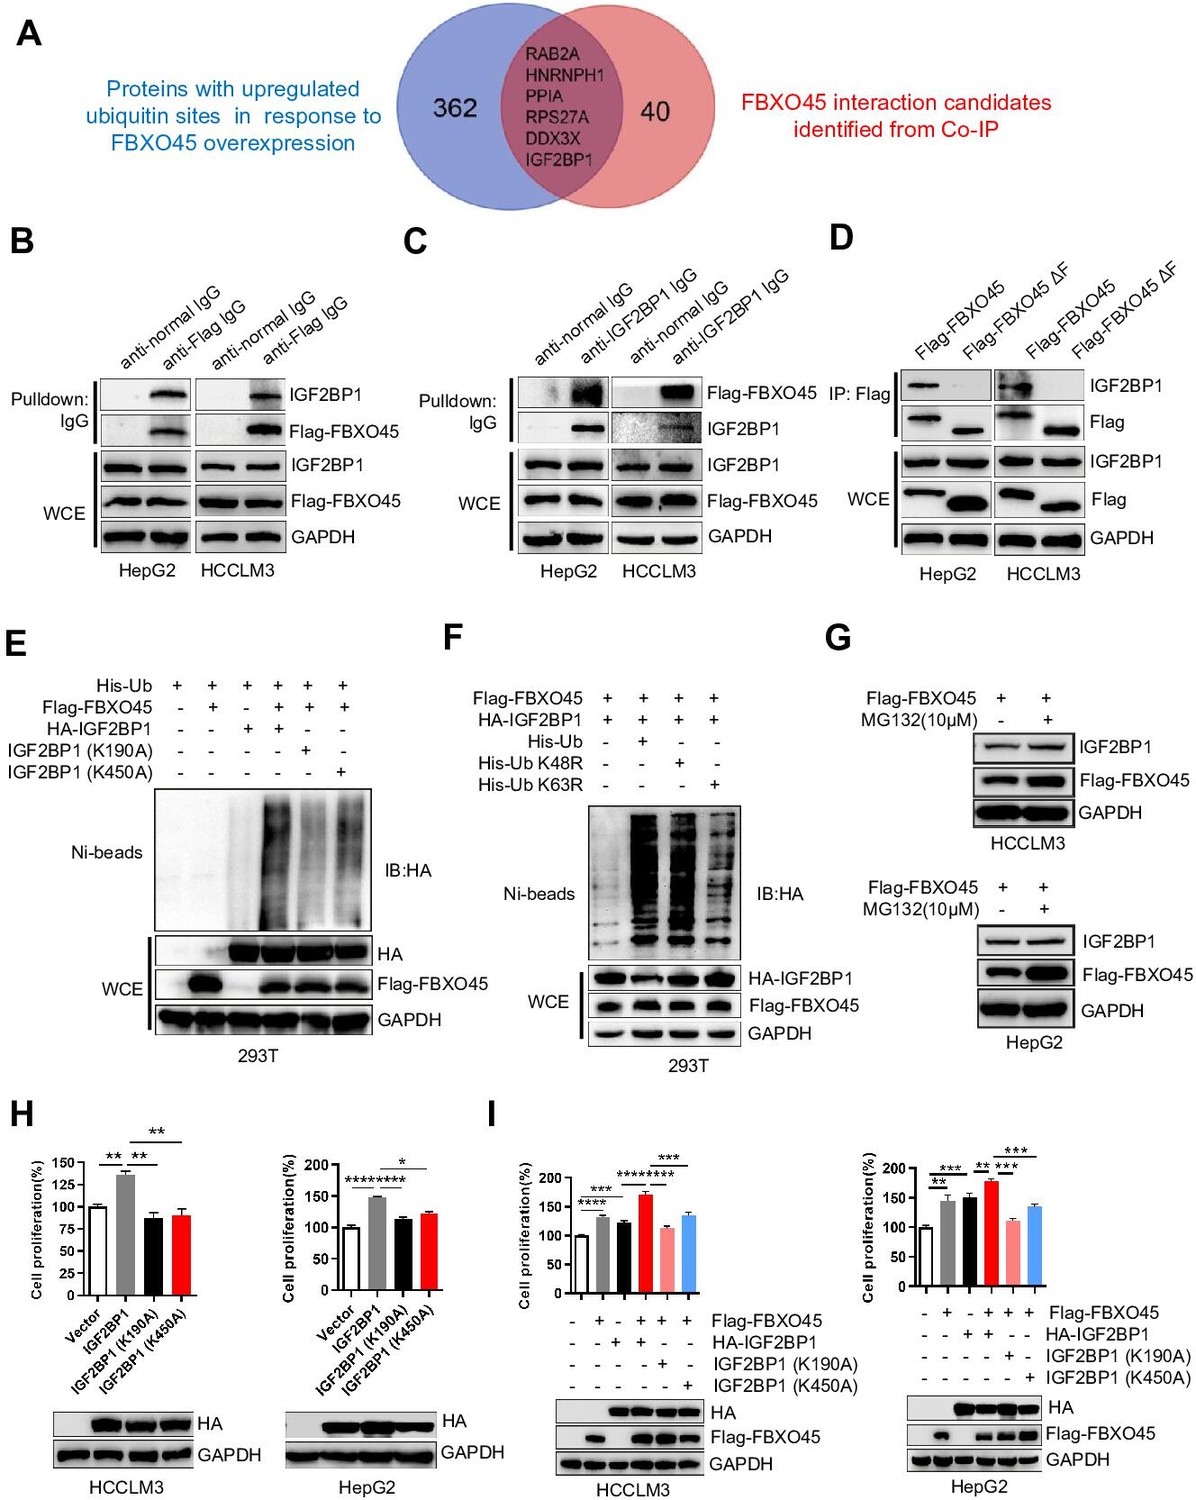
FBXO45 promotes polyubiquitination at the Lys190 and Lys450 sites and subsequent activation of IGF2BP1.
(A) The Venn diagram shows the number of proteins with upregulated ubiquitin sites identified in response to FBXO45 overexpression (blue), FBXO45 interaction candidates identified by Co-IP and mass spectrometry (red), and overlapping proteins in the datasets. (B, C) FBXO45 bound to endogenous IGF2BP1. HepG2 and HCCLM3 cells were transfected with Flag-FBXO45 plasmids for 48 hr and then lysed. The cell lysates were added to the indicated antibodies and Protein A/G PLUS-Agarose, followed by Western blot analysis. WCE, whole cell extract. (D) HepG2 and HCCLM3 cells were transfected with Flag-FBXO45 or Flag-FBXO45 ΔF for 48 hr, followed by immunoprecipitation with anti-Flag antibody and Western blot analysis. (E) IGF2BP1 was polyubiquitylated by FBXO45, and K190 or K450 mutation partly blocked this effect. HEK293T cells were transfected with the indicated plasmids, followed by pull-down using Ni-NTA beads or direct Western blot analysis with the indicated antibodies. (F) FBXO45 mediated K63-linked polyubiquitination of IGF2BP1. HEK293T cells were transfected with the FBXO45 and IGF2BP1 plasmids along with WT-ubiquitin or its mutants (K63R and K48R), followed by pull-down with Ni-NTA beads or direct Western blot analysis with the indicated antibodies. (G) HepG2 and HCCLM3 cells were transfected with Flag-FBXO45 for 45 hr and then treated with or without MG132 (10 μM) for 3 hr. Blot shows the expression levels of IGF2BP1. (H) HepG2 and HCCLM3 cells were transfected with wild-type, K190-mutant or K450-mutant IGF2BP1 and subjected to Western blot analysis and a CCK-8 assay. Data are represented as the mean± SEM, n=3 (HCCLM3), n=6 (HepG2), *p≤0.05, **p≤0.01, ****p ≤0.0001. (I) HepG2 and HCCLM3 cells were co-transfected with indicated plasmids for 48 hr, followed by Western blot analysis or CCK-8 assay. Data are represented as the mean± SEM, n=6 (HCCLM3), n=5 (HepG2), **p≤0.01, ***p≤0.001, ****p≤0.0001. Co-IP, coimmunoprecipitation. Figure 3—source data 1 for A; Figure 3—source data 2 for H and I.
-
Figure 3—source data 1
Ubiquitinated proteins and interacted proteins with FBXO45.
- https://cdn.elifesciences.org/articles/70715/elife-70715-fig3-data1-v2.xls
-
Figure 3—source data 2
FBXO45 promotes polyubiquitination at the Lys190 and Lys450 sites and subsequent activation of IGF2BP1.
- https://cdn.elifesciences.org/articles/70715/elife-70715-fig3-data2-v2.xls
Figure 3—figure supplement 1
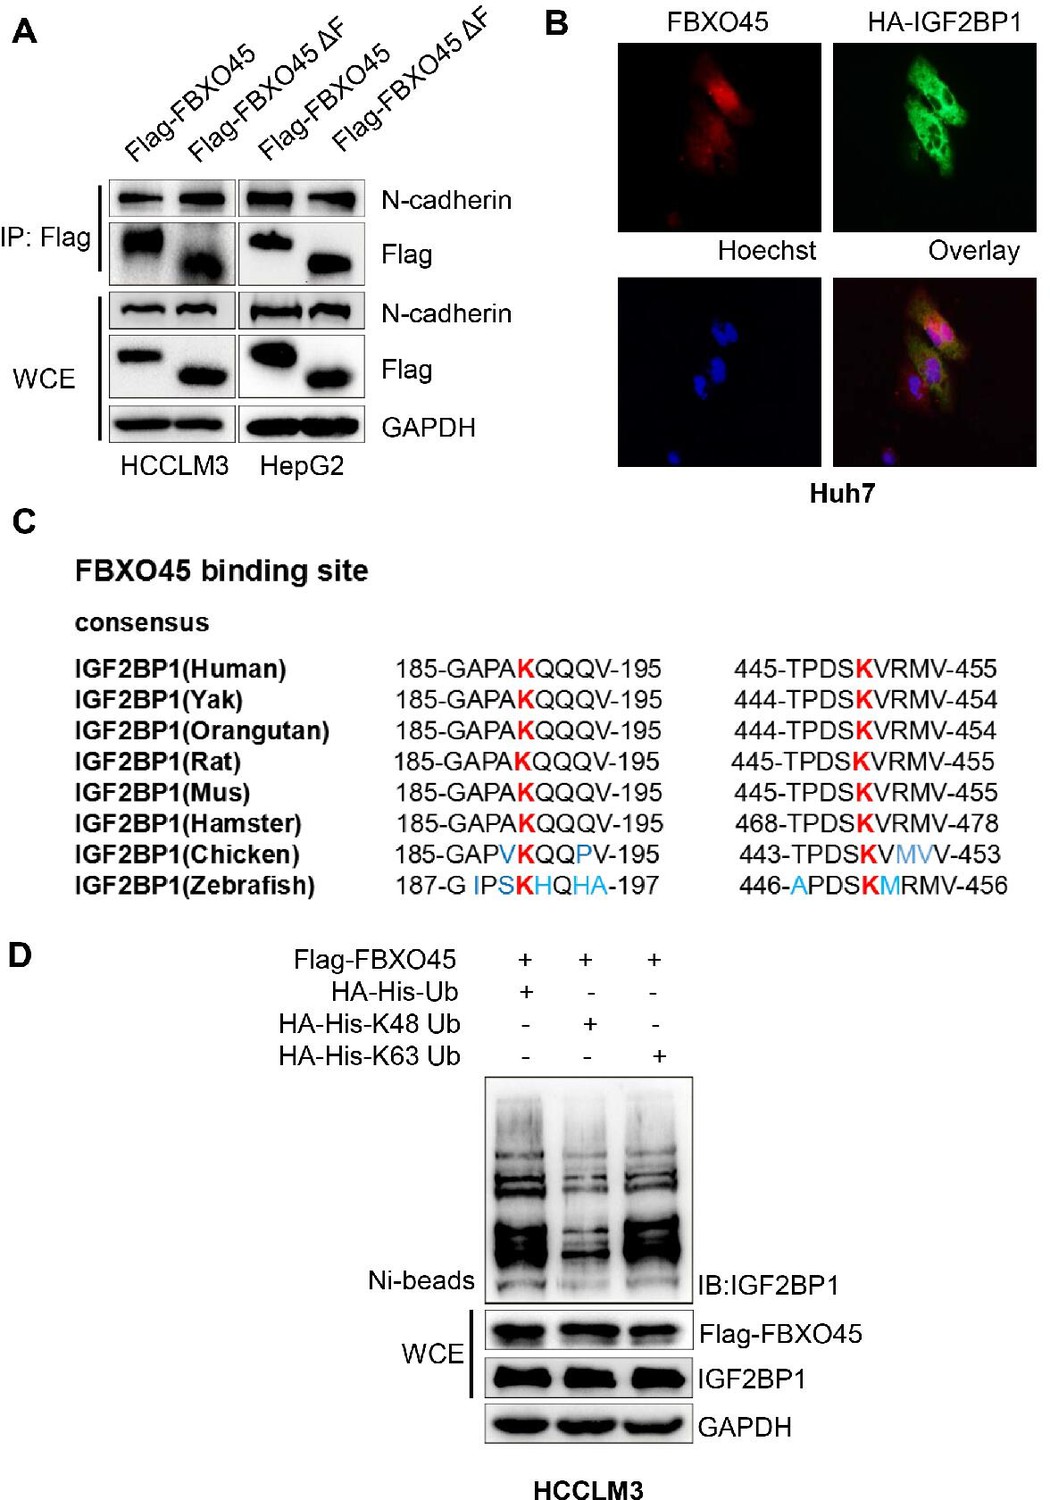
Two sites K190 and K450 in IGF2BP1 are conserved.
(A) HepG2 and HCCLM3 cells were transfected with Flag-FBXO45 or Flag-FBXO45ΔF (FBXO45 without F-box domain) for 48 hr, followed by immunoprecipitation with anti-Flag antibody and Western blot analysis. (B) Huh7 cells were transfected with HA-IGF2BP1 for 48 hr and incubated with antibodies against FBXO45 and HA, and cell nucleus were stained with Hoechst 33342. Representative fluorescence images were shown. (C) Evolutionary conserved FBXO45 binding motif on IGF2BP1. (D) HCCLM3 cells were transfected with the FBXO45 and IGF2BP1 plasmids along with WT-ubiquitin or its mutants (K63 and K48), followed by pull-down with Ni-NTA beads or direct Western blot analysis with the indicated antibodies.
Figure 3—figure supplement 2
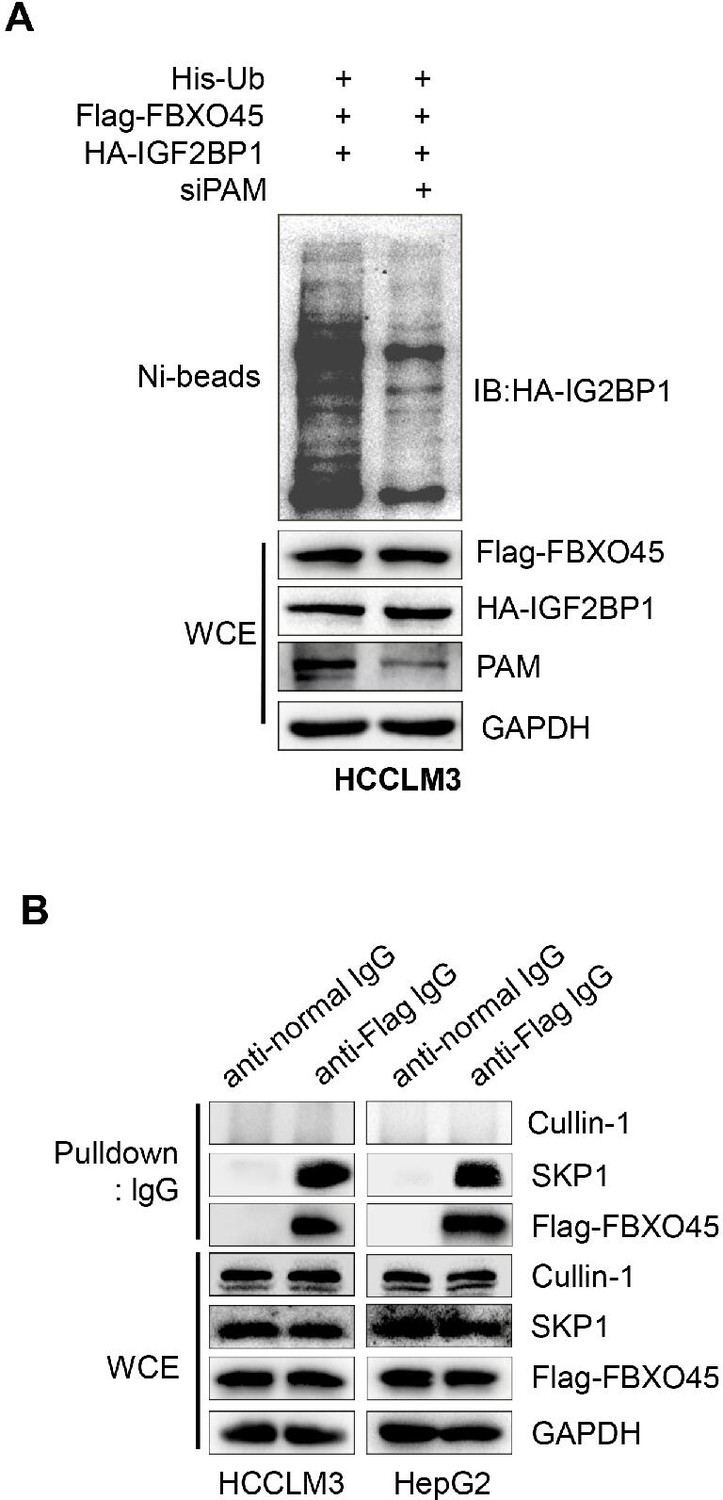
FBXO45 promotes IGF2BP1 polyubiquitination via PAM.
(A) FBXO45 mediated IGF2BP1 ubiquitination requires PAM. HCCLM3 cells were transfected with the indicated plasmids or siRNA targeting PAM for 72 hr, followed by pull-down using Ni-NTA beads or direct Western blot analysis with the indicated antibodies. (B) FBXO45 interacted with SKP1 but not cullin-1. HepG2 and HCCLM3 cells were transfected with Flag-FBXO45 for 72 hr and lysed. The lysates were added Protein A/G PLUS-Agarose with normal lgG or anti-Flag antibody, followed by Western blot analysis. WCE, whole cell extract.
Figure 4 with 1 supplement
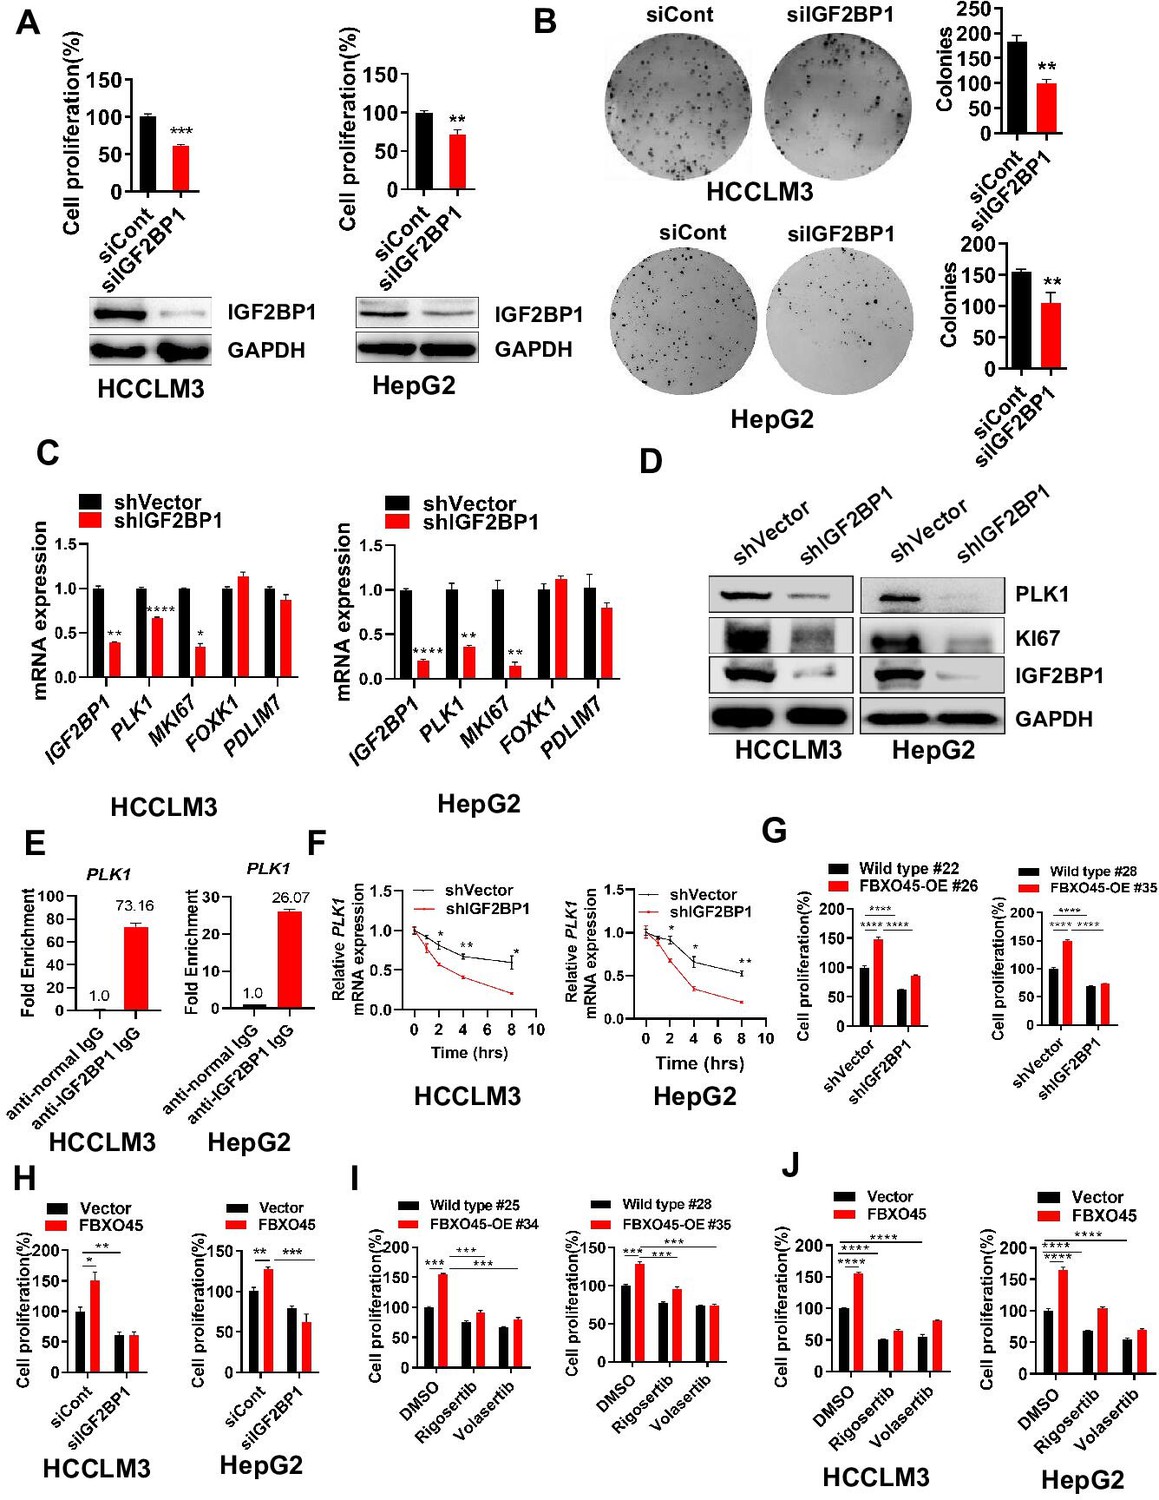
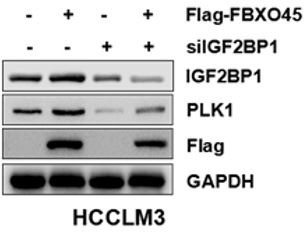
FBXO45 promotes cell proliferation via IGF2BP1-PLK1 axis.
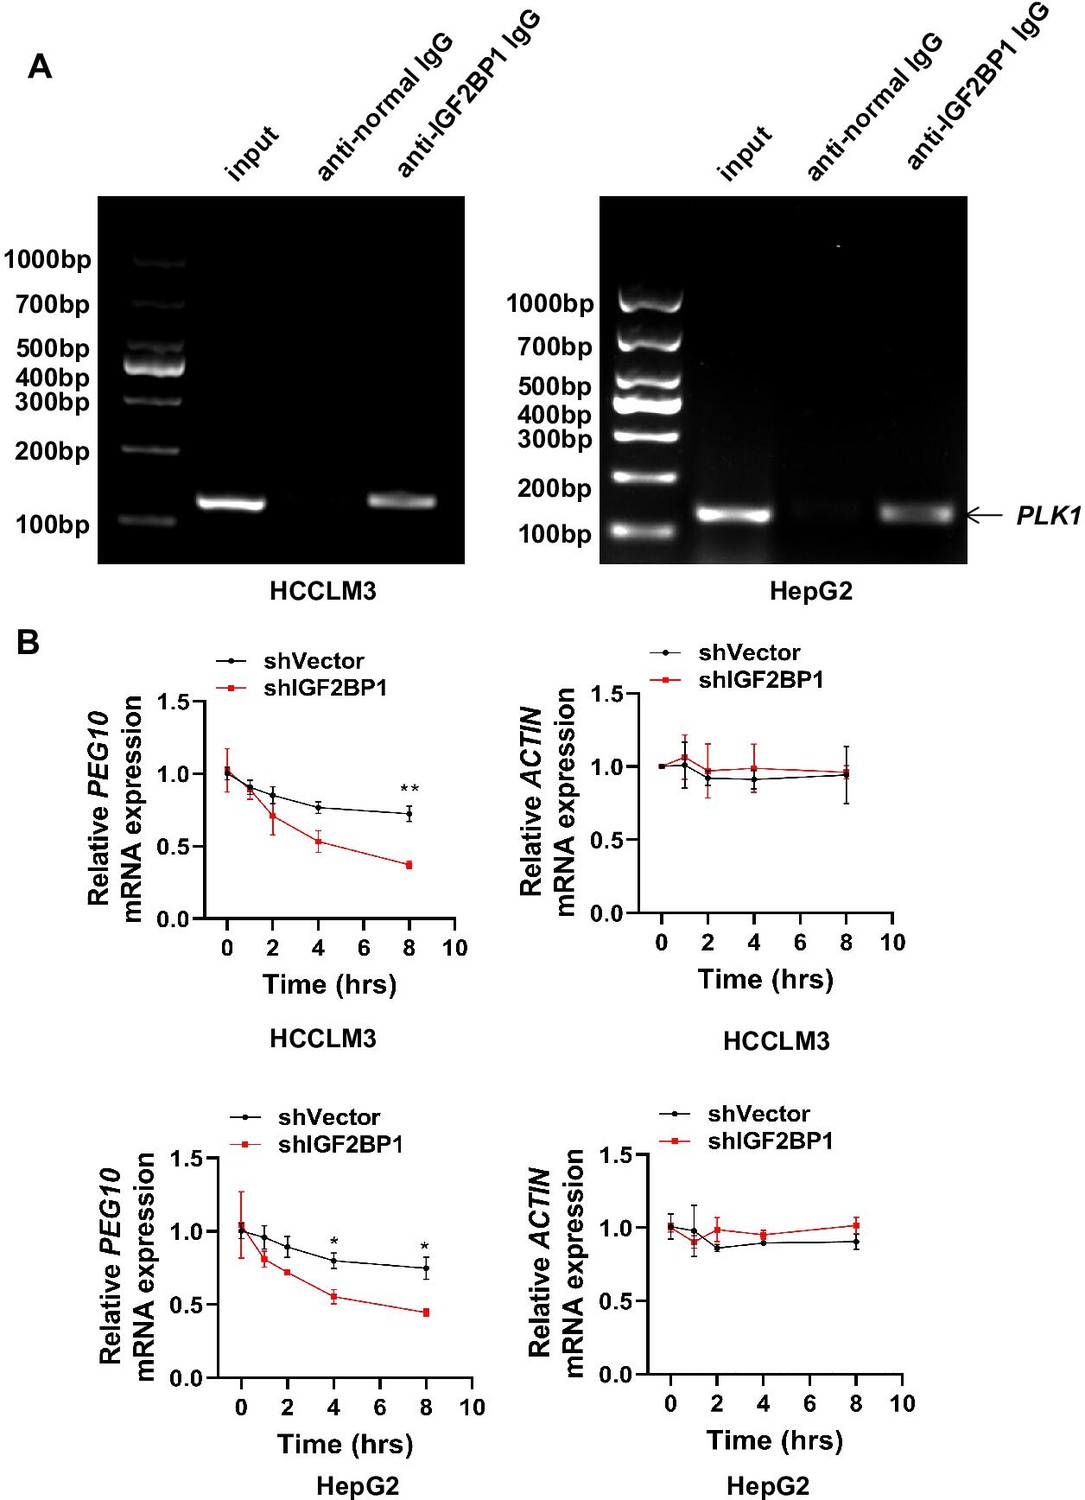
(A, B) HCCLM3 and HepG2 cells were transfected with siControl or siRNA targeting IGF2BP1 (siIGF2BP1) for 48 h. A portion of cells were reseeded into 96-well plates and cell proliferation analyzed by CCK-8 assay after 48 h (A). The other portion of cells were plated into six-well plates and colonies counted after 9–13 days (B). (C, D) Cells were transfected with shVector or shIGF2BP1. Gene and protein expression were analyzed by qPCR (C) and Western blot analysis (D), respectively. (E) RIP-PCR assay showed that IGF2BP1 bound PLK1 mRNA in HepG2 and HCCLM3 cells. Cells were added beads with anti-normal lgG or anti-IGF2BP1 IgG antibody. The purified PLK1 mRNA was analyzed by RT-PCR. (F) HCCLM3 and HepG2 cells were transfected with shVector or shIGF2BP1 and then treated with 10 µg/ml actinomycin D for different time intervals, followed by qPCR (G) The primary cells were isolated from different tumors from different mice. FBXO45-OE and wild-type (WT) primary hepatocytes were transfected with the indicated shVector or shIGF2BP1, followed by analysis of cell proliferation using a CCK-8 assay. (H) HCCLM3 and HepG2 cells were transfected with Flag-FBXO45 alone or in combination with siIGF2BP1 for 48 hr, followed by a CCK-8 assay. (I) FBXO45-OE and WT primary hepatocytes were isolated from different tumors from different mice and treated with PLK1 inhibitors Rigosertib or Volasertib (2 μM) for 48 hr, followed by analysis of cell proliferation using a CCK-8 assay. (J) HCCLM3 and HepG2 cells were transfected with empty vector or Flag-FBXO45 for 24 hr and then exposed to Rigosertib or Volasertib (0.5 μM) for 24 hr, and subjected to a CCK-8 assay. Data are represented as the mean± SEM, n=3 (B, C, E, F), n=4 (A, H-HepG2), n=6 (H-HCCLM3), (G, I, J), *p≤0.05, **p≤0.01, ***p≤0.001, ****p≤0.0001. Figure 4—source data 1 for A, B, C, E, F, G, H, I and J.
-
Figure 4—source data 1
FBXO45 promotes cell proliferation via IGF2BP1-PLK1 axis.
- https://cdn.elifesciences.org/articles/70715/elife-70715-fig4-data1-v2.xls
Figure 4—figure supplement 1
IGF2BP1binds and stabilizes PLK1 mRNA.
(A) The RIP-PCR products gotten by anti-normal IgG or anti-IGF2BP1 lgG pull-down were detected by RT-PCR. IGF2BP1 interacted with PLK1 mRNA. (B) HCCLM3 and HepG2 cells were transfected with shVector or shIGF2BP1 and then treated with 10 µg/ml actinomycin D for different time intervals, followed by qPCR for PEG10 and ACTIN, Data are represented as the mean± SEM, n=3, *p≤0.05, **p≤0.01. Figure 4—figure supplement 1—source data 1 for B.
-
Figure 4—figure supplement 1—source data 1
IGF2BP1binds and stabilizes PLK1 mRNA.
- https://cdn.elifesciences.org/articles/70715/elife-70715-fig4-figsupp1-data1-v2.xls
Figure 5
Interfering IGF2BP1 protects against FBXO45-mediated hepatocarcinogenesis.
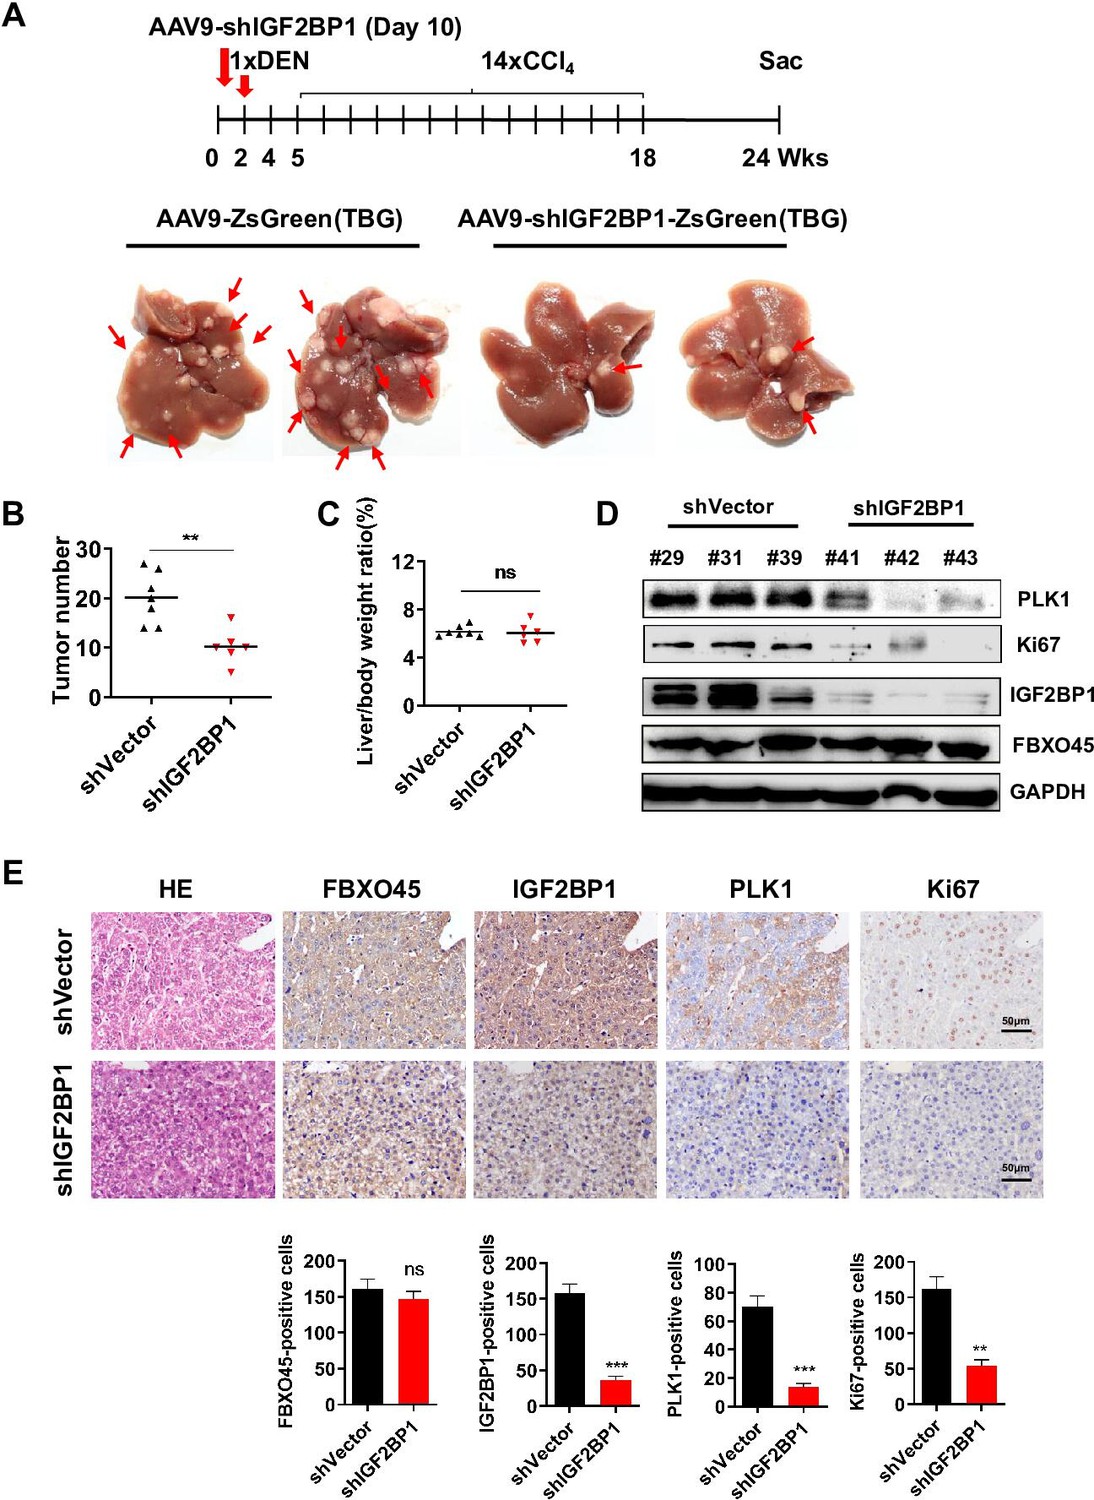
(A–E) FBXO45-OE male mice were injected with AAV9-shIGF2BP1-ZsGreen(TBG) (5×10¹⁰ gene copies per mouse, i.p.) (n=6) or AAV9-ZsGreen(TBG) (n=7) at the age of 10 days, followed by injection of DEN (25 mg/kg, i.p.) at the age of 2 weeks, and then 14 weekly injections of CCl4 (0.5 ml/kg, i.p.) to shorten observation periods. The mice were sacrificed 22 weeks after DEN administration. Representative images (A), tumor number (B), and the liver/body weight ratio (C) are shown. Livers were collected and followed by Western blot analysis (D) or IHC staining (E) with the indicated antibodies. Data are represented as the mean± SEM (B, C, E), n=4 (E), ns, nonsignificant, **p≤0.01, ***p≤0.001. Figure 5—source data 1 for B, C and E.
-
Figure 5—source data 1
Interfering IGF2BP1 protects against FBXO45-mediated hepatocarcinogenesis.
- https://cdn.elifesciences.org/articles/70715/elife-70715-fig5-data1-v2.xls
Figure 6
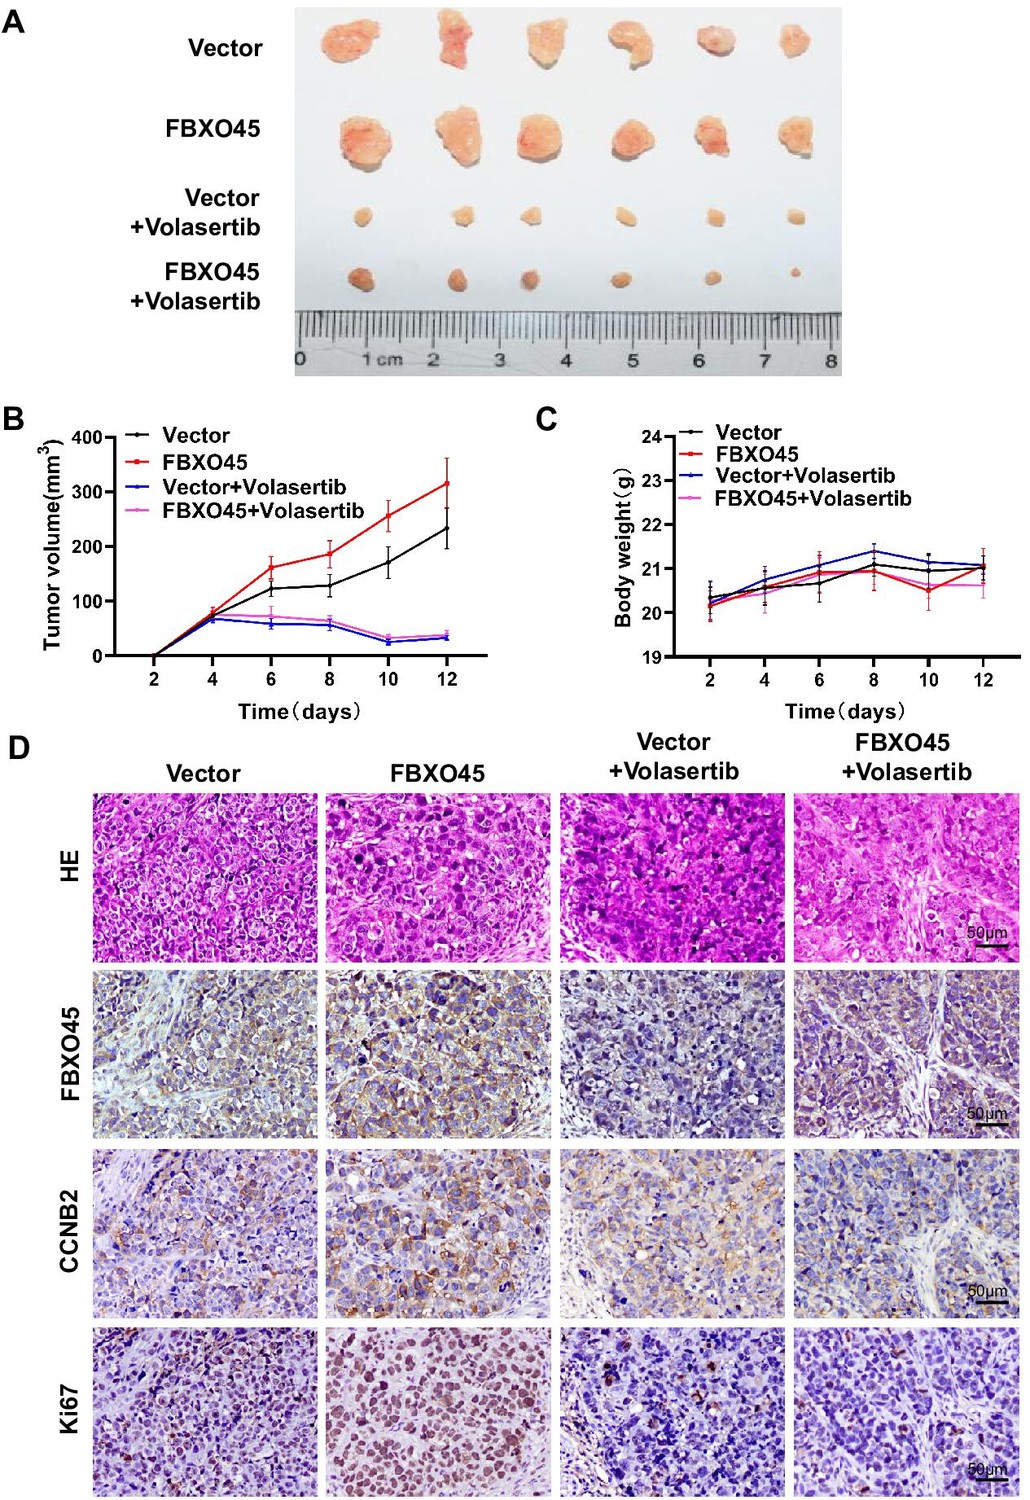
Inhibiting PLK1 blocks FBXO45-mediated the growth of HCC xenograft tumors in mice.
(A–D) A total of 4×10⁶ HCCLM3-FBXO45 cells were injected subcutaneously into right flank sides of nude mice. When the tumors reached a size of 80–120 mm3, the mice were received i.p. injection of volasertib at dose of 15 mg/kg every 2 days for 8 days. After 8 days, mice were euthanized and tumors were photographed (A). The tumor volumes were monitored and growth curves were plotted (B). The body weight of the mice was also measured and plotted (C). Proliferation-related biomarkers Ki67 and CCNB2 were stained in tumors by IHC staining (D). Shown are mean± SEM, n=6. HCC, hepatocellular carcinoma. Figure 6—source data 1 for B and C.
-
Figure 6—source data 1
Inhibiting PLK1 blocks FBXO45-mediated the growth of HCC xenograft tumors in mice.
HCC, hepatocellular carcinoma.
- https://cdn.elifesciences.org/articles/70715/elife-70715-fig6-data1-v2.xls
Figure 7 with 1 supplement
Correlation between the FBXO45, IGF2BP1, and PLK1 levels in HCC tissues.
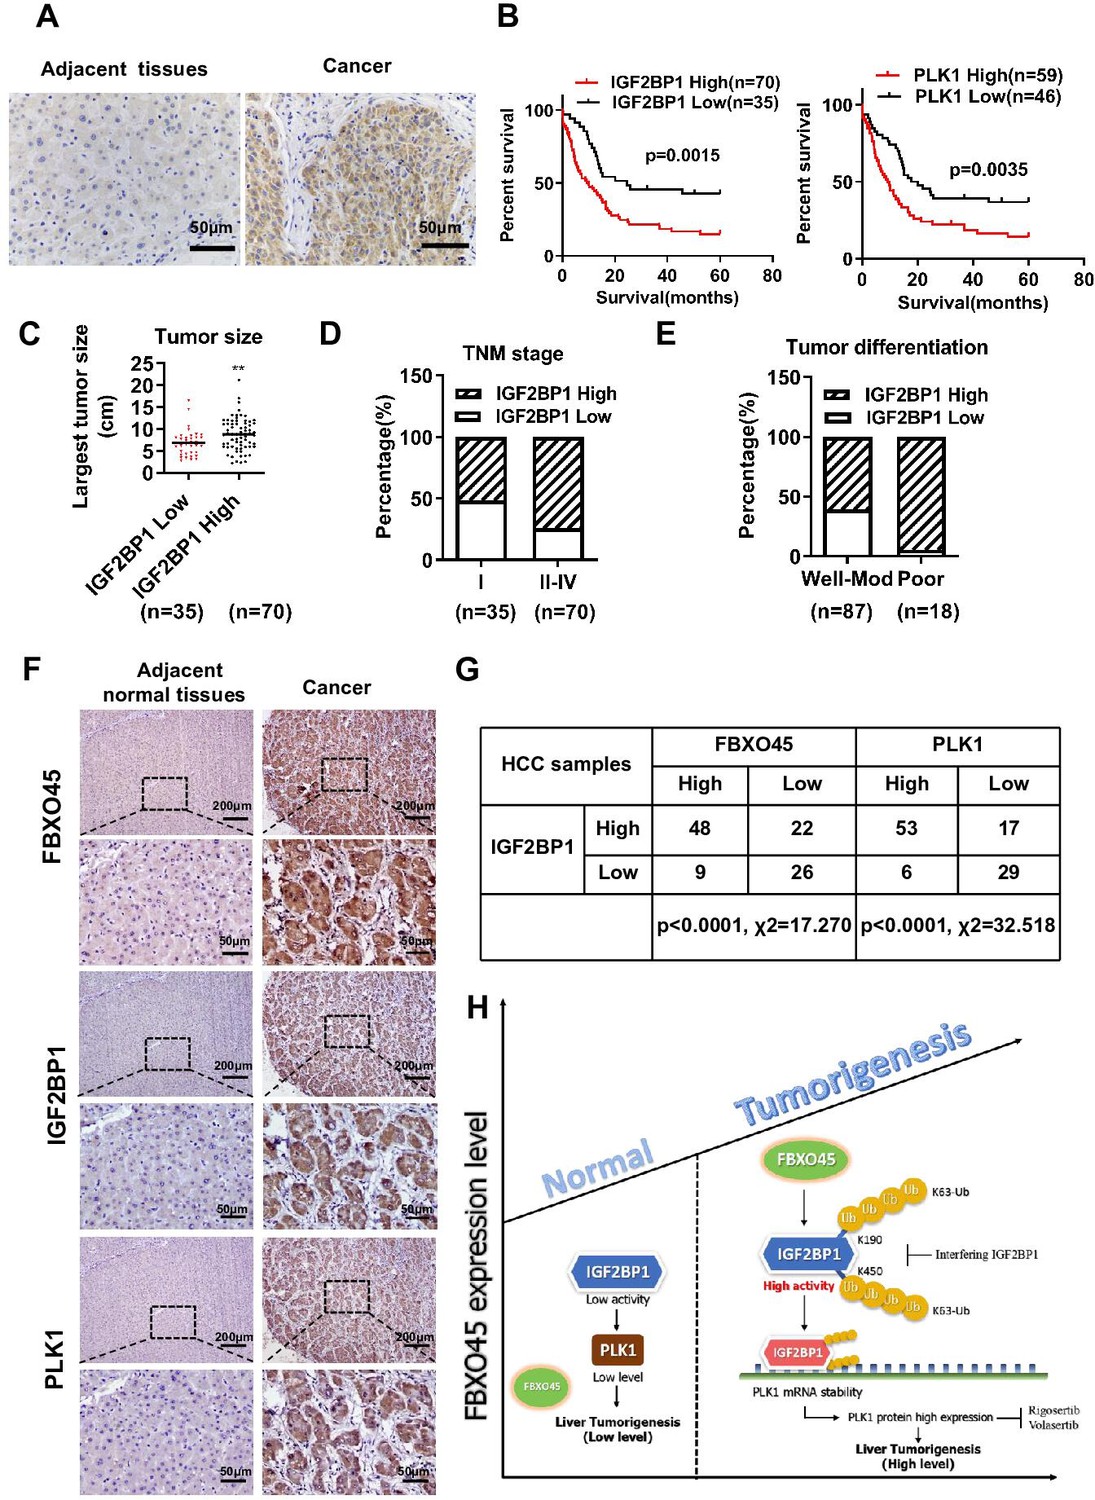
(A) The expression of IGF2BP1 in HCC tissue samples was determined by staining with an anti-IGF2BP1 antibody. Scale bar, 50 μm. (B) The association between IGF2BP1 or PLK1 protein expression and overall survival in HCC patients was evaluated. (C–E) The relationships between the IGF2BP1 protein and tumor size (C), TNM stage (D), and differentiation (E) were determined. **p≤0.01. (F, G) The expression of IGF2BP1, PLK1, and FBXO45 in HCC tissue samples was determined by IHC staining. Representative images of stained tumors are shown (F). The association between FBXO45, IGF2BP1, and PLK1 was statistically significant (G). Scale bar, 200 μm. (H) A model of hepatocarcinogenesis triggered by elevated FBXO45 expression driven via IGF2BP1-PLK1 axis. HCC, hepatocellular carcinoma.
Figure 7—figure supplement 1
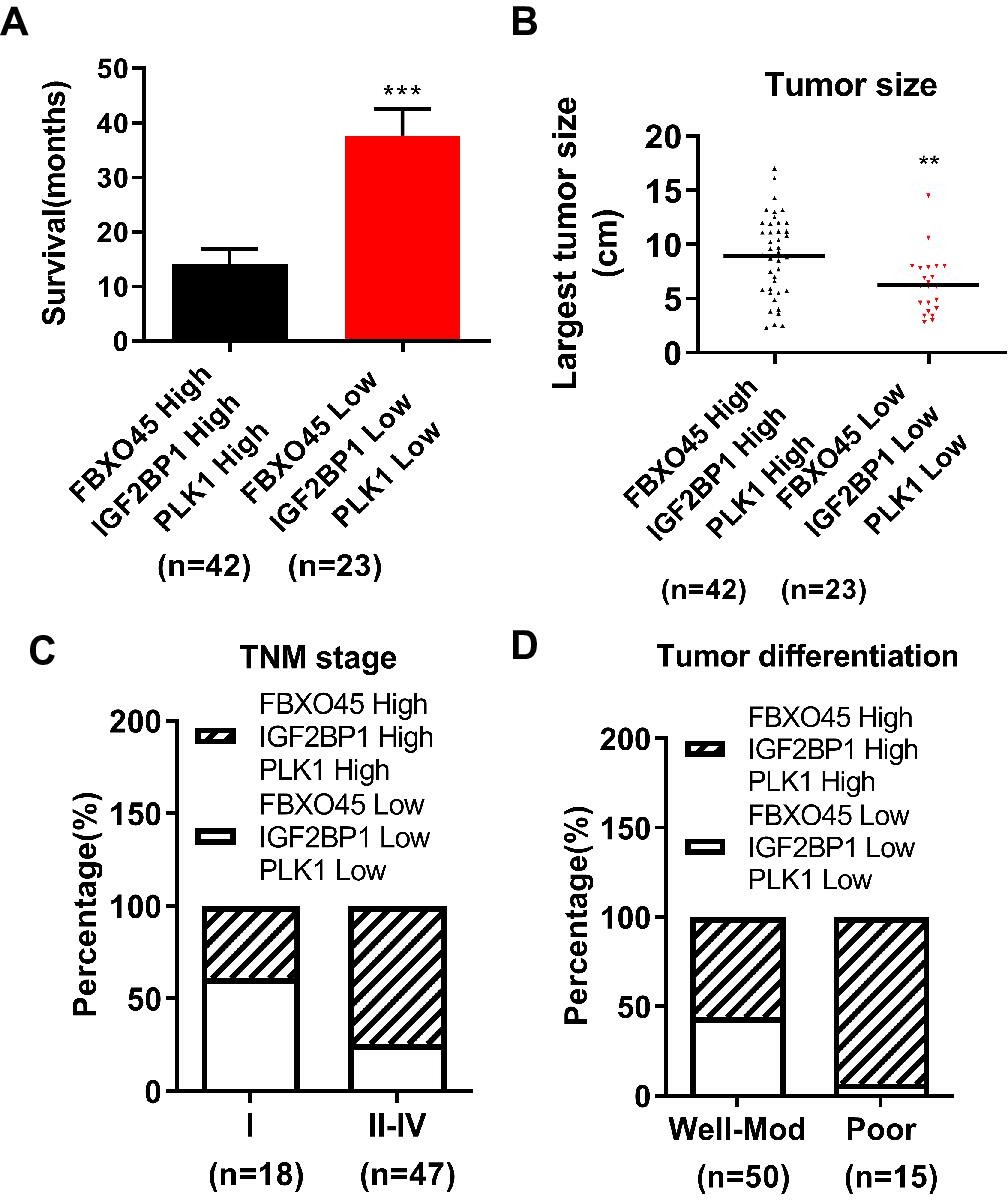
Relationships between the high or low expression of both FBXO45/IGF2BP1/PLK1 and clinicopathologic characteristics in HCC patients.
(A) The association between the high or low expression of FBXO45/IGF2BP1/PLK1 protein and survival time in HCC patients was evaluated. (B–D) The relationships between the FBXO45/IGF2BP1/PLK1 protein and largest tumor size (B), TNM stage (C), and differentiation (D) were determined. **p≤0.01, ***p≤0.001. HCC, hepatocellular carcinoma.
Author response image 1
Author response image 2
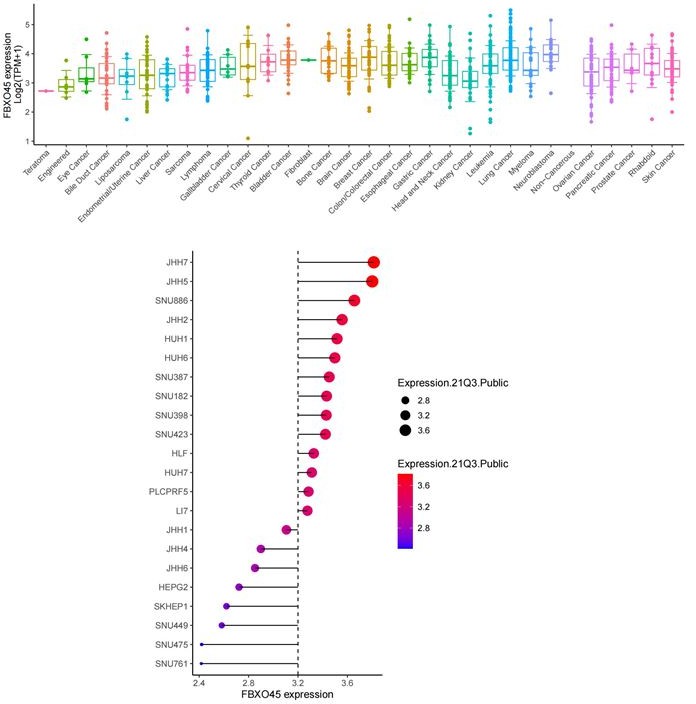
Expression level of FBXO45 at mRNA in various cancers and liver cancer cell lines (DepMap data).
Author response image 3
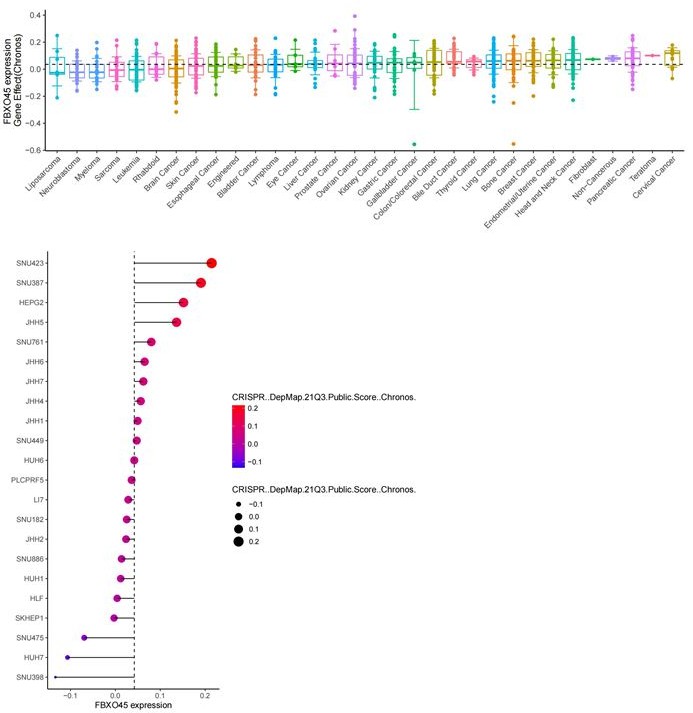
The gene effect of FBXO45 on cell proliferation in various cancers and liver cancer cell lines (DepMap data).
Author response image 4
Tables
Table 1
Relationships between the FBXO45 protein and clinicopathologic characteristics in 105 HCC patients.
| Variables | Cases | FBXO45 | FBXO45 | P value |
|---|---|---|---|---|
| High level | Low level | |||
| Age(years) | 0.582 | |||
| ≤55 | 76 | 40 | 36 | |
| >55 | 29 | 17 | 12 | |
| Gender | 0.864 | |||
| Female | 16 | 9 | 7 | |
| Male | 89 | 48 | 41 | |
| TNM stage | 0.004** | |||
| I | 35 | 12 | 23 | |
| II–IV | 70 | 45 | 25 | |
| Histologic grade | 0.001** | |||
| G1G2 | 87 | 41 | 46 | |
| G3 | 18 | 16 | 2 | |
| Tumor size | 0.239 | |||
| ≤5 cm | 23 | 10 | 13 | |
| >5 cm | 82 | 47 | 35 | |
| Recurrence | 0.631 | |||
| Present | 24 | 12 | 12 | |
| Absent | 81 | 45 | 36 | |
| Metastasis | 0.098 | |||
| Present | 53 | 33 | 20 | |
| Absent | 52 | 24 | 28 |
-
Calculated using the x2 test.
-
**p≤0.01 were considered statistically significant.
Table 2
Primers used for qRT-PCR.
| Gene symbol | Primer forward | Primer reverse | |
|---|---|---|---|
| Human | IGF2BP1 | CTCCTTTATGCAGGCTCCCG | GGGTCTCCAGCTTCACTTCC |
| PLK1 | CGAGTTCTTTACTTCTGGCT | TATTGAGGACTGTGAGGGGC | |
| MKI67 | CTTCGCTCTTACTCCCCTGC | GACTGAGACCACAGGACTGC | |
| FOXK1 | CCAAGGATGAGTCAAAGCCG | GTTCAAAGAGAGGTTGTGCC | |
| PDLIM7 | CTCACAGGCACCGAGTTCAT | CACTGTGCTCGTTTTGTCCG | |
| PEG10 | GCCTAGAAATGGGCCGTTGT | CGTTCTTGTCGTTGGTGAAC | |
| Mouse | Acta2 | CCGCCATGTATGTGGCTATT | CAGTTGTACGTCCAGAGGCATA |
| Timp1 | CTCGGACCTGGATGCTAAAA | ACTCTTCACTGCGGTTCTGG | |
| Col1a1 | TAAGGGTCCCCAATGGTGAGA | GGGTCCCTCGACTCCTACAT | |
| Col1a2 | CCAGCGAAGAACTCATACAGC | GGACACCCCTTCTACGTTGT | |
| Pdgfb | GGTGAGCAAGGTTGTAATGG | GGAGGCAATGGACAGACAA | |
| Pdgfrb | TCCCACATTCCTTGCCCTTC | GCACAGGGTCCACGTAGATG | |
| Mki67 | AAAGGCGAAGTGGAGCTTCT | TTTCGCAACTTTCGTTTGTG | |
| Pcna | AAAGATGCCGTCGGGTGAAT | CCATTGCCAAGCTCTCCACT | |
| Ccnb1 | AGCGAAGAGCTACAGGCAAG | CTCAGGCTCAGCAAGTTCCA | |
| Ccnb2 | CCGACGGTGTCCAGTGATTT | AGGTTTCTTCGCCACCTGAG | |
| Tnfa | CAAGATGCTGGGACAGTGAC | AGGGAAGAATCTGGAAAGGT | |
| Ccl2 | AAAAACCTGGATCGGAACCAA | CGGGTCAACTTCACATTCAAAG | |
| Il6 | GAGCCCACCAAGAACGATAG | TCATTTCCACGATTTCCCAG | |
| Il1b | GCTTCAGGCAGGCAGTATCA | GACAGCACGAGGCTTTTTTG | |
| Fbxo45 | GCTGGGAAGTGACGACCAGAG | AGCCAGAAGTCAGATGCTCAAGG |
Table 3
RNA interference.
| Gene symbol | Forward | Reverse | |
|---|---|---|---|
| Human | FBXO45 1# | CCAGGAAUGUCUACAUUAAdTdT | UUAAUGUAGACAUUCCUGGdTdT |
| FBXO45 2# | CCAGCAGUUUCUGCUGUAUdTdT | AUACAGCAGAAACUGCUGGdTdT | |
| FBXO45 3# | CAGAUAGGAGAAAGAAUUCGA | UCGAAUUCUUUCUCCUAUCUG | |
| IGF2BP1 2# | CCACCAGUUGGAGAACCAUdTdT | AUGGUUCUCCAACUGGUGGdTdT | |
| IGF2BP1 4# | CCGGGAGCAGACCAGGCAAdTdT | UUGCCUGGUCUGCUCCCGGdTdT | |
| MYCBP2 #1 | CCCGAGAUCUUGGGAAUAATT | UUAUUCCCAAGAUCUCGGGTT | |
| No-targeting control | UUCUCCGAACGUGUCACGUTT | ACGUGACACGUUCGGAGAATT | |
| Mouse | shIGF2BP1 | 5′-GATCCGCCGGGAGCAGACCAGGCAATTCAAGAGATTGCCTGGTCTGCTCCCGGTTTTTTACGCGTG-3′ | |
Appendix 1—key resources table
| Reagent type (species) or resource | Designation | Source or reference | Identifiers | Additional information |
|---|---|---|---|---|
| genetic reagent (M. musculus) | FBXO45-OE | Cyagen Biosciences Inc. | Fbxo45 knockin at the locus of ROSA26 in C57BL/6 mice | |
| genetic reagent (M. musculus) | BALB/c athymic nude mice | Army Medical University | Aged 6 weeks | |
| cell line (Homo-sapiens) | Dermal fibroblast (normal, Adult) | ATCC | PCS-201–012 | |
| cell line (Homo-sapiens) | HepG2 (HCC,15-year-old Male) | ATCC | ATCC:HB-8065;RRID:CVCL_0027 | |
| cell line (Homo-sapiens) | Huh7 (HCC, Adult male) | Fudan Cell Bank | CSTR:19375.09.3101HUMTCHu182;RRID:CVCL_0336 | |
| cell line (Homo-sapiens) | HCCLM3 | BeiNa Culture Collection | BNCC-342335;RRID:CVCL_6832 | |
| biological sample (Macaca fascicularis) | Primary simian hepatocytes | SingHealth, Singapore | Freshly isolated from Macaca fascicularis | |
| antibody | anti-IGF2BP1 (Rabbit Monoclonal) | Cell Signaling | Cat. #: 8,482 S;RRID:AB_11179079 | WB (1:1000)IP (1:150) |
| antibody | anti-IGF2BP1 (Rabbit Polyclonal) | Proteintech | Cat. #: 22803–1-AP;RRID:AB_2879173 | IHC (1:200) |
| antibody | anti-PLK1 (Rabbit Monoclonal) | Cell Signaling | Cat. #: 4,513 S;RRID:AB_2167409 | WB (1:1000) |
| antibody | anti-PLK1 (Mouse Monoclonal) | Boster | Cat. #: M00182 | IHC (1:300) |
| antibody | anti-Cullin-1 (Rabbit Polyclonal) | Cell Signaling | Cat. #: 4,995 S;RRID:AB_2261133 | WB (1:1000) |
| antibody | anti-FBXO45 (Rabbit Polyclonal) | Abcam | Cat. #:ab136614; | WB (1:1000) |
| antibody | anti-FBXO45 (Rabbit Polyclonal) | Bioss | Cat. #:bs-13150R; | IHC (1:300) |
| antibody | anti-α-SMA (Rabbit Polyclonal) | Abcam | Cat. #:ab5694;RRID:AB_2223021 | IHC (1:1600) |
| antibody | anti-SKP1 (Rabbit Polyclonal) | Proteintech | Cat. #: 10990–2-AP;RRID:AB_2187492 | WB (1:1000) |
| antibody | anti-GAPDH (Rabbit Polyclonal) | Proteintech | Cat. #: 10494–1-AP;RRID:AB_2263076 | WB (1:5000) |
| antibody | anti-HA (Rat Monoclonal) | Roche | Cat. #: 11867423001;RRID:AB_390918 | WB (1:1000) |
| antibody | anti-N-cadherin (Mouse Monoclonal) | Cell Signaling | Cat. #: 14,215 S;RRID:AB_2798427 | WB (1:1000) |
| antibody | anti-Flag (Mouse Monoclonal) | Sigma-Baldric | Cat. #: F1804;RRID:AB_262044 | WB (1:1000)IF (1:200) |
| antibody | anti-CCNB2 (Rabbit Polyclonal) | Proteintech | Cat. #: 21644–1-AP;RRID:AB_10755304 | IHC (1:300) |
| antibody | Goat anti-mouse IgG HRP | Cell Signaling | Cat. #: 7,076 S;RRID:AB_330924 | WB (1:5000) |
| antibody | Goat anti-rabbit IgG HRP | Cell Signaling | Cat. #: 7,074 S;RRID:AB_2099233 | WB (1:5000) |
| antibody | Goat anti-rat IgG HRP | Cell Signaling | Cat. #: 7,077 S;RRID:AB_10694715 | WB (1:5000) |
| antibody | anti-Ki67 (Mouse Monoclonal) | Millipore | Cat#: FCMAB103AP;RRID:AB_10561769 | WB (1:1000)IHC (1:800) |
| antibody | Mouse IgG1 Isotype Control | Cell Signaling | Cat. #:5,415 S;RRID:AB_10829607 | |
| antibody | Rabbit IgG Isotype Control | Cell Signaling | Cat. #:3,900 S;RRID:AB_1550038 | |
| recombinant DNA reagent | pcDNA3.1-FBXO45-3xFLAG | This paper | GenBank_ID:NM_001105573 | |
| recombinant DNA reagent | pcDNA3.1-FBXO45ΔF-3xFLAG | This paper | GenBank_ID:NM_001105573(del39-82aa) | |
| recombinant DNA reagent | pcDNA3.1-IGF2BP1-HA | This paper | GenBank_ID:NM_006546 | |
| recombinant DNA reagent | AAV9-shIGF2BP1-ZsGreen-TBG | Hanheng Biosciences | ||
| recombinant DNA reagent | pLV[EXP]-EGFP-Puro-FBXO45-3xFLAG | This paper | ||
| recombinant DNA reagent | LV-U6-shIGF2BP1-mCherry-Puro | This paper | ||
| commercial assay or kit | Magna RIP RNA-Binding Protein Immunoprecipitation Kit | Millipore | Cat #:17–700 | |
| commercial assay or kit | PrimeScript RT reagent Kit with gDNA Eraser | Takara | Cat #: RR047 | |
| commercial assay or kit | TB Green Premix Ex Taq II | Takara | Cat #: RR820 | |
| commercial assay or kit | QuikChange Lightning Site-Directed Mutagenesis Kit | Agilent | Cat #:210,519 | |
| chemical compound, drug | DNase I | Roche | Cat. #:10104159001 | |
| chemical compound, drug | Collagenase | Invitrogen | Cat. #:17104019 | |
| chemical compound, drug | DEN | Sigma-Aldrich | Cat. #: N0756 | 25 mg/kg |
| chemical compound, drug | Actinomycin D | Sigma-Aldrich | Cat. #: SBR00013 | 10 µg/mL |
| chemical compound, drug | MG-132, proteasome inhibitor | Selleck | Cat. #: S2619 | 10 μM |
| chemical compound, drug | Volasertib | Selleck | Cat. #: S2235 | |
| chemical compound, drug | Rigosertib | Selleck | Cat. #: S1362 | |
| chemical compound, drug | Protein A/G PLUS-Agarose | Santa Cruz | Cat. #: sc-2003;RRID:AB_10201400 | |
| Software, algorithm | Graphpad Prism | Graphpad | RRID:SCR_002798 | |
| Software, algorithm | IBM SPSS Statistics | IBM | RRID:SCR_019096 |
Additional files
-
Supplementary file 1
Univariate and multivariate analyses indicating associations between overall survival and various risk factors in 105 HCC patients.
- https://cdn.elifesciences.org/articles/70715/elife-70715-supp1-v2.docx
-
Supplementary file 2
Relationships between FBXO45 mRNA expression and clinicopathologic characteristics in 253 HCC patients.
- https://cdn.elifesciences.org/articles/70715/elife-70715-supp2-v2.docx
-
Supplementary file 3
Univariate and multivariate analyses indicating the associations between overall survival and various risk factors in 253 HCC patients.
- https://cdn.elifesciences.org/articles/70715/elife-70715-supp3-v2.docx
-
Supplementary file 4
FBXO45-interacting proteins identified by Co IP-MS.
- https://cdn.elifesciences.org/articles/70715/elife-70715-supp4-v2.docx
-
Supplementary file 5
Relationships between the IGF2BP1 protein and clinicopathological characteristics in 105 HCC patients.
- https://cdn.elifesciences.org/articles/70715/elife-70715-supp5-v2.docx
-
Transparent reporting form
- https://cdn.elifesciences.org/articles/70715/elife-70715-transrepform1-v2.docx
Download links
A two-part list of links to download the article, or parts of the article, in various formats.
Downloads (link to download the article as PDF)
Open citations (links to open the citations from this article in various online reference manager services)
Cite this article (links to download the citations from this article in formats compatible with various reference manager tools)
Elevated FBXO45 promotes liver tumorigenesis through enhancing IGF2BP1 ubiquitination and subsequent PLK1 upregulation
eLife 10:e70715.
https://doi.org/10.7554/eLife.70715


