Framework for rapid comparison of extracellular vesicle isolation methods
- Wyss Institute for Biologically Inspired Engineering, United States
- Tufts University School of Medicine, United States
- Department of Pathology, Brigham and Women’s Hospital, United States
- Harvard Medical School, United States
Figures
Figure 1
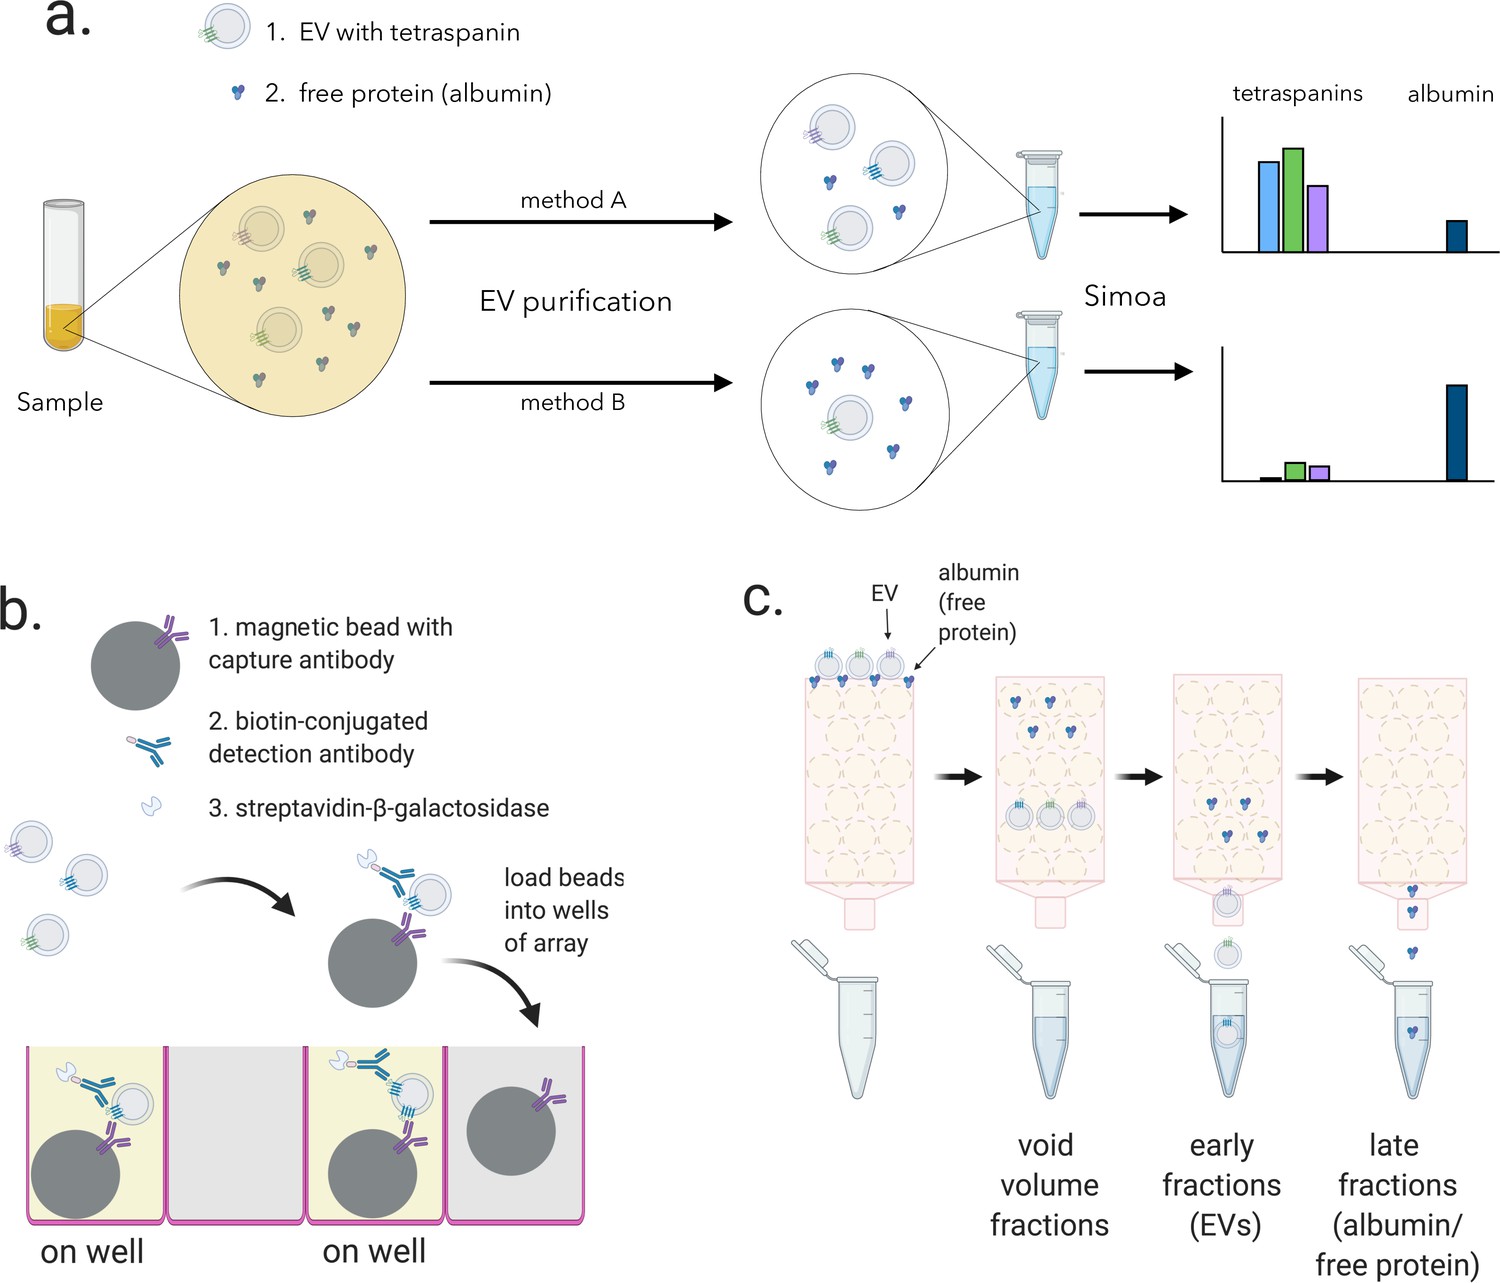
Overview of experimental framework for EV detection using Simoa and size exclusion chromatography (SEC).
(a) Different methods of EV isolation can be directly compared to assess yield and purity by measuring the three tetraspanins (CD9, CD63, and CD81) and albumin. (b) Single immuno-complexes are formed by binding the target tetraspanin protein on EVs to a magnetic bead conjugated to a capture antibody and a biotin-labeled detection antibody. Detection antibodies are labeled with a streptavidin-conjugated enzyme. The beads are then loaded into individual wells of a microwell array where each well matches the size of the magnetic bead limiting a maximum of one bead per well. Wells with the full immuno-complex (on wells) produce a fluorescent signal upon conversion of substrate, unlike wells with beads lacking the immuno-complex (off wells”). (c) EV and free proteins such as albumin in a biofluid sample are separated by SEC. Free proteins elute from the column in later fractions than EVs because free proteins are smaller than the pore size of the beads while EVs are larger and are excluded from entering the beads. EV, extracellular vesicle.
Figure 2 with 1 supplement
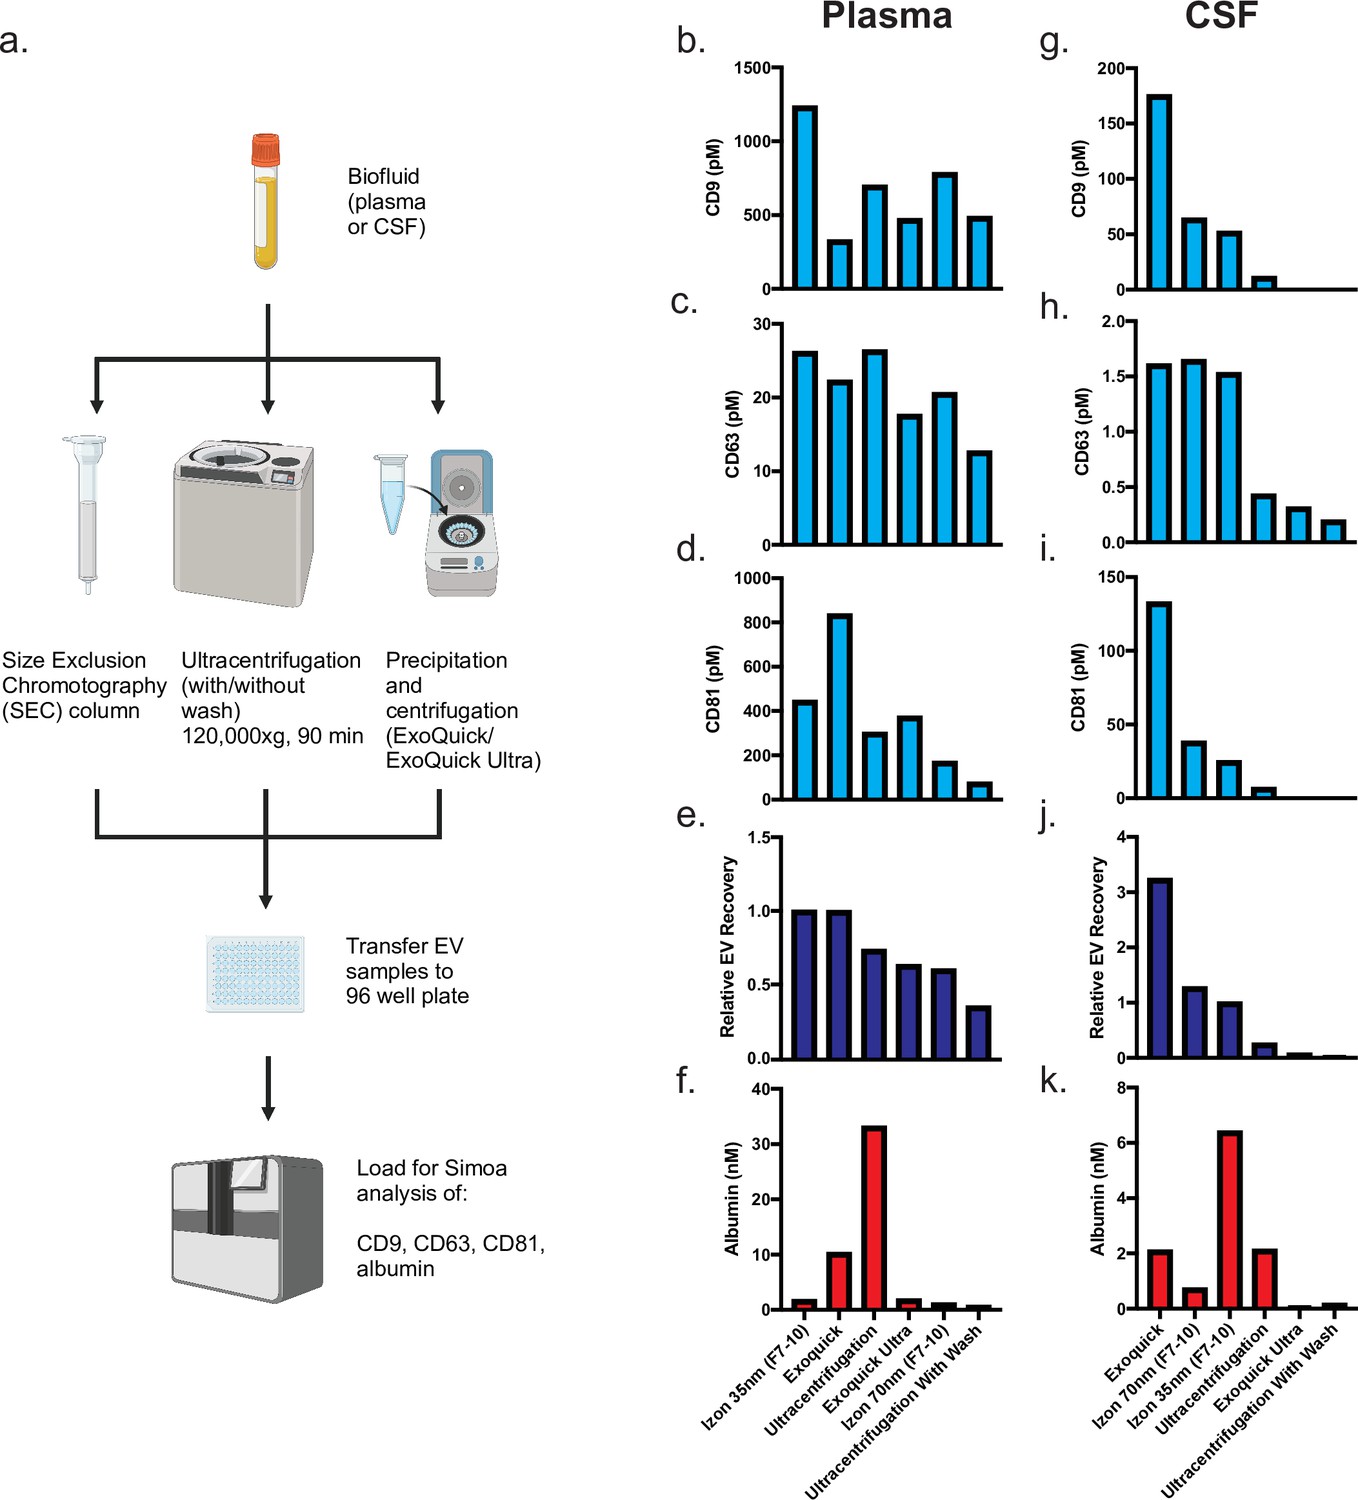
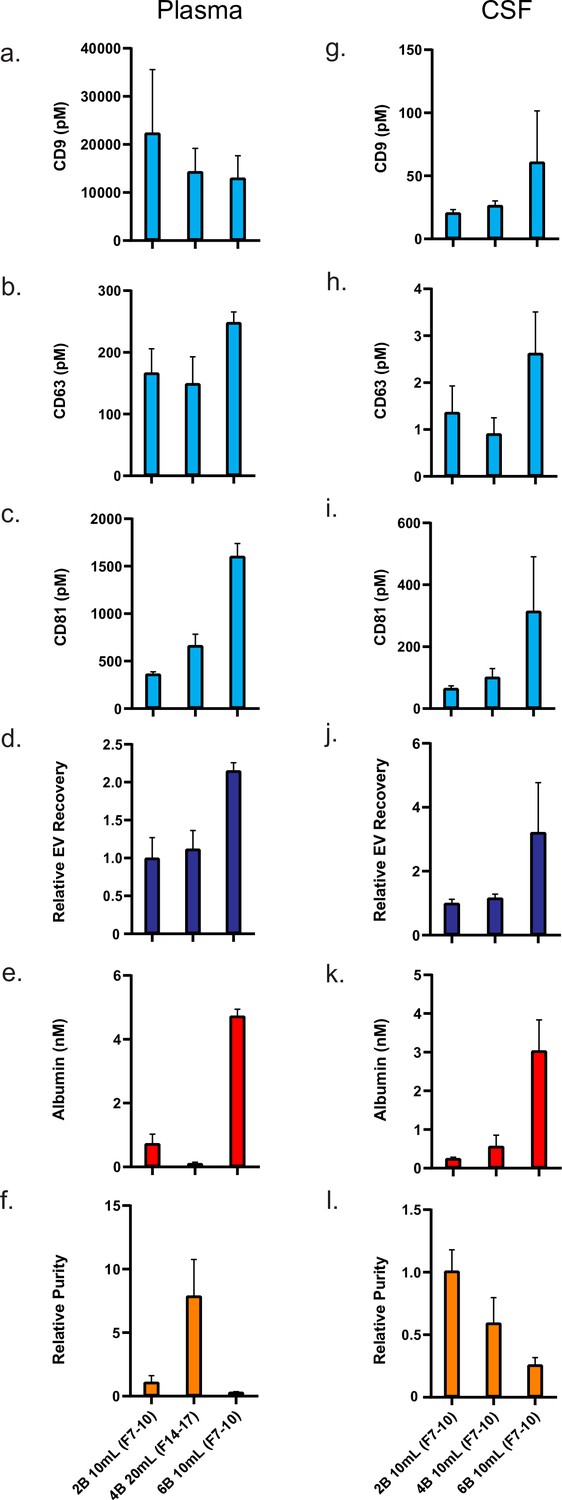
Comparison of existing methods for EV isolation in plasma and CSF.
(a) Schematic of experimental outline. (b–d) Individual tetraspanin yields using different isolation methods from plasma. (e) Relative EV recoveries from plasma were calculated by first normalizing individual tetraspanin values (in pM) in each technique to those of Izon qEVoriginal 35 nm EV fractions 7-10 and then averaging the three tetraspanin ratios. (f) Albumin levels using different EV isolation methods from plasma. (g–i) Individual tetraspanin yields using different isolation methods from CSF. (j) Relative EV recoveries in CSF were calculated by first normalizing individual tetraspanin values (in pM) in each technique to those of Izon qEVoriginal 35 nm fractions 7-10 and then averaging the three tetraspanin ratios. (k) Albumin levels using different EV isolation methods from CSF. CSF, cerebrospinal fluid; EV, extracellular vesicle.
-
Figure 2—source data 1
Comparison of existing methods for EV isolation in plasma and CSF.
- https://cdn.elifesciences.org/articles/70725/elife-70725-fig2-data1-v2.xlsx
Figure 2—figure supplement 1
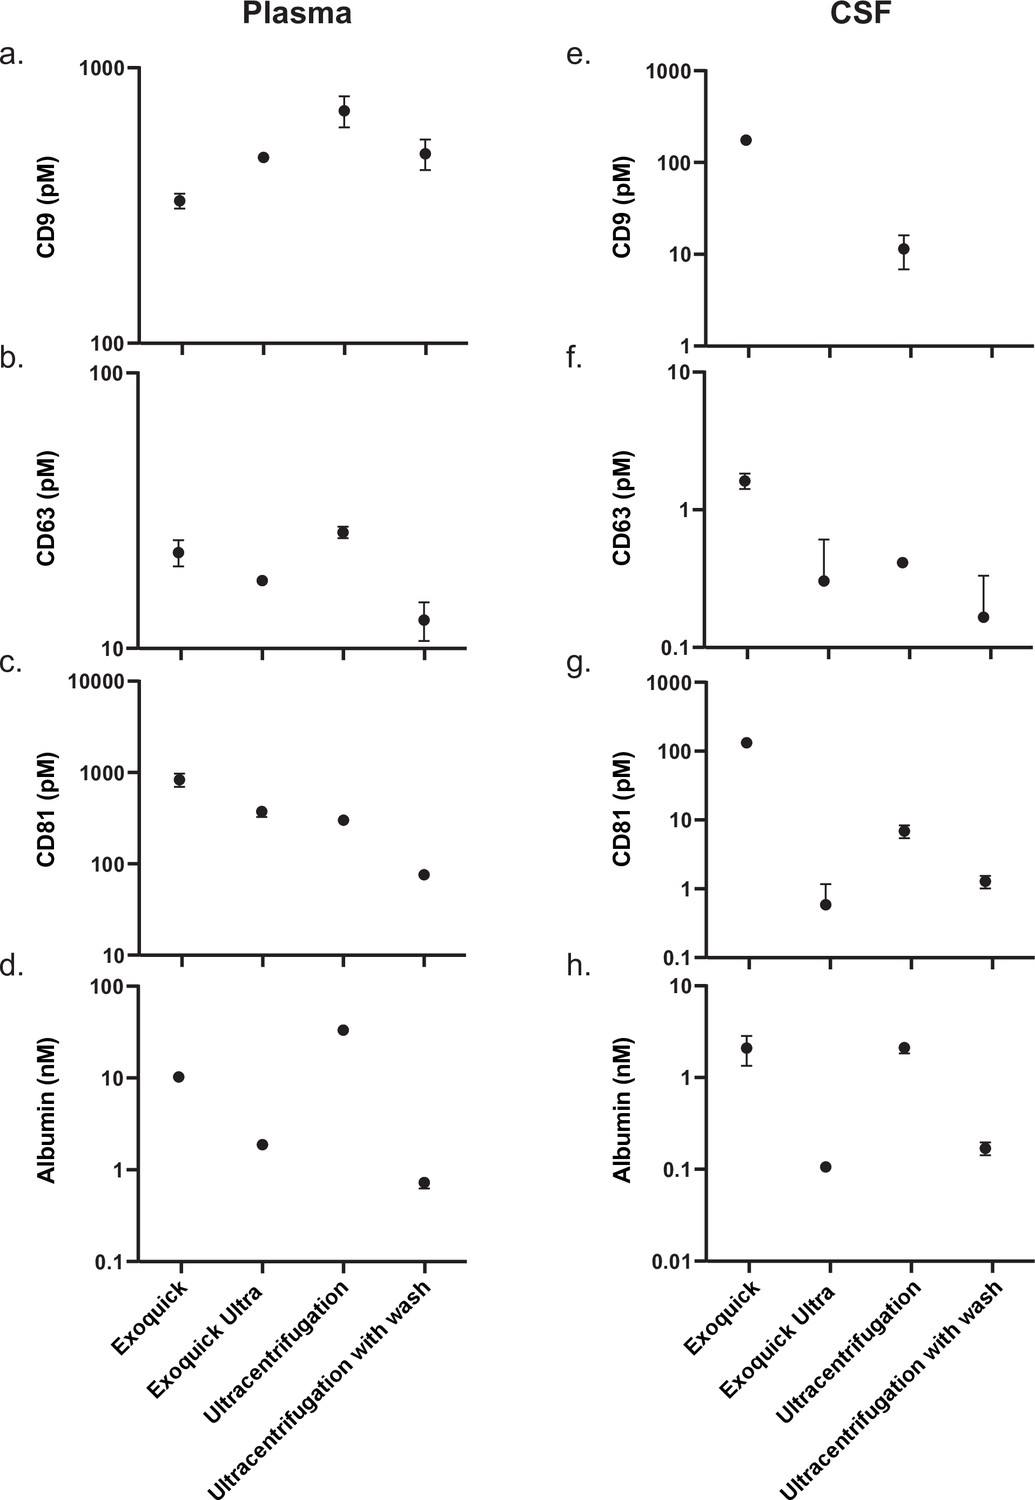
Assay reproducibility between Simoa measurements of EV isolations on 2 different days.
Simoa results displaying average measurements of EV isolation on two different days with error bars representing standard deviation. (a–d) for tetraspanins and albumin for EV isolation in plasma. (e–h) for tetraspanins and albumin for EV isolation in CSF. CSF, cerebrospinal fluid; EV, extracellular vesicle; Simoa single-molecule array.
Figure 3 with 5 supplements
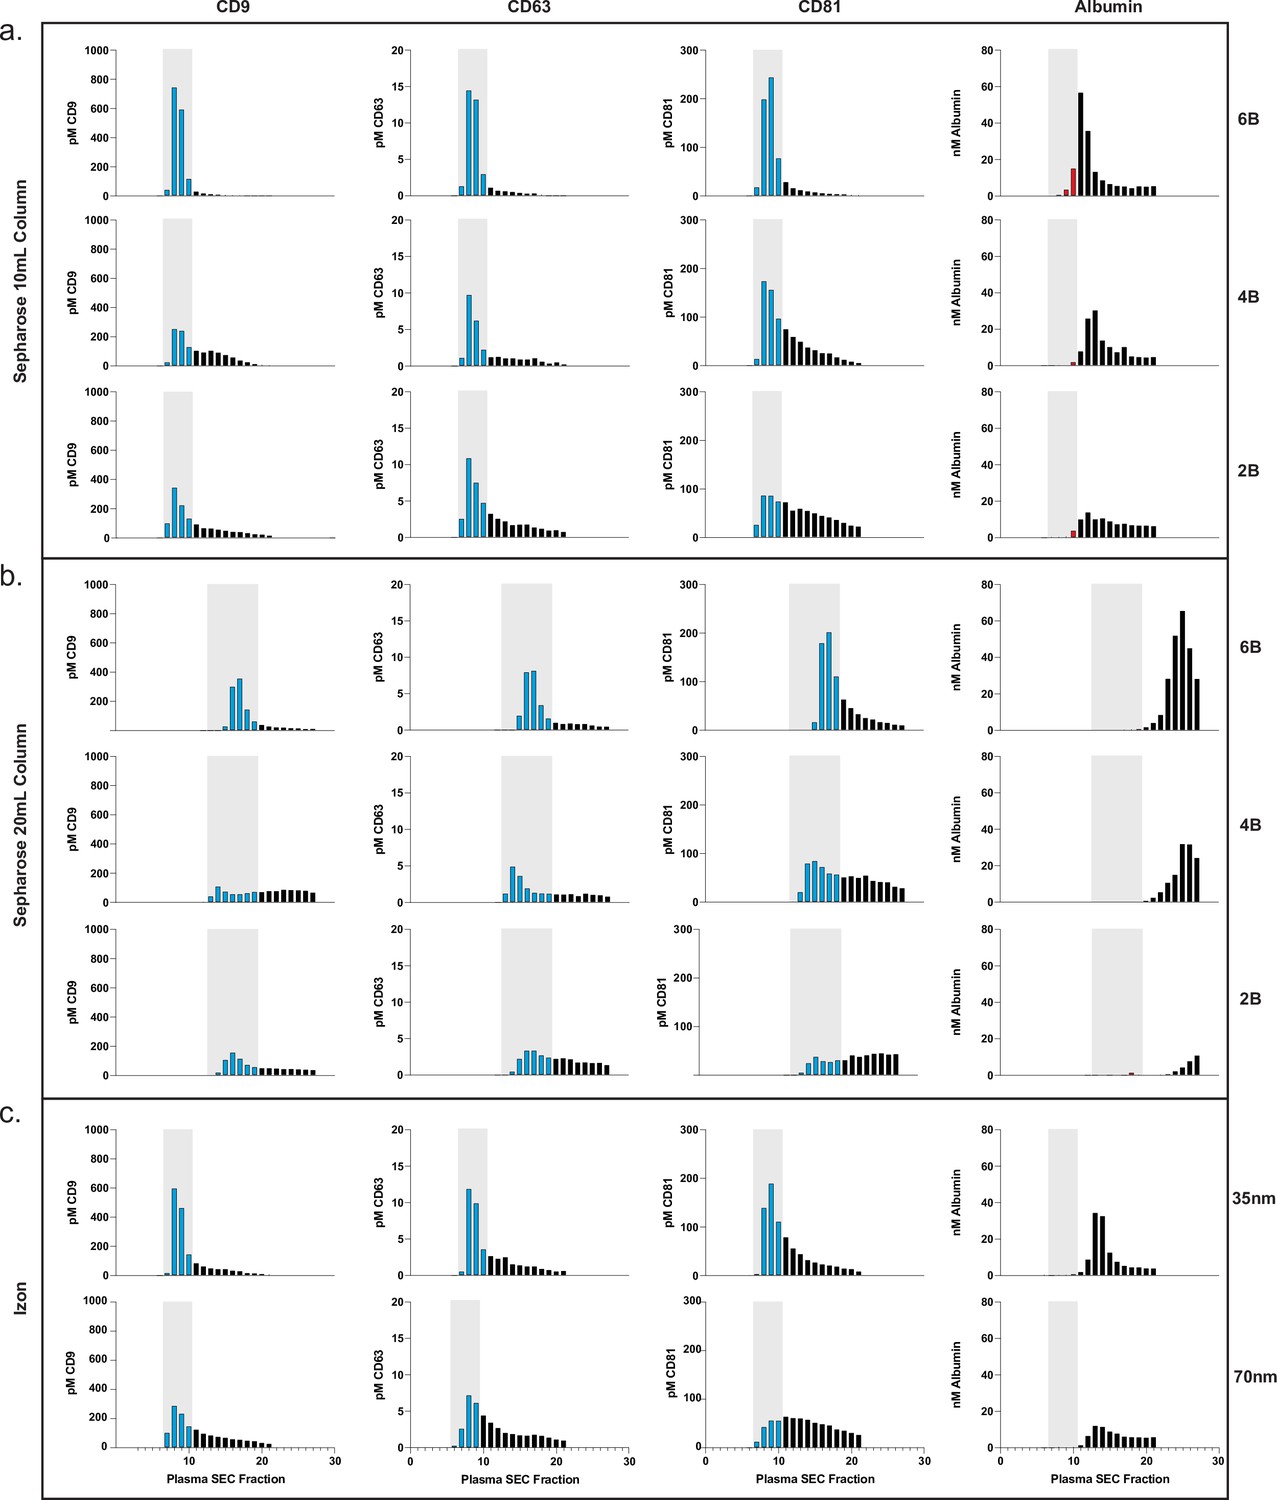
Comparison of SEC methods for EV isolation in plasma.
(a) Levels of tetraspanins and albumin in plasma after fractionation with 10 ml custom columns filled with Sepharose CL-6B (top), Sepharose CL-4B (middle), and Sepharose CL-2B (bottom). (b) Levels of tetraspanins and albumin in plasma after fractionation with Izon qEVoriginal 35 nm column (top) and Izon qEVoriginal 70 nm column (bottom). (c) Levels of tetraspanins and albumin in plasma after fractionation with 20 ml custom columns; Sepharose CL-6B (top), Sepharose CL-4B (middle), and Sepharose CL-2B (bottom). EV, extracellular vesicle; SEC, size exclusion chromatography.
-
Figure 3—source data 1
Plasma SEC optimization.
- https://cdn.elifesciences.org/articles/70725/elife-70725-fig3-data1-v2.xlsx
Figure 3—figure supplement 1
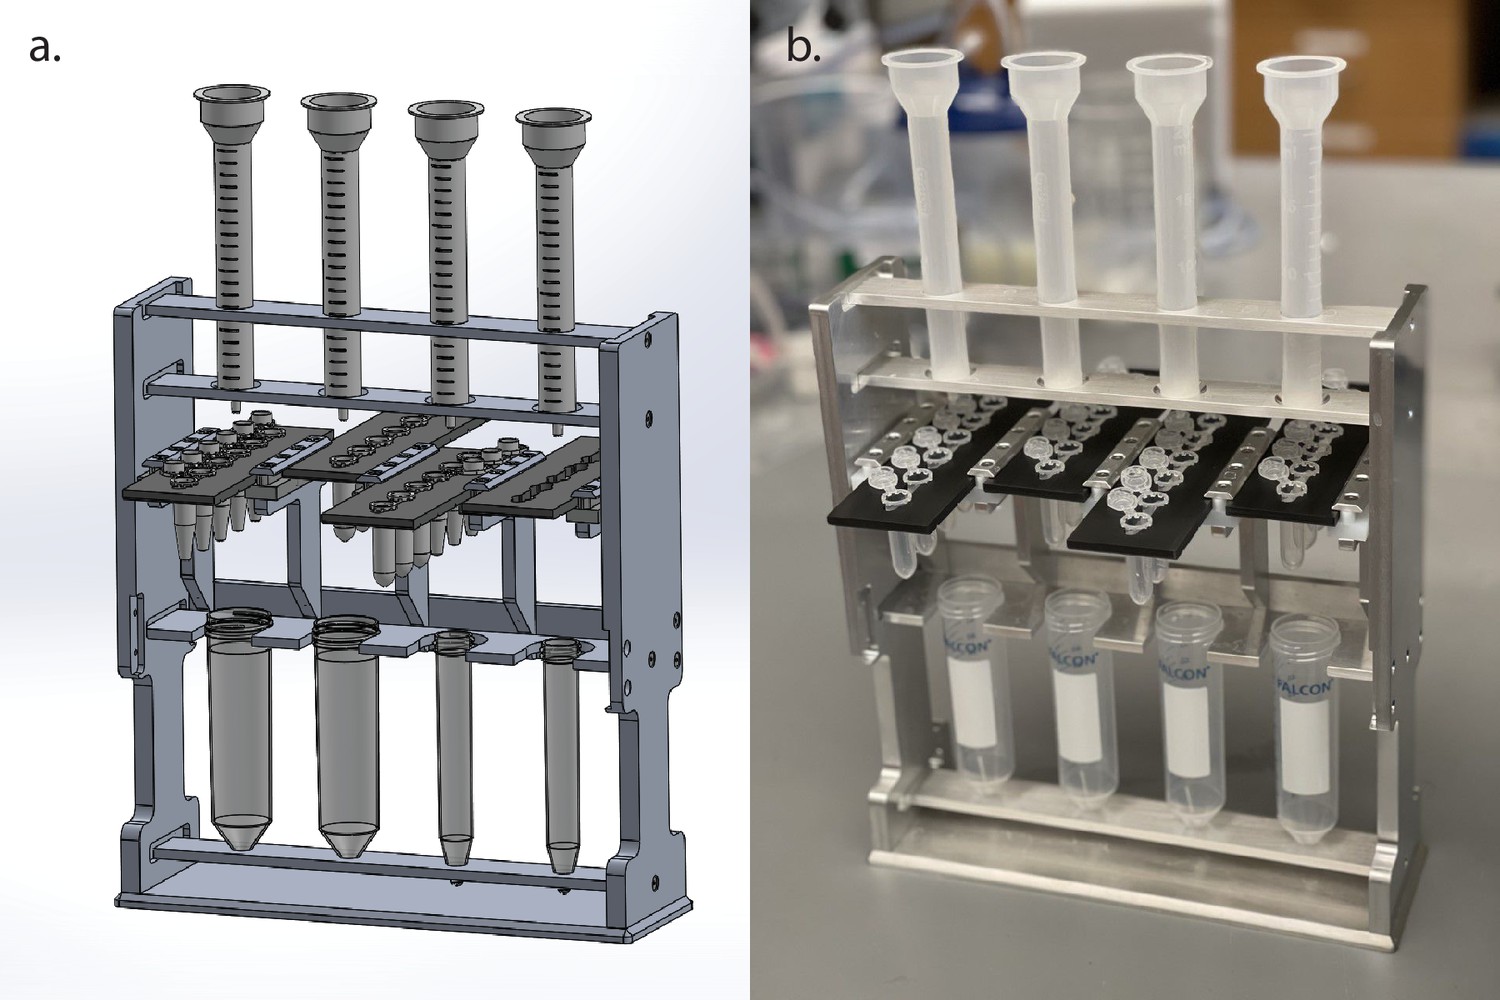
Custom stand designed for higher throughput, reproducible SEC.
(a) Image of SolidWorks file with custom SEC stand designed to run four SEC columns in parallel with ‘clickable’ sliding collection tube holder plates that allow for easy fraction collection. (b) Photograph of constructed, custom SEC stand holding four (empty) columns. SEC, size exclusion chromatography.
Figure 3—figure supplement 2
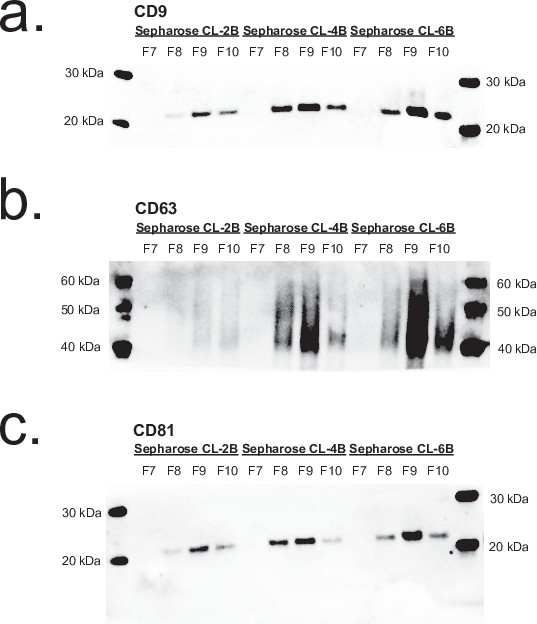
Comparison of SEC resins by Western blotting.
(a–c) Western blot of tetraspanins in fractions 7–10 of 0.5 ml plasma isolated by SEC using Sepharose CL-2B, Sepharose CL-4B, and Sepharose CL-6B resins. SEC, size exclusion chromatography.
Figure 3—figure supplement 3
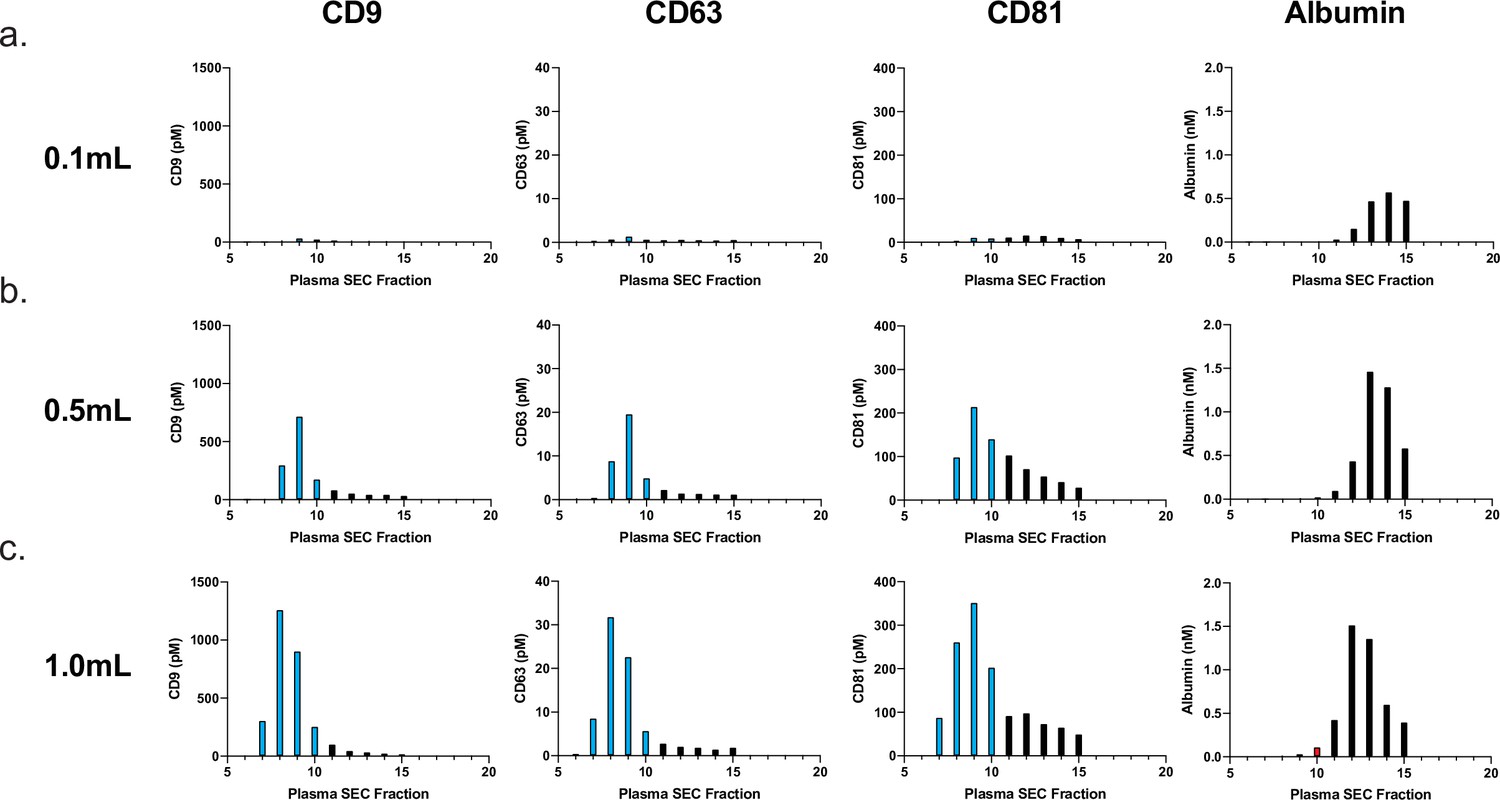
Effect of plasma sample volume on SEC.
Simoa was performed to determine levels of CD9, CD63, CD81, and albumin after fractionating different volumes of plasma by SEC using a 10 mL Sepharose CL-6B column. Effect of sample volume on EV recovery and purity by SEC for (a) 0.1 ml, (b) 0.5 ml, (c) 1.0 ml. EV, extracellular vesicle; SEC, size exclusion chromatography; Simoa single-molecule array.
Figure 3—figure supplement 4
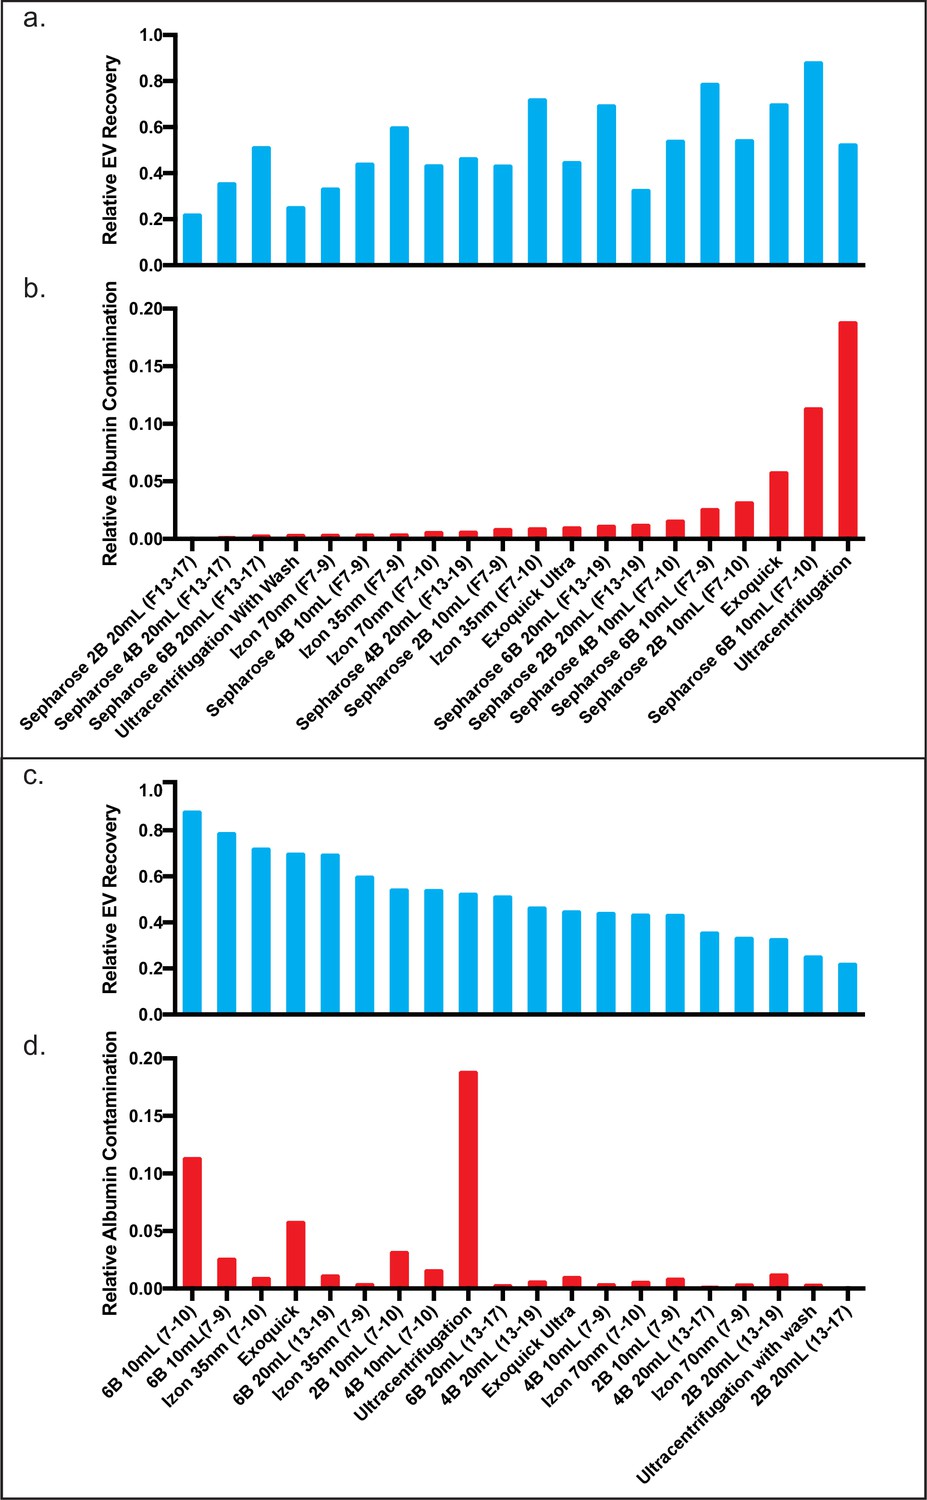
Comparison of EV recovery and albumin contamination across all tested methods in plasma.
Comparison of plasma EV recovery and albumin contamination in plasma across all tested methods ranked by EV recovery. Relative EV recoveries were calculated by individually normalizing each tetraspanin to the sum of the tetraspanins in all fractions (Konoshenko et al., 2018; Théry et al., 2018; Sódar et al., 2016; Welton et al., 2015; Lee et al., 2019; Webber and Clayton, 2013; Johnsen et al., 2019; Simonsen, 2017; Osteikoetxea et al., 2015; Visnovitz et al., 2019; Lucchetti et al., 2020; Kuiper et al., 2021; Welsh et al., 2020; Coumans et al., 2017b; Rissin et al., 2010; Cohen and Walt, 2019) in the 10 ml Sepharose CL-6B condition. The three tetraspanin percentages were then averaged to calculate the relative EV recoveries. Similarly, albumin for each condition was calculated as a fraction of the albumin found in all fractions (Konoshenko et al., 2018; Théry et al., 2018; Sódar et al., 2016; Welton et al., 2015; Lee et al., 2019; Webber and Clayton, 2013; Johnsen et al., 2019; Simonsen, 2017; Osteikoetxea et al., 2015; Visnovitz et al., 2019; Lucchetti et al., 2020; Kuiper et al., 2021; Welsh et al., 2020; Coumans et al., 2017b; Rissin et al., 2010; Cohen and Walt, 2019) in the 10 ml Sepharose CL-6B condition. (a–b) All methods plotted in order of albumin contamination. (c–d) All methods plotted in order of EV recovery. EV, extracellular vesicle.
Figure 3—figure supplement 5
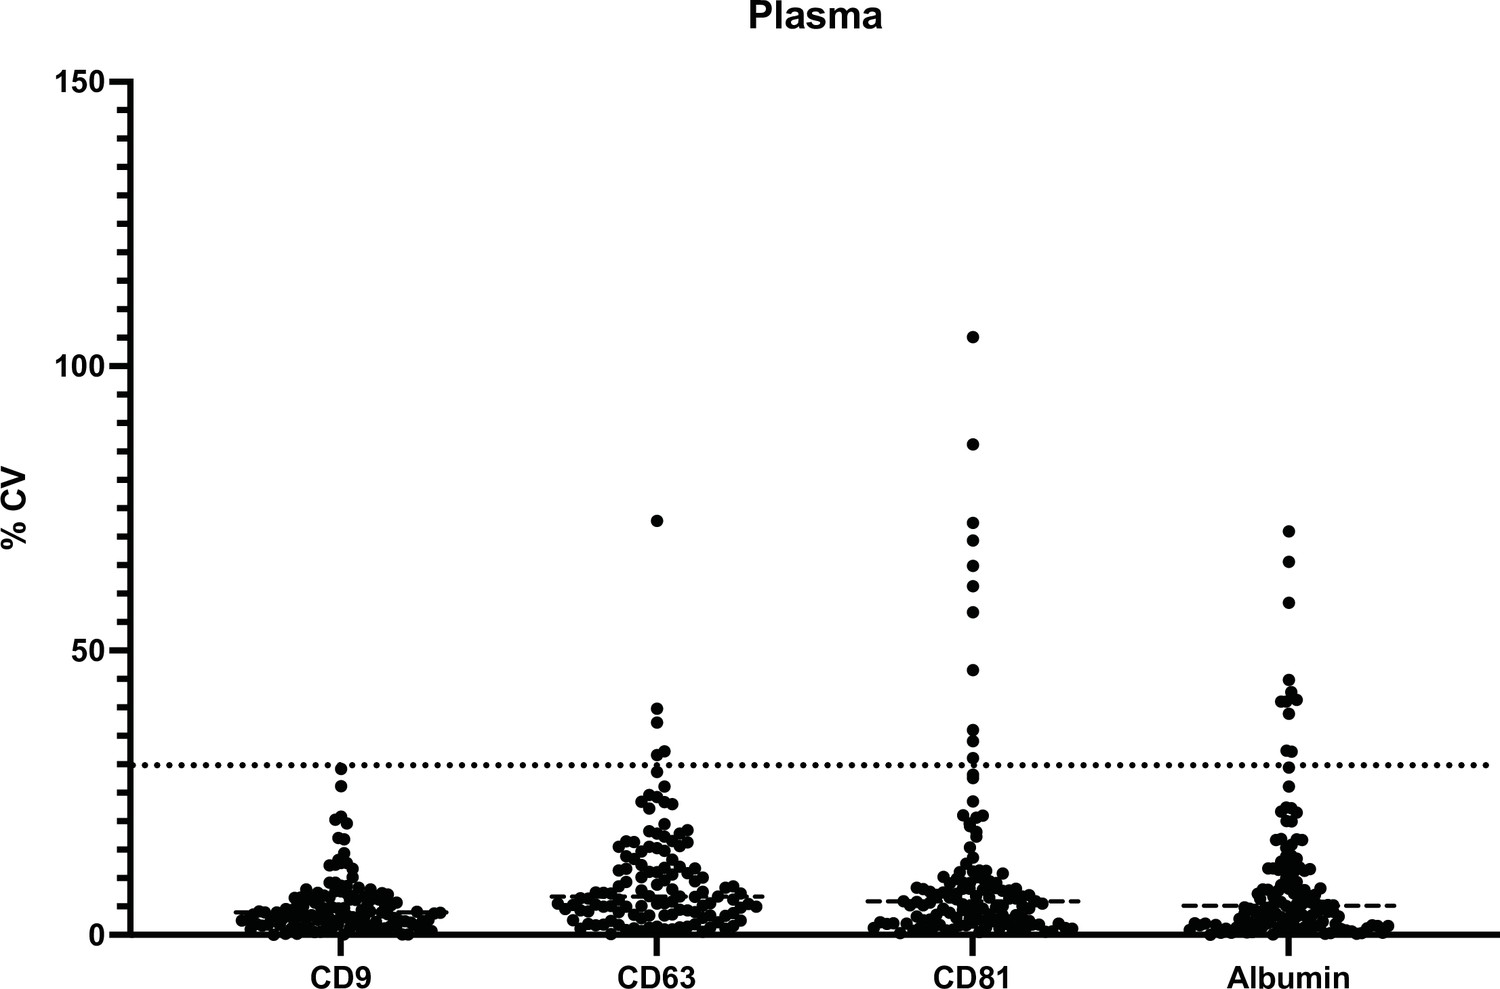
Coefficients of variation (CVs) across all tested methods in plasma.
Figure 4 with 3 supplements
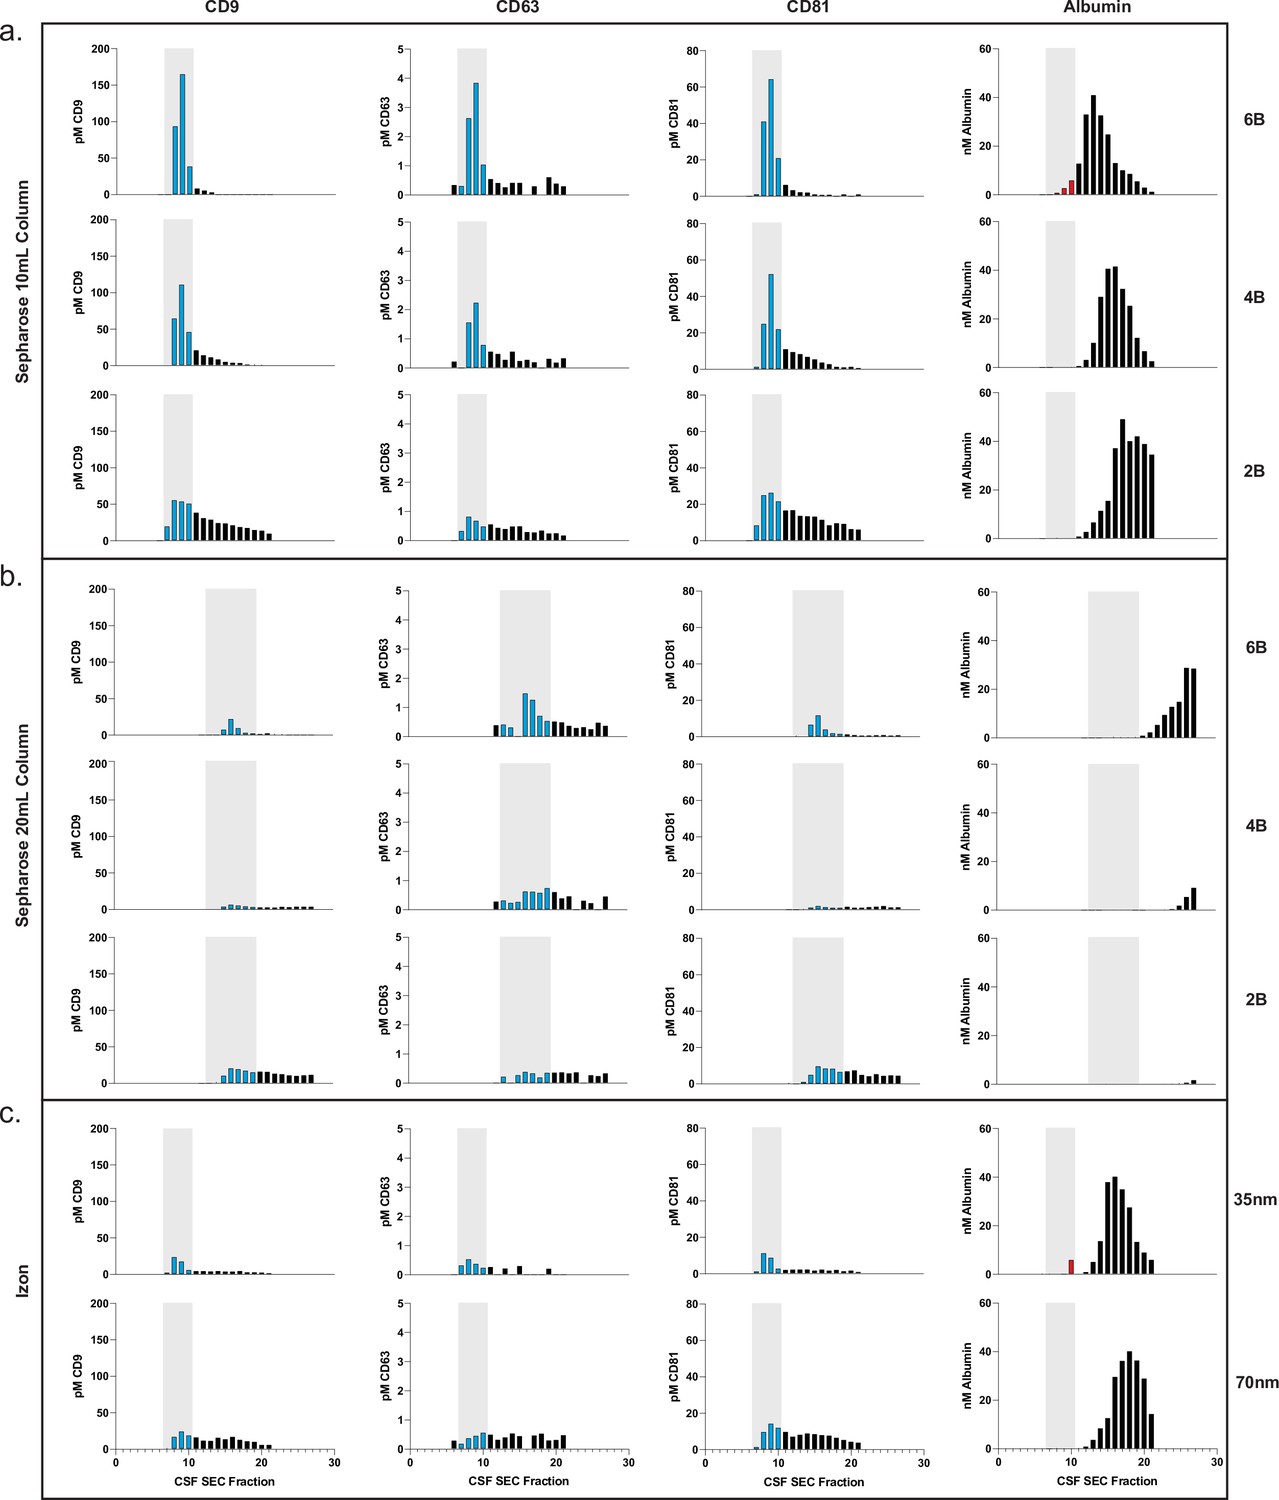
Comparison of SEC methods for EV isolation in CSF.
(a) Levels of tetraspanins and albumin in CSF after fractionation with 10 ml custom columns filled with Sepharose CL-6B (top), Sepharose CL-4B (middle), and Sepharose CL-2B (bottom). (b) Levels of tetraspanins and albumin in CSF after fractionation with Izon qEVoriginal 35 nm column (top) and Izon qEVoriginal 70 nm column (bottom). (c) Levels of tetraspanins and albumin in CSF after fractionation with 20 ml custom columns; Sepharose CL-6B (top), Sepharose CL-4B (middle), and Sepharose CL-2B (bottom). CSF, cerebrospinal fluid; EV, extracellular vesicle; SEC, size exclusion chromatography.
-
Figure 4—source data 1
CSF SEC optimization.
- https://cdn.elifesciences.org/articles/70725/elife-70725-fig4-data1-v2.xlsx
Figure 4—figure supplement 1
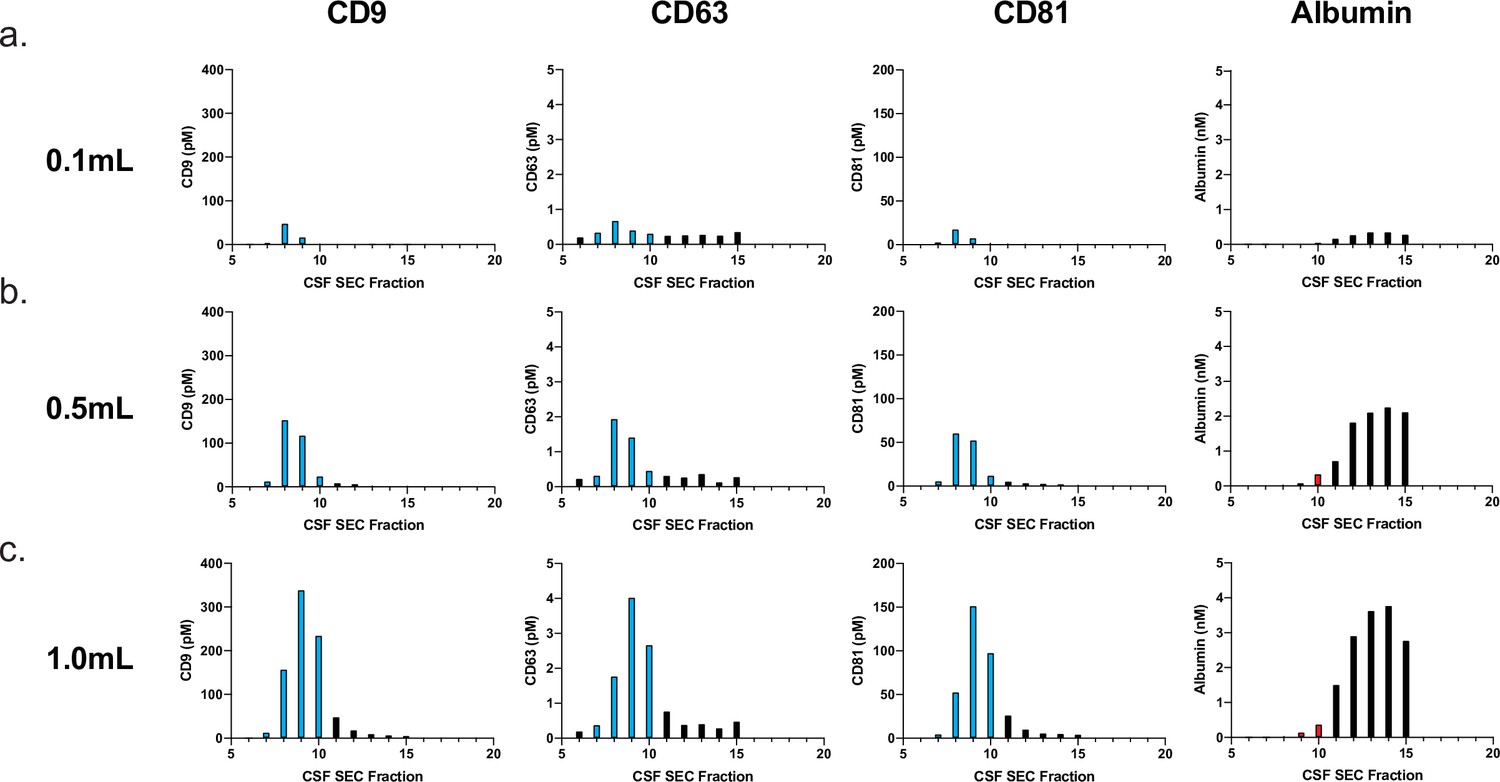
Effect of CSF sample volume on SEC.
Simoa was performed to determine levels of CD9, CD63, CD81, and albumin after fractionating different volumes of CSF by SEC using a 10-ml Sepharose CL-6B column. Effect of sample volume on EV recovery and purity by SEC for (a) 0.1 ml, (b) 0.5 ml, (c) 1.0 ml. CSF, cerebrospinal fluid; EV, extracellular vesicle; SEC, size exclusion chromatography; Simoa, single-molecule array.
Figure 4—figure supplement 2
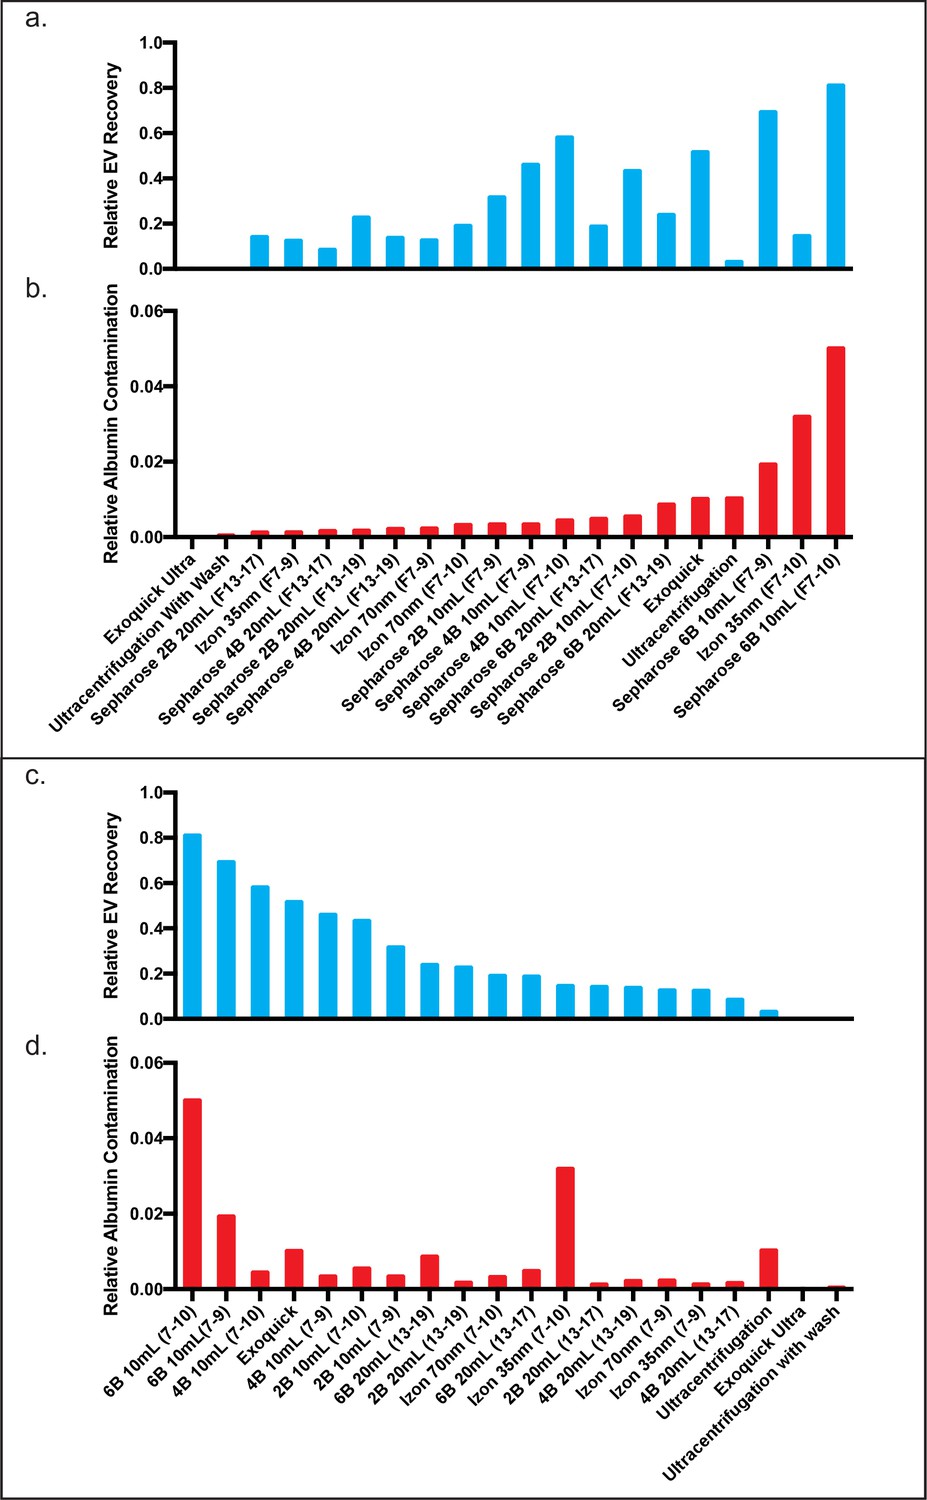
Comparison of EV recovery and albumin contamination across all tested methods in CSF.
Comparison of plasma EV recovery and albumin contamination in CSF across all tested methods ranked by EV recovery. Relative EV recoveries were calculated by individually normalizing each tetraspanin to the sum of the tetraspanins in all fractions (Konoshenko et al., 2018; Théry et al., 2018; Sódar et al., 2016; Welton et al., 2015; Lee et al., 2019; Webber and Clayton, 2013; Johnsen et al., 2019; Simonsen, 2017; Osteikoetxea et al., 2015; Visnovitz et al., 2019; Lucchetti et al., 2020; Kuiper et al., 2021; Welsh et al., 2020; Coumans et al., 2017b; Rissin et al., 2010; Cohen and Walt, 2019) in the 10 ml Sepharose CL-6B condition. The three tetraspanin percentages were then averaged to calculate the relative EV recoveries. Similarly, albumin for each condition was calculated as a fraction of the albumin found in all fractions (Konoshenko et al., 2018; Théry et al., 2018; Sódar et al., 2016; Welton et al., 2015; Lee et al., 2019; Webber and Clayton, 2013; Johnsen et al., 2019; Simonsen, 2017; Osteikoetxea et al., 2015; Visnovitz et al., 2019; Lucchetti et al., 2020; Kuiper et al., 2021; Welsh et al., 2020; Coumans et al., 2017b; Rissin et al., 2010; Cohen and Walt, 2019) in the 10 ml Sepharose CL-6B condition. (a, b) All methods plotted in order of albumin contamination. (c, d) All methods plotted in order of EV recovery. CSF, cerebrospinal fluid; EV, extracellular vesicle.
Figure 4—figure supplement 3
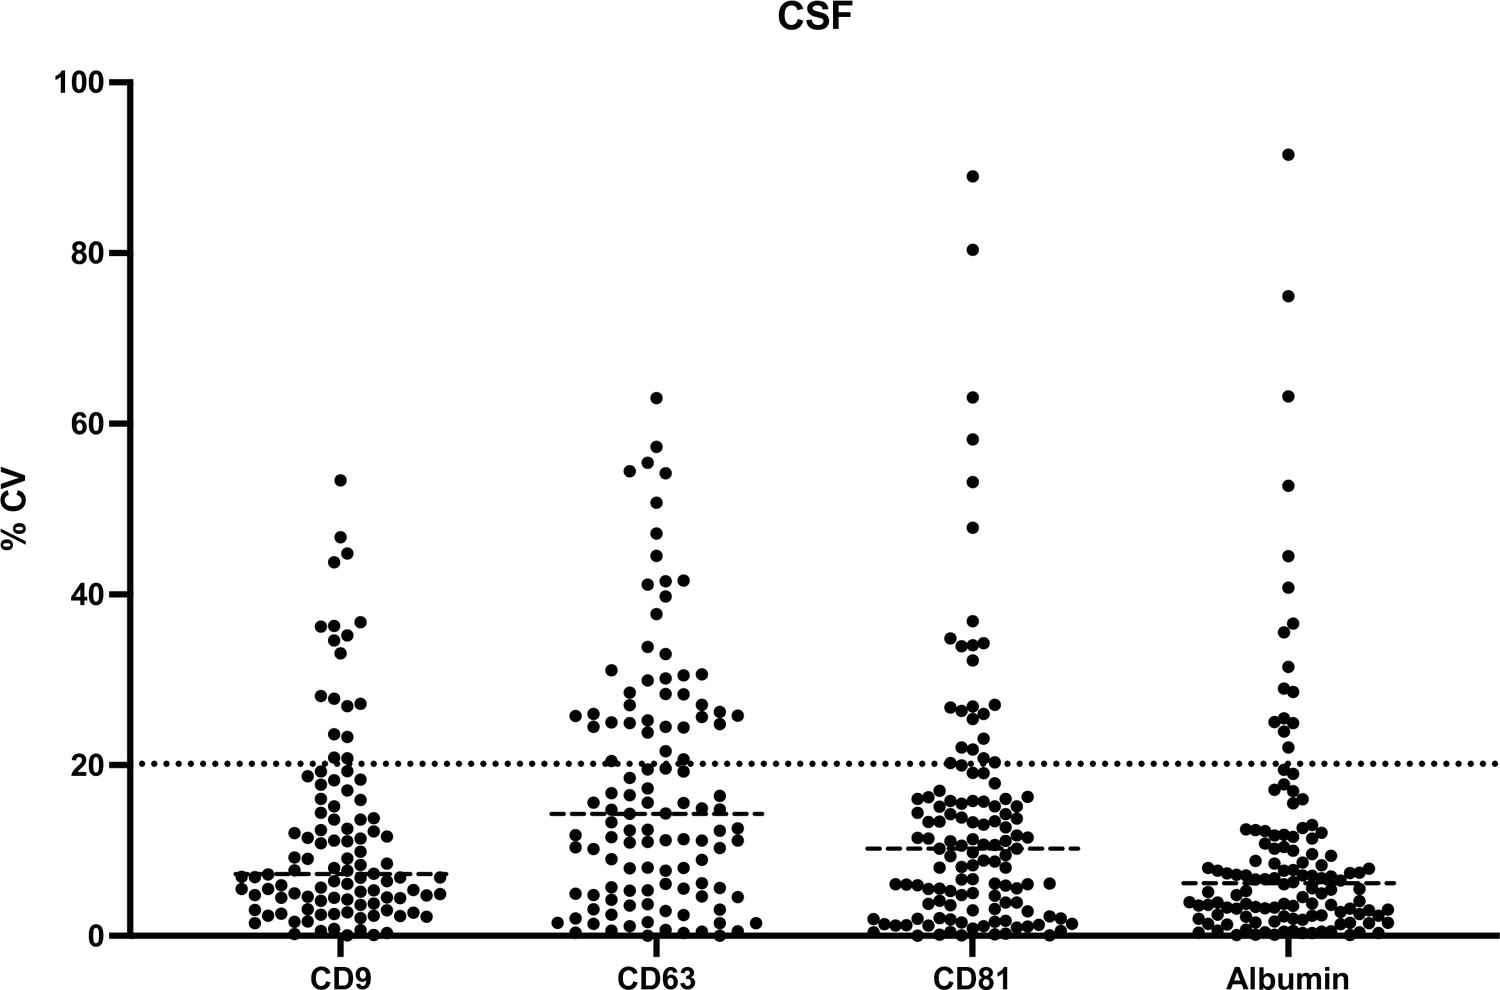
Coefficients of variation (CVs) across all tested methods in CSF.
Figure 5
Comparison of top custom SEC methods in plasma and CSF.
Error bars represent the standard deviations from four replicates of each column. (a–c). Individual tetraspanin yields using different isolation methods from plasma. (d) Relative EV recoveries from plasma were calculated by first normalizing individual tetraspanin values (in pM) in each technique to those of the Sepharose CL-2B 10 ml column (fractions 7–10) and then averaging the three tetraspanin ratios. (e) Albumin levels using different EV isolation methods from plasma. (f) EV purity for each method in plasma is calculated as the ratio of the sum of tetraspanin concentrations divided by albumin concentration. (g–i) Individual tetraspanin yield using different isolation methods from CSF. (j) Relative EV recoveries in CSF were calculated by first normalizing individual tetraspanin values (in pM) in each technique to those of Sepharose CL-2B 10 ml (fractions 7–10) and then averaging the three tetraspanin ratios. (k) Albumin levels using different EV isolation methods from CSF. (l) EV purity for each method in CSF is calculated as the ratio of the sum of tetraspanin concentrations divided by albumin concentration. CSF, cerebrospinal fluid; EV, extracellular vesicle; SEC, size exclusion chromatography.
-
Figure 5—source data 1
Top SEC methods in new batches of plasma and CSF.
- https://cdn.elifesciences.org/articles/70725/elife-70725-fig5-data1-v2.xlsx
Tables
Table 1
Recommendations for SEC columns for EV isolation from plasma and CSF.
| High yield | High purity | |
|---|---|---|
| Plasma | Sepharose CL-6B10 ml column fractions 7–10 | Sepharose CL-4B20 ml column fractions 14–17 |
| CSF | Sepharose CL-6B10 ml column fractions 7–10 | Sepharose CL-4B10 ml column fractions 7–10 |
Key resources table
| Reagent type (species) or resource | Designation | Source or reference | Identifiers | Additional information |
|---|---|---|---|---|
| Biological sample (human) | Plasma | BioIVT | Cat #HUMANPLK2PNN | Pooled gender, K2EDTA |
| Biological sample (human) | Cerebrospinal fluid | BioIVT | Cat# HMNCSFR-NODXR | Pooled gender, no diagnosis remnant |
| Antibody | Anti-CD9 (Mouse monoclonal) | MilliporeSigma | Cat# CBL162RRID:AB_2075914 | WB (1:1000) |
| Antibody | Anti-CD9 (Rabbit monoclonal) | Abcam | Cat# ab195422RRID:AB_2893477 | Simoa capture |
| Antibody | Anti-CD9 (Mouse monoclonal) | Abcam | Cat# ab58989RRID:AB_940926 | Simoa detector |
| Antibody | Anti-CD63 (Mouse monoclonal) | BD | Cat# 556019RRID:AB_396297 | Simoa detector;WB (1:1000) |
| Antibody | Anti-CD63 (Mouse monoclonal) | R&D Systems | Cat# MAB5048RRID:AB_2275726 | Simoa capture |
| Antibody | Anti-CD81 (Mouse monoclonal) | Thermo Fisher Scientific | Cat# 10630DRRID:AB_2532984 | WB (1:666) |
| Antibody | Anti-CD81 (Mouse monoclonal) | Abcam | Cat# ab79559RRID:AB_1603682 | Simoa capture |
| Antibody | Anti-CD81 (Mouse monoclonal) | BioLegend | Cat# 349502RRID:AB_10643417 | Simoa detector |
| Commercial assay or kit | Human Serum Albumin DuoSet ELISA | R&D Systems | Cat# DY1455 | Simoa capture and detector |
| Peptide, recombinant protein | CD9 | Abcam | Cat# ab152262 | |
| Peptide, recombinant protein | CD63 | Origene | Cat# TP301733 | |
| Peptide, recombinant protein | CD81 | Origene | Cat# TP317508 | |
| Peptide, recombinant protein | Albumin | Abcam | Cat# ab201876 | |
| Commercial assay or kit | ExoQuick exosome precipitation solution | SBI | Cat# EXOQ5A-1 | |
| Commercial assay or kit | ExoQuick ULTRA EV isolation kit for plasma and serum | SBI | Cat# EQULTRA-20A-1 | |
| Commercial assay or kit | qEVoriginal 70 nm | Izon | Cat# SP1 | |
| Commercial assay or kit | qEVoriginal 35 nm | Izon | Cat# SP5 | |
| Other | Sepharose CL-2B | Cytiva | Cat# 17014001 | |
| Other | Sepharose CL-4B | Cytiva | Cat# 17015001 | |
| Other | Sepharose CL-6B | Cytiva | Cat# 17016001 |
Additional files
-
Transparent reporting form
- https://cdn.elifesciences.org/articles/70725/elife-70725-transrepform1-v2.docx
-
Source data 1
All data combined.
- https://cdn.elifesciences.org/articles/70725/elife-70725-supp1-v2.xlsx
Download links
A two-part list of links to download the article, or parts of the article, in various formats.
Downloads (link to download the article as PDF)
Open citations (links to open the citations from this article in various online reference manager services)
Cite this article (links to download the citations from this article in formats compatible with various reference manager tools)
Framework for rapid comparison of extracellular vesicle isolation methods
eLife 10:e70725.
https://doi.org/10.7554/eLife.70725


