A conditional gene-based association framework integrating isoform-level eQTL data reveals new susceptibility genes for schizophrenia
- Program in Bioinformatics, Zhongshan School of Medicine and The Fifth Affiliated Hospital, Sun Yat-sen University, China
- Key Laboratory of Tropical Disease Control (Sun Yat-sen University), Ministry of Education, China
- Center for Precision Medicine, Sun Yat-sen University, China
- Research Center of Medical Sciences, Guangdong Provincial People's Hospital, Guangdong Academy of Medical Sciences, China
- The Province and Ministry Co-sponsored Collaborative Innovation Center for Medical Epigenetics, Tianjin Medical University, China
- Guangdong Provincial Key Laboratory of Biomedical Imaging and Guangdong Provincial Engineering Research Center of Molecular Imaging, The Fifth Affiliated Hospital, Sun Yat-sen University, China
Figures
Figure 1
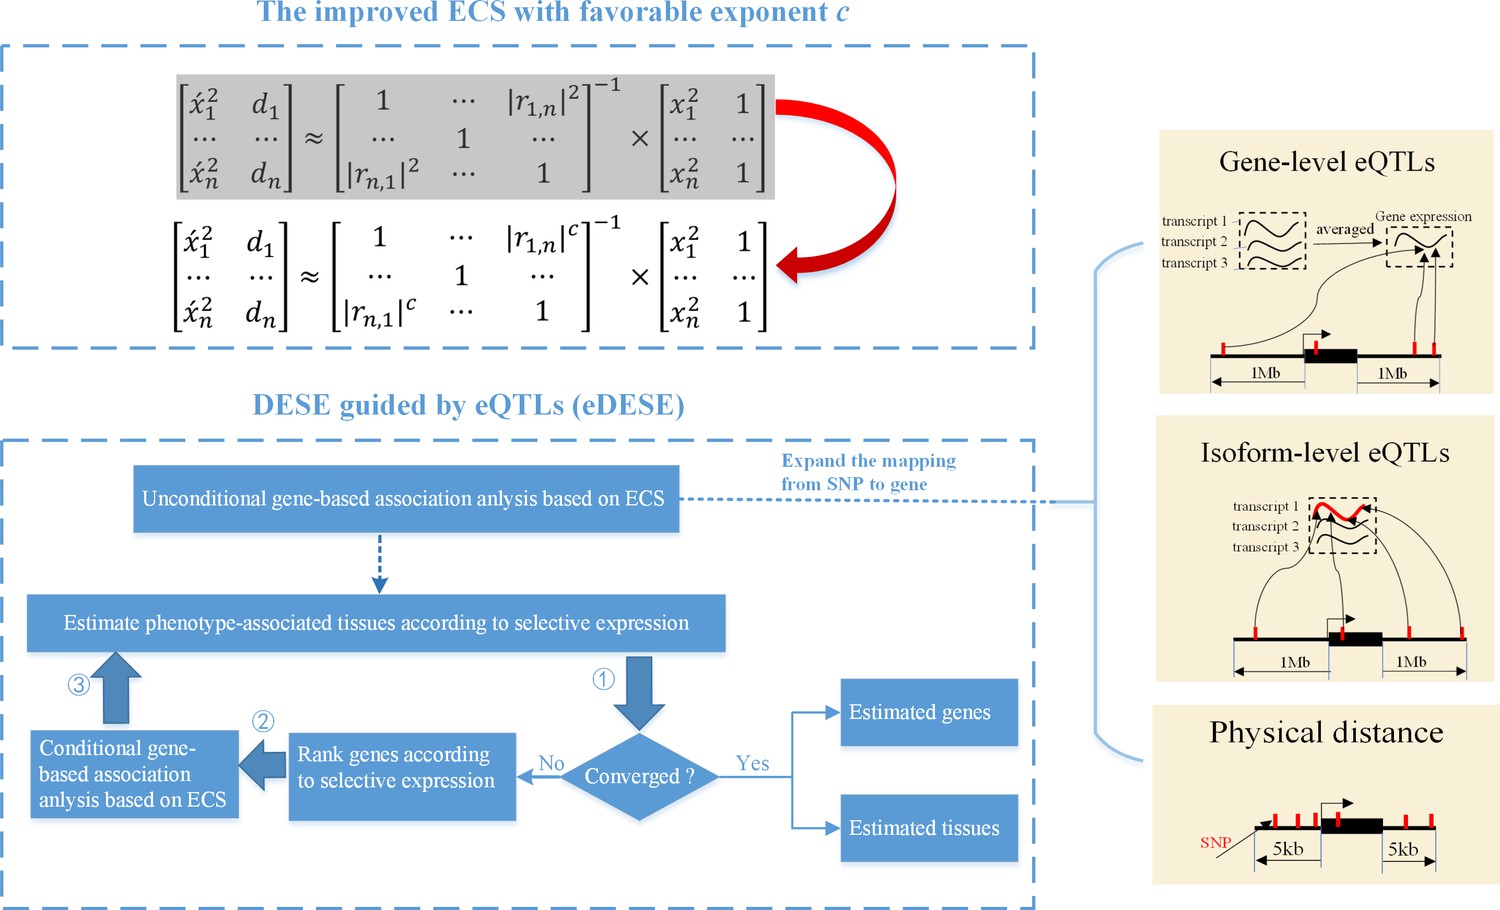
The advantages of eDESE over ECS and DESE.
First, we proposed a new ECS and chose the best exponent c between 1 and 2 to properly control the type I error. Second, we first adopted three strategies to map SNP to genes to perform the unconditional gene-based association analysis with the improved ECS. Then the unconditional gene-based association analysis results were put into the conditional gene-based association analysis and the following iterative procedure. 5 kb: 5000 base pairs. 1 Mb: 106 base pairs.
Figure 2

Q-Q plots of the p-value of the ECS test under null hypothesis based on the two extreme exponents (i.e. 1 and 2).
(a), (b), and (c) represent the variant number of 50, 100, and 500, respectively.
Figure 3
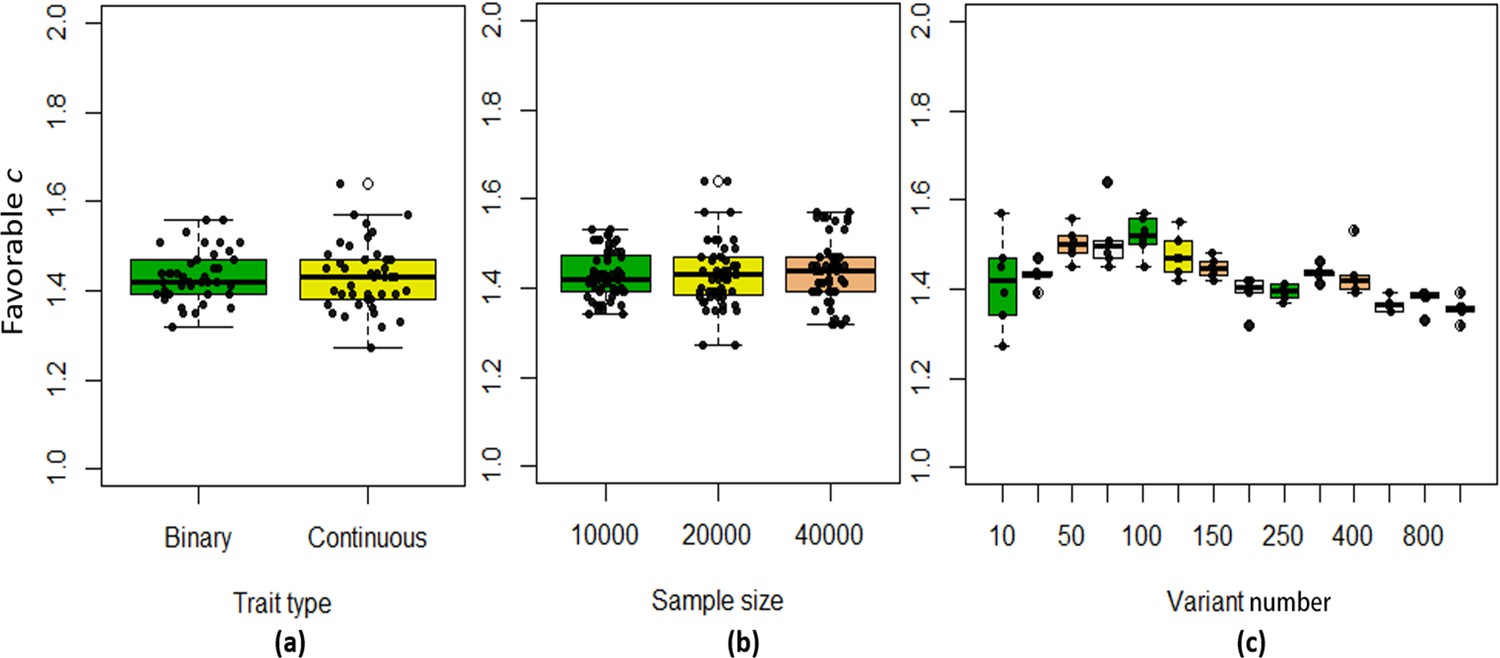
The boxplots of the favorable c values at different simulation scenarios.
(a) Binary and continuous phenotypes; (b) Different sample sizes; (c) Different variant number.
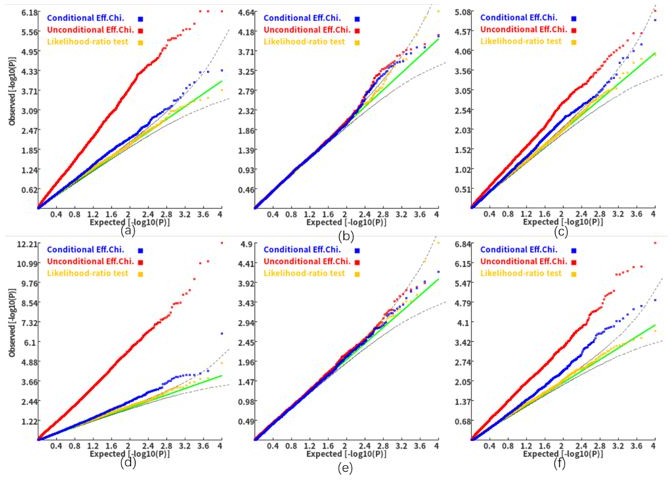
Figure 4
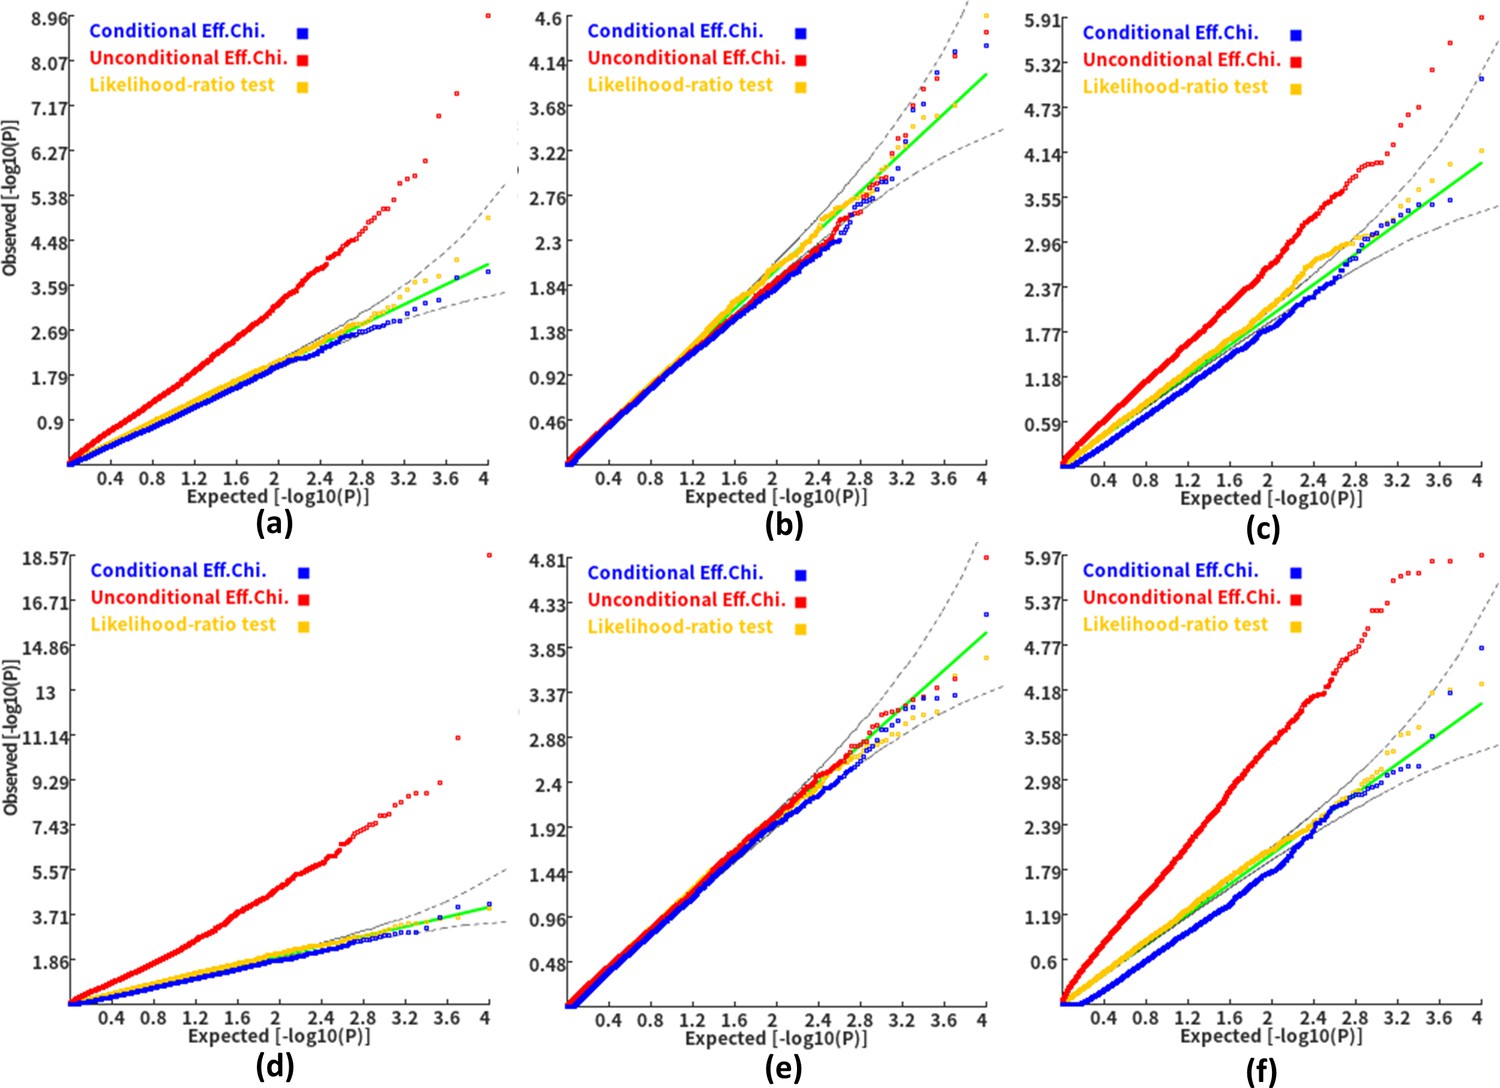
Q-Q plots of the conditional, unconditional gene-based association test and likelihood-ratio test under the null hypothesis.
(a) and (d) two gene-variant pairs with the similar variant number (SIPA1L2 with 29 variants and LOC729336 with 30 variants). (b) and (e) two gene-variant pairs with the different variant number, and the first is larger than the second (CACHD1 with 41 variants and RAVER2 with eight variants). (c) and (f) Two gene-variant pairs with the different variant number, and the second is larger than the first (LOC647132 with five variants and FAM5C with 48 variants). (a), (b) and (c) The former gene has no QTL, and QTL explained 0.5 % of heritability in the latter gene. (d), (e) and (f) The former gene has no QTL, and QTL explained 1 % of heritability in the latter gene. Ten thousand phenotype datasets were simulated for each scenario. Unconditional Eff. Chi. (the red) represents unconditional association analysis at the former gene by the improved ECS. Conditional Eff. Chi (the blue) represents conditional association analysis at the former gene conditioning on the latter gene by the improved ECS. The likelihood ratio test (the yellow) was conducted based on the nested linear regression models.
Figure 5
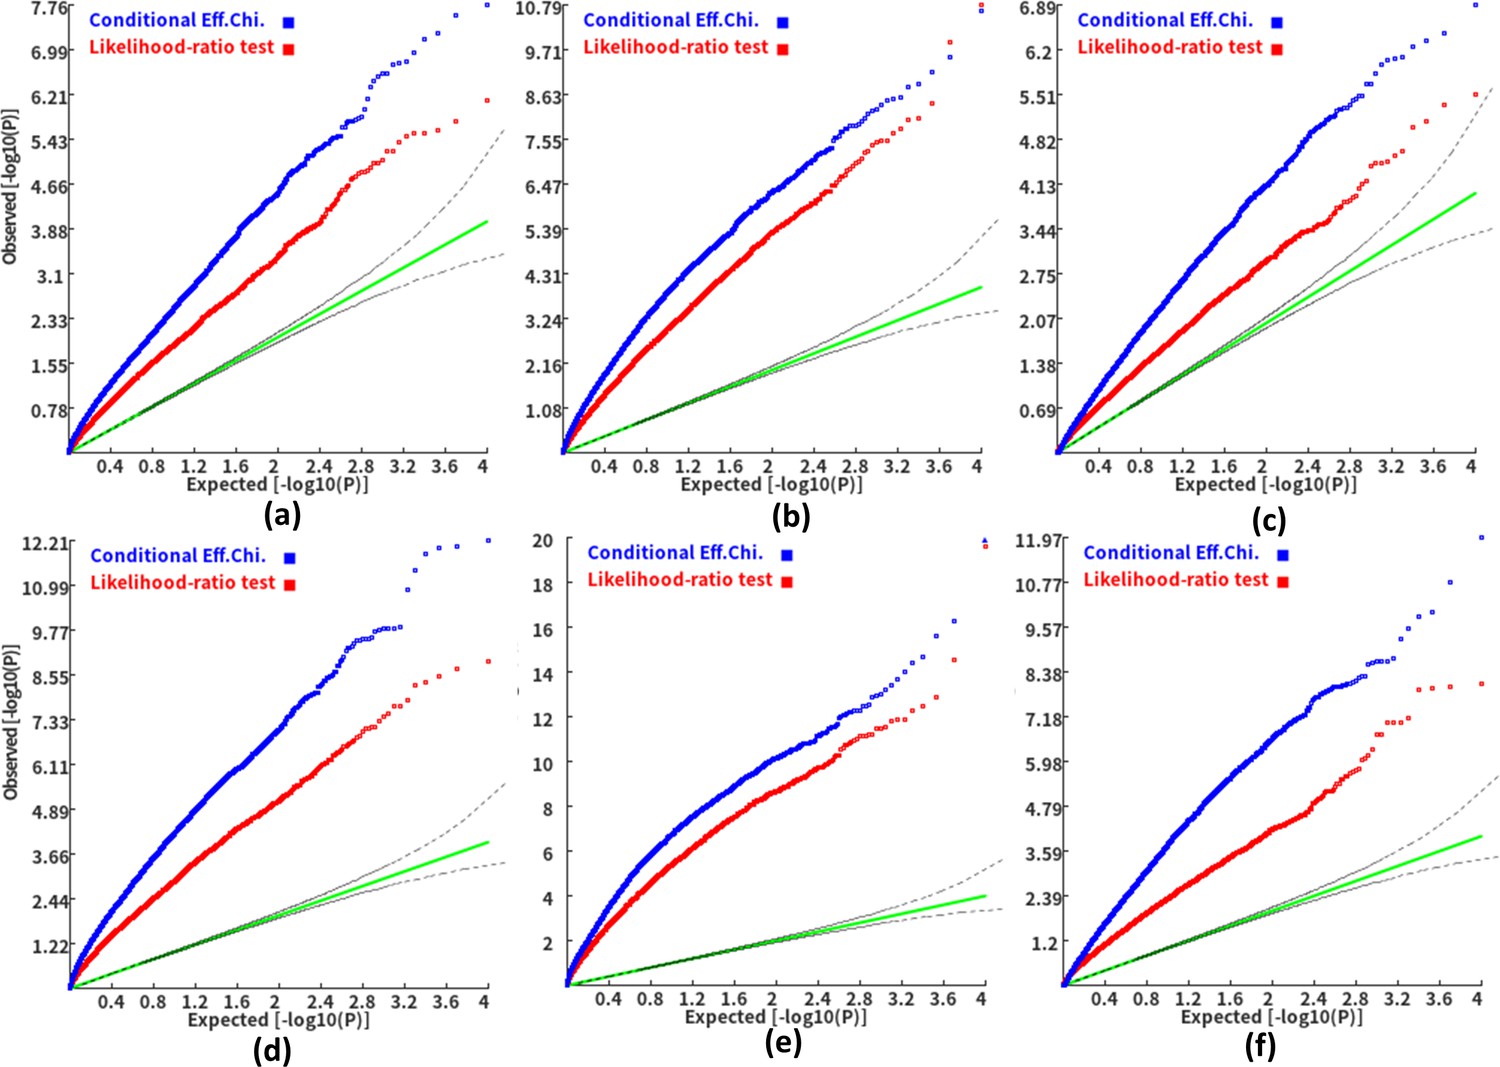
Q-Q plots of the conditional gene-based association test and likelihood-ratio test at different representative gene-variant pairs.
The variant number of the two gene-variant pairs involved in (a)-(f) are the same as that in Figure 4 legend. The difference is: in (a)-(c), the QTL in either gene (former and latter) explained 0.25% of heritability. In (d)-(f), the QTL in either gene explained 0.5% of heritability. One thousand phenotype datasets were simulated for each scenario.
Figure 6

The comparison of the potential susceptibility genes for schizophrenia identified by MAGMA and eDESE:dist.
(a) The Venn diagram shows the overlapped and unique genes identified by MAGMA and eDESE:dist. (b) The bar plot shows the top GO enrichment terms of the overlapped genes. MF: Molecular Function of GO. BP: Biological Process terms of GO. CC: Cellular Component terms of GO. The x-axis label represents the top ( ≤ 10) significant GO enrichment terms (MF, BP, and CC). The y-axis label represents the negative log10 of the adjusted p-value of each term. See also Figure 6—source data 1, Figure 6—source data 2 and Figure 6—source data 3.
-
Figure 6—source data 1
Significant genes identified by MAGMA.
- https://cdn.elifesciences.org/articles/70779/elife-70779-fig6-data1-v1.xlsx
-
Figure 6—source data 2
Significant genes identified by eDESE:dist.
- https://cdn.elifesciences.org/articles/70779/elife-70779-fig6-data2-v1.xlsx
-
Figure 6—source data 3
Enrichment results of the common 105 genes identified by MAGMA and eDESE:dist.
- https://cdn.elifesciences.org/articles/70779/elife-70779-fig6-data3-v1.xlsx
Figure 7
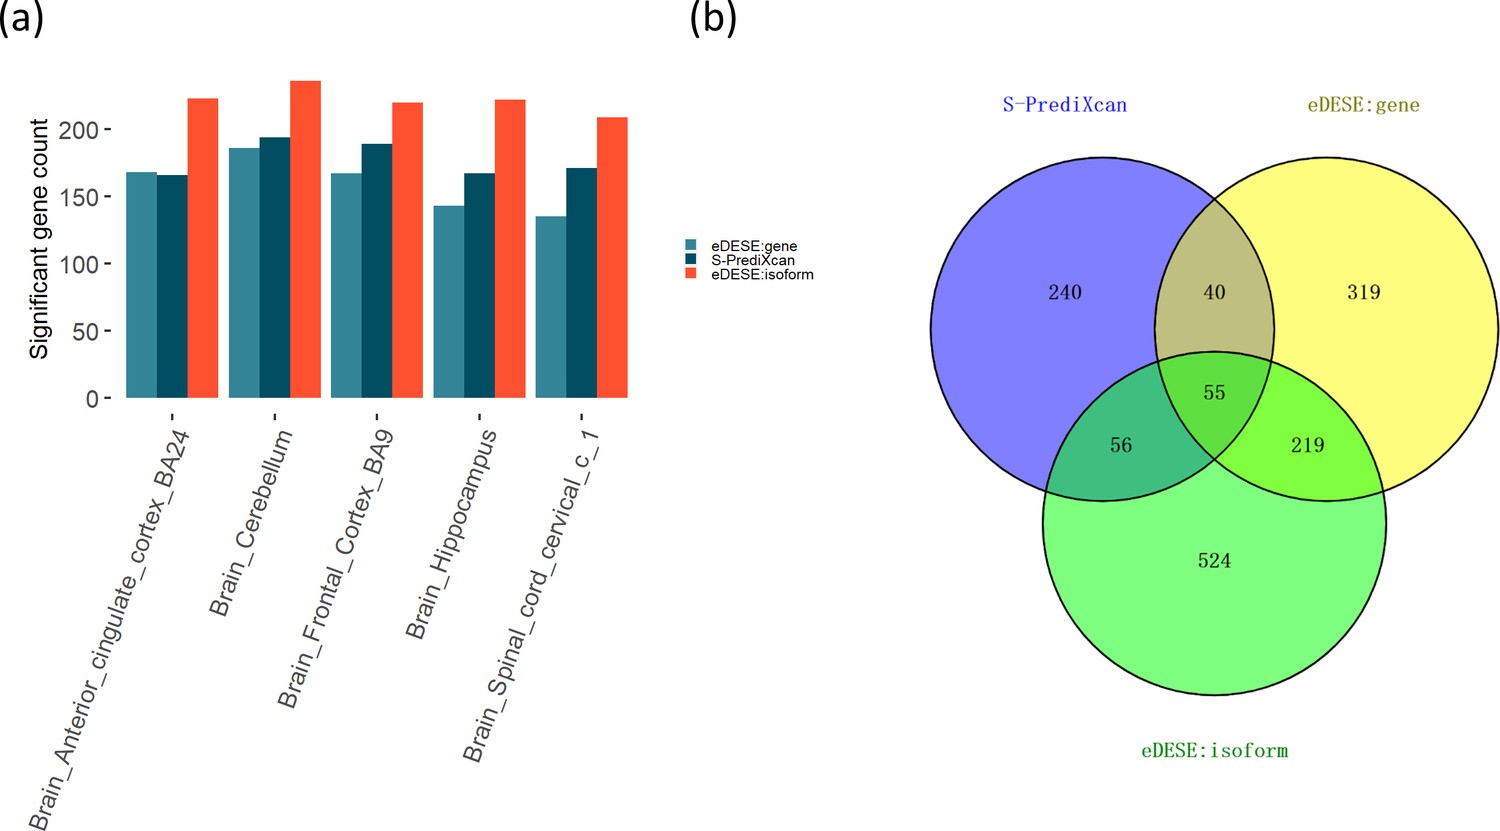
Comparison of the potential susceptibility genes identified by S-PrediXcan, eDESE:gene, and eDESE:isoform.
(a) The bar plot shows the count of potential susceptibility genes in each of the five optimized brain regions. (b) The Venn diagram shows the count of the overlapped and unique genes identified by S-PrediXcan, eDESE:gene and eDESE:isoform in the five optimized brain regions. See also Figure 7—source data 1 and Figure 7—source data 2.
-
Figure 7—source data 1
The count of potential susceptibility genes in each of the five optimized brain regions.
- https://cdn.elifesciences.org/articles/70779/elife-70779-fig7-data1-v1.xlsx
-
Figure 7—source data 2
The potential susceptibility genes identified by S-PrediXcan, eDESE:gene and eDESE:isoform in the five optimized brain regions.
- https://cdn.elifesciences.org/articles/70779/elife-70779-fig7-data2-v1.xlsx
Figure 8
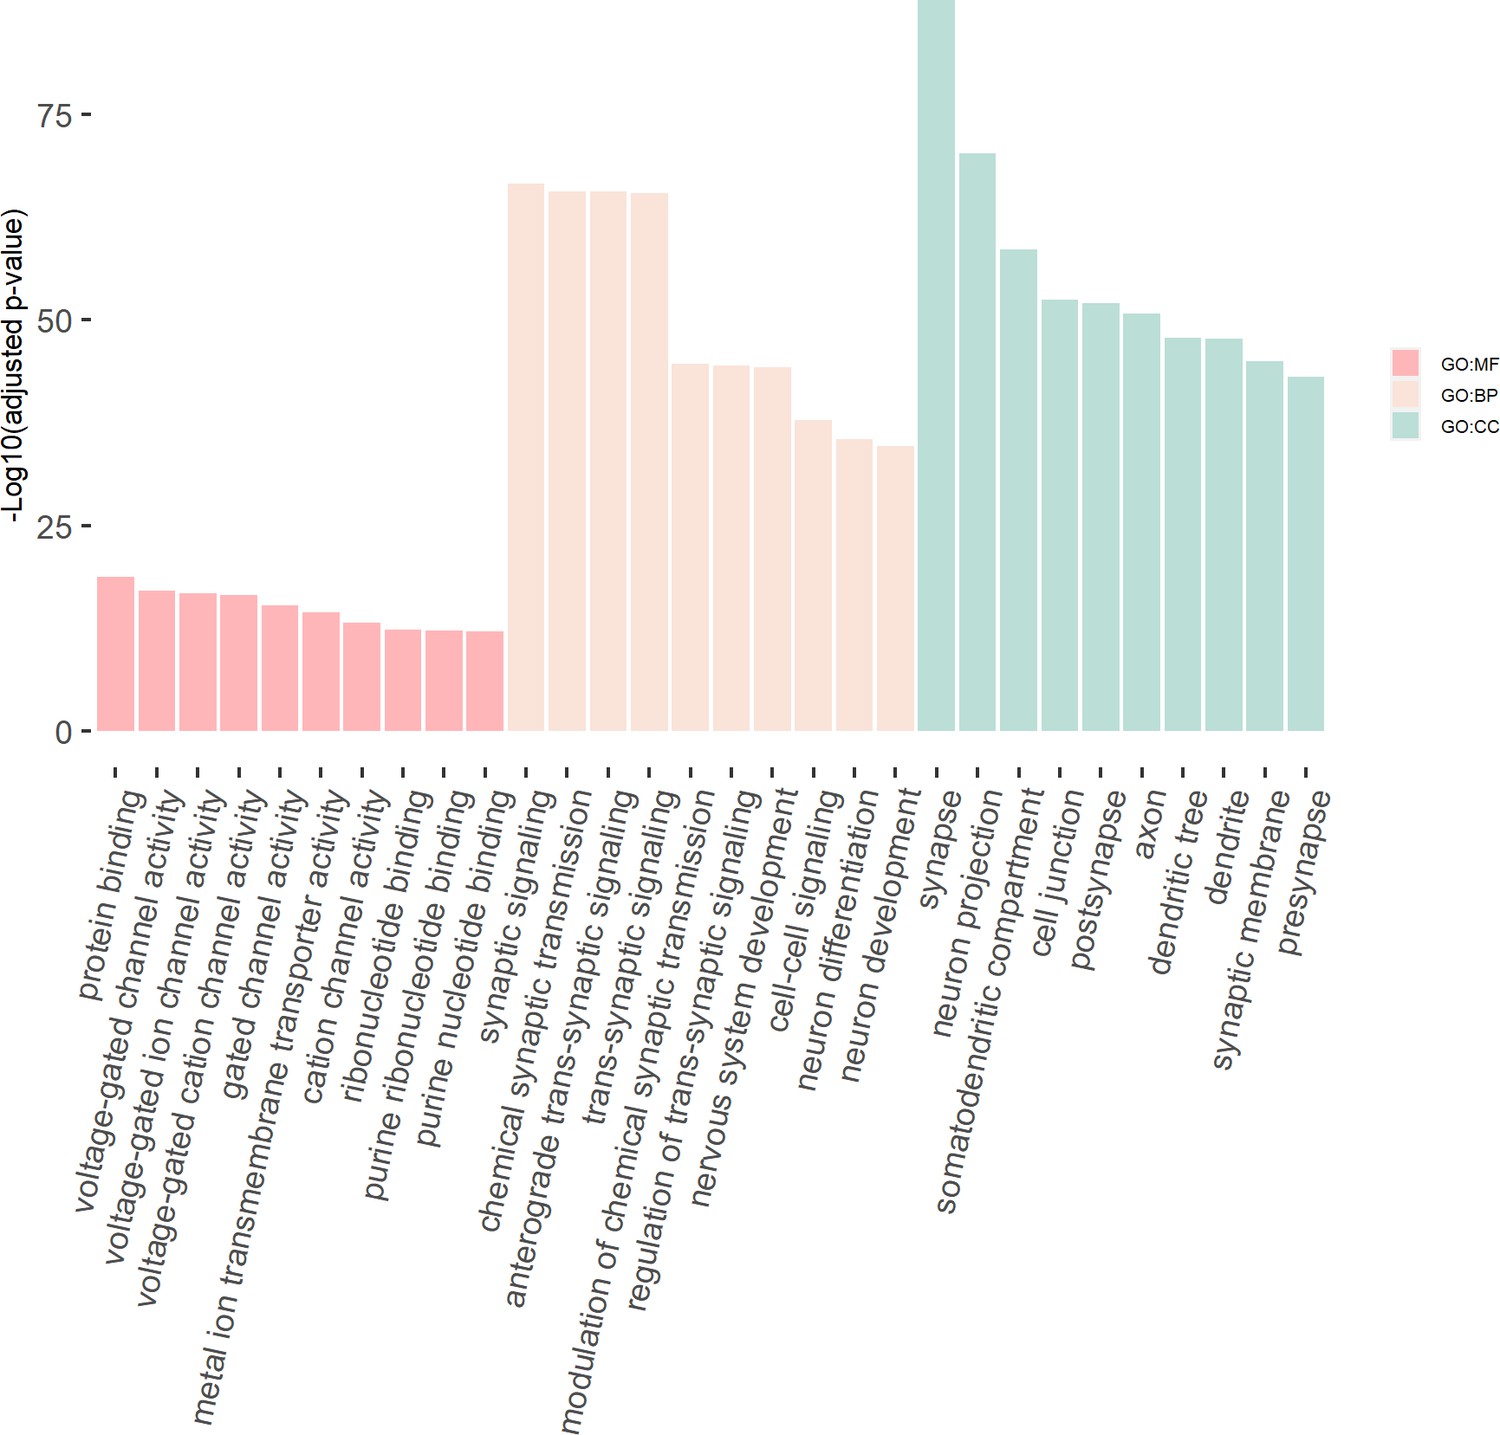
The GO enrichment terms of the genes in the consensus module (colored ‘turquoise’).
The x-axis label represents the top (≤10) significant GO enrichment terms (in MF, BP, and CC). The y-axis label represents the negative log10 of the adjusted p-value of each term. See also Figure 8—source data 1 and Figure 8—source data 2.
-
Figure 8—source data 1
Genes in the consensus module (colored "turquoise").
- https://cdn.elifesciences.org/articles/70779/elife-70779-fig8-data1-v1.xlsx
-
Figure 8—source data 2
Enrichment results of the genes in the consensus module (colored ‘turquoise’).
- https://cdn.elifesciences.org/articles/70779/elife-70779-fig8-data2-v1.xlsx
Figure 9
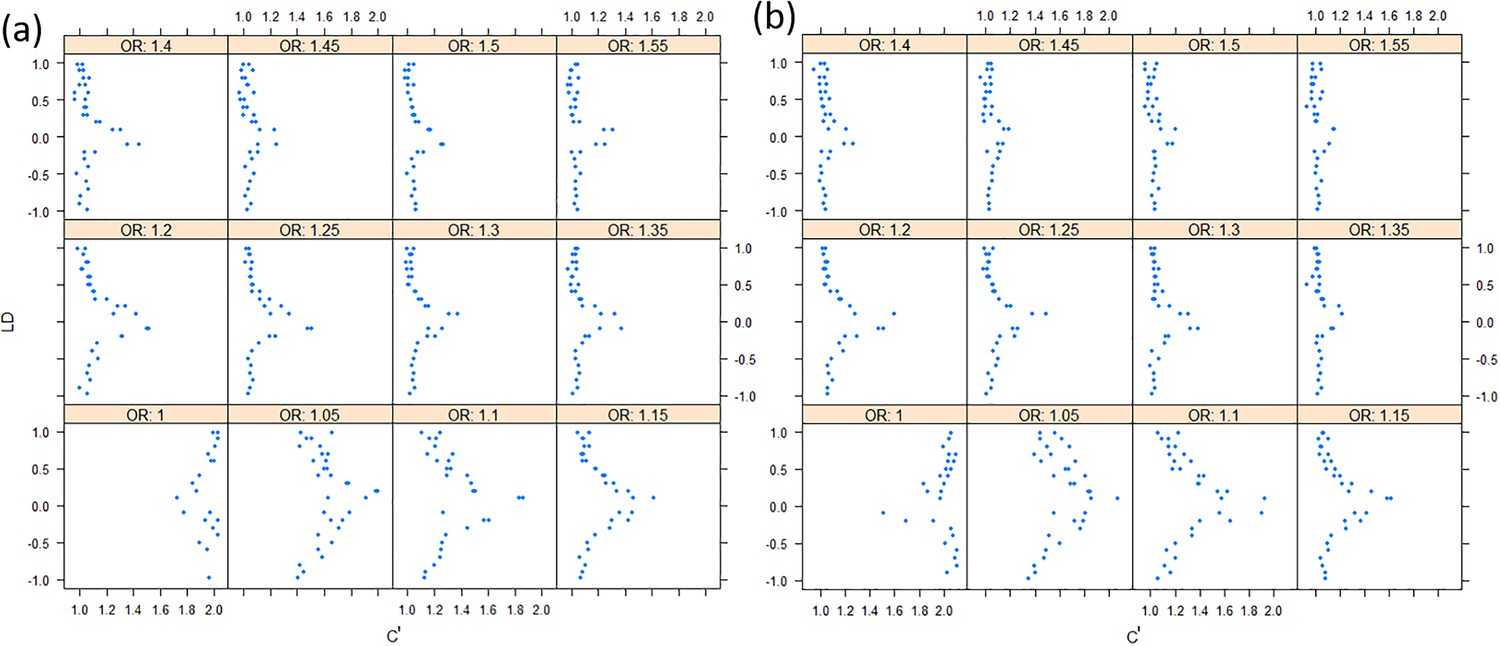
The effect sizes of variants to the correlation of chi-squares.
(a) Under the additive model; (b) Under the multiplicative model. The allele frequencies are assigned randomly.
Author response image 1
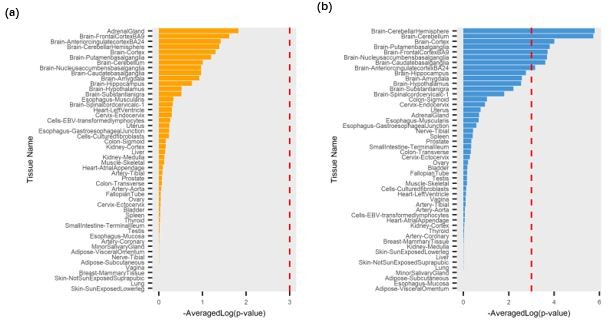
The tissue importance generated by eDESE:gene based on the tissue-specific eQTLs.
(a) Brain-Front Cortex (BA9); (b) Brain-Cerebellum. The red dotted lines denote the significant threshold.
Author response image 2
Q-Q plots of the conditional, unconditional gene-based association test and likelihood-ratio test under the null hypothesis (c=1.8).
(a) and (d), two gene-variant pairs with the similar variant number (SIPA1L2 with 29 variants and LOC729336 with 30 variants). (b) and (e): two gene-variant pairs with different variant numbers, and the first is larger than the second (CACHD1 with 41 variants and RAVER2 with eight variants). (c) and (f): two gene-variant pairs with different variant numbers, and the second is larger than the first (LOC647132 with five variants and FAM5C with 48 variants). (a), (b) and (c): the former gene has no QTL, and QTL explained 0.5% of heritability in the latter gene. (d), (e) and (f): the former gene has no QTL, and QTL explained 1% of heritability in the latter gene. Ten thousand phenotype datasets were simulated for each scenario. Unconditional Eff. Chi. (the red) represents unconditional association analysis at the former gene by the improved ECS. Conditional Eff. Chi (the blue) represents conditional association analysis at the former gene conditioning on the latter gene by the improved ECS. The likelihood ratio test (the yellow) was conducted based on the nested linear regression models.
Tables
Table 1
Type I error and power of different simulation scenarios in association analysis.
| Scenarios | Important parameters | Binary trait | Continuous trait | ||||||||||
|---|---|---|---|---|---|---|---|---|---|---|---|---|---|
| Eg | Vgp | Vge | AllVar | IsoeQTL | GeneQTL | Gen3eQTL | Gen6eQTL | AllVar | IsoeQTL | GeneQTL | Gen3eQTL | Gen6eQTL | |
| Type I error | |||||||||||||
| 1 | 0 | 0 | 0.05 | 0 | 0 | 0 | 0 | 0.002 | 0 | 0 | 0.001 | 0.002 | 0.003 |
| 2 | 0 | 0 | 0.15 | 0 | 0.002 | 0.001 | 0 | 0 | 0 | 0 | 0 | 0.001 | 0 |
| 3 | 0 | 0 | 0.3 | 0 | 0 | 0 | 0.002 | 0 | 0 | 0.001 | 0.001 | 0.002 | 0.002 |
| Power | |||||||||||||
| 4 | 0 | 0.005 | 0.05 | 0.251 | 0.036 | 0.022 | 0.034 | 0.031 | 0.246 | 0.032 | 0.019 | 0.032 | 0.038 |
| 5 | 0 | 0.005 | 0.15 | 0.219 | 0.021 | 0.013 | 0.023 | 0.032 | 0.301 | 0.025 | 0.017 | 0.037 | 0.043 |
| 6 | 0 | 0.005 | 0.3 | 0.229 | 0.028 | 0.017 | 0.021 | 0.034 | 0.282 | 0.024 | 0.017 | 0.025 | 0.039 |
| 7 | 0.1 | 0 | 0.05 | 0 | 0.017 | 0.019 | 0.006 | 0.001 | 0 | 0.017 | 0.027 | 0.009 | 0.001 |
| 8 | 0.1 | 0 | 0.15 | 0 | 0.213 | 0.221 | 0.113 | 0.054 | 0.002 | 0.245 | 0.245 | 0.132 | 0.068 |
| 9 | 0.1 | 0 | 0.3 | 0.018 | 0.704 | 0.659 | 0.581 | 0.388 | 0.027 | 0.72 | 0.686 | 0.607 | 0.446 |
| 10 | 0.1 | 0.005 | 0.05 | 0.288 | 0.052 | 0.076 | 0.043 | 0.043 | 0.313 | 0.063 | 0.091 | 0.05 | 0.041 |
| 11 | 0.1 | 0.005 | 0.15 | 0.403 | 0.33 | 0.302 | 0.199 | 0.134 | 0.46 | 0.357 | 0.334 | 0.229 | 0.136 |
| 12 | 0.1 | 0.005 | 0.3 | 0.569 | 0.778 | 0.738 | 0.677 | 0.485 | 0.62 | 0.805 | 0.774 | 0.712 | 0.512 |
-
Eg denotes the effect size of gene expression on phenotype. Vgp denotes phenotype variance explained by all variants. Vge denotes gene expression variance explained by all variants.
Table 2
The result about whether the brain was optimized as the schizophrenia-associated tissue based on each brain region’s gene/isoform-level eQTLs.
| Brain regions | Gene-level eQTL | Isoform-level eQTL |
|---|---|---|
| Brain-Anterior cingulate cortex (BA24) | Yes | Yes |
| Brain-Cerebellum | Yes | Yes |
| Brain-Frontal Cortex (BA9) | Yes | Yes |
| Brain-Hippocampus | Yes | Yes |
| Brain-Spinal cord (cervical c-1) | Yes | Yes |
| Brain-Amygdala | Yes | No |
| Brain-Caudate (basal ganglia) | Yes | No |
| Brain-Cerebellar Hemisphere | Yes | No |
| Brain-Cortex | Yes | No |
| Brain-Hypothalamus | Yes | No |
| Brain-Nucleus accumbens (basal ganglia) | Yes | No |
| Brain-Putamen (basal ganglia) | No | No |
| Brain-Substantia nigra | Yes | No |
-
“Yes” denotes that brain (i.e., all thirteen brain tissues) was estimated as the significantly schizophrenia-associated tissue based on the gene/isoform-level eQTLs of the tissue. “No” denotes the contrary. The font names of the optimized brain regions are bold. See also Table 2—source data 1, Table 2—source data 2, Table 2—source data 3 and Table 2—source data 4.
-
Table 2—source data 1
Tissue significance estimated by eDESE:dist based on the gene-level expression profiles.
- https://cdn.elifesciences.org/articles/70779/elife-70779-table2-data1-v1.xlsx
-
Table 2—source data 2
Tissue significance estimated by eDESE:dist based on the isoform-level expression profiles.
- https://cdn.elifesciences.org/articles/70779/elife-70779-table2-data2-v1.xlsx
-
Table 2—source data 3
Tissue significance estimated by eDESE:gene based on the gene-level eQTLs of each brain region.
- https://cdn.elifesciences.org/articles/70779/elife-70779-table2-data3-v1.xlsx
-
Table 2—source data 4
Tissue significance estimated by eDESE:isoform based on the isoform-level eQTLs of each brain region.
- https://cdn.elifesciences.org/articles/70779/elife-70779-table2-data4-v1.xlsx
Table 3
The important examples of potential susceptibility genes exclusively predicted by eDESE:isoform.
| Gene name | # of hits in PubMed |
|---|---|
| RGS4 | > 100 |
| TCF4 | > 100 |
| RANGAP1 | > 100 |
| GRIA1 | 80 |
| GRM3 | 76 |
| TSPO | 39 |
| TPH2 | 35 |
| FEZ1 | 31 |
| ZDHHC8 | 24 |
| VRK2 | 23 |
| KCNN3 | 20 |
| NCAM1 | 20 |
| MIP | 15 |
| SLC39A8 | 14 |
| DLG1 | 14 |
| BDNF-AS | 13 |
| FGA | 13 |
| ADRA1A | 12 |
| MAPT | 10 |
-
Table 3—source data 1
The PubMed search hits of the unique potential susceptibility genes of schizophrenia identified by eDESE:isoform (compared with S-PrediXcan and eDESE:gene).
- https://cdn.elifesciences.org/articles/70779/elife-70779-table3-data1-v1.xlsx
Table 4
The GO enrichment terms of the potential susceptibility genes in each optimized brain region identified by S-PrediXcan, eDESE:gene and eDESE:isoform.
| Tissue name | *S-PrediXcan | eDESE:gene | eDESE:isoform |
|---|---|---|---|
| Brain-Anterior cingulate cortex (BA24) | - | Regulation of gap junction assembly (BP) | Potassium ion transmembrane transporter activity (MF); potassium: chloride symporter activity (MF); nervous system development (BP); generation of neurons (BP); neurogenesis (BP) |
| Brain-Cerebellum | Ion binding (MF); cation binding (MF); metal ion binding (MF); intracellular organelle (CC) | Dendrite (CC); dendritic tree (CC); neuron projection (CC); postsynapse (CC); synapse (CC) | Voltage-gated calcium channel activity involved in cardiac muscle cell action potential (MF); nervous system development (BP) |
| Brain-Frontal Cortex (BA9) | Intracellular organelle (CC); intracellular membrane-bounded organelle (CC) | Somatodendritic compartment (CC); dendrite (CC); dendritic tree (CC); synaptic vesicle membrane (CC); exocytic vesicle membrane (CC) | - |
| Brain-Hippocampus | Ion binding (MF) | - | Postsynaptic density (CC); asymmetric synapse (CC) |
| Brain-Spinal cord (cervical c-1) | - | High voltage-gated calcium channel activity (MF); voltage-gated calcium channel activity involved in AV node cell action potential (MF); regulation of B cell tolerance induction (BP); positive regulation of B cell tolerance induction (BP); L-type voltage-gated calcium channel complex (CC) | Nitrogen compound transport (BP); organelle (CC) |
-
*
MF: Molecular Function terms of GO. BP: Biological Process terms of GO. CC: Cellular Component terms of GO.
Table 5
The target genes of the antipsychotics predicted as the potential susceptibility genes by MAGMA, S-PrediXcan, and eDESE.
| Target gene | Models |
|---|---|
| DRD2 | eDESE:dist & eDESE:gene & eDESE:isoform & MAGMA |
| ADRA1A | eDESE:isoform |
| CHRM3 | eDESE:gene & eDESE:isoform |
| CHRM4 | eDESE:gene & eDESE:isoform& MAGMA |
| OPRD1 | eDESE:dist |
| GABRD | eDESE:isoform |
| CYP2D6 | eDESE:gene & eDESE:isoform& MAGMA & S-PrediXcan |
Table 6
The enrichment of drug-gene interaction terms in DGIdb for the susceptibility genes identified by MAGMA, S-PrediXcan and eDESE.
| Models | # of antipsychotics-gene interaction terms | # of total drug-gene interaction terms | Enrichment p* |
|---|---|---|---|
| MAGMA | 57 | 937 | 1.62e-11 |
| S-PrediXcan | 12 | 452 | 0.33 |
| eDESE:dist | 34 | 279 | 1.56e-15 |
| eDESE:gene | 56 | 968 | 1.65e-10 |
| eDESE:isoform | 70 | 1,104 | 8.74e-15 |
-
*
Enrichment p denotes the p-value of the hypergeometric distribution test. See also Table 6—source data 1, Table 6—source data 2, Table 6—source data 3, Table 6—source data 4, and Table 6—source data 5.
-
Table 6—source data 1
The drug-gene interaction term results of the potential susceptibility genes of schizophrenia identified by MAGMA in DGIdb.
- https://cdn.elifesciences.org/articles/70779/elife-70779-table6-data1-v1.xlsx
-
Table 6—source data 2
The drug-gene interaction term results of the potential susceptibility genes of schizophrenia identified by S-PrediXcan in DGIdb.
- https://cdn.elifesciences.org/articles/70779/elife-70779-table6-data2-v1.xlsx
-
Table 6—source data 3
The drug-gene interaction term results of the potential susceptibility genes of schizophrenia identified by eDESE:dist in DGIdb.
- https://cdn.elifesciences.org/articles/70779/elife-70779-table6-data3-v1.xlsx
-
Table 6—source data 4
The drug-gene interaction term results of the potential susceptibility genes of schizophrenia identified by eDESE:gene in DGIdb.
- https://cdn.elifesciences.org/articles/70779/elife-70779-table6-data4-v1.xlsx
-
Table 6—source data 5
The drug-gene interaction term results of the potential susceptibility genes of schizophrenia identified by eDESE:isoform in DGIdb.
- https://cdn.elifesciences.org/articles/70779/elife-70779-table6-data5-v1.xlsx
Additional files
-
Supplementary file 1
For eDESE analyses.
(a) The schizophrenia potential susceptibility genes identified by eDESE:dist. (b) The GO enrichment results based on the overlapped susceptibility genes identified by MAGMA and eDESE:dist. (c) The PubMed search hits of the schizophrenia potential susceptibility genes identified by MAGMA and eDESE:dist. (d) Tissue significances generated by eDESE:dist based on the gene-level and isoform-level expression profiles. (e) Tissue significances generated by eDESE:gene/isoform using the gene-level and isoform-level eQTLs of Muscle Skeletal and Skin Sun Exposed Lower Leg. (f-h) The schizophrenia potential susceptibility genes identified by S-PrediXcan, eDESE:gene and eDESE:isoform, respectively. (i-k) The PubMed search hits of the combined susceptibility gene set of schizophrenia identified by S-PrediXcan, eDESE:gene and eDESE:isoform, respectively. (l) The GO enrichment results based on the susceptibility genes exclusively predicted by eDESE:isoform. (m) The genes in the consensus module (colored "turquoise") of the brain weighted gene co-expression network. (n) The potential susceptibility isoforms of the 55 overlapped genes. (o) The FDA-approved antipsychotics included in the DGIdb (v4.2.0).
- https://cdn.elifesciences.org/articles/70779/elife-70779-supp1-v1.xlsx
-
Transparent reporting form
- https://cdn.elifesciences.org/articles/70779/elife-70779-transrepform1-v1.docx
Download links
A two-part list of links to download the article, or parts of the article, in various formats.
Downloads (link to download the article as PDF)
Open citations (links to open the citations from this article in various online reference manager services)
Cite this article (links to download the citations from this article in formats compatible with various reference manager tools)
A conditional gene-based association framework integrating isoform-level eQTL data reveals new susceptibility genes for schizophrenia
eLife 11:e70779.
https://doi.org/10.7554/eLife.70779


