Human B cell lineages associated with germinal centers following influenza vaccination are measurably evolving
- Department of Pathology, Yale School of Medicine, United States
- Department of Pathology and Immunology, Washington University School of Medicine, United States
- Worcester Polytechnic Institute, United States
- Department of Immunobiology, Yale School of Medicine, United States
- Department of Zoology, University of Oxford, United Kingdom
- The Andrew M. and Jane M. Bursky Center for Human Immunology and Immunotherapy Programs, Washington University School of Medicine, United States
- Interdepartmental Program in Computational Biology & Bioinformatics, Yale University, United States
Figures
Figure 1 with 5 supplements
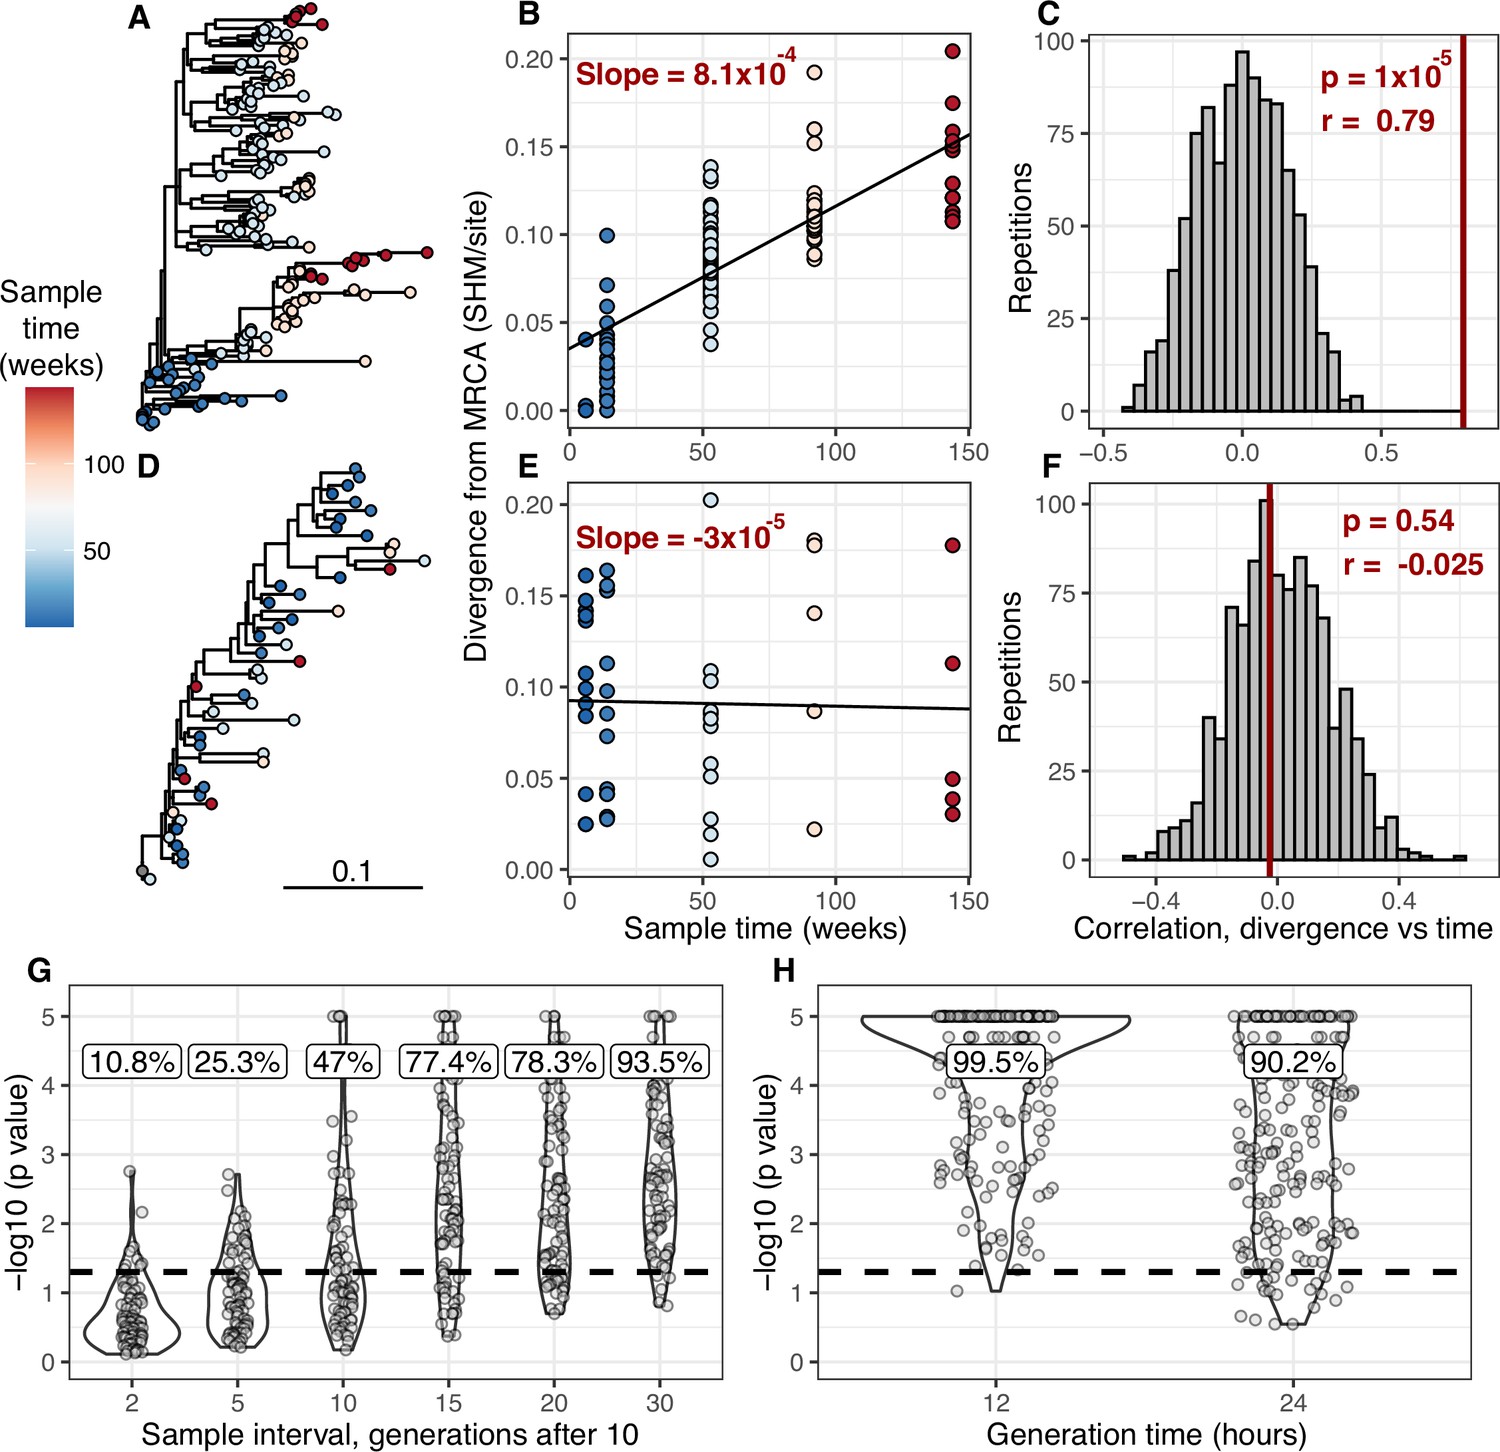
Detecting measurable evolution in B cell lineages.
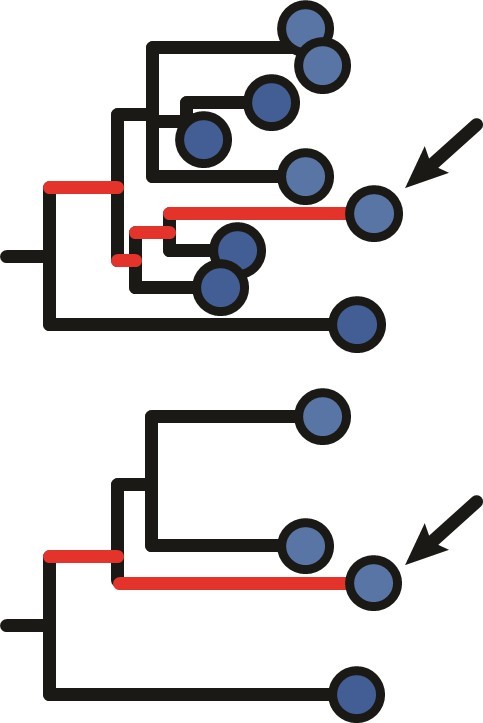
(A) Example B cell lineage tree from Liao et al., 2013 showing increasing divergence with sample time. Branch lengths show somatic hypermutation (SHM)/site according to scale bar in (D). (B) Rate of SHM accumulation over time estimated using a regression of divergence vs time in tree (A). (C) Significance of the relationship between divergence and time estimated using a date randomization test comparing the Pearson’s correlation (r) between divergence and time in tree (A). (D–F) Same plots as (A–C) but on a tree that is not measurably evolving. (G) Simulation-based power analysis shows the permutation test has high power over an interval of at least 10–30 GC cycles (generations). Lineages were sampled once at generation 10, and a second time after the specified number of additional generations have elapsed. Percentage of lineages with p < 0.05 are listed above, rounded to three significant digits. The dotted line corresponds to p = 0.05. (H) Simulation-based analysis reproducing the sampling of Laserson et al., 2014 shows the test has high power even at slow (24 hr) GC cycle times.
Figure 1—figure supplement 1
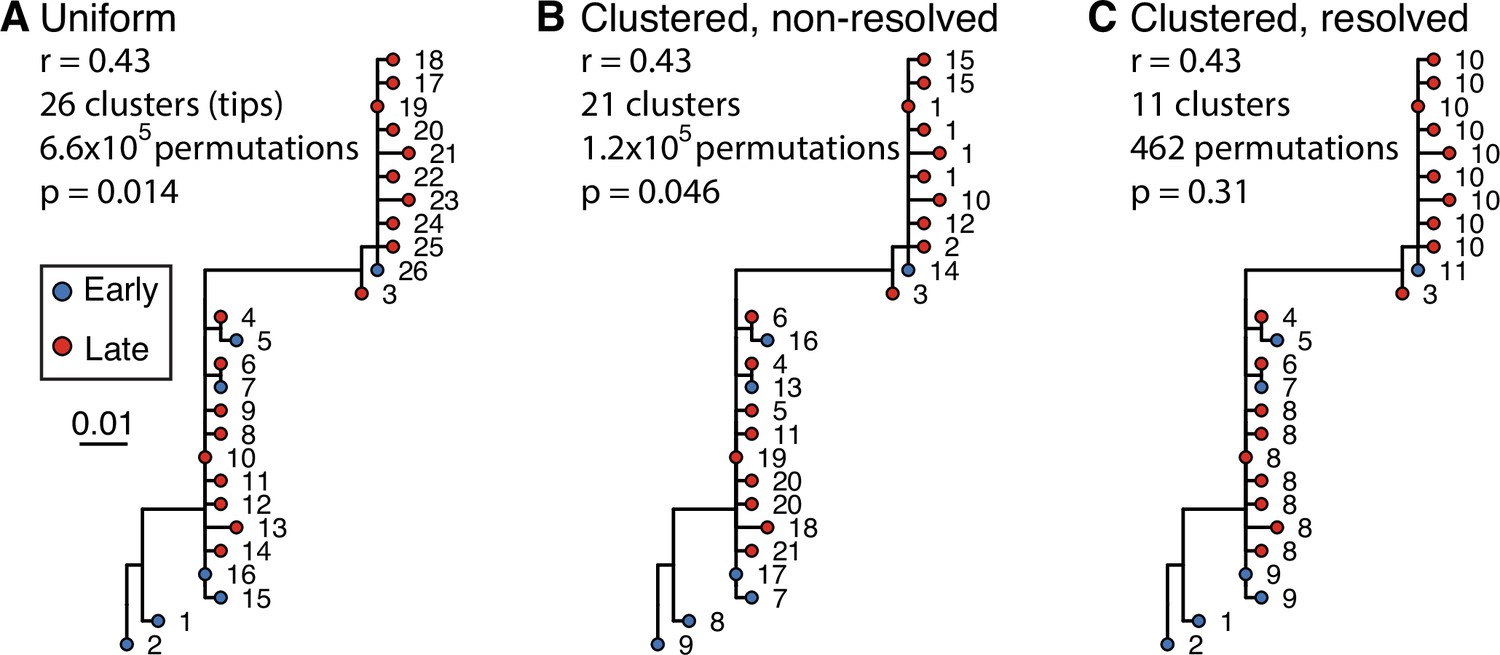
Clustered date randomization and resolution of polytomies.
Example tree showing little evidence of ongoing somatic hypermutation (SHM). This tree contains two large polytomies consisting of multiple short branches radiating out from a central node. These features can possibly result from sequencing error or PCR error in bulk B cell receptor (BCR) data, where errors create spurious, unique sequences one mutation away from a single real sequence. Permuting these tips uniformly among each other leads to these spurious tips being treated as independent data points, and can lead to high false positive rates if not corrected. While visual inspection of this tree shows little evidence of increase in SHM over time, it has a date randomization test p < 0.05 unless its polytomies are resolved. In the panels above, each tip is a sequence labeled with its cluster assignment. (A) Tips are permuted individually, meaning each tip is a separate cluster. This leads to 6.6 × 10⁵ distinct permutations of time labels along the tree, and a p < 0.05. (B) Tips belonging to single-timepoint monophyletic clades are grouped into clusters, equivalent to Murray et al., 2016. Timepoints are permuted among these clusters, which reduces the number of possible permutations. This also reduces the significance of the relationship between divergence and time. However, because the polytomies are randomly resolved into bifurcations with zero-length branches, each polytomy has multiple clusters with the same timepoint. For instance, clusters 1, 15, 10, 12, and 2 could be grouped in the same cluster but are kept distinct. (C) Bifurcations using zero-length branches within the polytomies are rearranged to give the fewest possible number of monophyletic single-timepoint clusters. Resolving polytomies effectively treats same-timepoint sequences within polytomies as the same data point, appropriately showing this tree does not have sufficient evidence of measurable evolution.
Figure 1—figure supplement 2
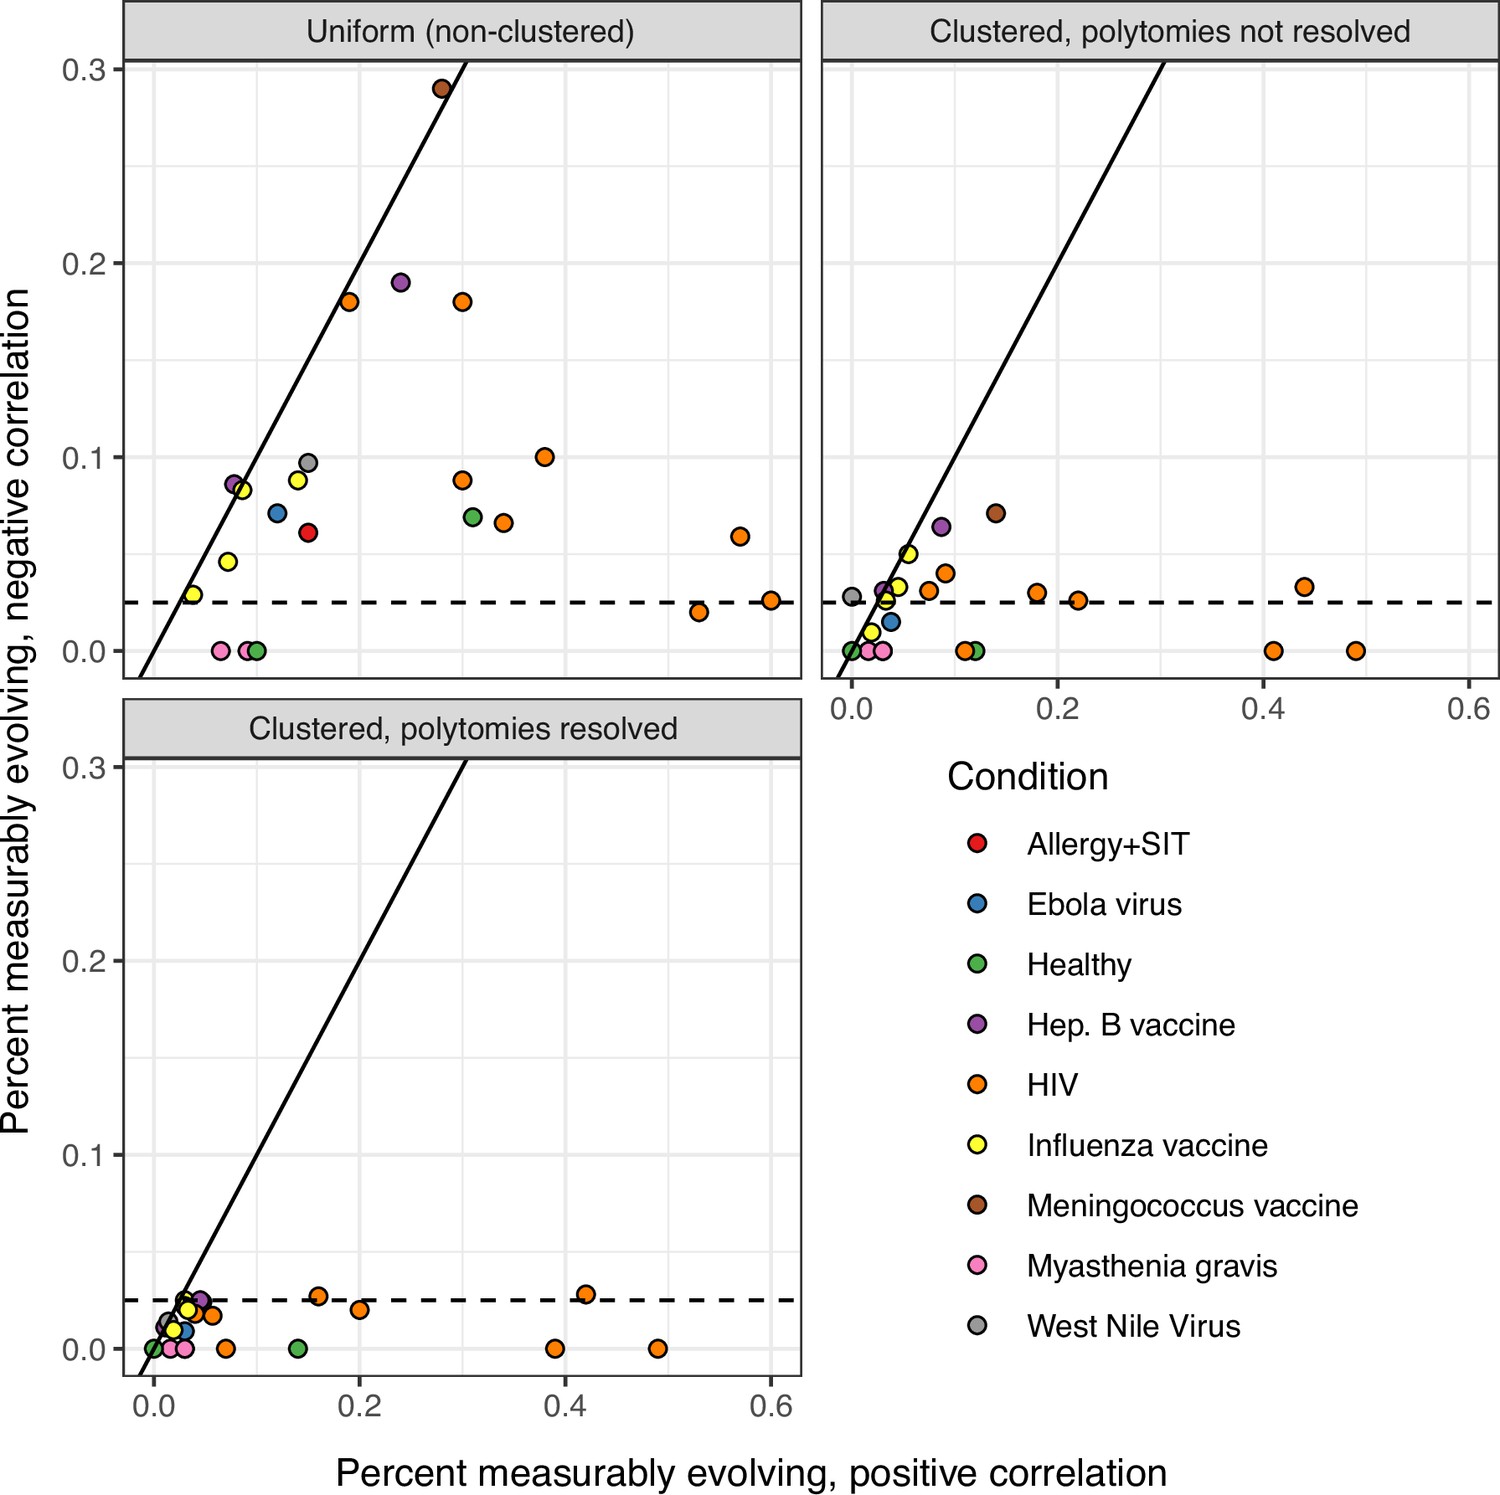
Comparison of date randomization strategies.
The date randomization test can be performed using either uniform permutations, in which the timepoint of each tip is permuted separately, or clustered permutations, in which timepoints are permuted among single-timepoint monophyletic clusters. It can also be performed using clusters after polytomies have been resolved into the smallest possible number of single-timepoint clades. Using a two-tailed test, we determine whether a lineage is positively measurably evolving (correlation between divergence and time > 0, p < 0.025) or negatively measurably evolving (correlation < 0, p < 0.025). Measurable negative evolution indicates decreasing divergence over time, which is biologically implausible and likely represents false positives. This could be due to population structure at different timepoints. See Murray et al., 2016. In the panels above, we repeated the analyses in Table 1 using two-tailed tests with each permutation strategy. The x axis shows the percent of positively measurably evolving lineages for each study, while the y axis shows the percent of negatively measurably evolving lineages, which are interpreted as false positives. The dashed line shows 2.5%, the maximum expected percent of negatively evolving lineages. Only clustered permutations with resolved polytomies – used in all other analyses in this manuscript – fully controlled this error metric.
Figure 1—figure supplement 3
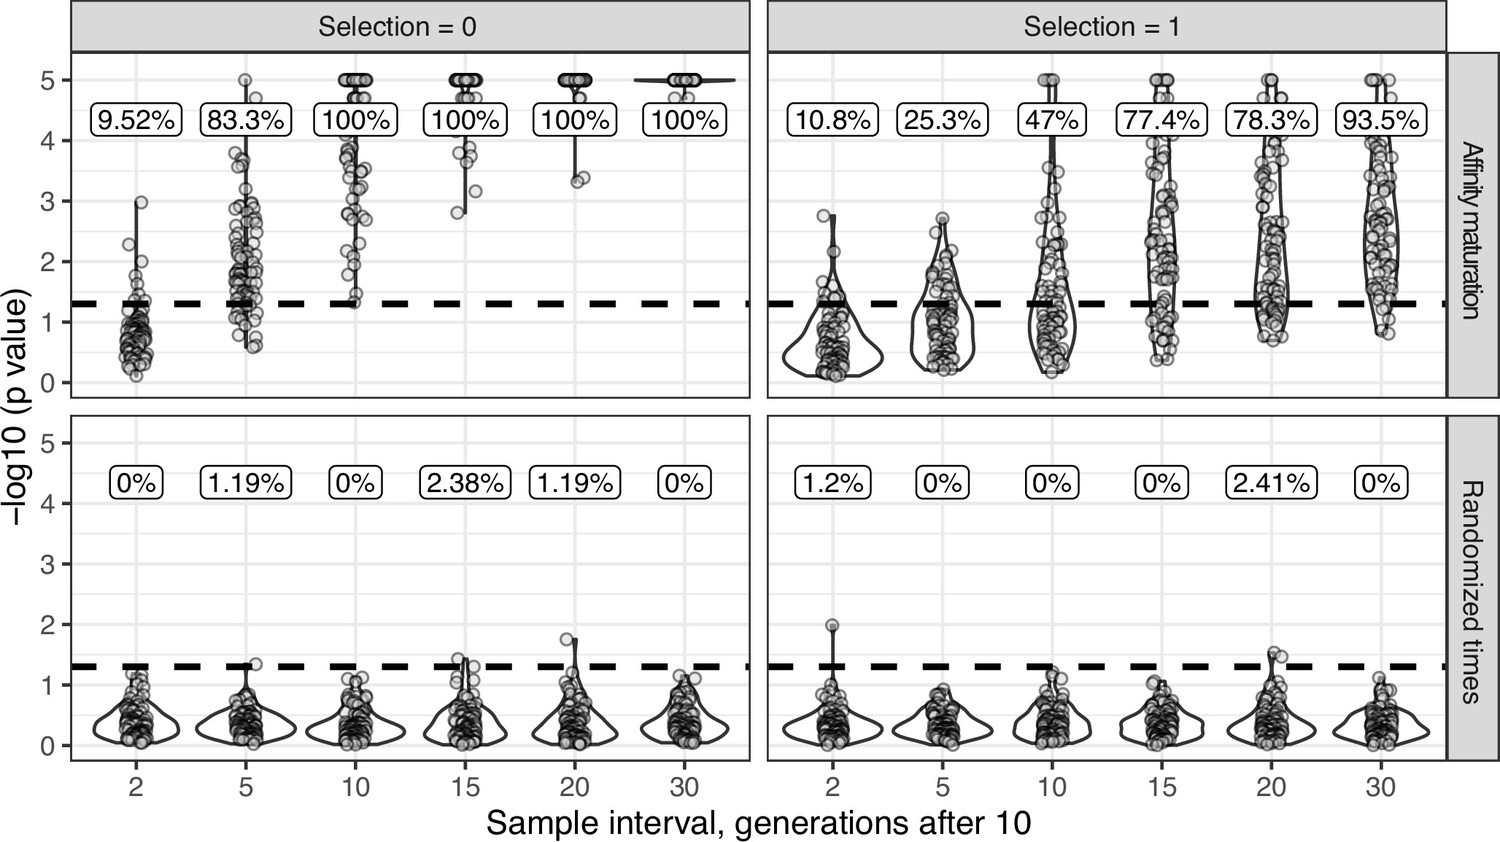
Simulation-based power analysis.
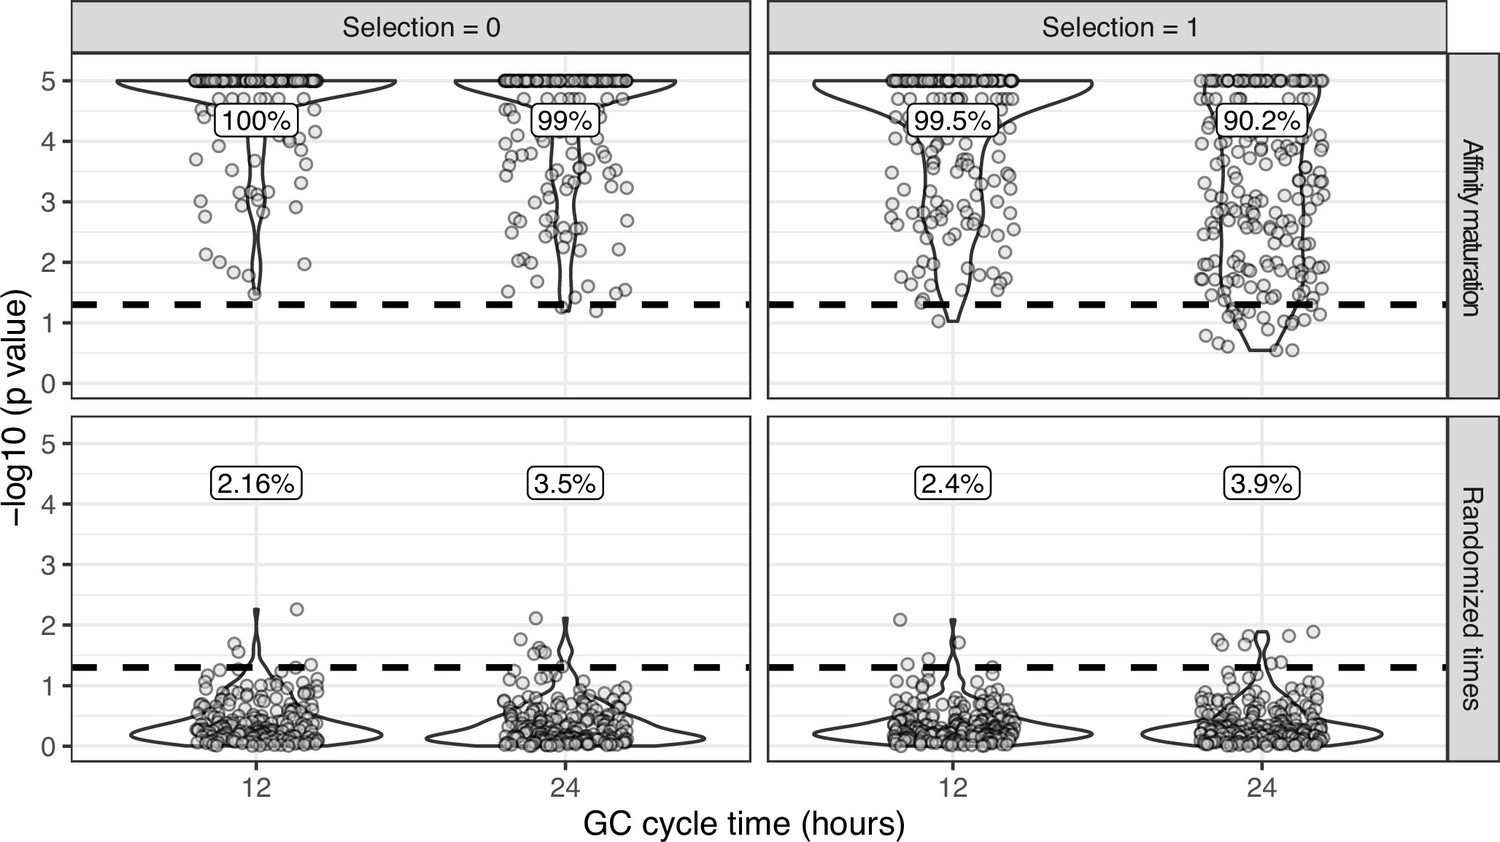
For upper panels (affinity maturation) each lineage was simulated for 10 GC cycles before 50 cells were sampled, if available. Affinity maturation continued for the specified number of additional GC cycles (x axis) before a second sampling of 50 cells. This process was repeated for 100 repetitions for the specified number of GC cycles, and given the specified strength of selection. Selection = 0 corresponds to neutral evolution, while selection = 1 corresponds to strong selection for matching to a single target sequence. Default parameters from bcr-phylo (Davidsen and Matsen, 2018; Ralph and Matsen, 2020) were used otherwise. The y axis shows the −log10(p value) for the date randomization test, with dots above the horizontal dashed line representing measurably evolving lineages (p < 0.05). The percentage of measurably evolving lineages for each set of simulations is shown above the dashed line, rounded to three significant digits. Only simulated lineages with a minimum possible p < 0.05 were tested in simulations. Because all lineages were undergoing affinity maturation in the upper panels, this corresponds to the true positive rate. Lower panels (randomized times) show results from the same simulated data but with sampling times randomized among sequences. Because these simulations are effectively not evolving over time, the numbers above show the false positive rate in the lower panels.
Figure 1—figure supplement 4
Simulation-based power analysis recreating experimental sampling design.
Simulations were performed to replicate the sampling strategy of Laserson et al., 2014, in which an individual was sampled at six timepoints between 1 and 28 days following influenza vaccination. We excluded prevaccination samples as well as the sample taken 1 hr after vaccination because it was too early for any GC cycles to occur in simulations. For each simulation, we selected a lineage C from subject hu420143. To calculate the number of GC cycles to simulate, we divided the sample times (hours postvaccination) of lineage C by the specified GC cycle time (x axis). We then simulated affinity maturation as in Figure 1—figure supplement 3 , and sampled the same number of cells as were present in C at the corresponding time. We repeated this process for each lineage in subject hu420143 with at least 15 sequences sampled over 3 weeks and a minimum possible p value <0.05. The percentage of measurably evolving lineages for each set of simulations is shown above the dashed line, rounded to three significant digits. Only simulated lineages with a minimum possible p < 0.05 were tested in simulations. Because all lineages in the upper panels (affinity maturation) were undergoing affinity maturation, this corresponds to the true positive rate. Lower panels (randomized times) show results from the same simulated data but with sampling times randomized among sequences. Because these simulations are effectively not evolving over time, the numbers above show the false positive rate in the lower panels.
Figure 1—figure supplement 5
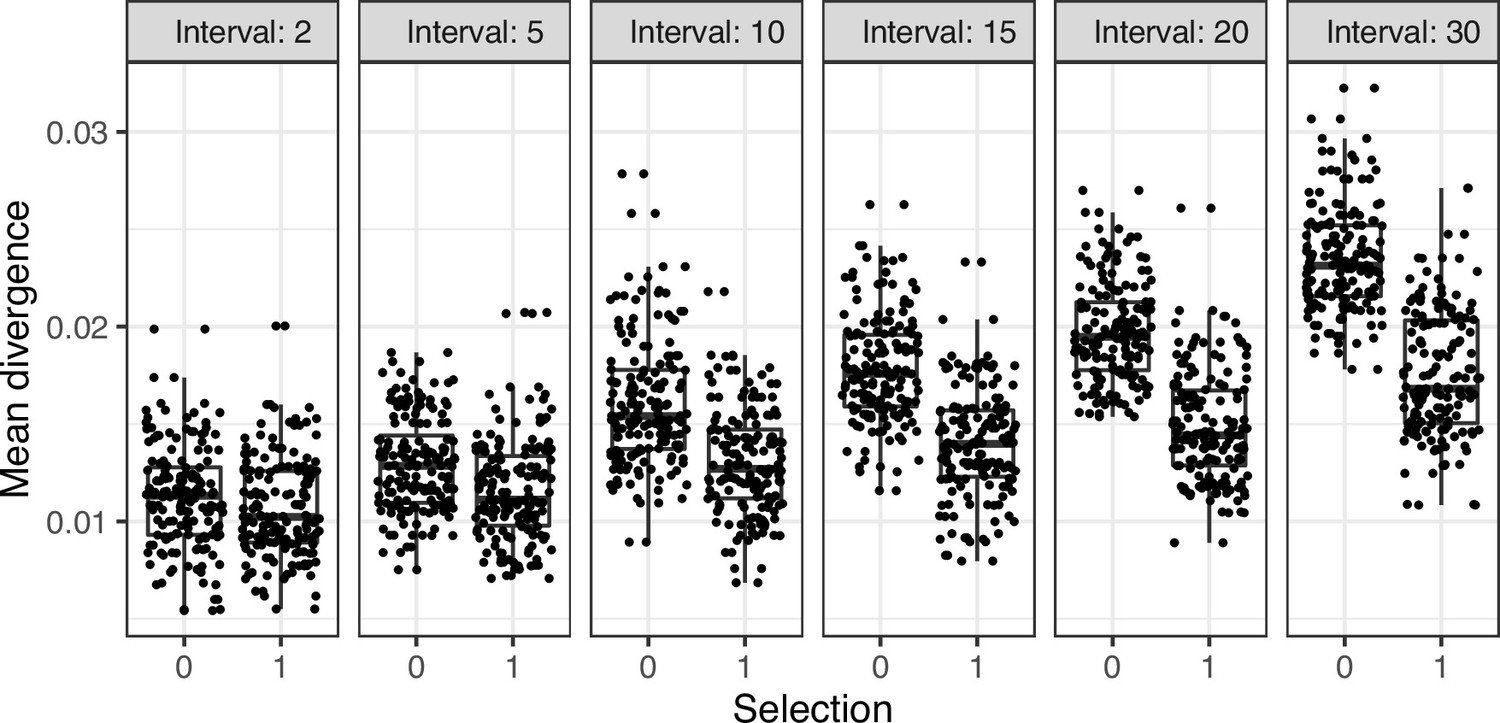
Mean divergence of lineages from simulations in Figure 1—figure supplement 3 under neutral evolution (selection = 0) or strong selection (selection = 1).
Figure 2 with 4 supplements
Measurable evolution in B cell lineages across time and conditions.
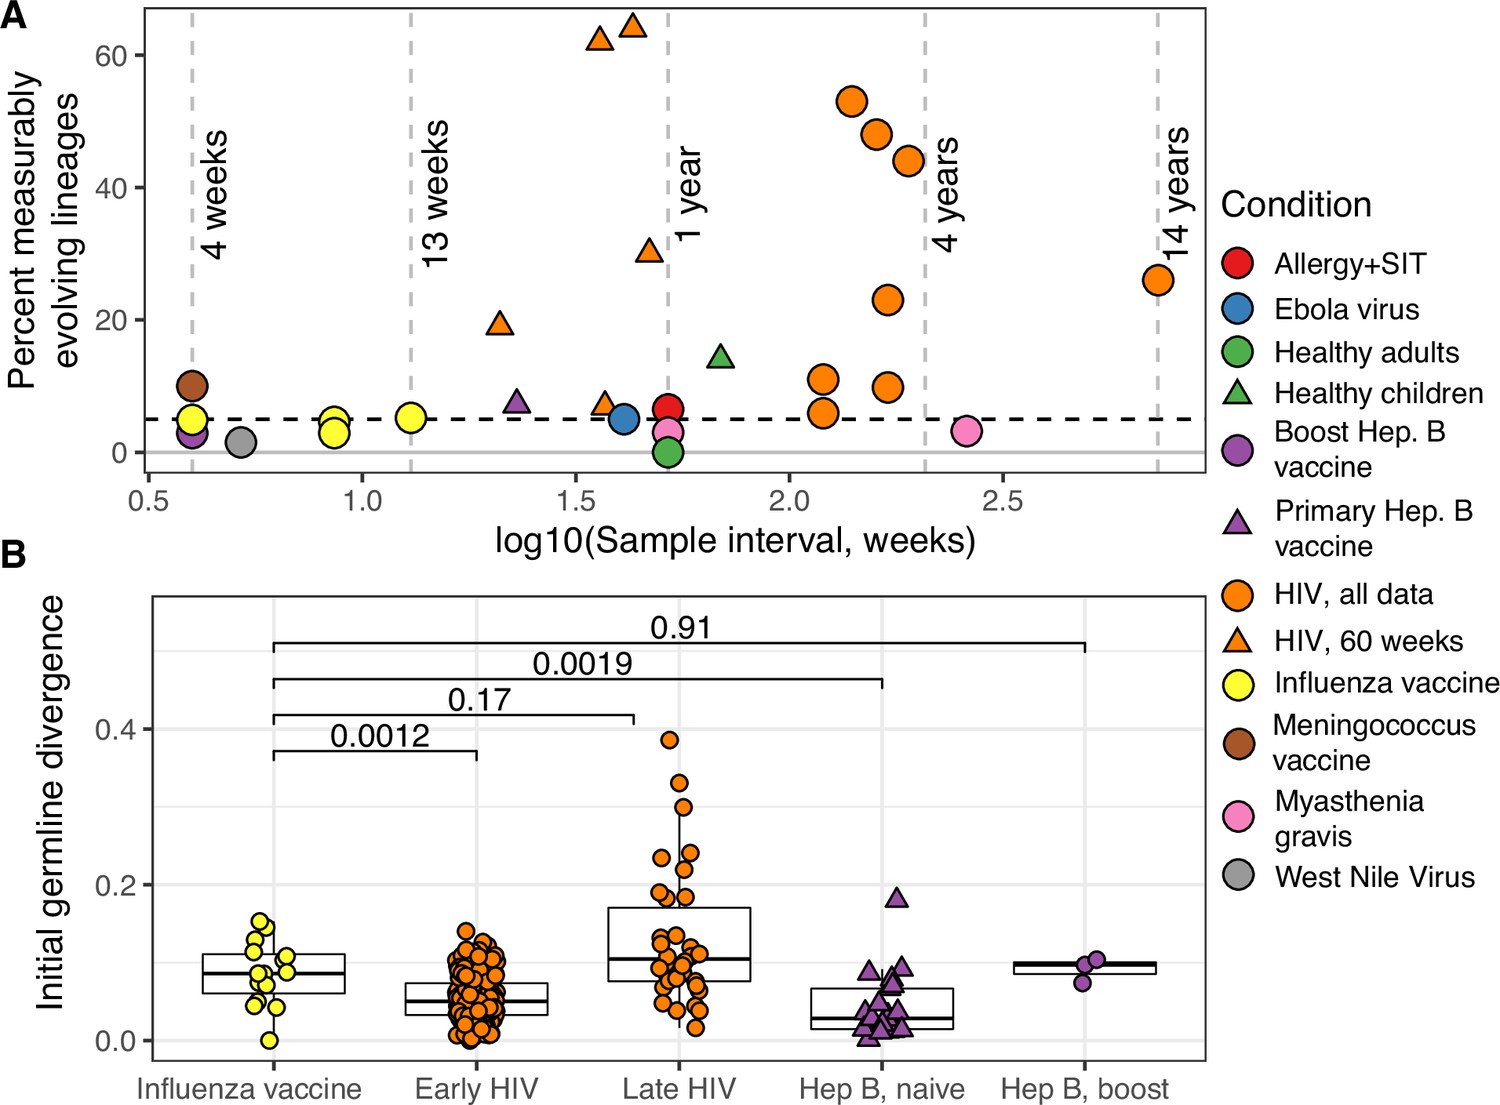
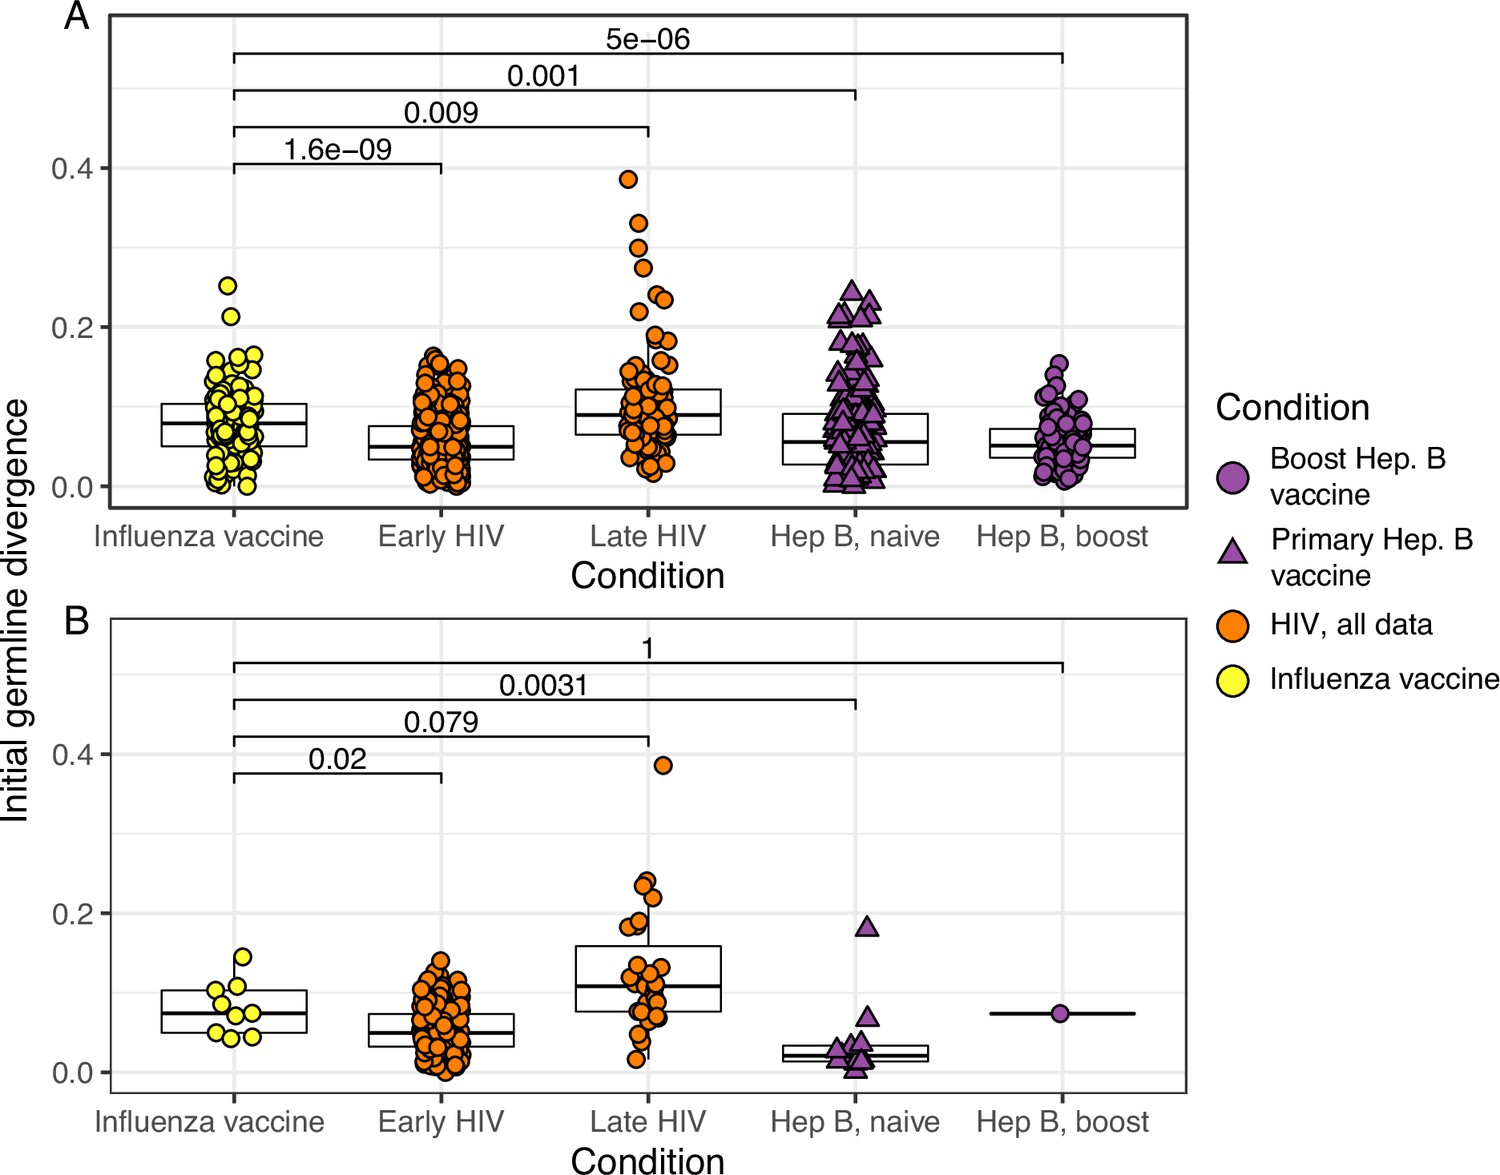
(A) Percentage of lineages that are measurably evolving within each study (Table 1, Figure 1C). The dotted line indicates 5%, the percent expected under the null hypothesis that there is no measurable evolution occurring in a given dataset. Orange triangles indicate HIV datasets truncated to only include data within the first 60-week sampling interval. Note that three HIV studies were not truncated because they contained <2 sample timepoints within the first 60 weeks of sampling (Huang et al., 2016; Schanz et al., 2014; Wu et al., 2015). (B) Mean initial germline divergence (sum of branch lengths) from germline to sequences from each adjusted measurably evolving lineage’s first timepoint. Note that ‘Early/Late’ HIV in (B) separates studies by time since initial infection, while ‘HIV, first 60 weeks’ in (A) includes only samples taken over the first 60 weeks of sampling. Each point is a measurably evolving lineage with a Benjamini–Hochberg adjusted p value <0.1. Wilcoxon tests were used to compare divergence levels among datasets.
Figure 2—figure supplement 1
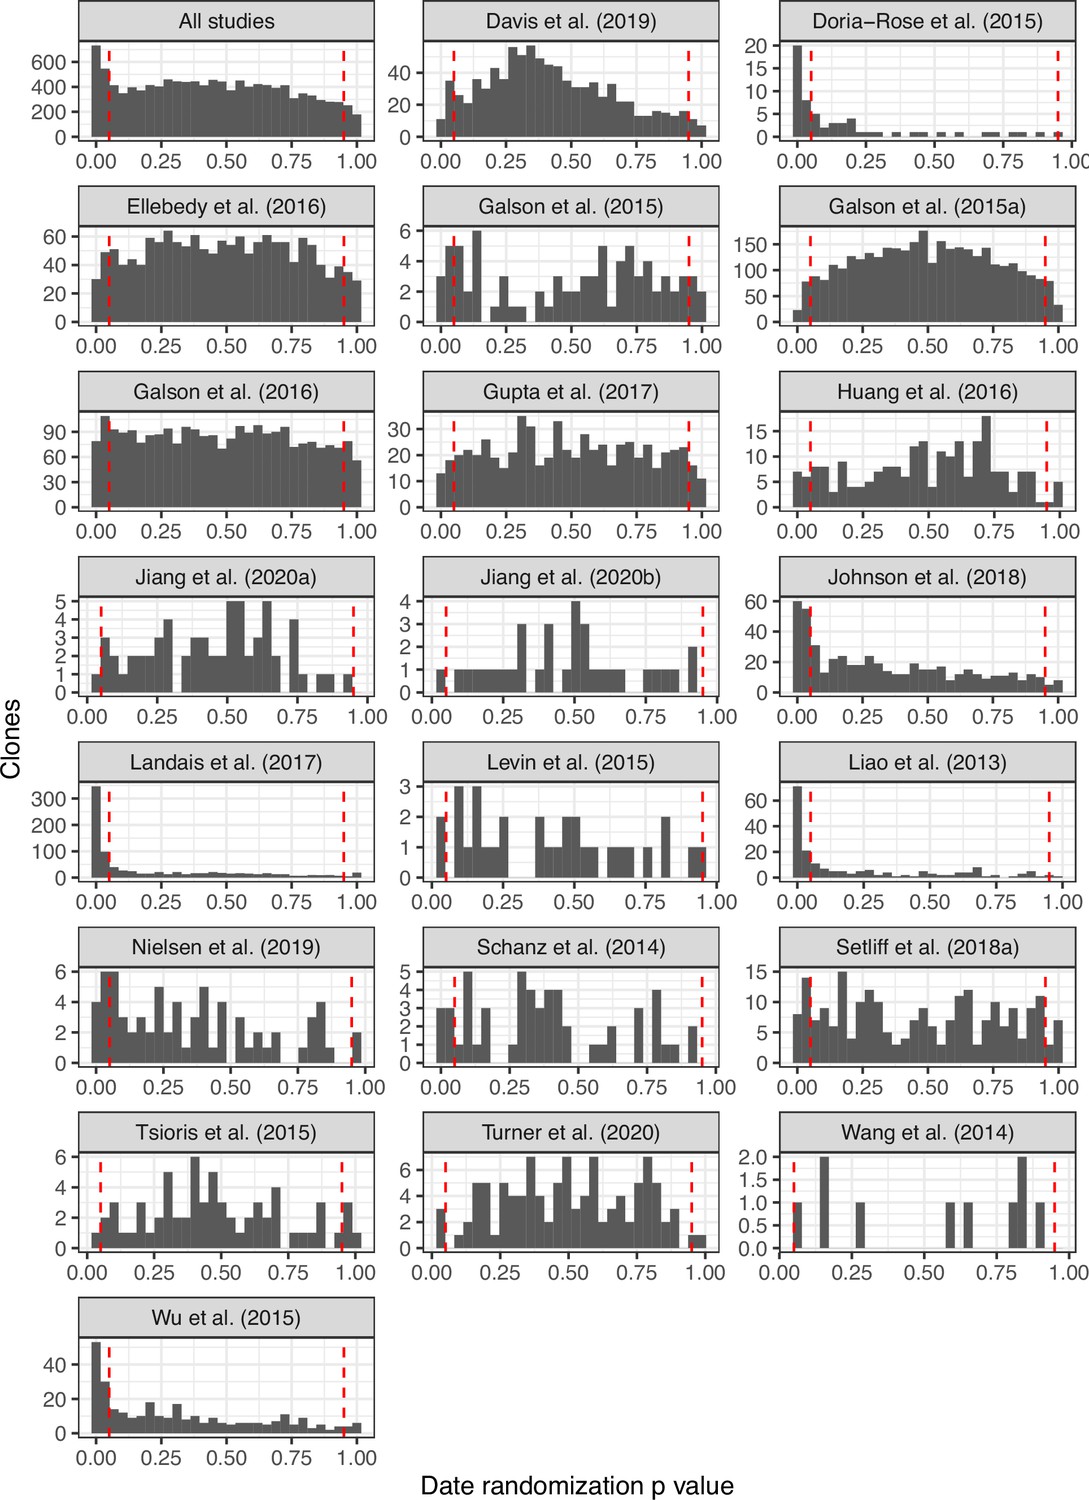
Date randomization p value histograms from blood-derived lineages across all studies.
Figure 2—figure supplement 2
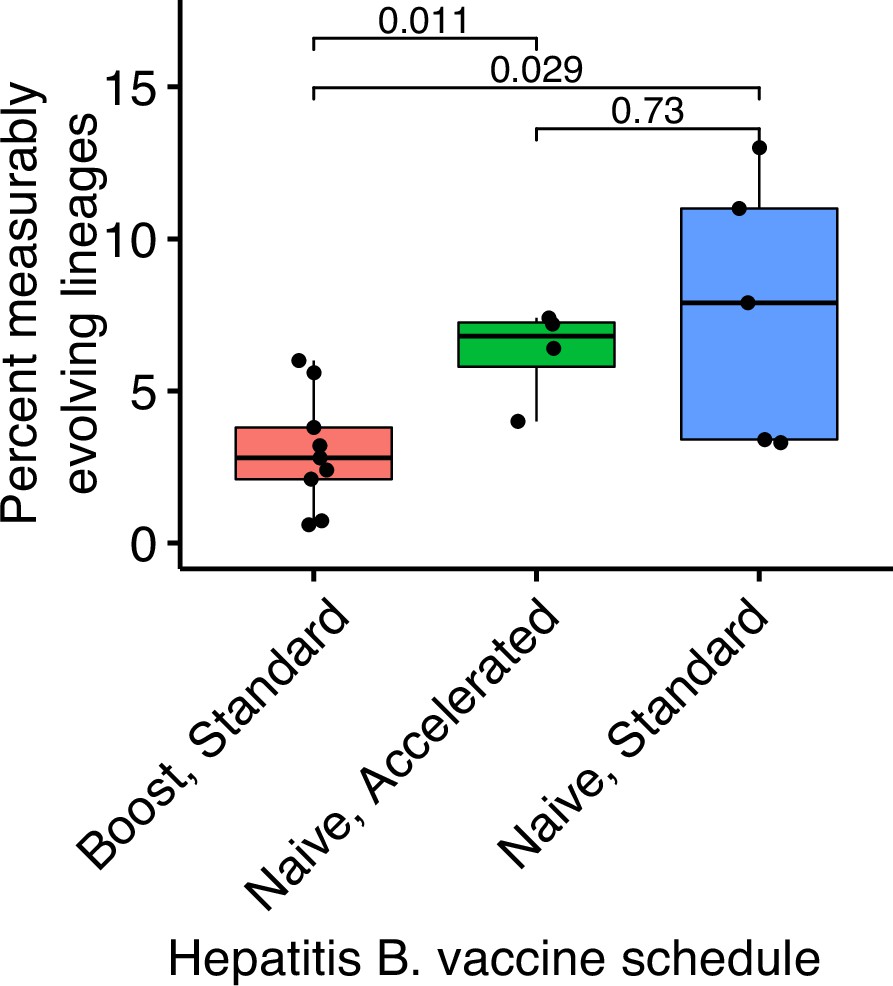
Comparison of measurably evolving lineages among hepatitis B vaccine schedules.
Hepatitis B booster vaccine data were obtained from Galson et al., 2015b and consisted of nine previously vaccinated subjects sampled four times between 0 and 28 days after a single vaccination. Hepatitis naive data were obtained from Galson et al., 2016. These subjects were all vaccine naive, were given three vaccinations, and sampled at seven timepoints. Five subjects received ‘standard’ vaccinations at days 0, 28, and 168, and were sampled at days 0, 7, 28, 35, 168, 175, and 208. Four subjects received ‘accelerated’ vaccinations at days 0, 28, and 56, and were sampled at days 0, 7, 28, 35, 56, 63, and 96. p values were calculated using a Wilcoxon test.
Figure 2—figure supplement 3
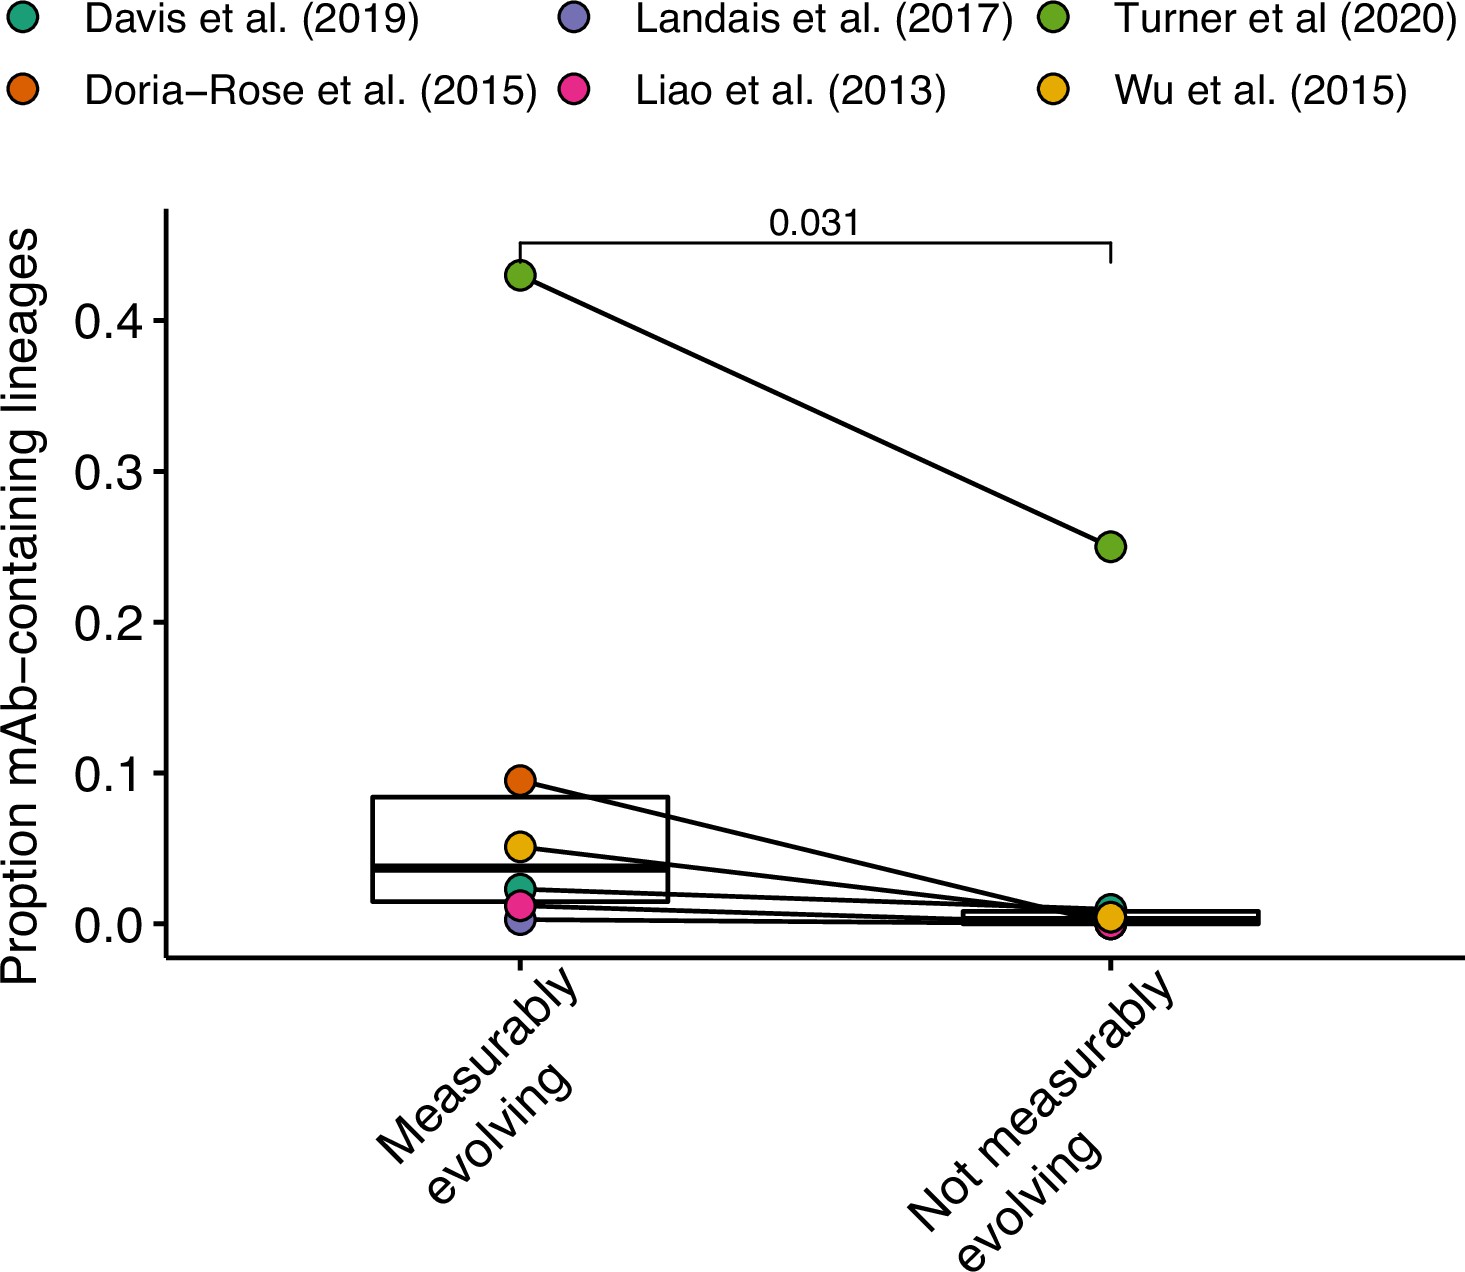
Enrichment of antigen-binding monoclonal antibody (mAb) sequences across studies.
Data from Turner et al., 2020 include both blood and lymph node sequences. P value was calculated using a Wilcoxon test.
Figure 2—figure supplement 4
Initial germline divergence with alternate p value thresholds.
(A) Mean initial germline divergence (sum of branch lengths) from germline to sequences from each adjusted measurably evolving lineage’s first timepoint. Each point is a measurably evolving lineage with a p value < 0.05. (B) Similar to A, but only lineages with an false discovery rate (FDR)-adjusted p value <0.05 were included. This cutoff is more strict than that in Figure 2B. Wilcoxon tests were used to compare divergence levels among datasets. Only datasets from Figure 2B were included.
Figure 3 with 3 supplements
Germinal center (GC) association is positively related to measurable evolution following influenza vaccination.
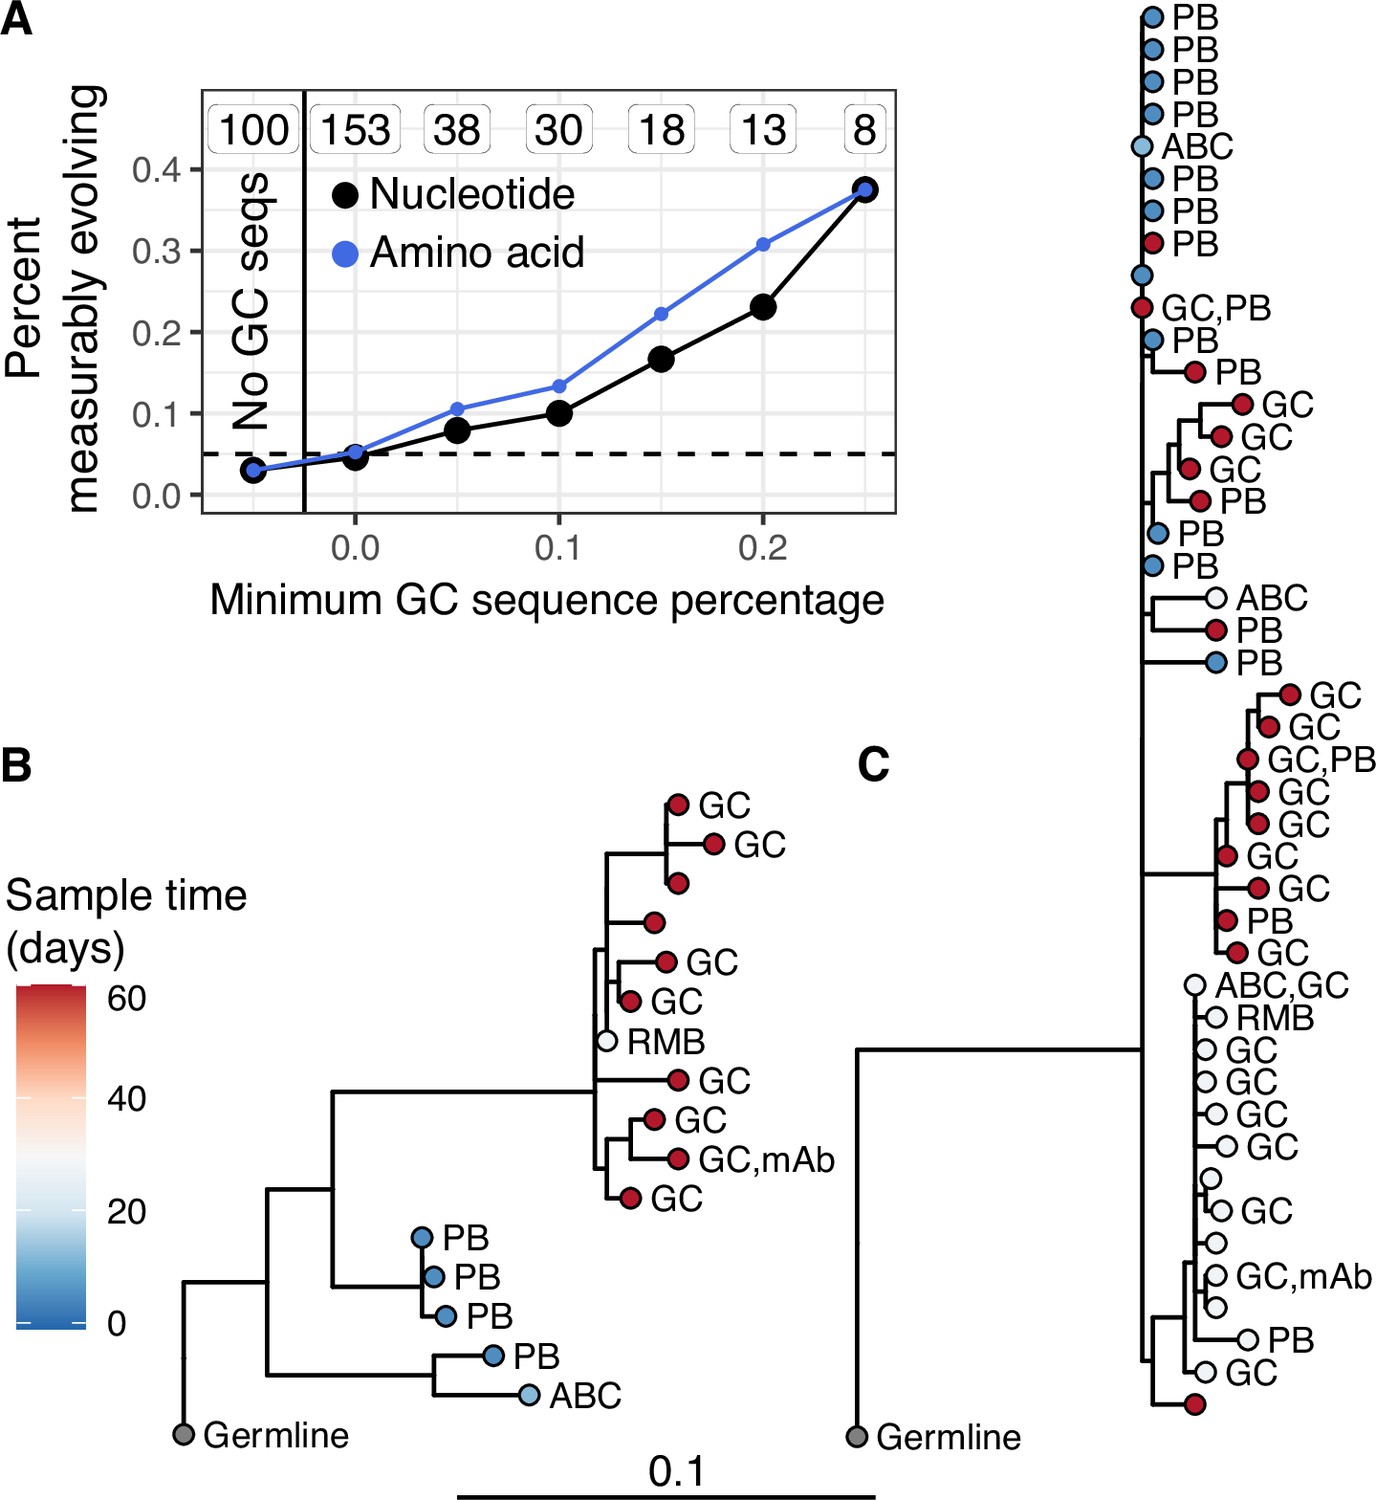
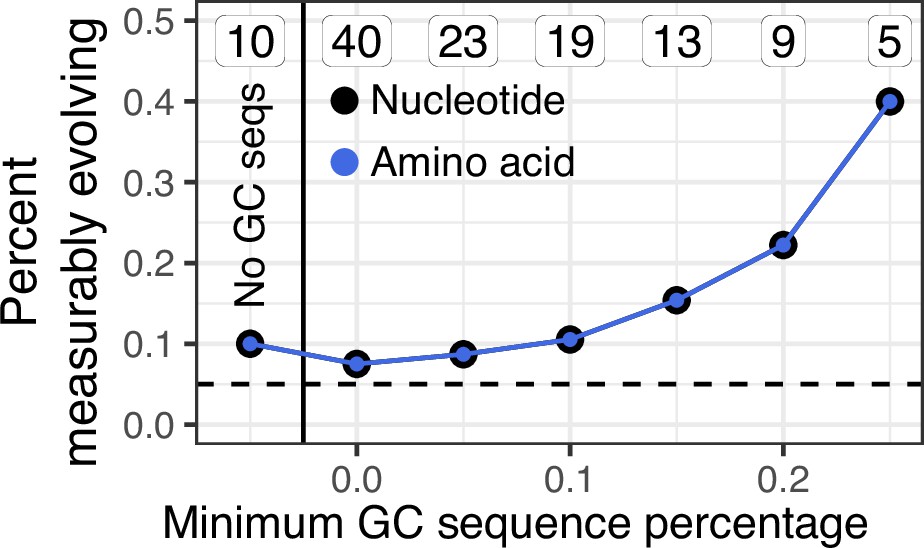
(A) Percent of lineages that are measurably evolving given a minimum percentage of GC sequences. The minimum (inclusive) percent of GC sequences within a clone is shown on the x axis. The origin shows the percentage of measurably evolving lineages across all lineages. The left-most point shows lineages without any GC sequences. The total number of lineages in each category are listed above each point. The dashed line shows 5%, the expected false positive rate under the null hypothesis. Results are shown for clustered date randomization tests using divergence values calculated either as the sum of nucleotide-based phylogenetic branch lengths (nucleotide), and the amino acid Hamming distance of each sequence to the germline (amino acid). (B, C) Lineage trees showing measurably evolving lineages with the highest proportion of GC sequences. Tips are labeled by cell type if available. ABC, activated B cell; GC, germinal center; PB, plasmablast; RMB, resting memory B; and unlabeled tips are from bulk PBMC sequencing. mAb = influenza-binding monoclonal antibody sequence (2018/2019 quadrivalent inactivated influenza virus vaccine). Branch lengths represent somatic hypermutation (SHM)/site, as shown by the shared scale bar.
Figure 3—figure supplement 1
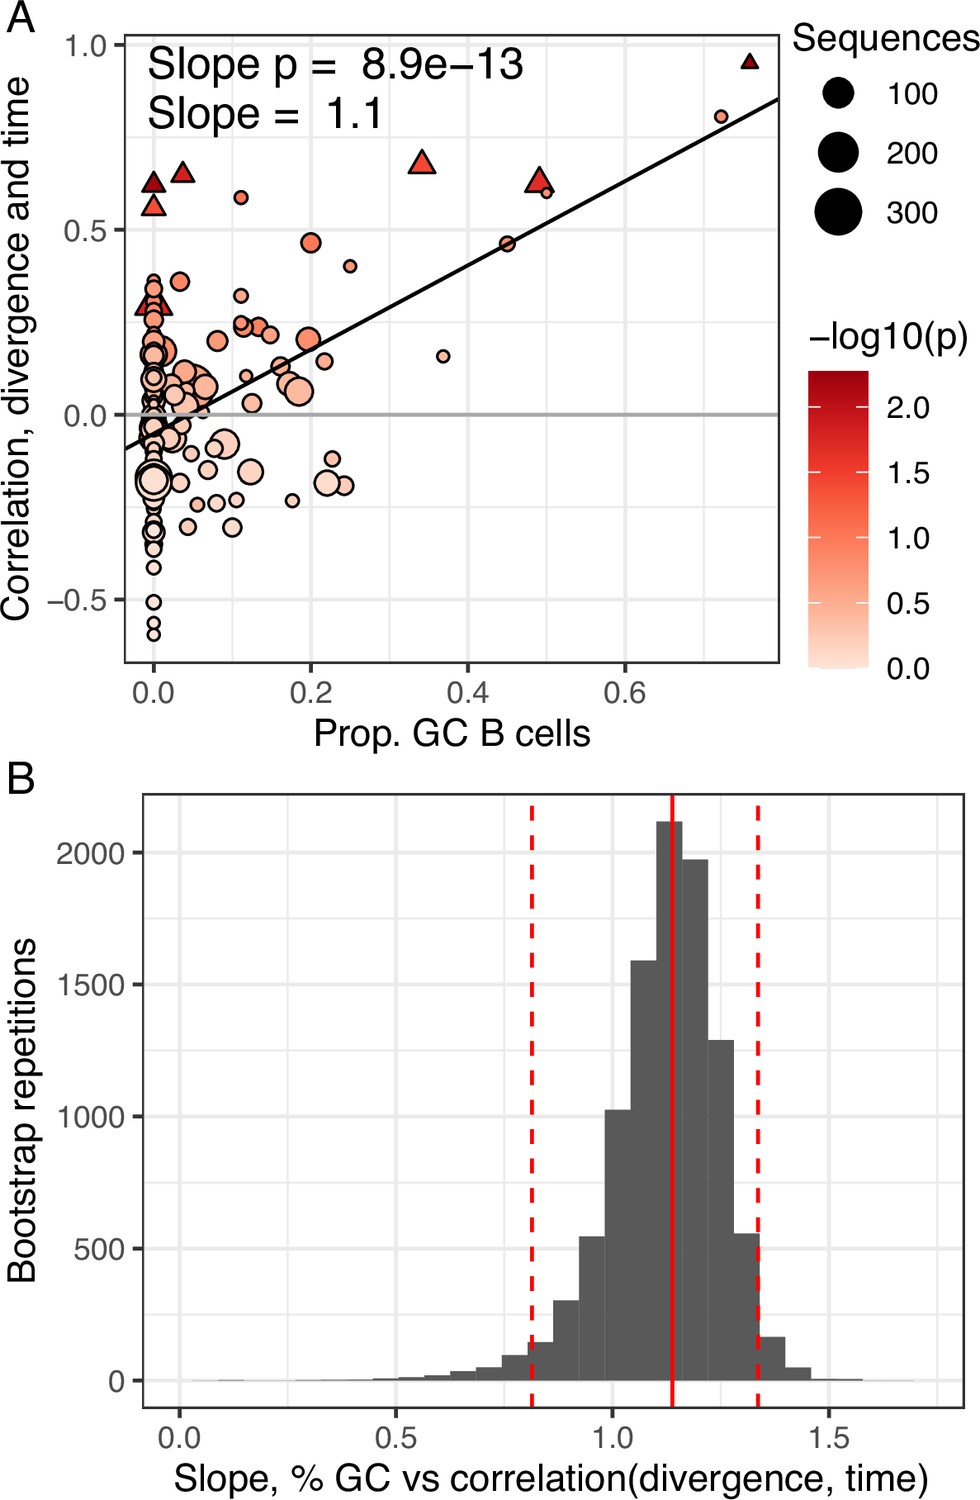
Germinal center (GC) engagement is positively related to measurable evolution following influenza vaccination.
(A) Proportion of GC sequences within a lineage is positively related to the correlation between divergence and time. Lineages with p < 0.05 are shown as triangles. Points are colored by correlation between divergence and time. (B) Bootstrap analysis of the linear regression slope between the proportion of GC B cells and the correlation between divergence and sample time. Distribution shows bootstrap replicates, solid red line shows observed slope estimate, dashed red lines show 2.5% and 97.5% quantiles.
Figure 3—figure supplement 2
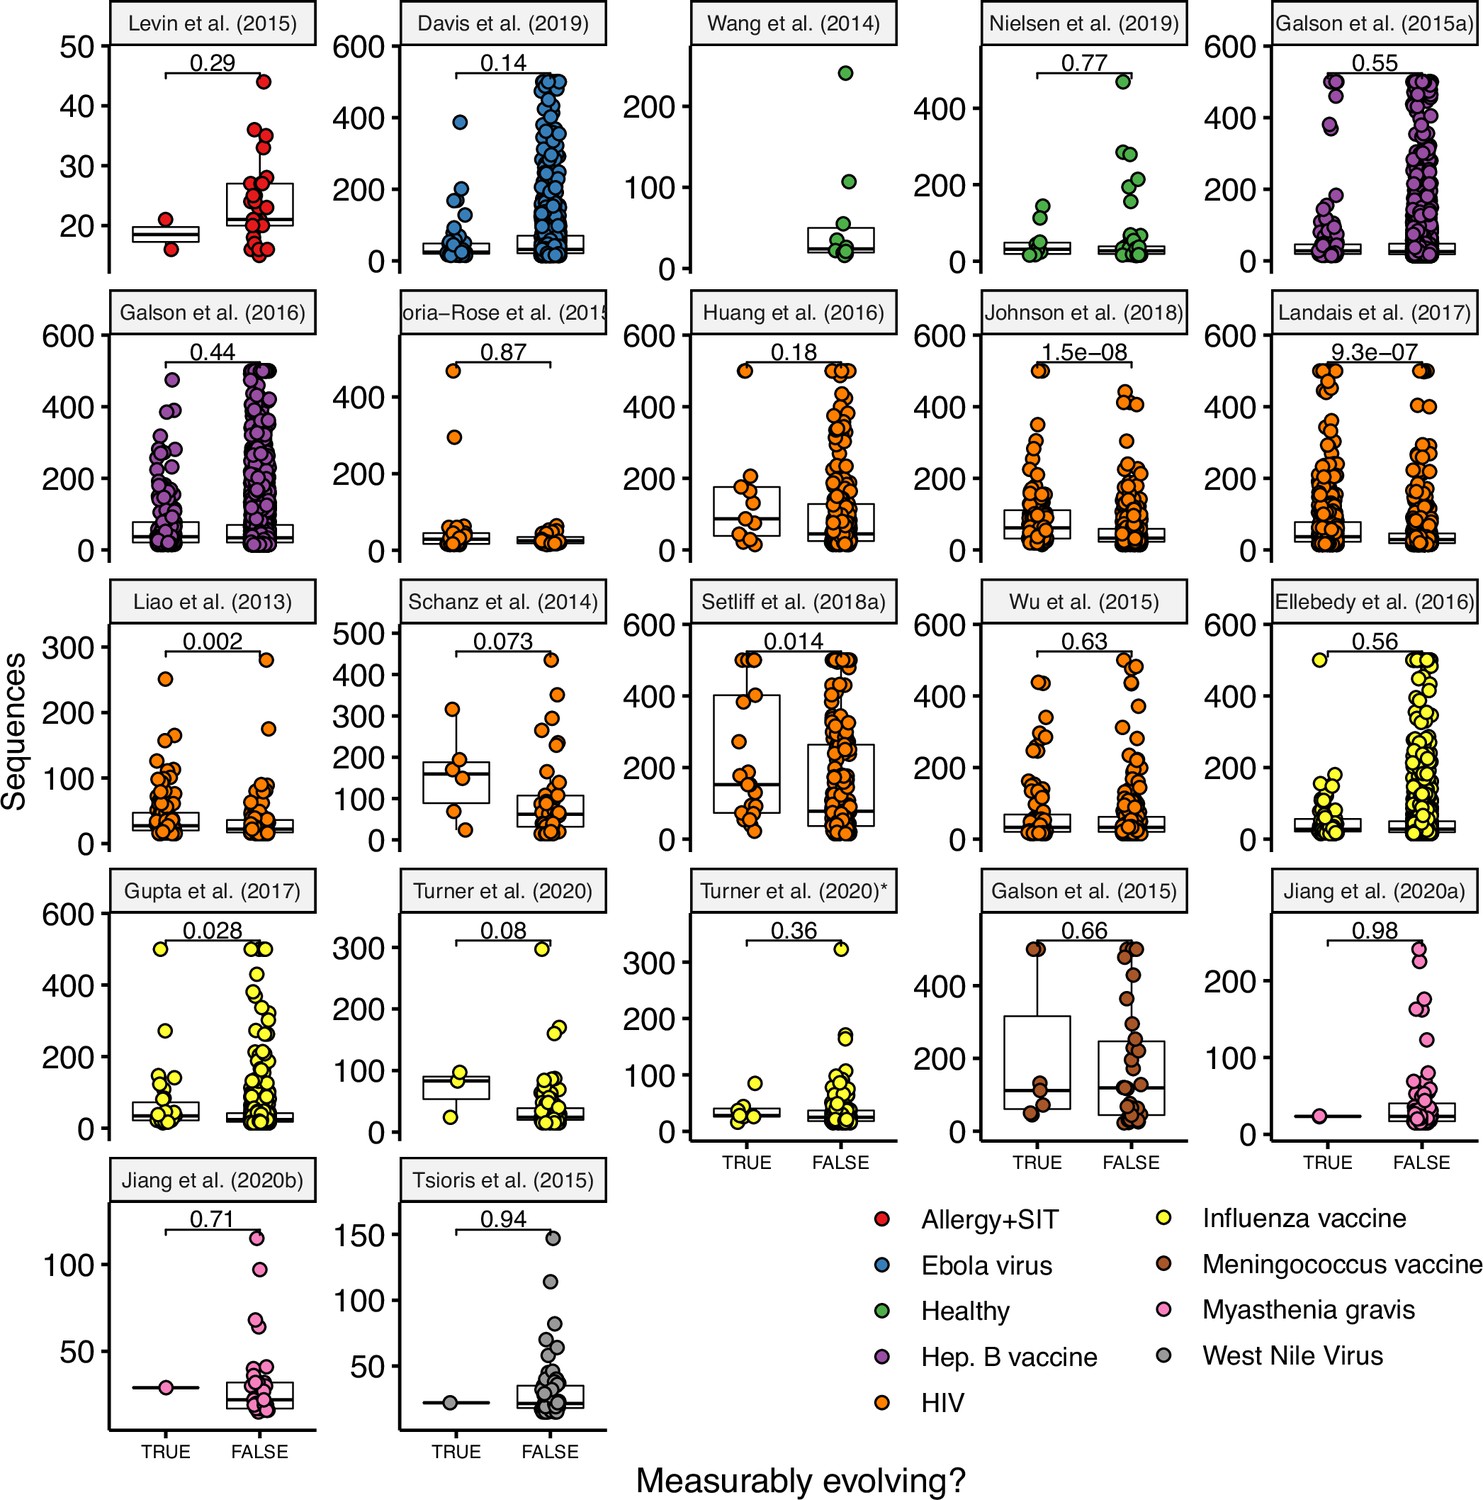
Number of sequences per lineage in measurably evolving vs nonmeasurably evolving lineages.
See Table 1 for details on each study. P values are computed using a Wilcoxon test. Turner et al., 2020* included all samples (blood and lymph node) while Turner et al., 2020 included only blood samples.
Figure 3—figure supplement 3
Percent of lineages that are measurably evolving given a minimum percentage of germinal center (GC) sequences.
In contrast to Figure 3A, only lineages containing influenza-binding monoclonal antibody sequences (mAbs) were included in this analysis.
Author response image 1
Tables
Table 1
Summary of datasets.
N shows number of subjects with at least one powered lineage. Mean range shows mean total sampling interval across subjects. Powered lineages shows the number of lineages that: (1) contained at least 15 sequences, (2) were sampled over at least 3 weeks, and (3) had a minimum possible p value <0.05. The rightmost column shows the percentage of these lineages with p < 0.05, rounded to two significant digits. Studies with at least 5% positive lineages are shown in bold. Turner et al., 2020 in this table and Figure 2 included only blood samples. Data from studies marked with an asterisk (*) were obtained from Observed Antibody Space (Kovaltsuk et al., 2018).
| Study | Condition | N | Mean range (weeks) | Mean sample count | Multi-timepoint lineages | Powered lineages | % lineages p < 0.05 |
|---|---|---|---|---|---|---|---|
| Levin et al., 2016* | Allergy + SIT | 9 | 52 | 2.7 | 42 | 31 | 6.5 |
| Davis et al., 2019* | Ebola virus | 4 | 36 | 3.6 | 1,549 | 877 | 5 |
| Wang et al., 2014 | Healthy adults | 7 | 52 | 2 | 18 | 10 | 0 |
| Nielsen et al., 2019 | Healthy children | 20 | 69 | 2.7 | 262 | 71 | 14 |
| Galson et al., 2015b* | Hep. B vaccine (boost) | 9 | 4 | 4.8 | 4,923 | 3,422 | 2.9 |
| Galson et al., 2016* | Hep. B vaccine (primary) | 9 | 23 | 6.9 | 4,426 | 2,529 | 7.2 |
| Doria-Rose et al., 2014* | HIV | 1 | 190 | 8 | 65 | 48 | 44 |
| Huang et al., 2016* | 1 | 120 | 12 | 388 | 221 | 5.9 | |
| Johnson et al., 2018* | 1 | 170 | 5 | 561 | 330 | 23 | |
| Landais et al., 2017* | 1 | 160 | 7 | 1,084 | 743 | 48 | |
| Liao et al., 2013* | 1 | 140 | 5 | 205 | 151 | 53 | |
| Schanz et al., 2014* | 1 | 120 | 3 | 147 | 54 | 11 | |
| Setliff et al., 2018* | 6 | 170 | 3 | 787 | 173 | 9.8 | |
| Wu et al., 2011, Wu et al., 2015* | 1 | 730 | 7 | 393 | 305 | 26 | |
| Ellebedy et al., 2016* | Influenza vaccine | 8 | 13 | 5 | 1966 | 1,479 | 5.2 |
| Laserson et al., 2014* | 3 | 4 | 9 | 1,182 | 639 | 4.9 | |
| Turner et al., 2020 | 1 | 8.6 | 5 | 168 | 104 | 2.9 | |
| Galson et al., 2015a* | Meningococcus vaccine | 7 | 4 | 3 | 483 | 80 | 10 |
| Jiang et al., 2020a | Myasthenia gravis | 3 | 260 | 3.6 | 110 | 62 | 3.2 |
| Jiang et al., 2020b | 1 | 52 | 2 | 46 | 33 | 3 | |
| Tsioris et al., 2015 | West Nile virus | 6 | 5.2 | 2 | 151 | 65 | 1.5 |
Table 2
Analysis of selection on adjusted measurably evolving lineages.
Repertoire-wide estimates of ω for CDRs (ωCDR) and FWRs (ωFWR) for adjusted measurably evolving lineages within different subjects are shown. L indicates the maximum log-likelihood obtained when both ωCDR and ωFWR were estimated by maximum likelihood. LCDR=1 indicates the maximum log-likelihood obtained when ωFWR was estimated by maximum likelihood but ωCDR was fixed at 1. LFWR=1 indicates the maximum log-likelihood obtained when ωCDR was estimated by maximum likelihood but ωFWR was fixed at 1. The likelihood ratio statistic (LRS) was calculated as either 2×(L − LCDR=1) for CDRs or 2×(L − LFWR=1) for FWRs, and p values were calculated using a likelihood ratio test with one degree of freedom (see Methods). L values were rounded to two decimal places, LRS values are reported to three significant digits. Significant p values are in bold. p values below the numerical limit for double values are reported as <2E−16.
| Study | Subject | N | Region | ω | L | LCDR=1 | LFWR=1 | LRS | p | |
|---|---|---|---|---|---|---|---|---|---|---|
| Influenza vaccine | Ellebedy et al., 2016 | Donor-4 | 4 | CDR | 0.624 | −5753.04 | −5759.65 | 13.2 | 2.80E−04 | |
| FWR | 0.503 | −5753.04 | −5783.9 | 61.7 | 4.00E−15 | |||||
| Donor-5 | 5 | CDR | 0.979 | −5074.01 | −5074.02 | 0.0212 | 8.84E−01 | |||
| FWR | 0.584 | −5074.01 | −5090.55 | 33.1 | 8.75E−09 | |||||
| Laserson et al., 2014 | FV | 4 | CDR | 0.583 | −9162.11 | −9173.39 | 22.6 | 1.99E−06 | ||
| FWR | 0.508 | −9162.11 | −9217.38 | 111 | <2E−16 | |||||
| Early HIV | Doria-Rose et al., 2014 | CAP256 | 9 | CDR | 0.424 | −18,976.96 | −19,045.96 | 138 | <2E−16 | |
| FWR | 0.451 | −18,976.96 | −19,151.29 | 349 | <2E−16 | |||||
| Johnson et al., 2018 | CAP256 | 26 | CDR | 0.423 | −46,720.28 | −46,858.67 | 277 | <2E−16 | ||
| FWR | 0.408 | −46,720.28 | −47,243.96 | 1,050 | <2E−16 | |||||
| Landais et al., 2017 | PC064 | 188 | CDR | 0.39 | −416,489.06 | −418,035.9 | 3,090 | <2E−16 | ||
| FWR | 0.386 | −416,489.06 | −422,043.68 | 11,100 | <2E−16 | |||||
| Liao et al., 2013 | CH505 | 51 | CDR | 0.527 | −102,131.66 | −102,307.3 | 351 | <2E−16 | ||
| FWR | 0.417 | −102,131.66 | −103,240.86 | 2,220 | <2E−16 | |||||
| Schanz et al., 2014 | ZA159 | 2 | CDR | 0.657 | −5573.47 | −5577.12 | 7.29 | 6.93E−03 | ||
| FWR | 0.466 | −5573.47 | −5617.91 | 88.9 | <2E−16 | |||||
| Late HIV | Huang et al., 2016 | Donor-Z258 | 2 | CDR | 0.345 | −3162.12 | −3172.87 | 21.5 | 3.54E−06 | |
| FWR | 0.401 | −3162.12 | −3196.5 | 68.7 | 1.11E−16 | |||||
| Wu et al., 2015 | Donor-45 | 32 | CDR | 0.451 | −63,527.81 | −63,687 | 318 | <2E−16 | ||
| FWR | 0.378 | −63,527.81 | −64,444.73 | 1,830 | <2E−16 | |||||
| Hep B. vaccine, primary | Galson et al., 2016 | Subject-2277 | 6 | CDR | 0.885 | −5498.77 | −5499.15 | 0.766 | 3.81E−01 | |
| FWR | 0.668 | −5498.77 | −5508.36 | 19.2 | 1.18E−05 | |||||
| Subject-2752 | 2 | CDR | 0.533 | −1112.1 | −1113.82 | 3.44 | 6.36E−02 | |||
| FWR | 0.461 | −1112.1 | −1120.06 | 15.9 | 6.68E−05 | |||||
| Subject-2954 | 9 | CDR | 0.711 | −6023.13 | −6026.4 | 6.56 | 1.04E−02 | |||
| FWR | 0.545 | −6023.13 | −6048.08 | 49.9 | 1.62E−12 |
Additional files
Download links
A two-part list of links to download the article, or parts of the article, in various formats.
Downloads (link to download the article as PDF)
Open citations (links to open the citations from this article in various online reference manager services)
Cite this article (links to download the citations from this article in formats compatible with various reference manager tools)
Human B cell lineages associated with germinal centers following influenza vaccination are measurably evolving
eLife 10:e70873.
https://doi.org/10.7554/eLife.70873


