Mitochondrial phenotypes in purified human immune cell subtypes and cell mixtures
- Department of Psychiatry, Division of Behavioral Medicine, Columbia University Irving Medical Center, United States
- Columbia Center for Translational Immunology, Columbia University Irving Medical Center, United States
- Department of Obstetrics and Gynecology, Columbia University Irving Medical Center, United States
- New York State Psychiatric Institute, United States
- Department of Psychology, University of Kentucky, United States
- Department of Psychology, University of Pittsburgh, United States
- Department of Neurology, Merritt Center and Columbia Translational Neuroscience Initiative, Columbia University Irving Medical Center, United States
Figures
Figure 1 with 3 supplements
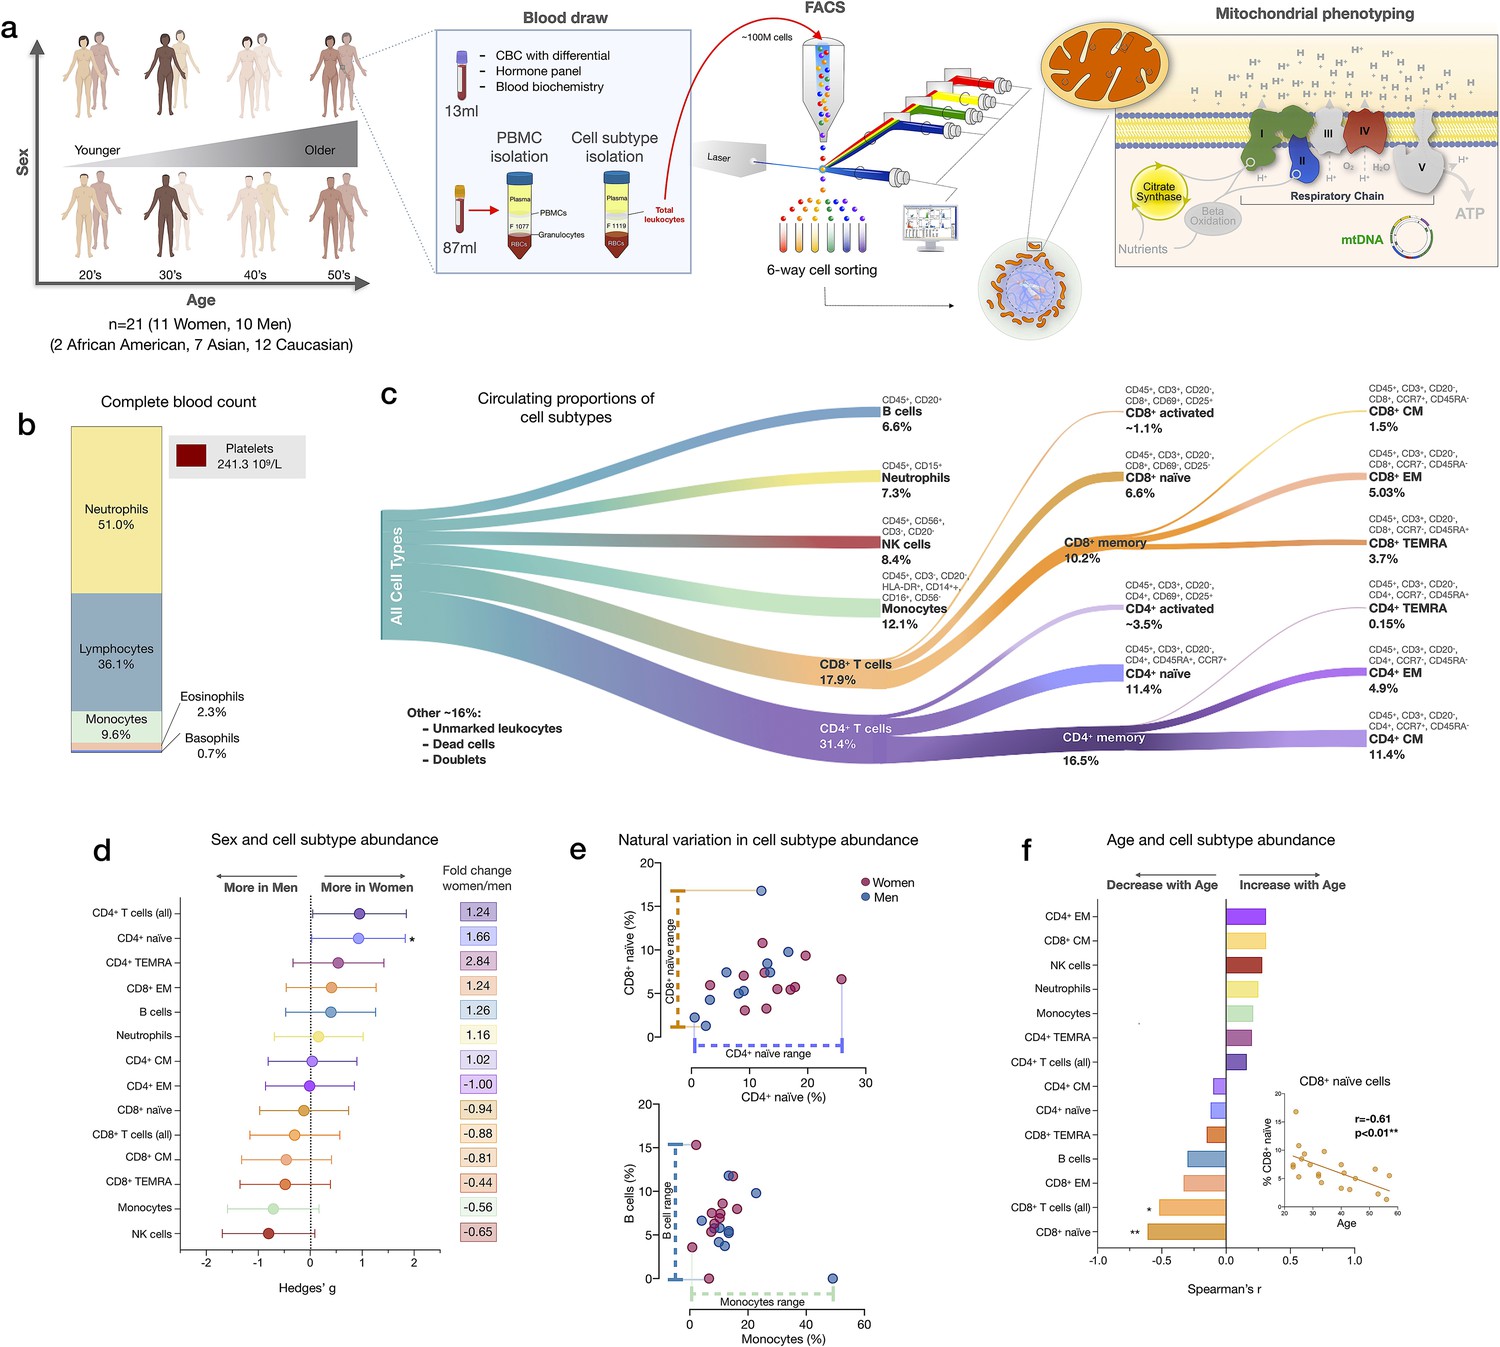
Immune cell subtype distribution in adult women and men.
(a) Overview of participant demographics, blood collection, processing, and analysis pipeline. Total leukocytes were isolated using Ficoll 1119 and PBMCs were isolated on Ficoll 1077. (right) The five mitochondrial features analyzed on the mitochondrial phenotyping platform are colored. Five million cells per purified cell subtype were used for analyses. Mitochondrial phenotyping platform schematic adapted from Figure 1a in Picard et al., 2018. (b) Stacked histogram showing the leukocytes distribution derived from the complete blood count (CBC) of major cell types. (c) Diagram illustrating the proportion of circulating immune cell subtypes (% of all detected cells) quantified by flow cytometry from total peripheral blood leukocytes. Cell surface markers and subtype definitions are detailed in Supplementary file 1. (d) Effect sizes for cell subtype distribution differences between women (n=11) and men (n = 10). p-values from nonparametric Mann-Whitney t-test. Error bars reflect the 95% confidence interval (CI) on the effect size, and the fold change comparing raw counts between women and men is shown on the right. (e) Example distributions of cell type proportions in women and men illustrating the range of CD4+ and CD8+ naïve cells, B cells, and monocytes, highlighting the natural variation among our cohort. Each data point reflects a different individual. (f) Spearman’s r correlation between age and cell types proportion. n=21, p<0.05*, p<0.01**. PBMC, peripheral blood mononuclear cell.
-
Figure 1—source data 1
Immune cell subtype distribution in adult women and men.
- https://cdn.elifesciences.org/articles/70899/elife-70899-fig1-data1-v2.xlsx
Figure 1—figure supplement 1
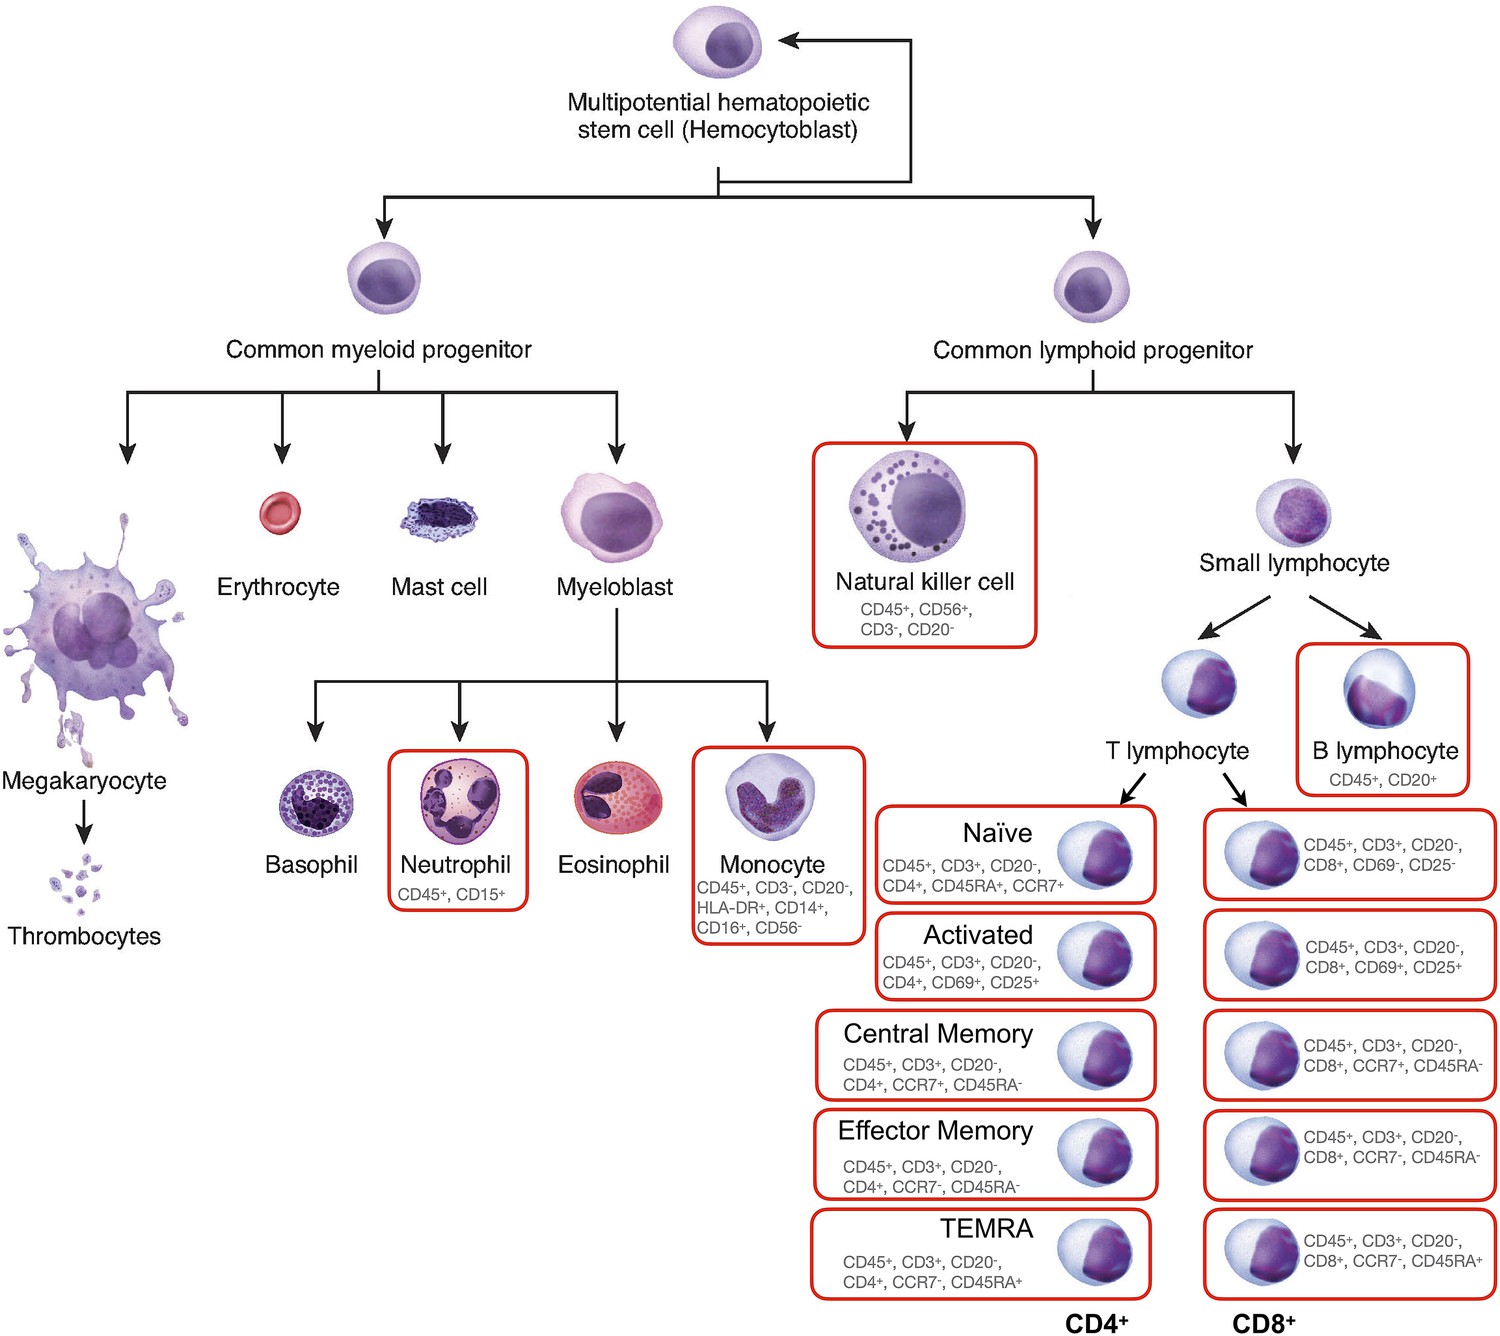
Diagram of leukocyte cell lineages.
Adapted from Figure 3.34, OpenStax 2021, https://openstax.org/books/anatomy-and-physiology/pages/3-6-cellular-differentiation. Cells analyzed in this study are circled in red. The cell surface markers used to define subpopulations are indicated below each cell subtype.
Figure 1—figure supplement 2
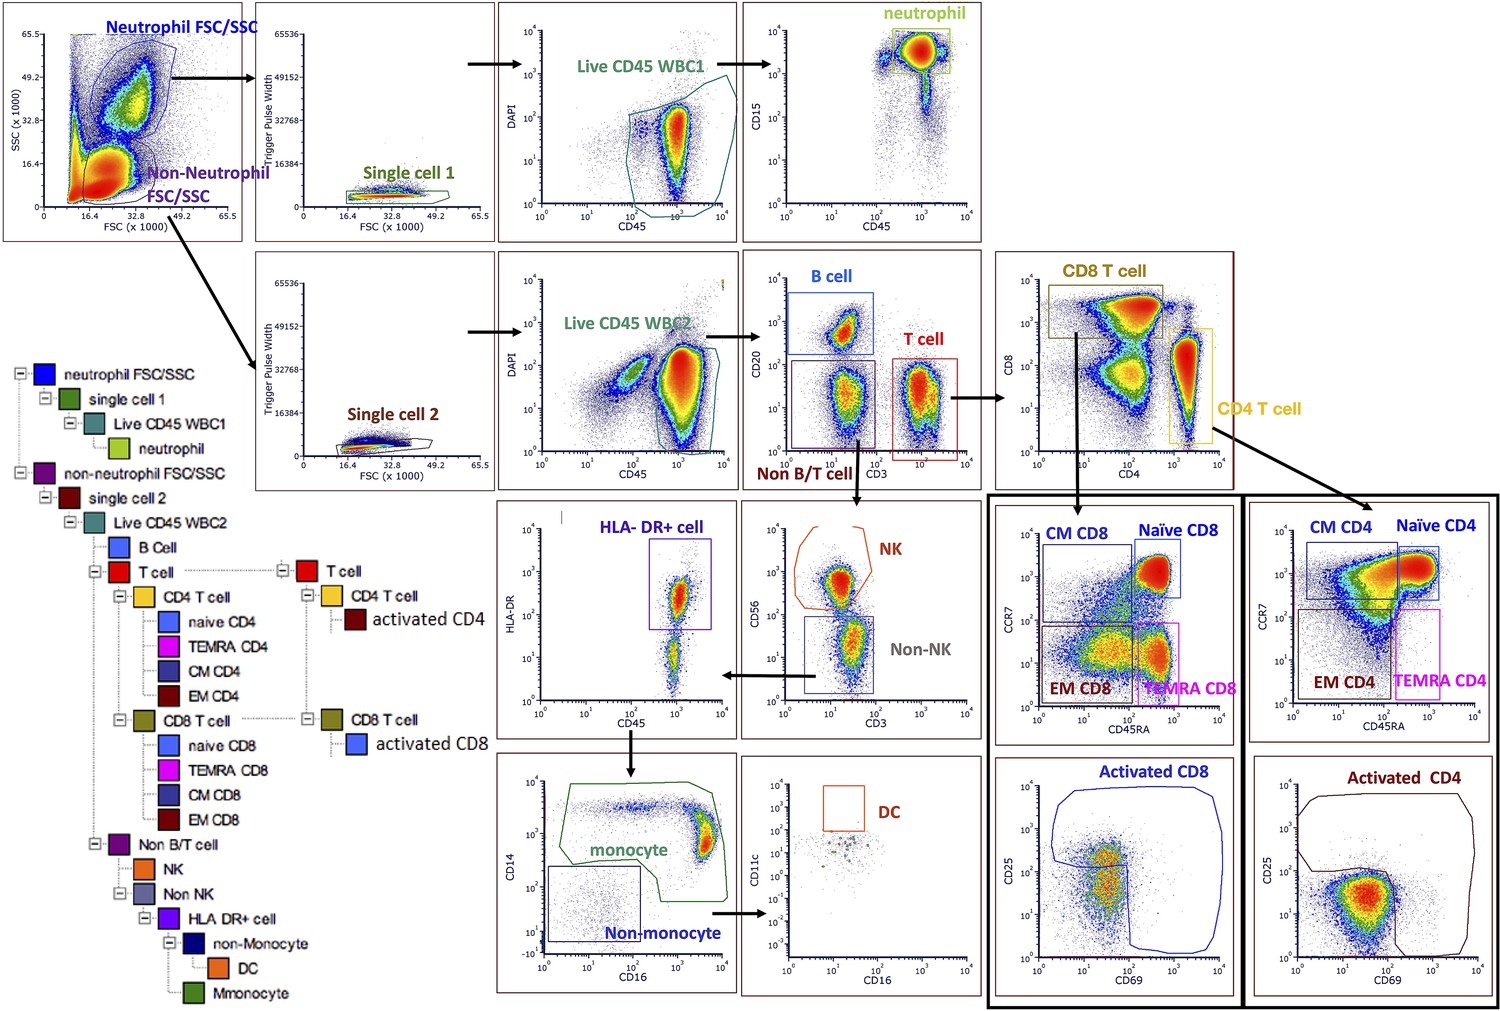
Gating strategy to quantify all cell subtypes and sorting major cell subtypes for mitochondrial phenotyping.
See the Materials and methods section for details of labeling cocktails and cell sorter parameters. An initial run of 2 M cells was used to establish the six most abundant cell subtypes (targets) for each participant, followed by FACS to obtain at least one 5 M aliquot of each target cell subtype. Up to five 5 M aliquots were collected per cell subtype, per participant, to establish technical variability in downstream assays. FACS, fluorescence-activated cell sorting.
Figure 1—figure supplement 3
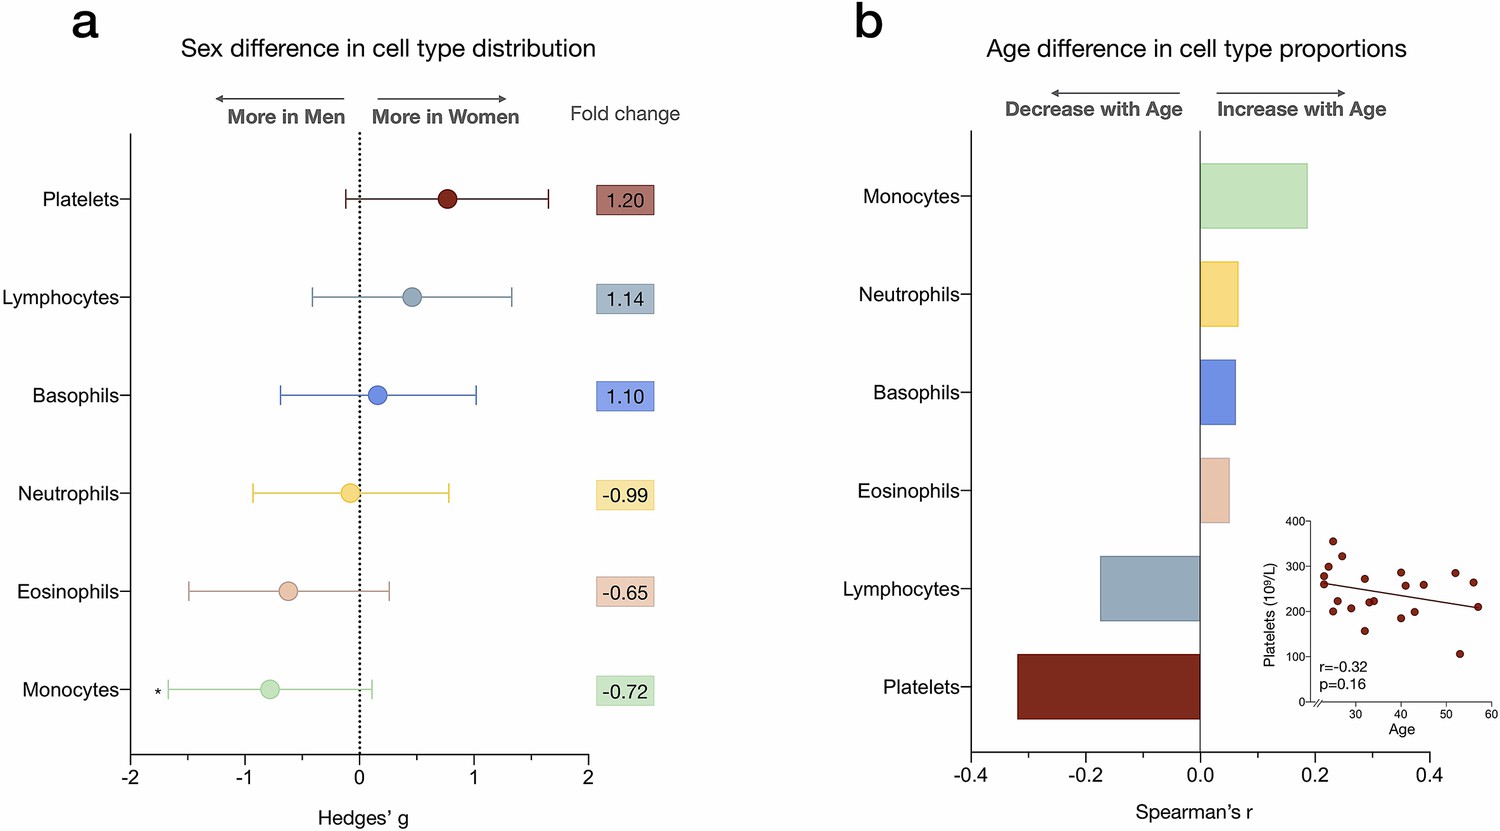
Sex differences and age correlations with leukocyte abundance measured by complete blood count (CBC).
(a) Forest plot illustrating the effect size (g) of the sex differences in cell proportion derived from the CBC results (n=21). Fold changes in the raw values are also shown. p-values from nonparametric Mann-Whitney t-test. Error bars reflect the 95% CI on the effect size. (b) Correlation (Spearman’s r) between age and cell proportion derived from the CBC. n=21, p<0.05*. CI, confidence interval.
-
Figure 1—figure supplement 3—source data 1
Sex differences and age correlations with leukocyte abundance measured by complete blood count.
- https://cdn.elifesciences.org/articles/70899/elife-70899-fig1-figsupp3-data1-v2.xlsx
Figure 2 with 1 supplement
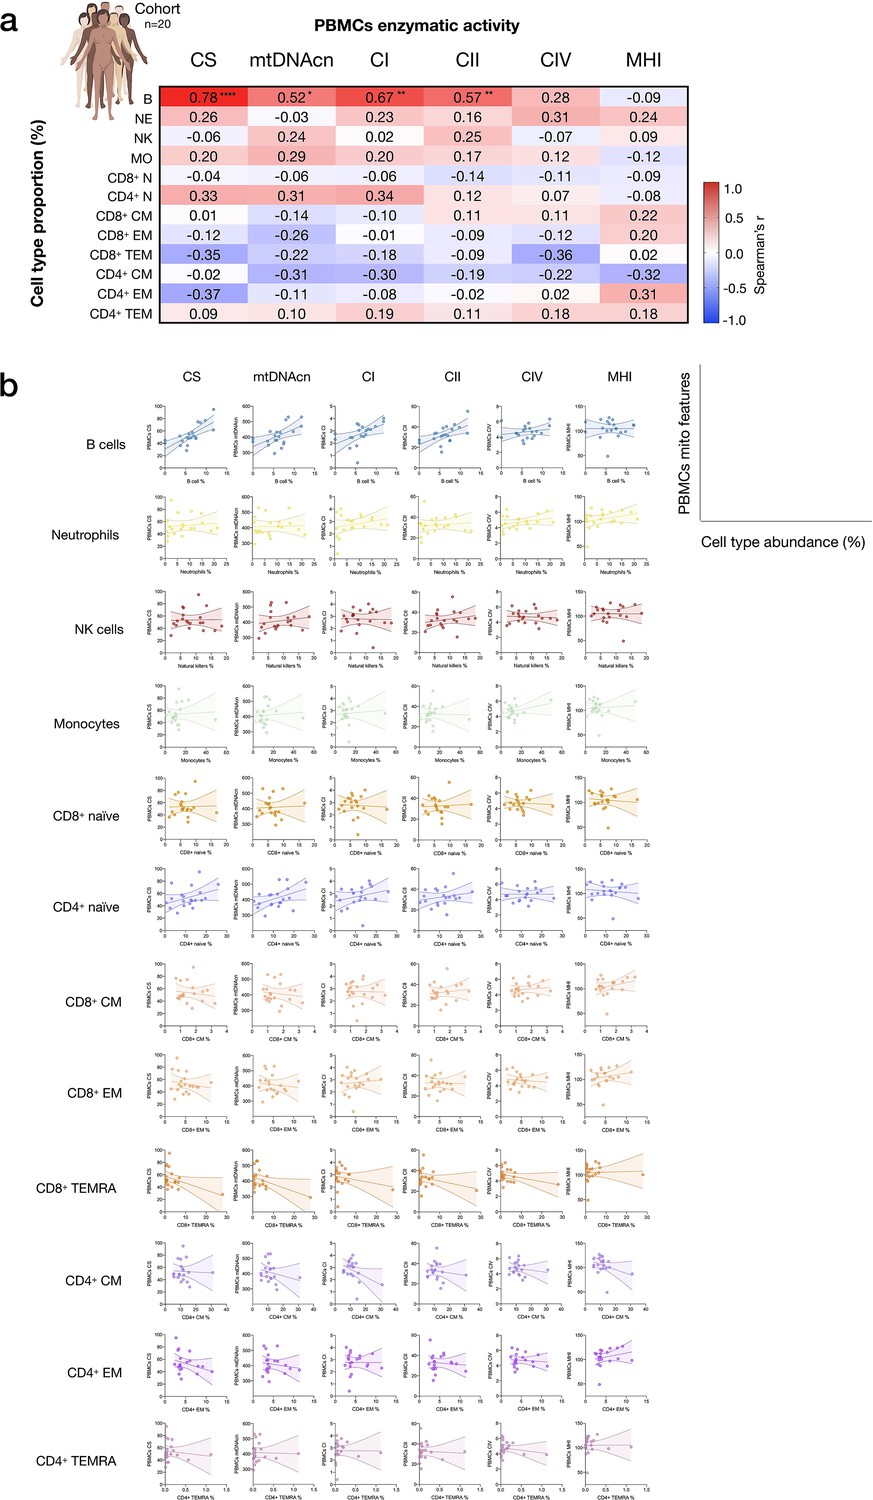
Influence of cell subtypes on mitochondrial features in total PBMCs.
(a) Pairwise correlations (Spearman’s r) between cell subtype proportions obtained from cell sorting with mitochondrial features measured in PBMCs for the cohort (n=20, one participant missing PBMC data). Aggregate correlations are shown as a heatmap (top) and (b) individual scatterplots (bottom). p<0.05*, p<0.01**, p<0.0001****. PBMC, peripheral blood mononuclear cell.
-
Figure 2—source data 1
Influence of cell subtypes on mitochondrial features in total PBMCs.
PBMC, peripheral blood mononuclear cell.
- https://cdn.elifesciences.org/articles/70899/elife-70899-fig2-data1-v2.xlsx
Figure 2—figure supplement 1
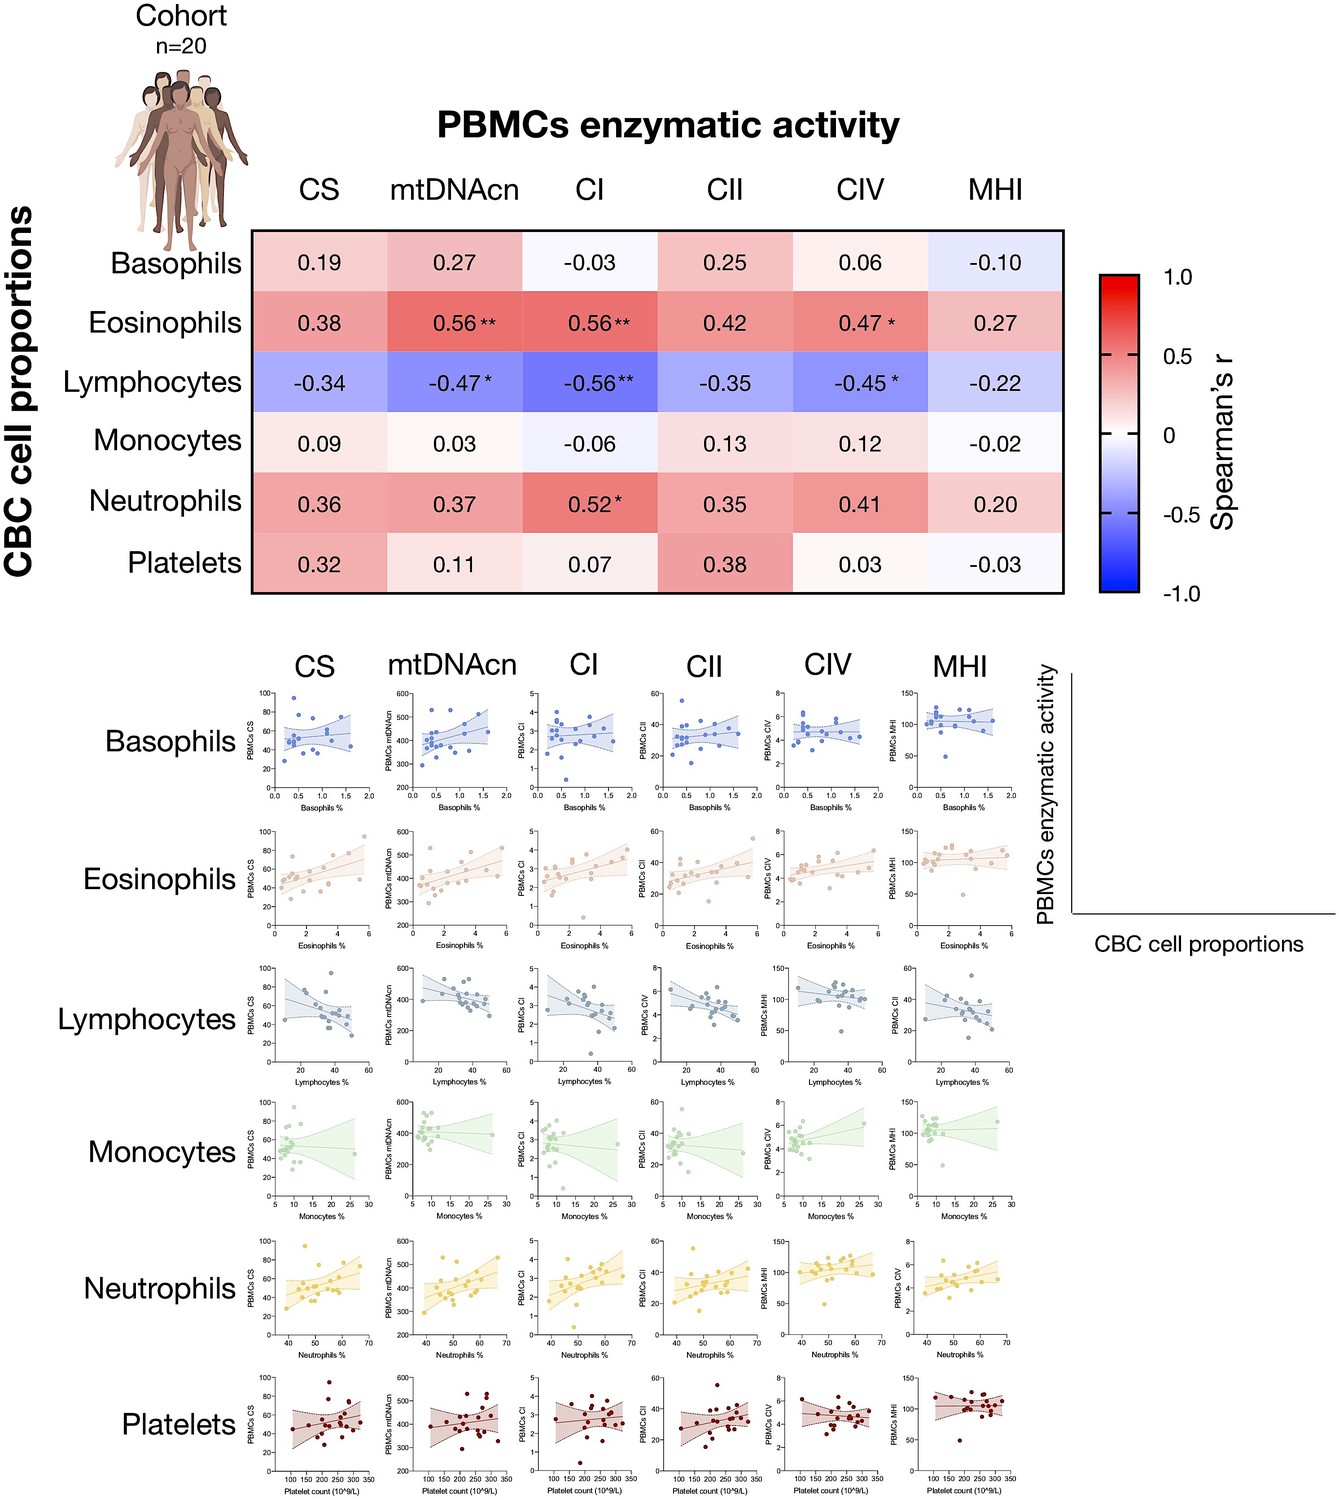
Associations between CBC cell proportions with mitochondrial features measured in PBMCs.
Correlations between CBC-based cell type abundance (% of total leukocytes) and PBMCs mitochondrial features for the cohort (n=20). CBC, complete blood count; PBMC, peripheral blood mononuclear cell.
-
Figure 2—figure supplement 1—source data 1
Associations between CBC cell proportions with mitochondrial features measured in PBMCs.
CBC, complete blood count; PBMC, peripheral blood mononuclear cell.
- https://cdn.elifesciences.org/articles/70899/elife-70899-fig2-figsupp1-data1-v2.xlsx
Figure 3
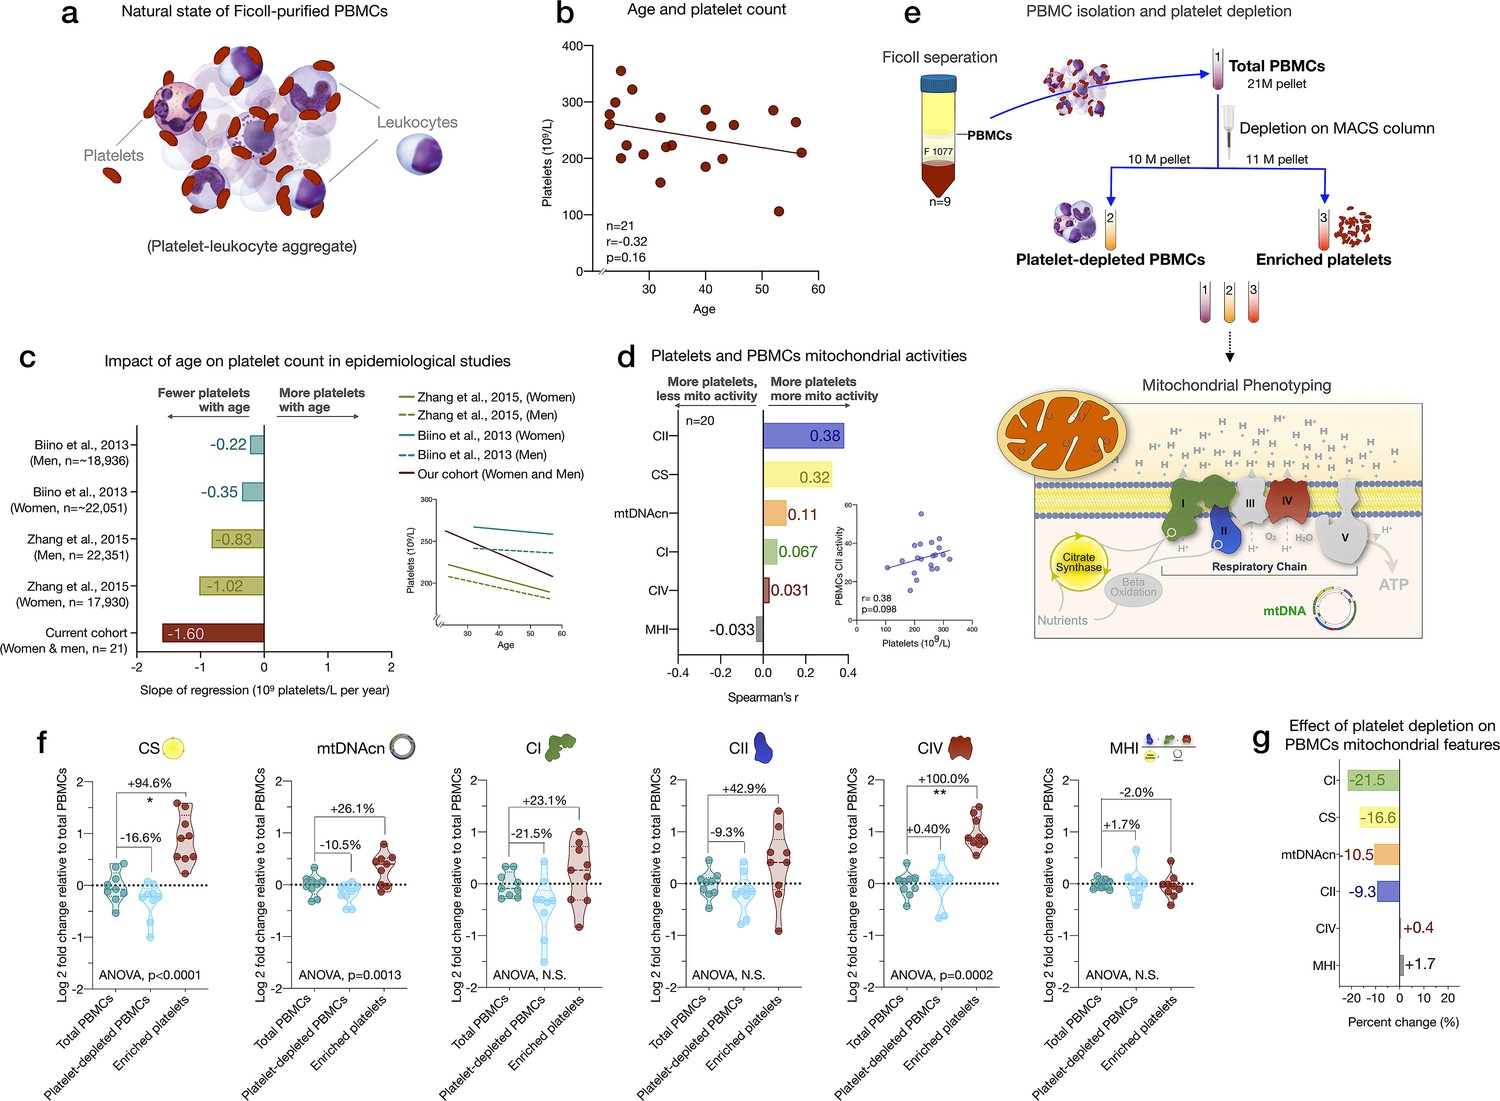
Influence of platelet contamination on mitochondrial features in total PBMCs.
(a) Schematic of the natural state of Ficoll-isolated PBMCs associated with contaminating platelets. (b) Association of age and circulating platelet abundance (i.e., count) in our cohort (Spearman’s r). (c) Change in platelet abundance as a function of age. The magnitude of the association (slope of the regression: 109 platelets/L per year) from two large epidemiological studies and our cohort. The inset shows the actual regressions (n=21–22,351). (d) Effect sizes of the association between platelet count and PBMC mitochondrial features in our cohort (n=20). (e) Overview of the experimental PBMC platelet depletion study, yielding three different samples subjected to mitochondrial phenotyping. Mitochondrial phenotyping platform schematic adapted from Figure 1a, Picard et al., 2018. (f) Fold change in mitochondrial parameters between (i) platelet-depleted PBMCs, and (ii) enriched platelets (with contaminating PBMCs), relative to (iii) total PBMCs. p-values from one-way nonparametric ANOVA Friedman test, post hoc Dunn’s multiple comparisons relative to total PBMCs. (g) Percent change of platelet-depleted PBMCs mitochondrial features from total PBMCs. n=9, p<0.05*,p<0.01**, p<0.001***, p<0.0001****. PBMC, peripheral blood mononuclear cell.
-
Figure 3—source data 1
Influence of platelet contamination on mitochondrial features in total PBMCs.
PBMC, peripheral blood mononuclear cell.
- https://cdn.elifesciences.org/articles/70899/elife-70899-fig3-data1-v2.xlsx
Figure 4 with 1 supplement
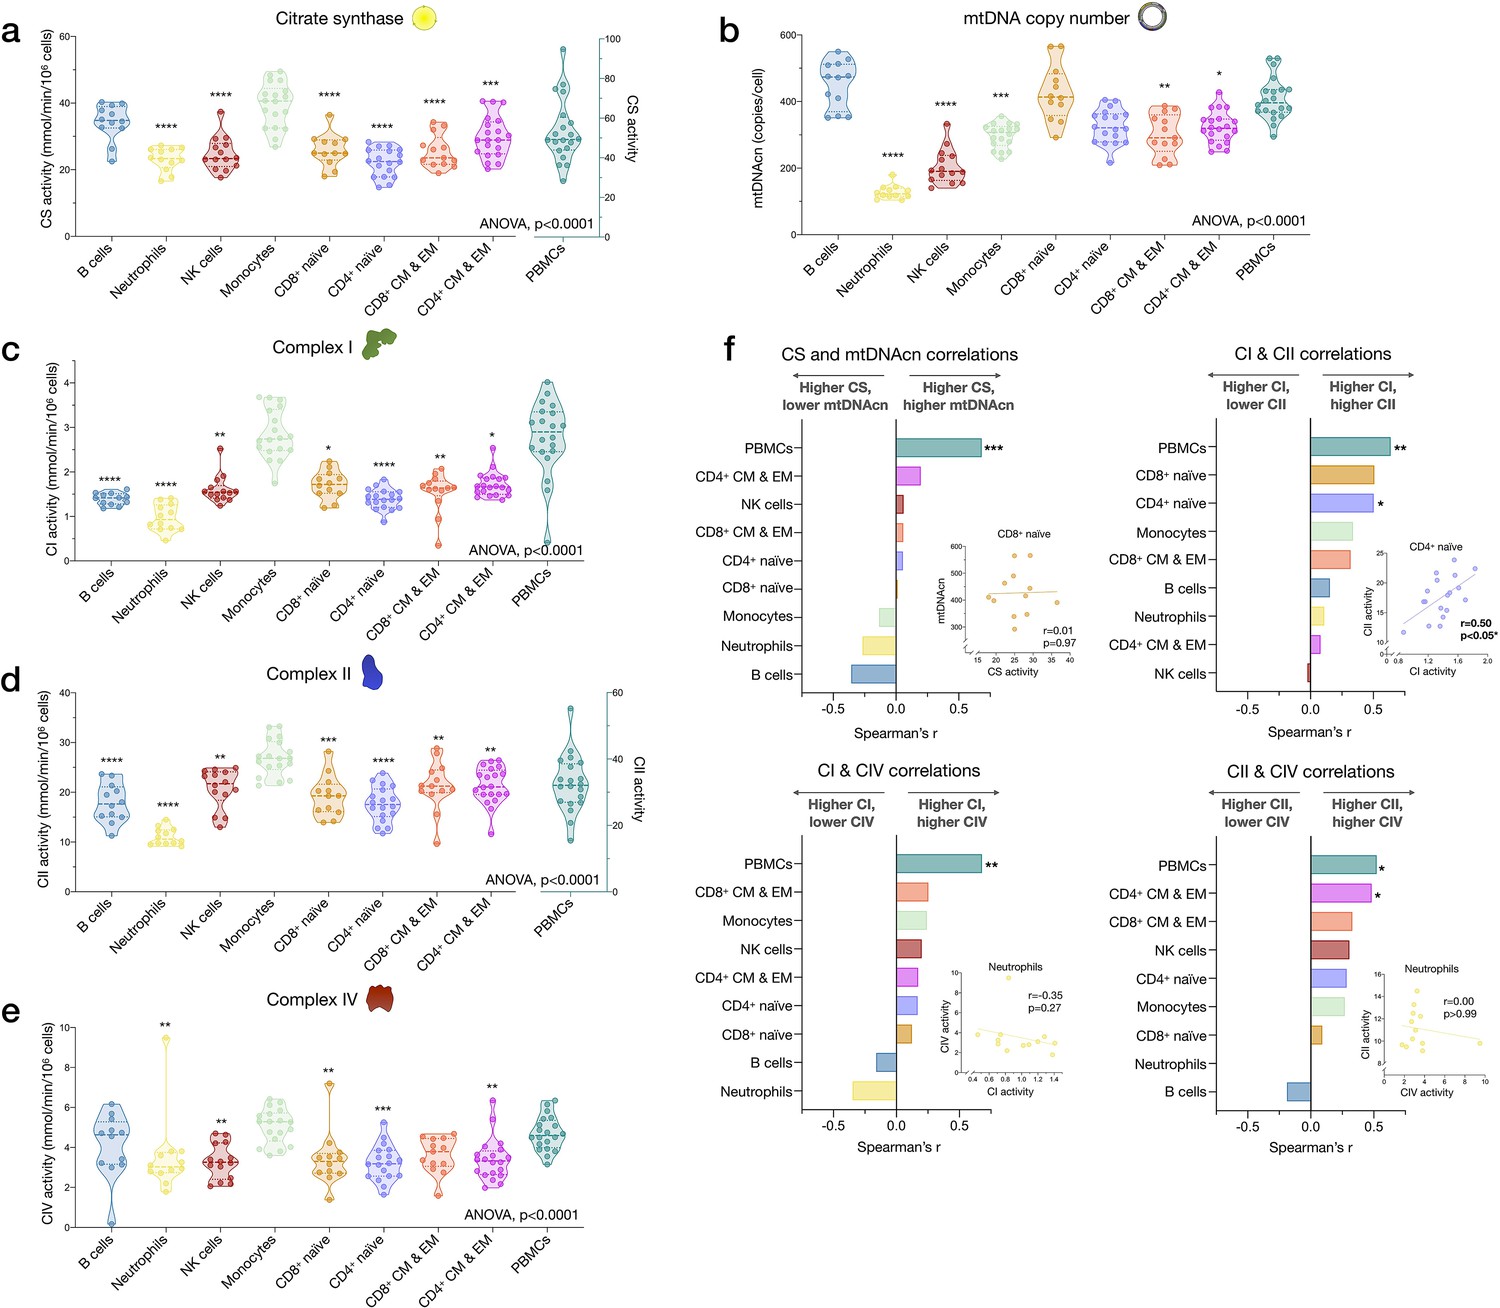
Cell subtype differences in mitochondrial content and RC function.
(a–e) Violin plots illustrating immune cell type differences in mitochondrial features across cell subtypes and total PBMCs. For each individual, only the six most abundant cell types were analyzed (n=21 individuals, 12–18 per cell subtype). Dashed lines are median (thick) and 25th and 75th quartiles (thin). p-values from one-way nonparametric ANOVA Kruskal-Wallis test, post hoc Dunn’s multiple comparisons relative to PBMCs. (f) Spearman’s r inter-correlations of mitochondrial features across subtypes. Insets show the scatterplots for selected correlations. p<0.05*, p<0.01**, p<0.001***, p<0.0001****. PBMC, peripheral blood mononuclear cell; RC, respiratory chain.
-
Figure 4—source data 1
Cell subtype differences in mitochondrial content and RC function.
RC, respiratory chain.
- https://cdn.elifesciences.org/articles/70899/elife-70899-fig4-data1-v2.xlsx
Figure 4—figure supplement 1
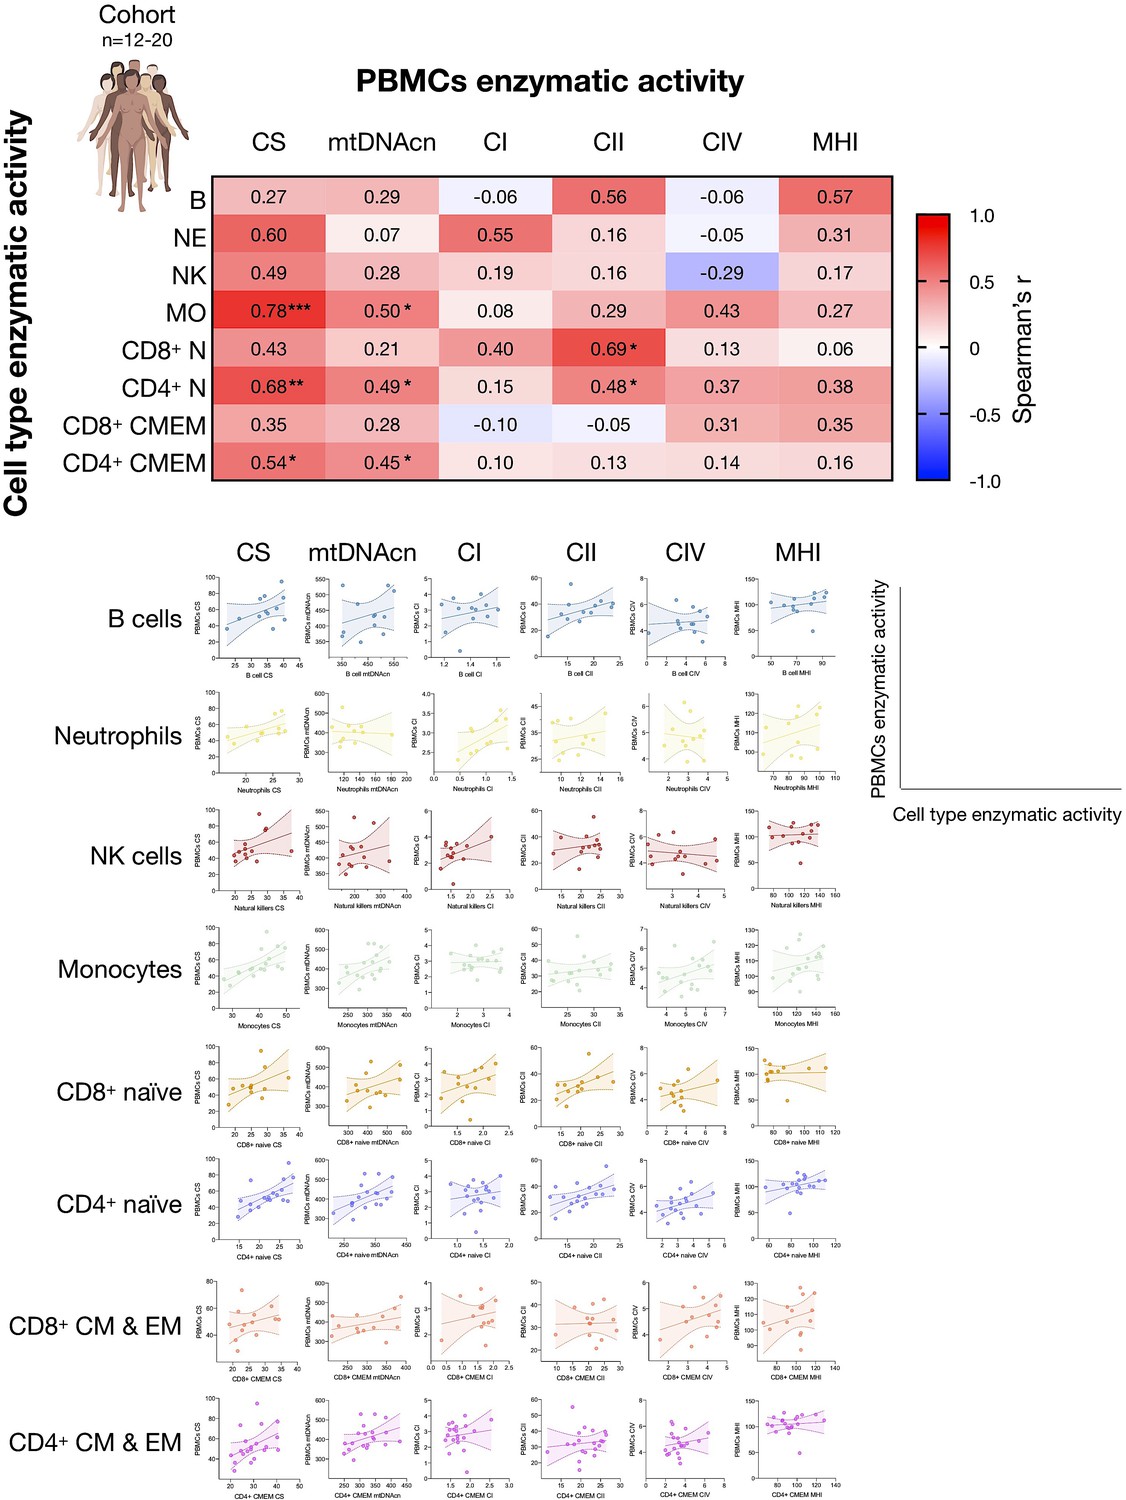
Associations between subtype-specific enzymatic activities with mitochondrial features measured in PBMCs.
Correlations of the mitochondrial features measured in each cell subtype and the same mitochondrial feature measured in PBMCs for the cohort (n=12–20). Heatmaps for the cohort show to what extent PBMCs-based measures reflect activities in various immunologically defined cell subtypes. This data integrates data presented in Appendix 2—figure 1, here focused on PBMCs. PBMC, peripheral blood mononuclear cell.
-
Figure 4—figure supplement 1—source data 1
Associations between subtype-specific enzymatic activities with mitochondrial features measured in PBMCs.
PBMC, peripheral blood mononuclear cell.
- https://cdn.elifesciences.org/articles/70899/elife-70899-fig4-figsupp1-data1-v2.xlsx
Figure 5

Associations of mitochondrial features with sex and age across cell subtypes.
(a–f) Effect size of sex differences in mitochondrial activity across cell subtypes quantified by Hedges’ g. The fold change computed from raw values is shown on the right. p-values from Mann-Whitney test, not adjusted for multiple comparisons. Error bars reflect the 95% CI on the effect size. (g–l) Association of age and mitochondrial features across cell subtypes. p-values from Spearman’s r correlations, not adjusted for multiple comparisons. n=21 (11 women, 10 men), p<0.05*, p<0.01**, p<0.001***. CI, confidence interval.
-
Figure 5—source data 1
Associations of mitochondrial features with sex and age across cell subtypes.
- https://cdn.elifesciences.org/articles/70899/elife-70899-fig5-data1-v2.xlsx
Figure 6 with 3 supplements
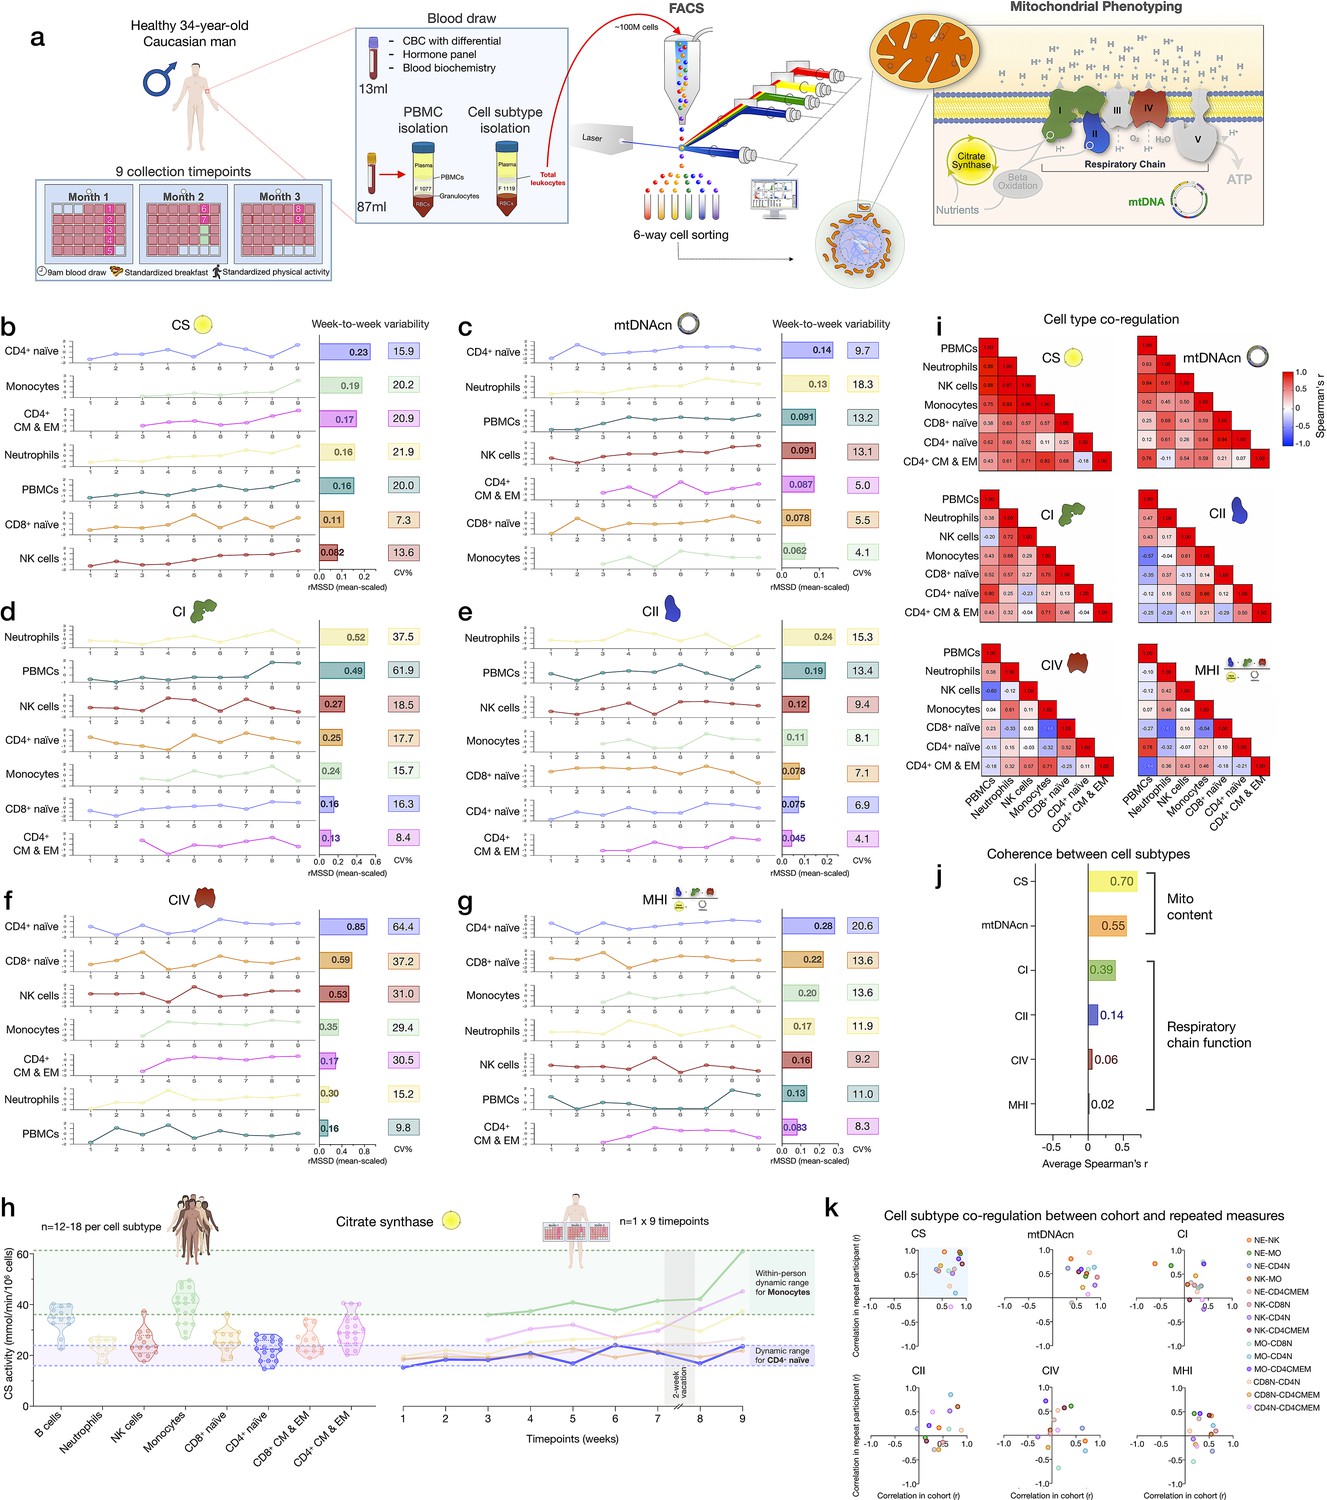
Within-person variability of mitochondrial features across cell subtypes.
(a) Overview of the repeat participant design, including blood collection, processing, and analysis. Five million cells per purified cell subtype were used for analyses. All samples were collected, stored, and processed as a single batch with samples from the cohort. Mitochondrial phenotyping platform schematic adapted from Figure 1a, Picard et al., 2018. (b–g) Natural weekly variation for each mitochondrial feature across cell subtypes in the same person across 9 weeks represented as scaled centered data where one unit change represents a one standard deviation (SD) difference. Root mean square of the successive differences (rMSSDs) quantify the magnitude of variability between successive weeks. The coefficients of variation (CVs) quantify the magnitude of variability across all time points. Monocytes and CD4+ CM-EM were not collected on weeks 1 and 2. (h) Side-by-side comparison of CS activity between the cohort (n=12–18 per cell subtype) and the repeat participant (n=7–9 time points) across cell subtypes. The dynamic range of two cell subtypes are highlighted: monocytes and CD4+ naïve T cells. (i) Within-person correlation matrices between cell subtypes for each mitochondrial feature over 9 weeks, illustrating the magnitude of correlation (co-regulation) between cell subtypes. (j) Average inter-correlation across all cell subtypes by mitochondrial feature (calculated using Fisher z-transformation) indicating the degree of coherence within-person. (k) Comparison of co-regulation patterns among mitochondrial features between the cohort and the repeat participant. Each data point represents a cell subtype pair, indicating moderate agreement (data points in top right quadrant). CM, central memory; CS, citrate synthase; EM, effector memory.
-
Figure 6—source data 1
Within-person variability of mitochondrial features across cell subtypes.
- https://cdn.elifesciences.org/articles/70899/elife-70899-fig6-data1-v2.xlsx
Figure 6—figure supplement 1
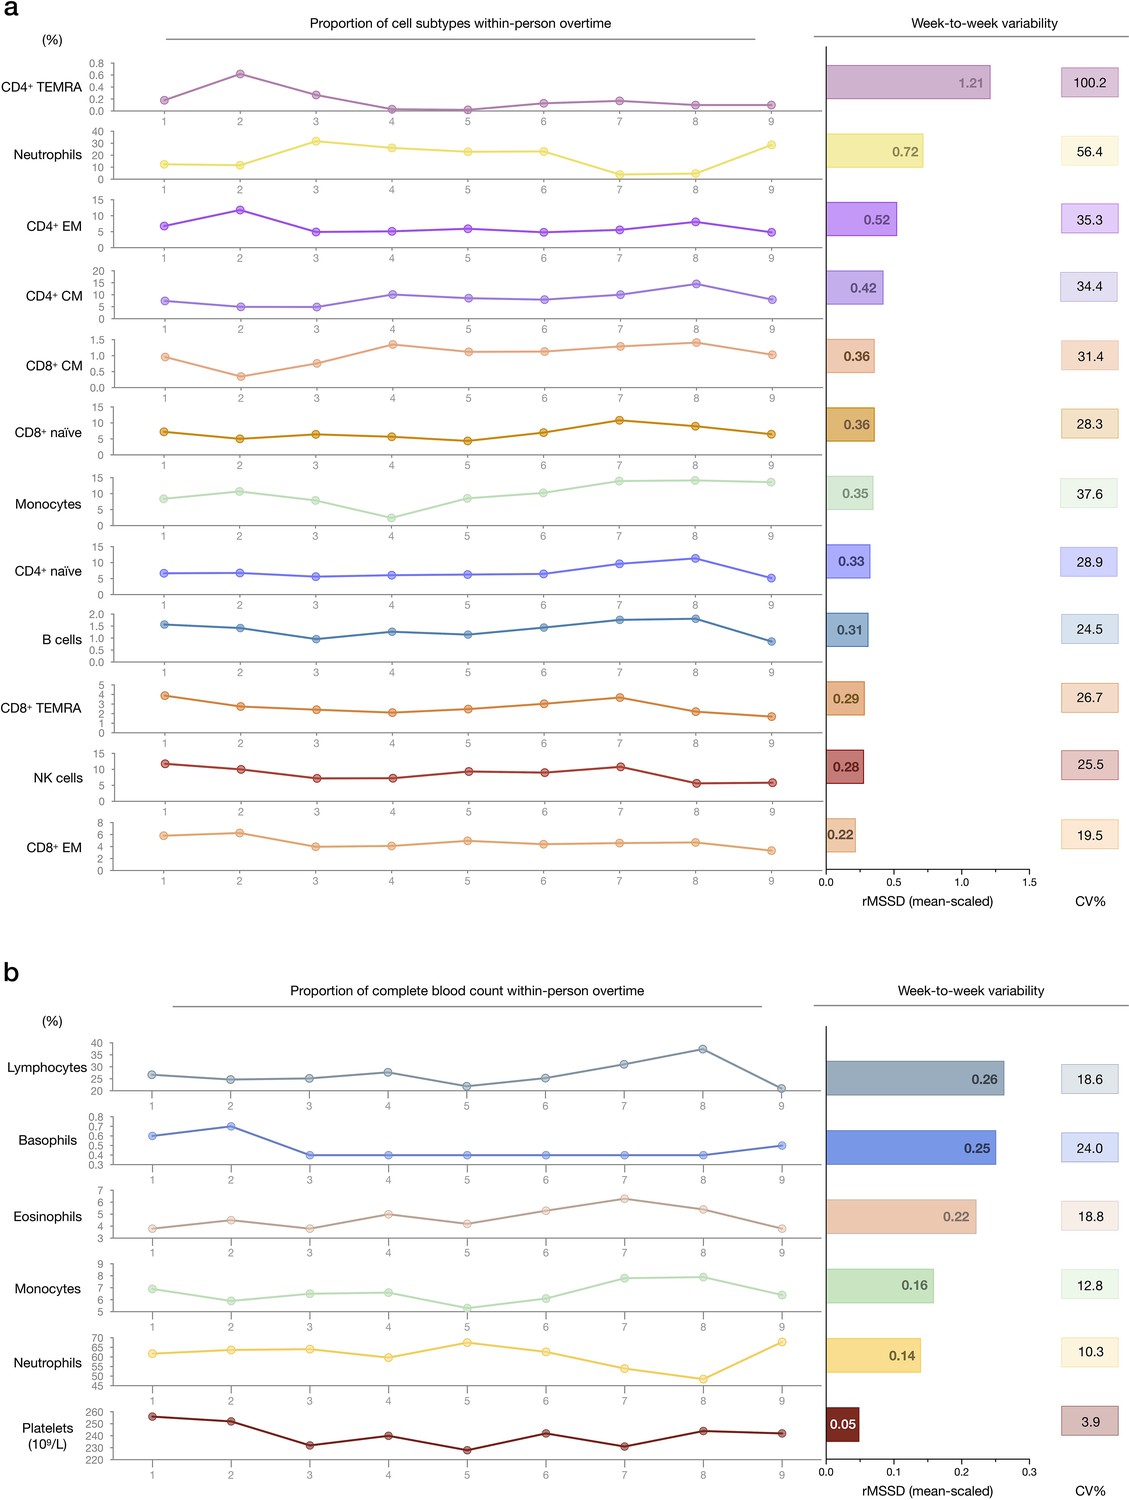
Within-person variability of cell subtype proportions over time.
(a) Within-person variation of cell type proportions across 9 weeks. The FACS-derived raw cell proportions (% of total cells) are shown on the left. Root mean square of successive differences (rMSSDs) illustrating the magnitude of variability between successive weeks, and CV illustrating the magnitude of variability across the total 9 weeks are provided on the right for each cell subtype, by mitochondrial feature. (b) Same as (a), but based on CBC results. CBC, complete blood count; FACS, fluorescence-activated cell sorting.
-
Figure 6—figure supplement 1—source data 1
Within-person variability of cell subtype proportions over time.
- https://cdn.elifesciences.org/articles/70899/elife-70899-fig6-figsupp1-data1-v2.xlsx
Figure 6—figure supplement 2
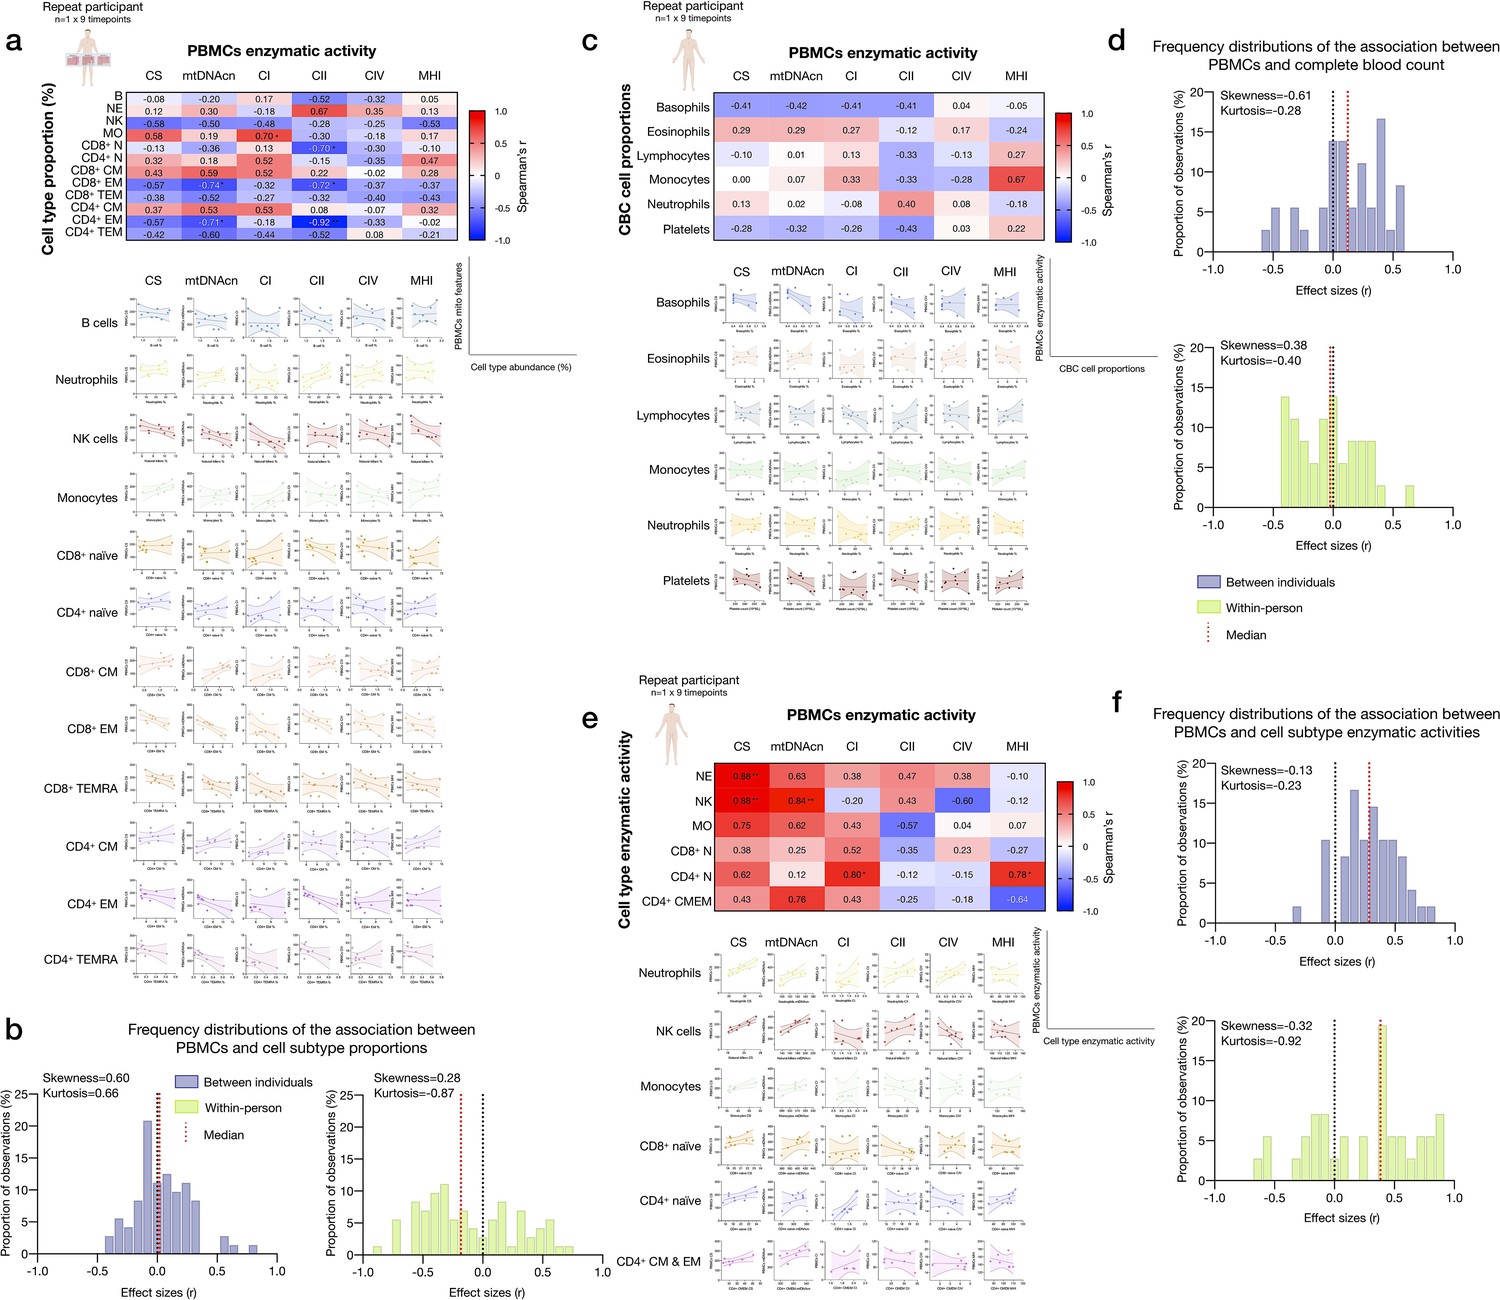
Associations between subtype-specific and CBC cell proportions, and subtype-specific enzymatic activities with mitochondrial features measured in PBMCs.
(a) Pairwise correlations of cell subtype proportions obtained from cell sorting with mitochondrial features measured in PBMCs for the repeat participant (n=1×9 time points). Aggregate correlations are shown as a heatmap (top) and individual scatterplots (bottom). (b) Frequency distributions of the effect sizes between PBMC mitochondrial features and cell subtypes proportions for the cohort (Figure 2) and the repeat participant (total correlation pairs=72, for both). (c) Correlations between CBC-based cell type abundance (% of total leukocytes) and PBMCs mitochondrial features for the repeat participant (n=1×9 time points). (d) Frequency distribution of effect sizes. (e) Correlations of the mitochondrial features measured in each cell subtype and the same mitochondrial feature measured in PBMCs for the repeat participant. Heatmaps for the repeat participant (n=1×9 time points) show to what extent PBMCs-based measures reflect activities in various immunologically defined cell subtypes. This data integrates data presented in Figure 6, here focused on PBMCs. (f) Frequency distributions of effect sizes for association between PBMC and cell subtype mitochondrial features for the cohort and the repeat participant (total correlation pairs=36, for both), showing a predominance of positive correlations. CBC, complete blood count; PBMC, peripheral blood mononuclear cell.
-
Figure 6—figure supplement 2—source data 1
Associations between subtype-specific and CBC cell proportions, and subtype-specific enzymatic activities with mitochondrial features measured in PBMCs.
CBC, complete blood count; PBMC, peripheral blood mononuclear cell.
- https://cdn.elifesciences.org/articles/70899/elife-70899-fig6-figsupp2-data1-v2.xlsx
Figure 6—figure supplement 3
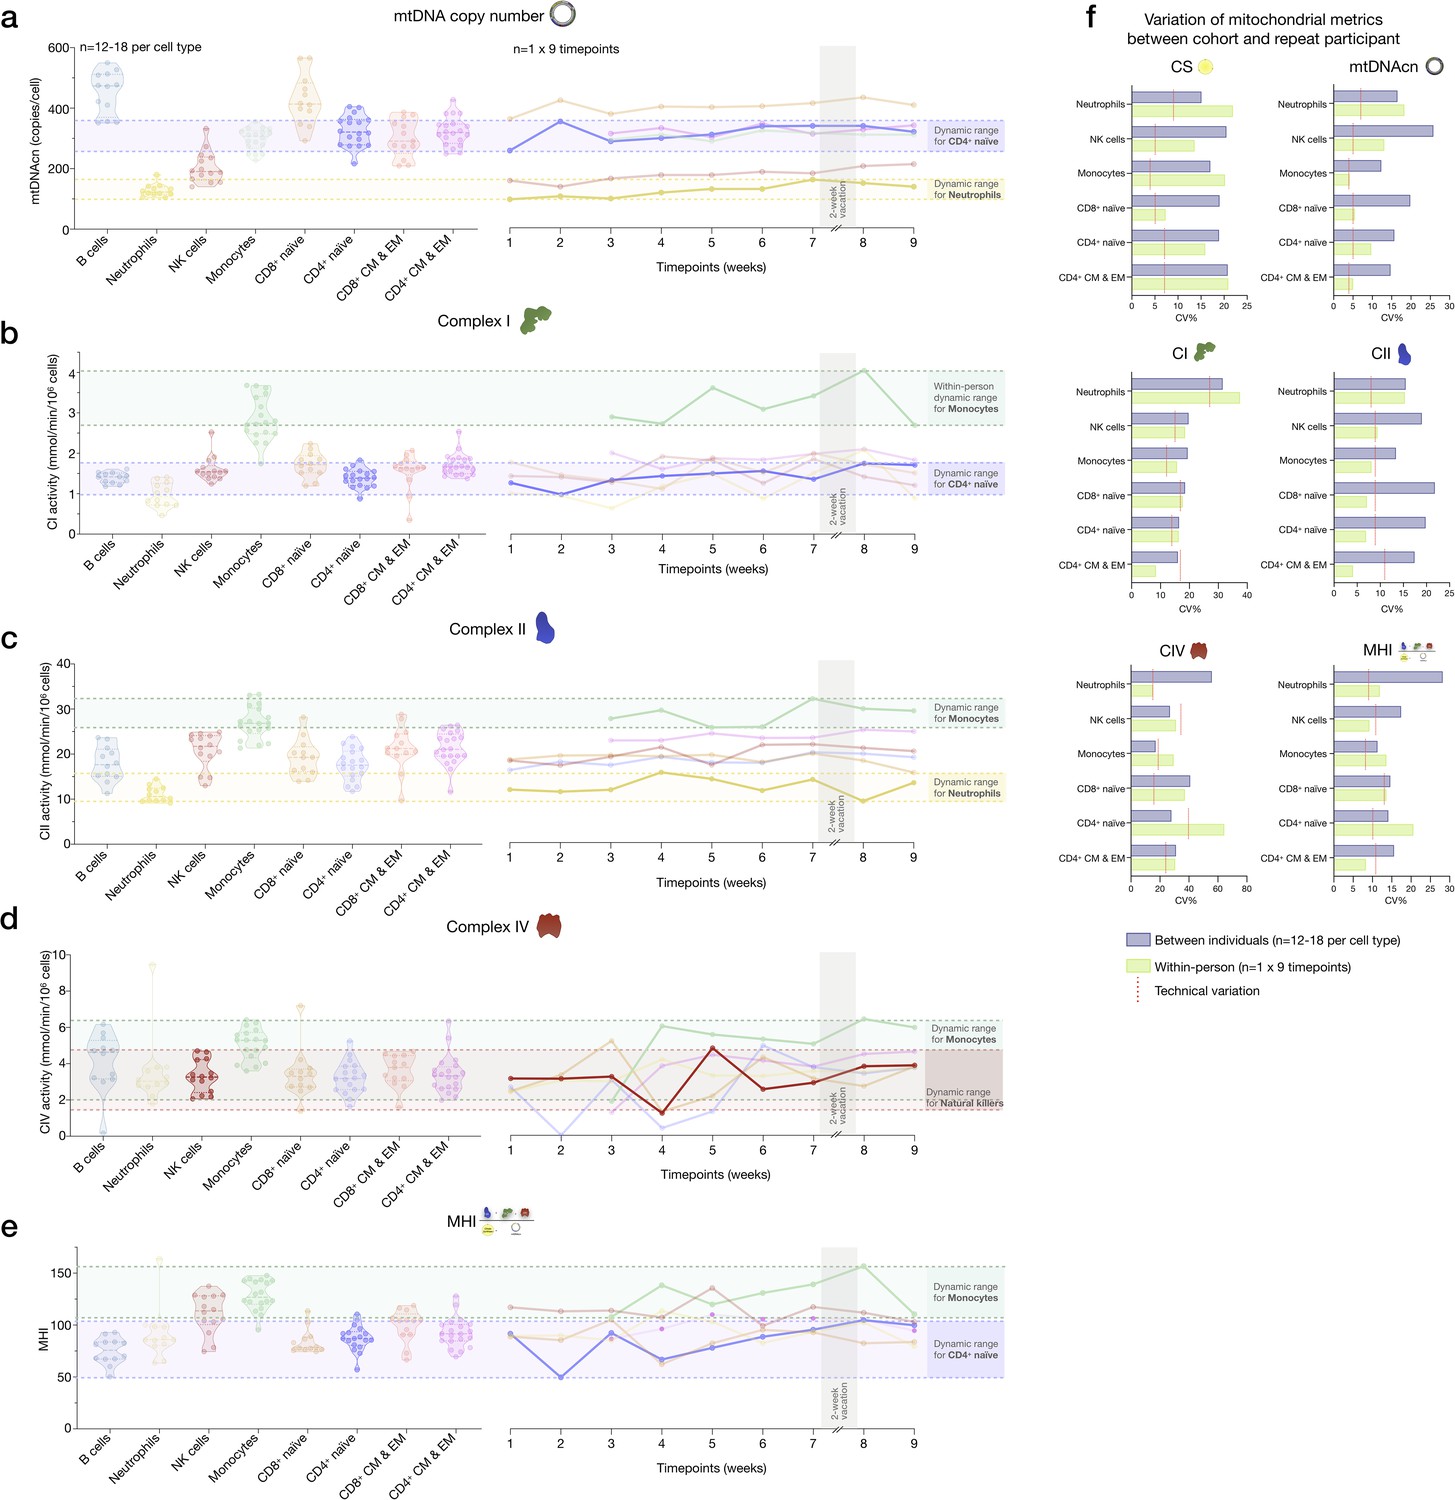
Variability of mitochondrial features across cell subtypes between the cohort and the repeat participant.
(a–e) Side-by-side comparison of mitochondrial features between the cohort (n=12–18 per cell type) and the repeat participant (n=1×9 time points) across cell subtypes. This figure shows the same data as in main Figure 6h, but for all mitochondrial features. (f) Summary of (a–e) illustrated by a bar graph showing observed variation (CV) of mitochondrial features between the cohort and the repeat participant. The technical variation established on a subset of samples and likely represents a conservative overestimation of noise is shown by red lines. CV, coefficient of variation.
-
Figure 6—figure supplement 3—source data 1
Variability of mitochondrial features across cell subtypes between the cohort and the repeat participant.
- https://cdn.elifesciences.org/articles/70899/elife-70899-fig6-figsupp3-data1-v2.xlsx
Figure 7 with 1 supplement
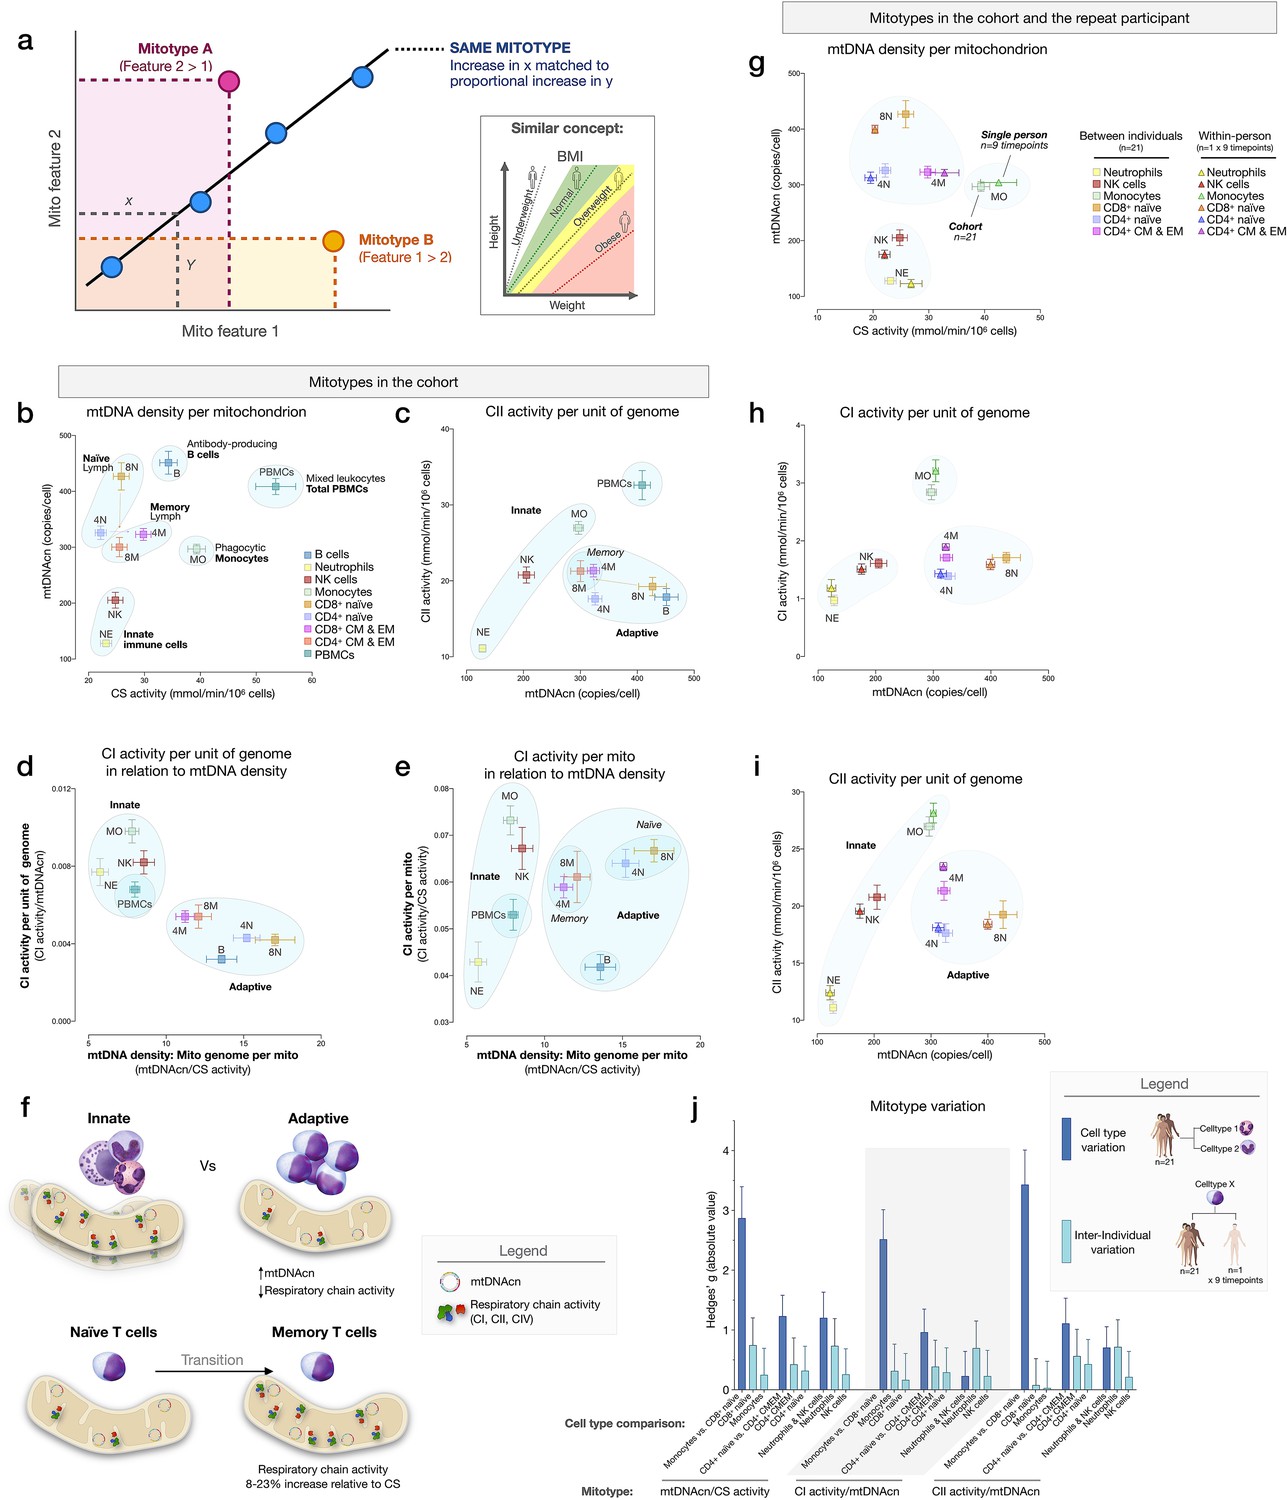
Mitotypes in purified leukocyte populations from the cohort and repeated measures.
(a) Schematic illustrating the multivariate approach to generate and visualize mitotypes by putting into relation two or more mitochondrial features. Note the similarity and added insight relative to single metrics, similar to the integration of height and weight into the body mass index (BMI). (b–e) Selected mitotypes plotted for each cell subtype among the cohort. Data are means± SEM (n=12–18). Overlaid shaded areas denote general leukocyte categories, for visualization purposes only. (f) Summary of mitotype differences between (i) innate versus adaptive subdivisions, and (ii) naïve versus memory T cells. (g–i) Validation of subtype-specific mitotype differences in the repeat participant, illustrating the conserved nature of mitotypes across individuals. Only the six cell subtypes analyzed in the repeat participant are plotted. Data are means± SEM (n=7–9 for the repeat participant, 12–18 for the cohort). (j) Comparison of the magnitude of the difference (Hedges’ g) in mitotypes between cell types, and between individuals. Dark blue bars indicate the magnitude of the dominant difference in mitotypes between cell subtypes. Light blue bars indicate the magnitude of the difference between the cohort and the repeat participant within a cell type. Error bars are the 95% CI of the effect size. CI, confidence interval.
-
Figure 7—source data 1
Mitotypes in purified leukocyte populations from the cohort and repeated measures.
- https://cdn.elifesciences.org/articles/70899/elife-70899-fig7-data1-v2.xlsx
Figure 7—figure supplement 1
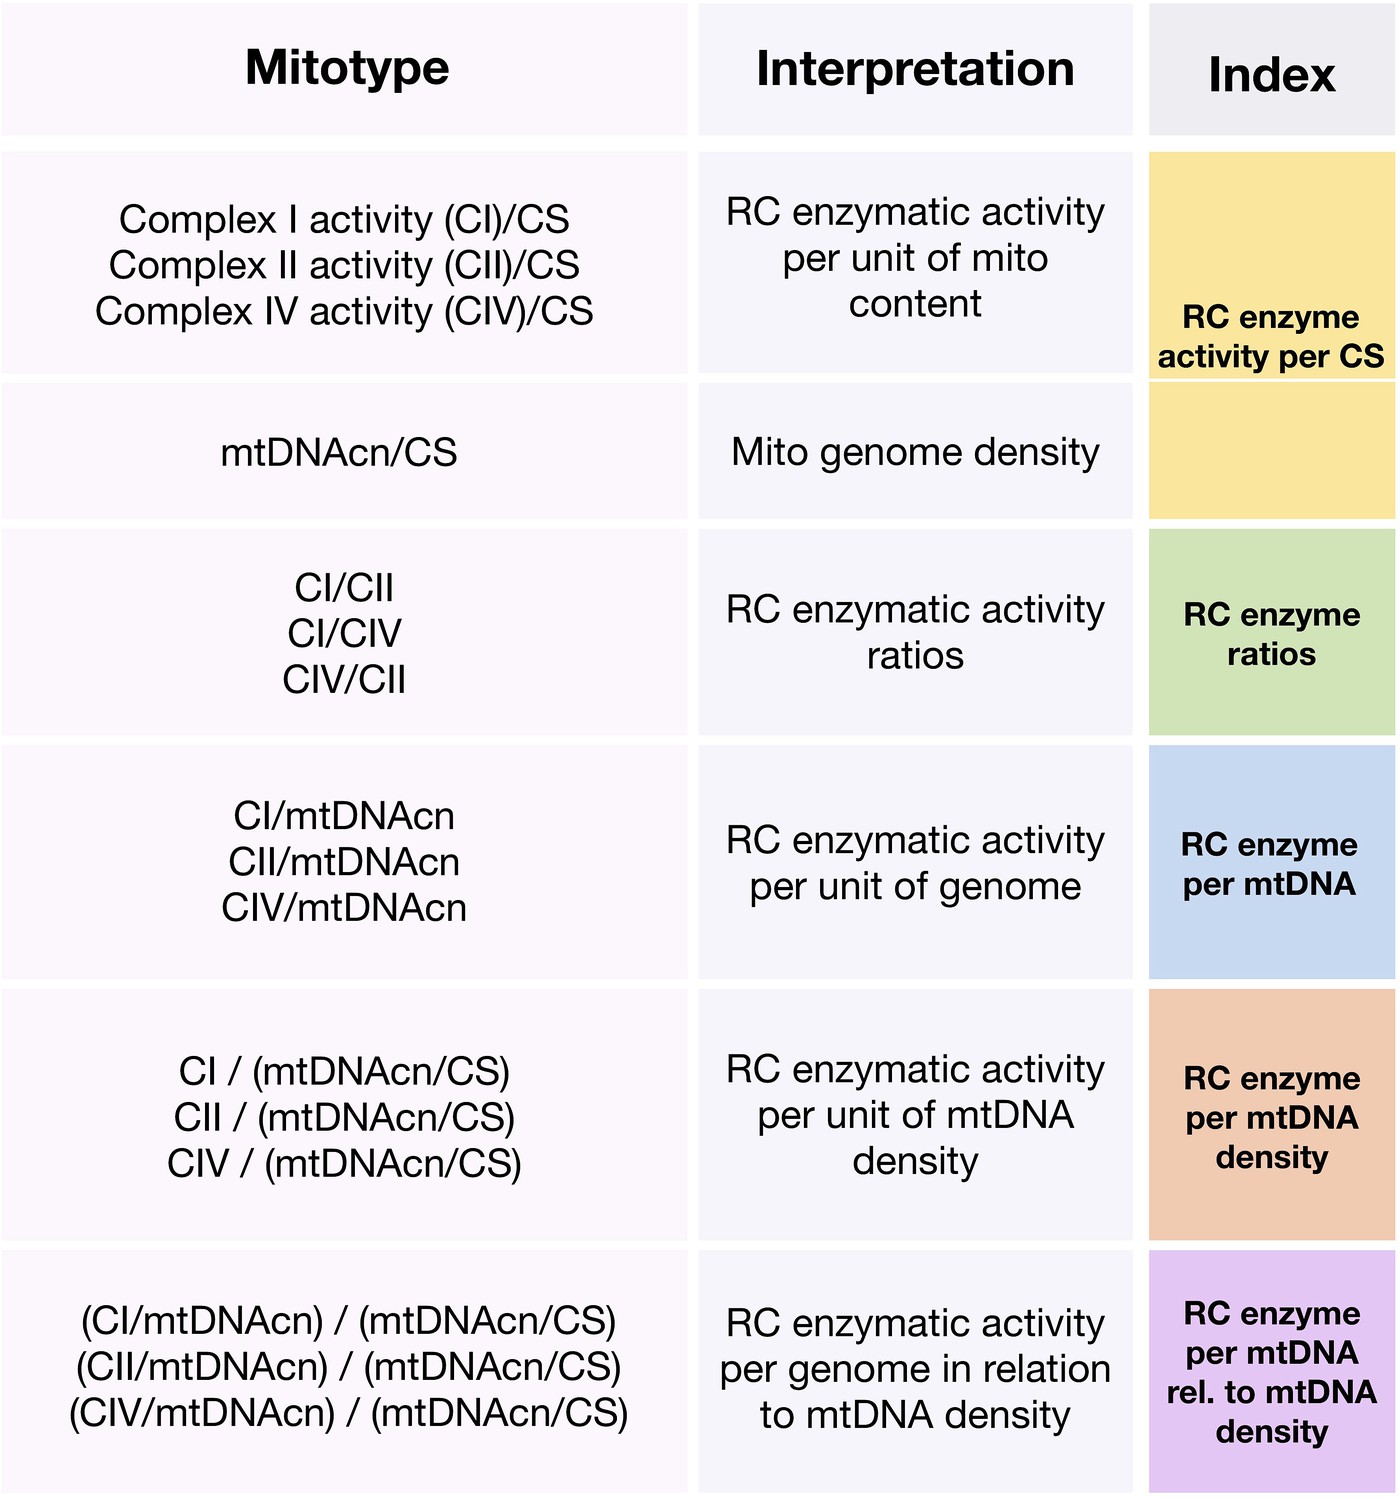
Operationalization and categorization of mitotypes.
Chart illustrating mitotype ratios and their simple interpretations.
Figure 8
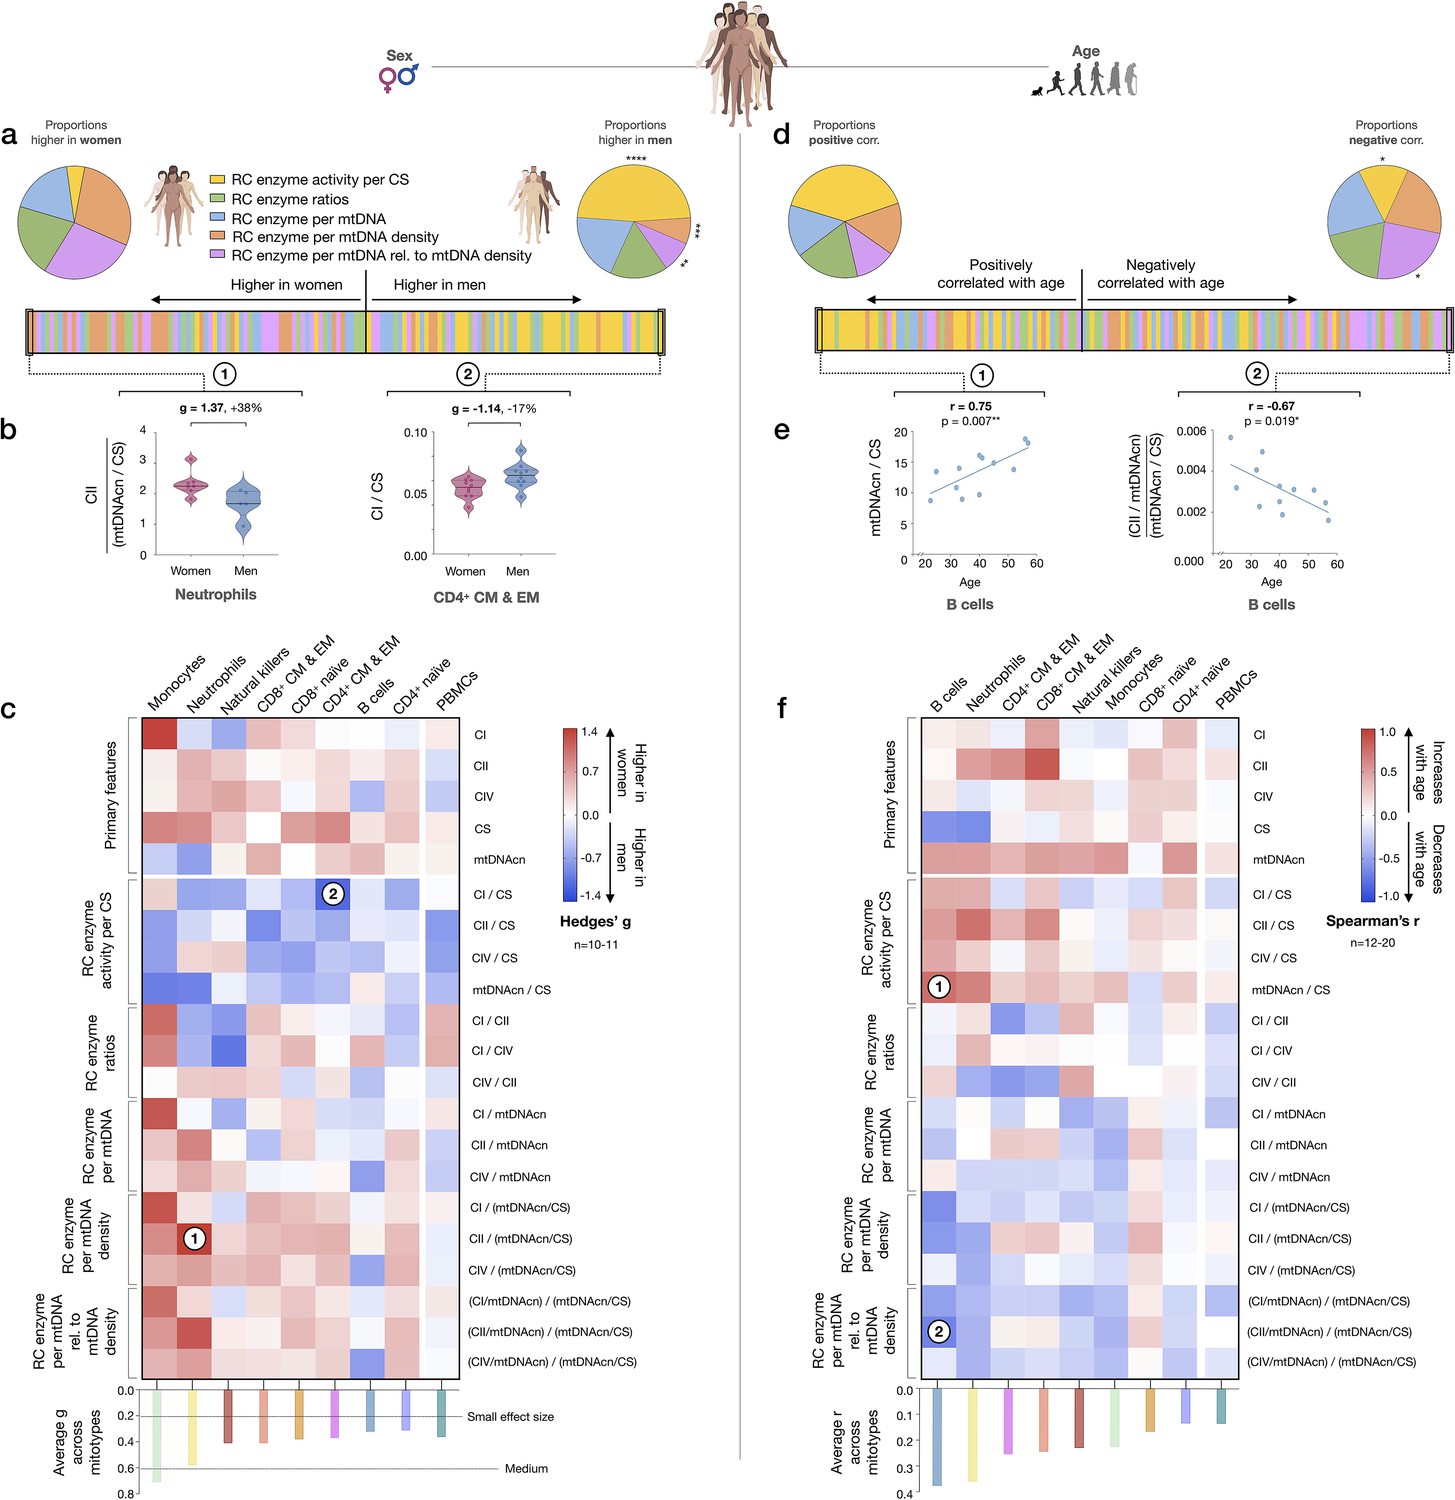
Mitotype distribution and strength of difference across sex and age.
(a) Ranking of mitotype indices by the effect size (Hedges’ g) between women and men. A total of 16 mitotype indices were computed, subdivided into five main color-coded categories (see Figure 7—figure supplement 1). Pie charts illustrate the proportion mitotypes belonging to each category that are either higher in women (left) or in men (right). p-values for enrichment of sexually dimorphic mitotypes are derived from the Chi-square test. (b) Violin plots illustrating the two mitotypes with the largest sex differences, both showing large effect sizes (g). (c) Heatmap of sex differences for primary measures of mitochondrial function (top) and multivariate mitotypes (bottom) across cell subtypes. The histogram at the bottom shows the average effect size across all mitotypes (calculated from absolute g values). (d) Ranking of mitotype indices by the strength and direction of their association with age, with enrichment analysis analyzed as for sex (Chi-square test). (e) Spearman’s r correlations of mitotypes/cell type combinations with the strongest positive and negative associations with age. (f) Heatmap of the age correlations (Spearman’s r) for primary features and composite mitotypes across cell subtypes. The histogram (bottom) shows the average effect size (r) for each cell subtype (calculated using absolute values and Fisher z-transformation). p<0.05*, p<0.01**, p<0.001***, p<0.0001****.
-
Figure 8—source data 1
Mitotype distribution and strength of difference across sex and age.
- https://cdn.elifesciences.org/articles/70899/elife-70899-fig8-data1-v2.xlsx
Figure 9
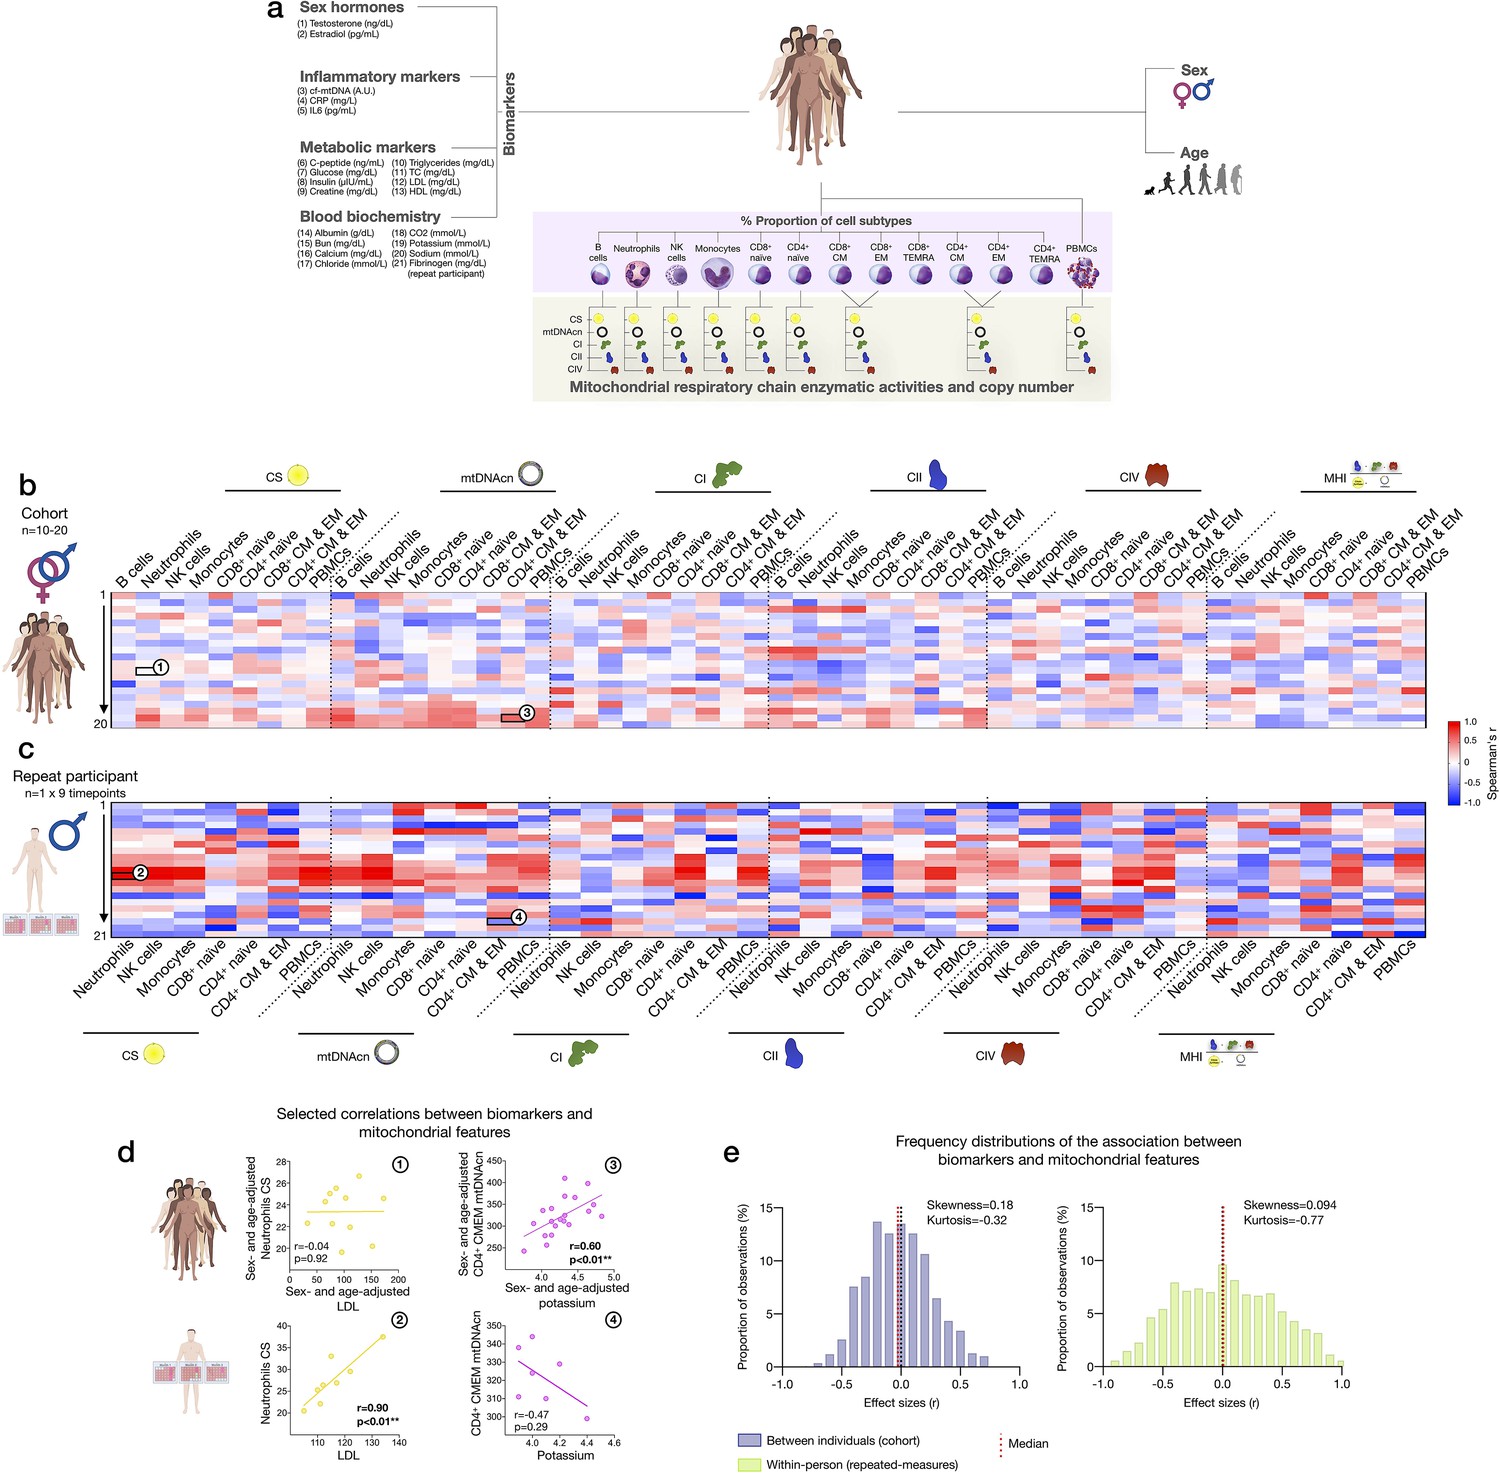
Association of blood biomarkers with mitochondrial parameters across cell subtypes and primary mitochondrial features.
(a) Overview of blood biochemistry, hormonal, and metabolic biomarkers collected for each participant. (b) Sex- and age-adjusted correlations between blood biomarkers and mitochondrial features across cell subtypes for the cohort (n=10–20 per mito:biomarker combinations) are shown as a heatmap. (c) Same as (b), but using weekly measures of both mitochondrial features and biomarkers in the repeat participant. (d) Scatterplots of the indicated correlations between Neutrophils CS activity and LDL cholesterol (left), and CD4+ CM-EM mtDNAcn and potassium (K+) (right) for the cohort (top row) and the repeat participant (bottom row). (e) Frequency distributions of the aggregated effect sizes between biomarkers and mitochondrial features across cell subtypes for the cohort (total correlation pairs=1080) and the repeat participant (total correlation pairs=882). CM, central memory; CS, citrate synthase; EM, effector memory; LDL, low-density lipoprotein.
-
Figure 9—source data 1
Association of blood biomarkers with mitochondrial parameters across cell subtypes and primary mitochondrial features.
- https://cdn.elifesciences.org/articles/70899/elife-70899-fig9-data1-v2.xlsx
Appendix 2—figure 1
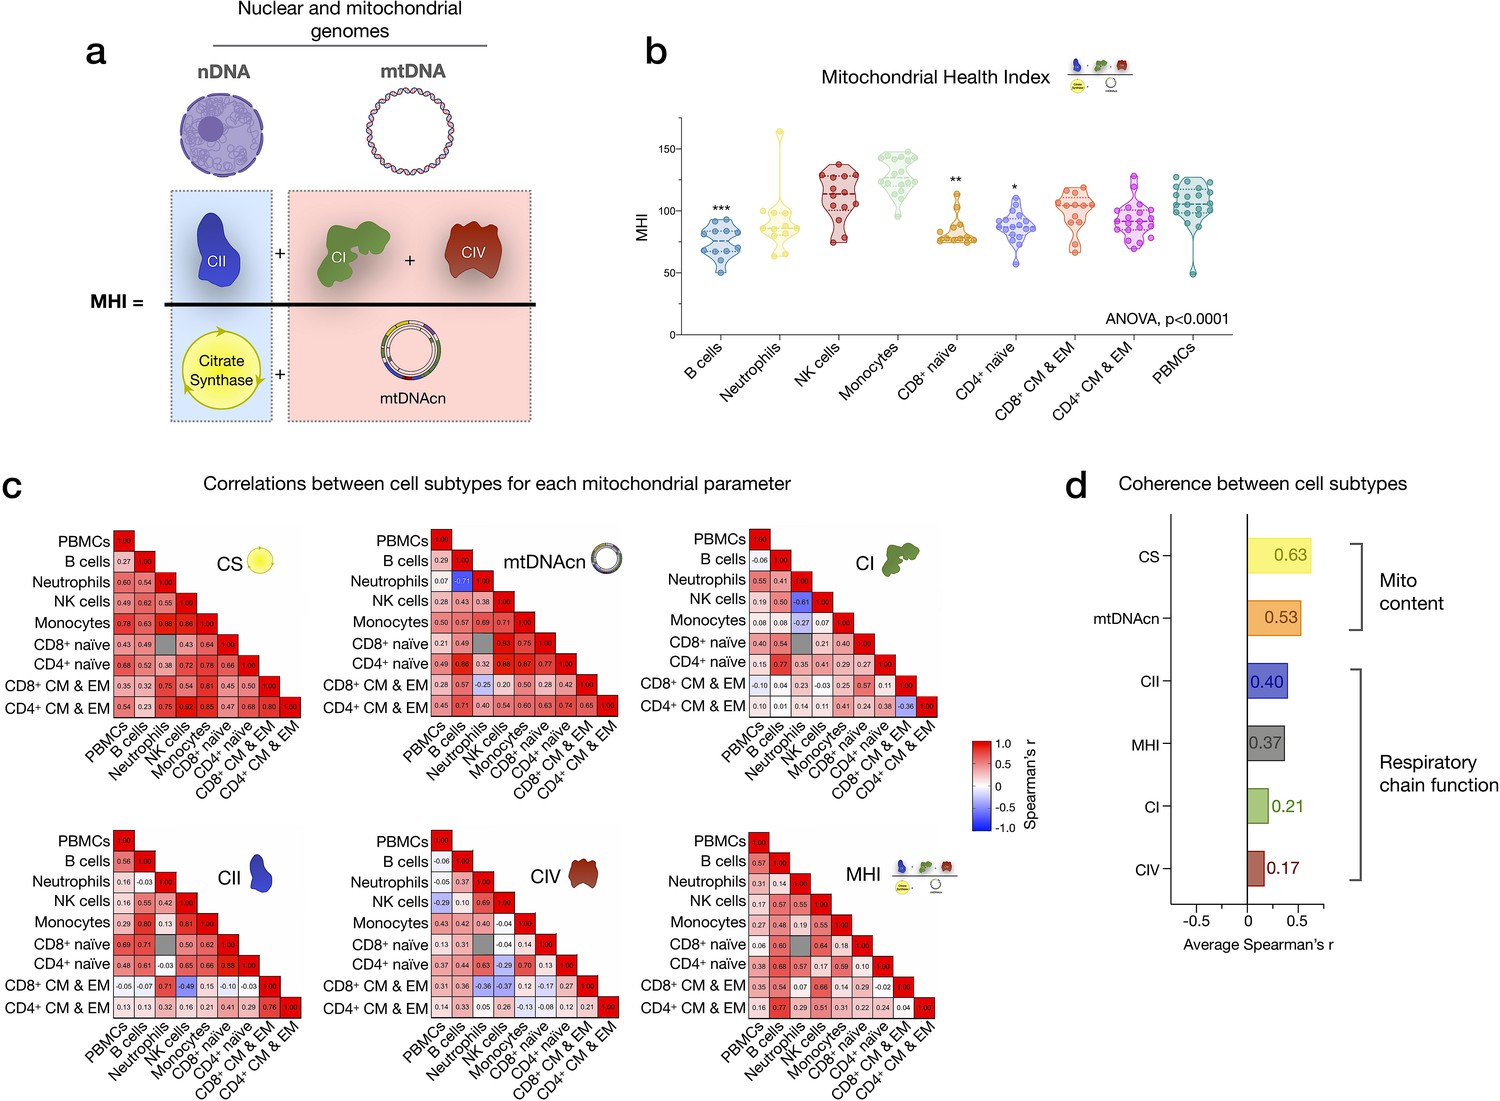
Mitochondrial health index (MHI) and coherence of mitochondrial features across cell subtypes.
(a) Schematic of the MHI equation reflecting respiratory chain function as the numerator, and markers of mitochondrial content as the denominator, yielding a metric of energy production capacity on a per-mitochondrion basis. (b) MHI across immune cell subtypes. Dashed lines are median (thick), with 25th and 75th quartiles (thin). p-values from one-way nonparametric ANOVA Kruskal-Wallis test with Dunn’s multiple comparison test of subtypes relative to PBMCs, n=12–18 per cell subtype. (c) Correlation matrices (Spearman’s r) showing the association between cell subtypes in mitochondrial features. Correlations were not computed for cell subtype pairs with fewer than n=6 observations (gray cell). (d) Average effect sizes reflecting the within-person coherence of mitochondrial features across cell types (calculated using Fisher’s z-transformation). p<0.05*, p<0.001***.
-
Appendix 2—figure 1—source data 1
Mitochondrial health index and coherence of mitochondrial features across cell subtypes.
- https://cdn.elifesciences.org/articles/70899/elife-70899-app2-fig1-data1-v2.xlsx
Additional files
-
Supplementary file 1
Leukocyte subtypes included in the study.
Immune cell subtypes included in this study, including a brief summary of their functions and cell surface markers used for immunolabeling and FACS. FACS, fluorescence-activated cell sorting.
- https://cdn.elifesciences.org/articles/70899/elife-70899-supp1-v2.xlsx
-
Supplementary file 2
CBC- and FACS-based cell proportions for all study participants and time points.
Participants are ordered by age. CBC measurements were performed using a Sysmex XN-9000 instrument, and FACS-based cell proportions were determined using a BD Influx cell sorter (see Appendix 1 for details). CBC, complete blood count; FACS, fluorescence-activated cell sorting.
- https://cdn.elifesciences.org/articles/70899/elife-70899-supp2-v2.xlsx
-
Supplementary file 3
Technical variation for each mitochondrial assay and calculated MHI by cell type.
Coefficients of variation (CVs) across 2–5 biological replicates (different 5 M cell pellet isolated from the same blood draw) for each cell subtype and PBMCs (see Appendix 1 for details). MHI, mitochondrial health index; PBMC, peripheral blood mononuclear cell.
- https://cdn.elifesciences.org/articles/70899/elife-70899-supp3-v2.xlsx
-
Supplementary file 4
Recipes for antibody cocktails used to detect cell surface markers for FACS-based cell proportions and sorting (see Appendix 1 for details).
FACS, fluorescence-activated cell sorting.
- https://cdn.elifesciences.org/articles/70899/elife-70899-supp4-v2.xlsx
-
Transparent reporting form
- https://cdn.elifesciences.org/articles/70899/elife-70899-transrepform1-v2.docx
-
Source data 1
Technical variation for each mitochondrial assay and calculated MHI by cell type.
- https://cdn.elifesciences.org/articles/70899/elife-70899-supp5-v2.xlsx
-
Appendix 2—figure 1—source data 1
Mitochondrial health index and coherence of mitochondrial features across cell subtypes.
- https://cdn.elifesciences.org/articles/70899/elife-70899-app2-fig1-data1-v2.xlsx
Download links
A two-part list of links to download the article, or parts of the article, in various formats.
Downloads (link to download the article as PDF)
Open citations (links to open the citations from this article in various online reference manager services)
Cite this article (links to download the citations from this article in formats compatible with various reference manager tools)
Mitochondrial phenotypes in purified human immune cell subtypes and cell mixtures
eLife 10:e70899.
https://doi.org/10.7554/eLife.70899


