Enrichment of SARM1 alleles encoding variants with constitutively hyperactive NADase in patients with ALS and other motor nerve disorders
- John van Geest Centre for Brain Repair, Department of Clinical Neurosciences, University of Cambridge, United Kingdom
- Department of Neuromuscular Disease, UCL Queen Square Institute of Neurology and The National Hospital for Neurology, United Kingdom
- Department of Human Genetics, McGill University, Canada
- The Neuro (Montreal Neurological Institute-Hospital), McGill University, Canada
- Department of Basic and Clinical Neuroscience, Maurice Wohl Clinical Neuroscience Institute, Institute of Psychiatry, Psychology and Neuroscience, King’s College London, United Kingdom
- Department of Neurology, King's College Hospital, King’s College London, United Kingdom
- Dr. John T. Macdonald Foundation Department of Human Genetics and John P. Hussman Institute for Human Genomics, University of Miami Miller School of Medicine, United States
- Department of Neurology, UMC Utrecht Brain Center, University Medical Center Utrecht, Utrecht University, Netherlands
- Department of Neurology, University of Michigan, United States
- Institute for Genomic Medicine, Columbia University, United States
- Department of Biostatistics and Health Informatics, Institute of Psychiatry, Psychology & Neuroscience, King's College London, United Kingdom
- National Institute for Health Research Biomedical Research Centre and Dementia Unit at South London and Maudsley NHS Foundation Trust and King's College London, United Kingdom
- Center for Systems and Therapeutics, Gladstone Institutes, United States
- Gladstone Institute of Data Science and Biotechnology, Gladstone Institutes, United States
- Department of Neurosciences, University of California, San Diego, United States
- Department of Neurology and Neurosurgery, McGill University, Canada
- Center for Neurology and Hertie Institute für Clinical Brain Research, University of Tübingen, German Center for Neurodegenerative Diseases, Germany
- Sheffield Institute for Translational Neuroscience, University of Sheffield, United Kingdom
Figures
Figure 1
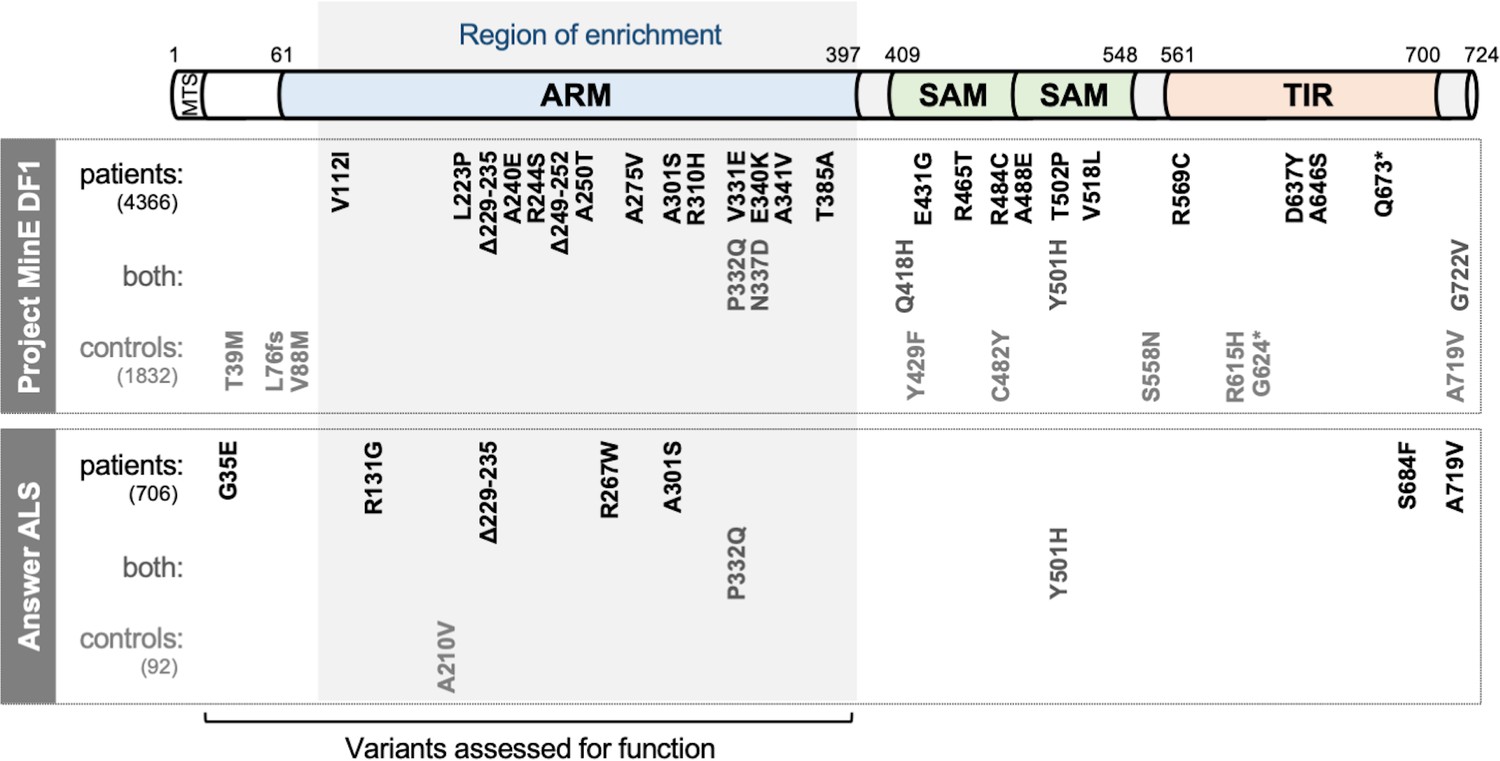
SARM1 coding variants in ALS patient and control groups.
Schematic representation of the canonical 724 amino acid human SARM1 protein showing basic domain structure and the approximate locations of the coding variation present in the Project MinE DF1 and Answer ALS datasets. Variants are separated into those seen only in ALS patients, those seen in ALS patients and controls (both), and those seen only in controls. MTS, "mitochondrial" targeting sequence; ARM, HEAT/Armadillo motif domain; SAM, sterile alpha motif domains; TIR, Toll/Interleukin receptor domain. Special note: Variants are annotated according to the canonical 724 amino acid SARM1. Project MinE DF1 currently uses gnomAD v2.1.1, which is based on genome build GRCh37/ hg19, and annotates variants to a 690 amino acid product of a non-canonical reference SARM1 cDNA sequence. This cDNA, and genome build GRCh37, contain single nucleotide substitutions, insertions and deletions at its 5' end when compared to gnomAD v3.1.1 and GRCh38/ hg38 which annotate to the canonical 724 amino acid SARM1. These differences mean that the 690 amino acid "isoform" has a truncated N-terminus, due to use of an alternative ATG codon, and switches frame until it eventually synchronises with 724 amino acid SARM1 at amino acid 107 (73 in the 690 amino acid ‘"isoform"). As such, numbering of SARM1 variants in Project MinE DF1 (and any databases annotated to gnomAD v2.11/ GRCh37) is 34 residues lower than that shown here over the synchronised region and differences more N-terminal to this must be determined individually by lift over from GRCh37 to GRCh38. Notably, the NCBI Single Nucleotide Polymorphism Database (dbSNP, including rsIDs) uses numbering based on the 724 amino acid SARM1 protein.
Figure 2 with 3 supplements

Several ALS patient-specific SARM1 ARM domain coding variants in Project MinE increase NAD+ depletion in transfected HEK 293T cells.
(A–C) Levels of NAD+ (A), NADP+ (B) and ATP (C) in extracts of HEK 293T cells 24 hr after transfection with expression constructs for Flag-tagged WT or variant SARM1 (as listed). 50 ng SARM1 vector combined with 750 ng empty vector (24-well plate format) was transfected for optimal assay conditions (see Figure 2—figure supplement 1). Data are shown as a proportion of levels in cells transfected with empty vector (ev) alone performed in parallel (set at 1, grey dashed line). Means ± SEM with individual data points are plotted (n = 4 or 5). *p < 0.05, **p < 0.01, and ***p < 0.001, multiple pairwise comparisons to WT SARM1 with FDR correction (after log transformation of data in parts A and B). Bars for WT SARM1, and the P332Q and N337D SARM1 variants, which are seen in both patient and control groups in Project MinE, are hatched to differentiate them from patient-specific variants (bold text, filled bars). (D) Representative immunoblots of the extracts described in parts A-C showing Flag-tagged WT or variant SARM1, ZsGreen (co-expressed with the exogenous SARM1 from a bicistronic mRNA) and GAPDH (acting as a loading control). Molecular weight markers (kDa) are shown on the right of each panel. Four times the amount of extract and enhanced detection was needed to detect SARM1 variants that cause the greatest NAD+ depletion (bottom right blot). (E) Representative ZsGeen fluorescence and phase contrast imaging of HEK 293T cells 24 hr after transfection with WT or Δ229–235 SARM1 expression constructs (brightness and contrast have been increased equally in each pair of images to enhance visualisation). Reduced ZsGreen signal intensity, as seen here for Δ229–235 SARM1, was consistently seen (n = 5) for variants that reduced NAD+ levels more than WT SARM1.
-
Figure 2—source data 1
Source data for Figure 2, Figure 2—figure supplements 1 and 2.
- https://cdn.elifesciences.org/articles/70905/elife-70905-fig2-data1-v3.zip
Figure 2—figure supplement 1
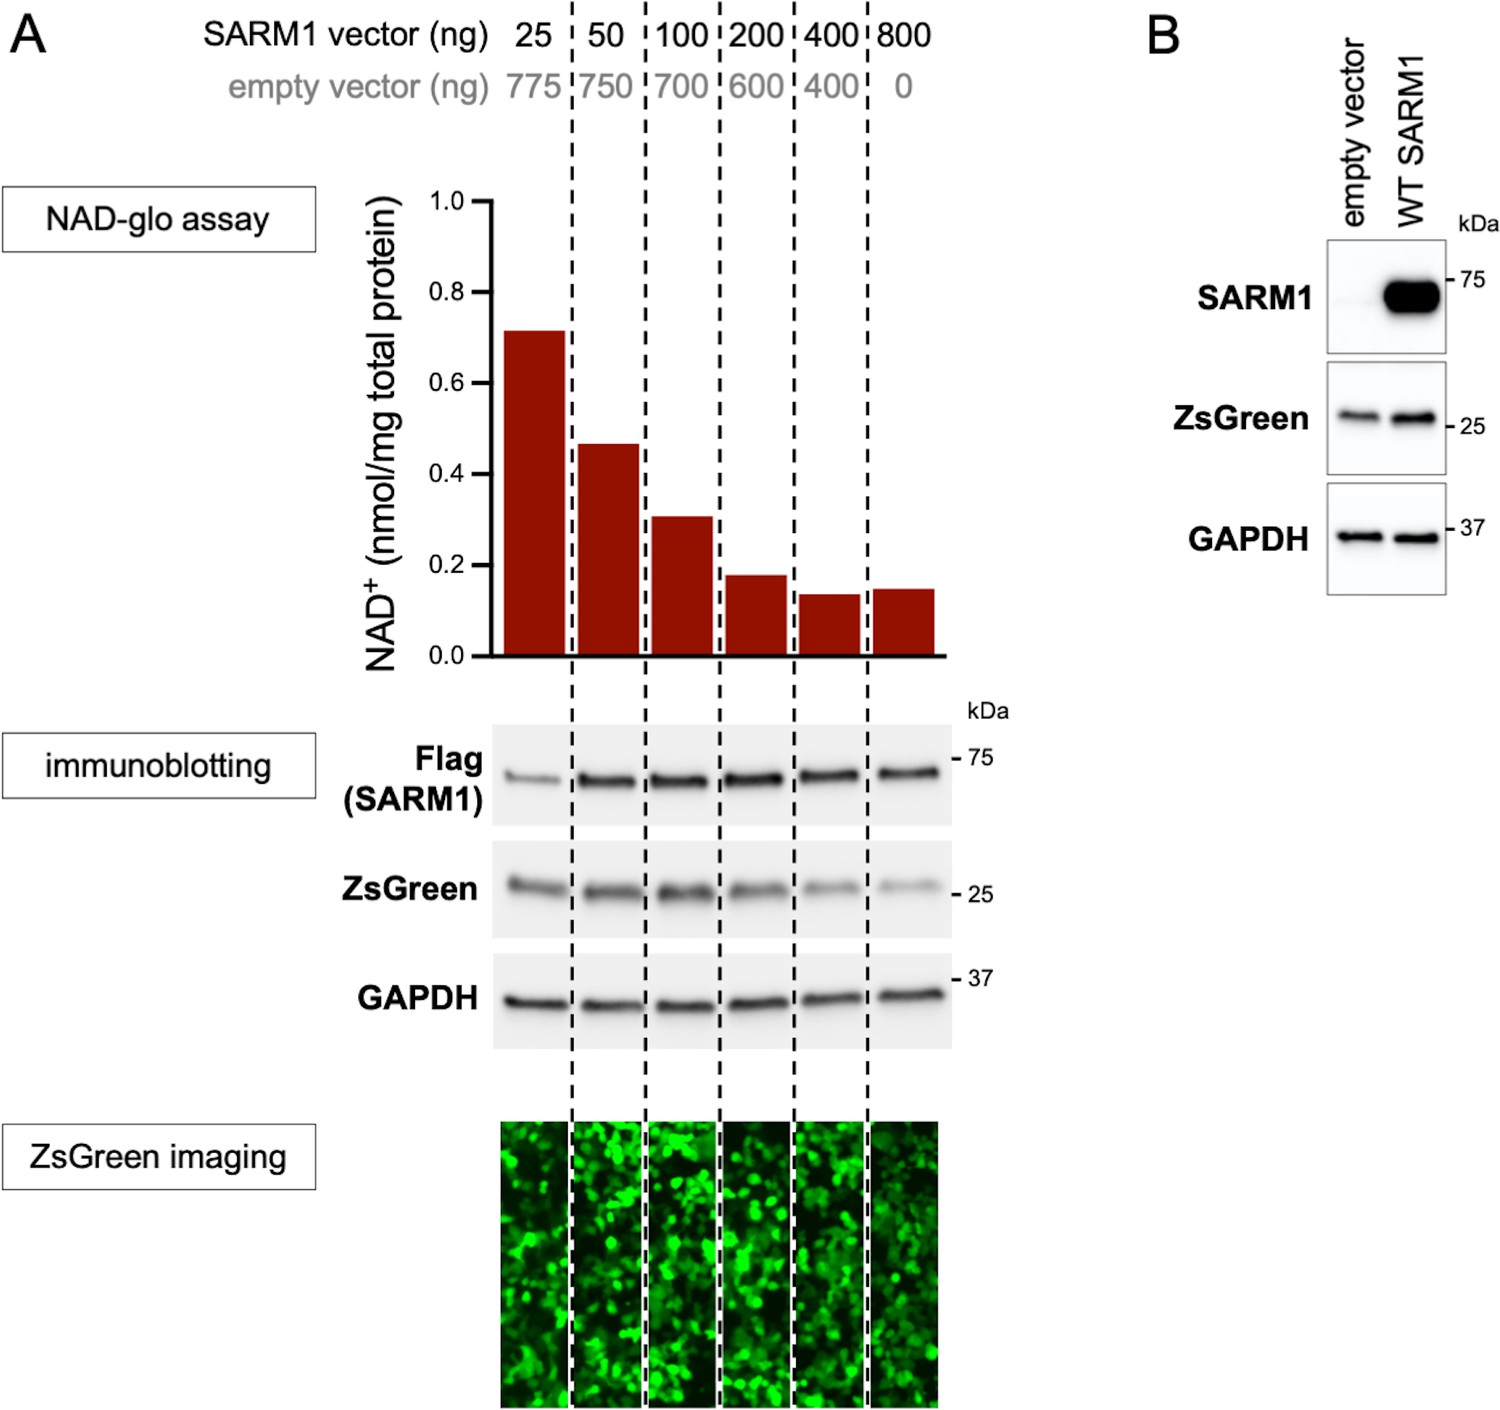
Optimisation of transfection conditions for assessing SARM1-dependent NAD+ consumption in HEK 293T cells.
(A) Standard transfection of HEK 293T cells with a SARM1 expression construct alone (800 ng in a single well of a 24-well plate) results in robust depletion of NAD+ which limits the scope for identification of GoF. We therefore titrated the amount of SARM1 expression construct against empty vector (SARM1 construct plus empty vector maintained at 800 ng) to determine a combination that would result in an intermediate level of NAD+ depletion in order to screen variants for GoF and LoF together. Equal amounts of cell lysates collected 24 hr after transfection were assessed for NAD+ levels, and for levels of C-terminal Flag-tagged SARM1, ZsGreen (co-expressed with SARM1 from a bicistronic cassette) and GAPDH (acting as a loading control) by immunoblotting. Molecular weight markers (kDa) are shown on the right of each panel. Just prior to lysis, the cells were also imaged for ZsGreen fluorescence. 50 ng of SARM1 expression construct with 750 ng of empty vector, which translates to an approximate halving of NAD+ levels relative to empty vector alone, was selected for our screening assay (Figure 2). Notably, ZsGreen expression appears to be suppressed as NAD+ levels decline (see also Figure 2—figure supplement 2). (B) Very low levels of endogenous SARM1 are present in the HEK 293T cell line used for these assays. Equal amounts of HEK 293T cell lysates (5 µg) from cells transfected with empty vector alone or a combination of 50 ng SARM1 expression construct and 750 ng empty vector (SARM1 construct [+ev]), as used in our screening assay, were assessed for levels of endogenous and/or exogenous SARM1, using a SARM1 antibody, as well as for the co-expressed ZsGreen and GAPDH (acting as a loading control). Molecular weight markers (kDa) are shown on the right of each panel. Empty vector transfected cells only express endogenous SARM1 and this is present at substantially lower levels than exogenously-expressed SARM1 seen after transfection with the SARM1 expression construct (the SARM1 blot here has been substantially overexposed relative to the Flag blot in part A).
Figure 2—figure supplement 2
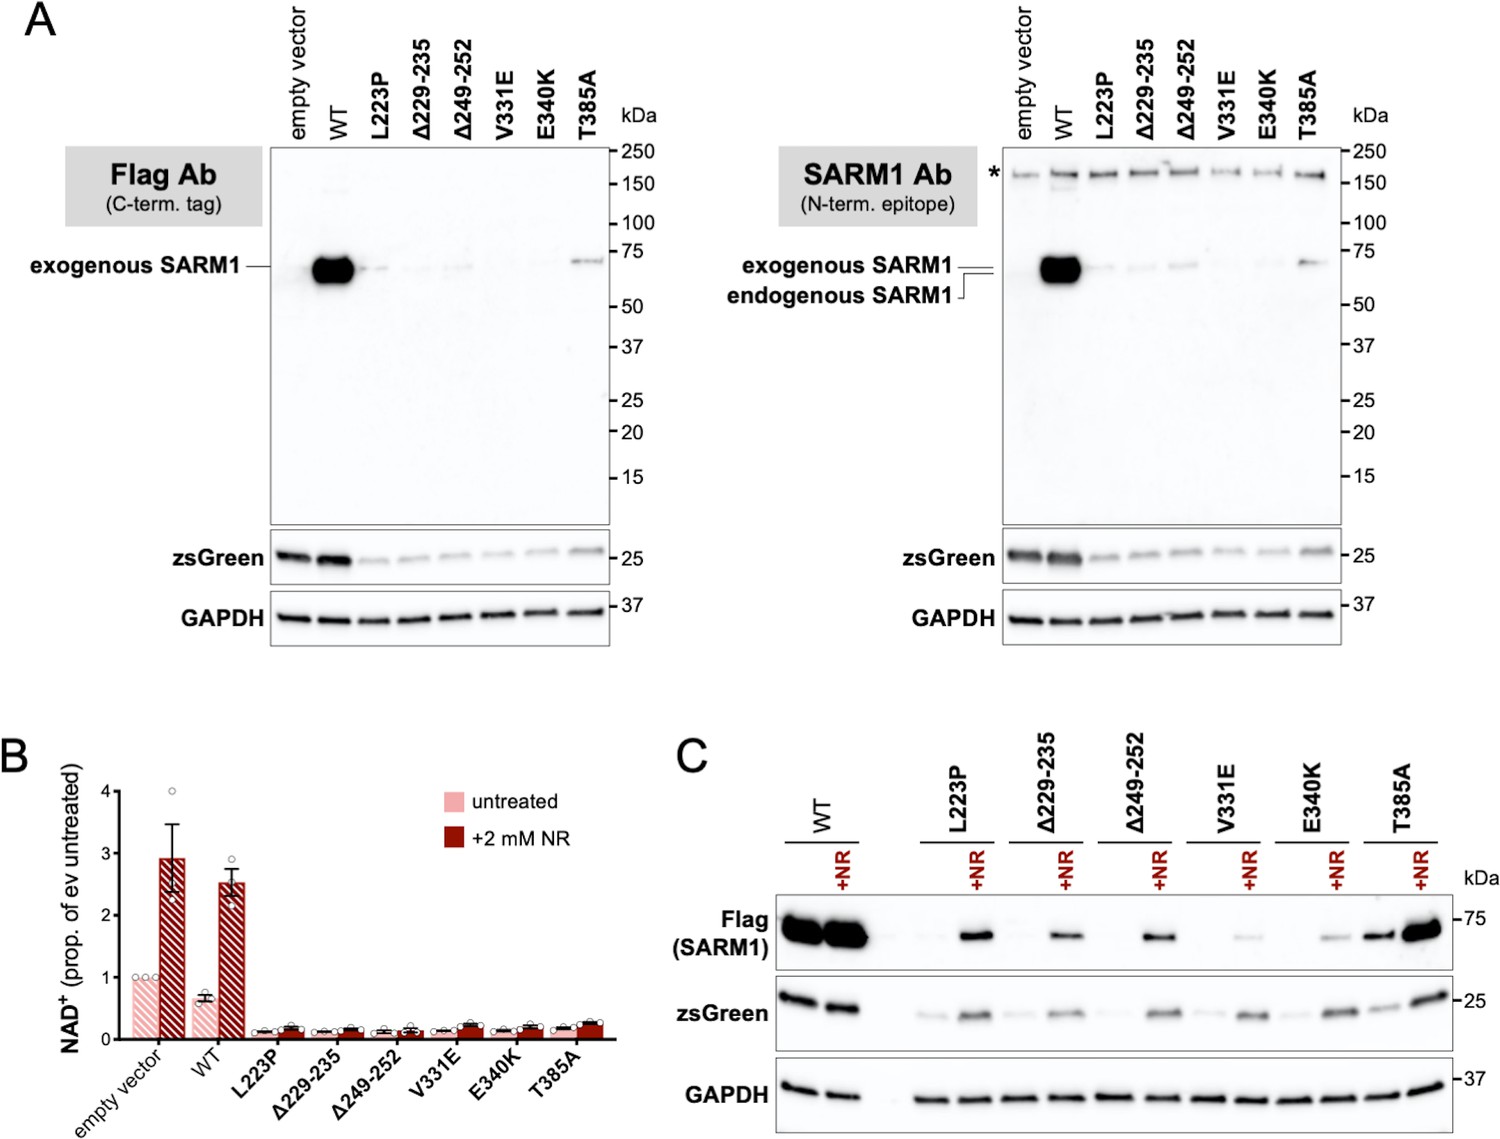
Truncated forms of putative strong GoF SARM1 variants are not detected in transfected HEK 293T cells and supressed expression of the full-length proteins and co-expressed zsGreen is increased by boosting NAD+ production with NR.
(A) Immunoblots of HEK 293T cell extracts 24 hr after transfection with 800 ng empty vector alone or with 50 ng expression constructs for C-terminal Flag-tagged WT or putative strong GoF variant SARM1 combined with 750 ng empty vector (24-well plate format). Duplicate blots were probed with a Flag antibody (left) or a SARM1 monoclonal antibody raised against amino acids 1-410 (right). No truncated SARM1 proteins are detected with either antibody. Both blots were probed for co-expressed ZsGreen and endogenous GAPDH (as a loading control) to confirm they represent true duplicates. Molecular weight markers (kDa) are shown on the right of each panel. (B) Relative NAD+ levels in HEK 293T cell extracts 24 hr after transfection as in part A and treatment ± 2 mM NR. Data are shown as a proportion of empty vector alone without NR addition (ev untreated). Means ± SEM with individual data points are plotted (n = 3). Bars for empty vector and WT SARM1 are hatched to differentiate them from putative strong GoF variants (bold text, filled bars). Data for empty vector and WT SARM1 show that NR supplementation substantially boosts NAD+ production. The lack of a robust increase in NAD+ levels in cells expressing putative strong GoF SARM1 variants simply indicates that enhanced NAD+ consumption still exceeds the NR-dependent increase in synthesis. Nevertheless, the greater NAD+ synthesis capacity provided by NR should delay the point at which NAD+ and/or ATP becomes limiting for de novo protein synthesis in these cells. (C) Representative immunoblot (of n = 3) of extracts from HEK 293T cells transfected and treated as in part B. The blot was probed with a Flag antibody (to detect the exogenous, Flag-tagged SARM1) and for co-expressed ZsGreen and endogenous GAPDH (as a loading control). Molecular weight markers (kDa) are shown on the right of each panel. Notably, NR supports substantially higher expression of all of the putative strong GoF SARM1 variants and the co-expressed zsGreen. This supports a model in which low expression levels in (untreated) cells is due to limiting NAD+ (and/or ATP) as a result of SARM1 NADase GoF. NR does not boost WT SARM1 or co-expressed zsGreen expression under these conditions presumably because NAD+ levels do not become limiting. However, suppressed expression is seen when more WT SARM1 expression construct is transfected to cause a greater decline in NAD+ (Figure 2—figure supplement 1A) and this can also be rescued by NR (data not shown).
Figure 2—figure supplement 3
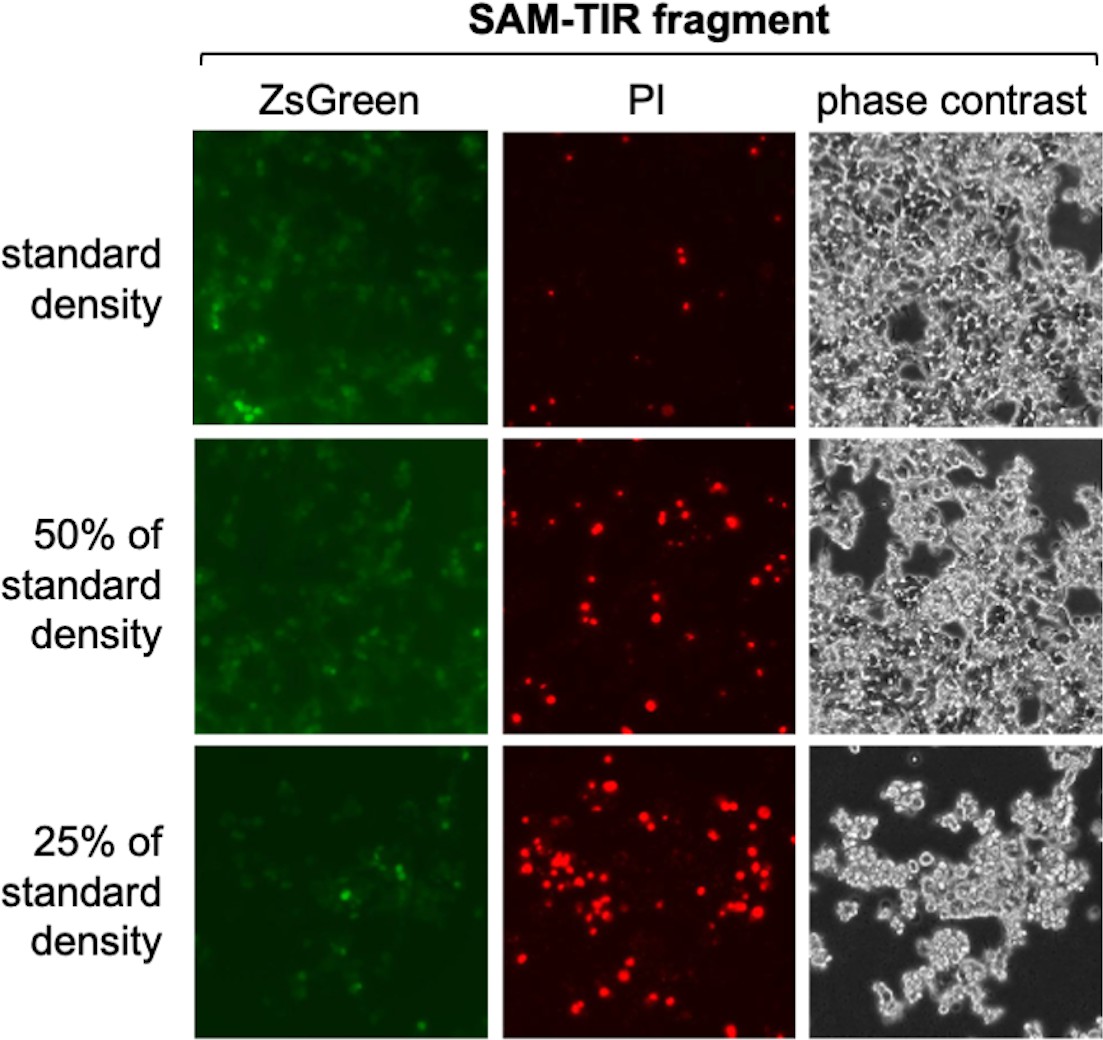
Cell density-dependent death of transfected HEK 293T cells expressing SAM-TIR fragment.
Representative ZsGreen fluorescence, propidium iodide (PI) staining and phase contrast images of HEK 293T cells 24 hr after standard transfection with an expression construct (800 ng construct per well of a 24-well plate) encoding the constitutively active SAM-TIR fragment of SARM1 (amino acids 409-724). The standard density of HEK cells was ~50% confluence at the time of transfection. For this experiment the different cell densities were diluted from the same original cell suspension. A large increase in the number of dead, PI-stained cells is clearly evident even as the total number of cells is reduced. It is likely that cells at lower density are less resistant to the effects of SARM1 activity-dependent NAD+ depletion as they will be dividing more rapidly and thus already under greater metabolic stress. We routinely transfect HEK cells at the standard density shown to avoid significant cell death. The amount of SAM-TIR construct used in this assay is also substantially higher (16x) than that used for screening of the ALS patient variants and we would thus expect very low rates of cell death in the screening assays.
Figure 3 with 2 supplements
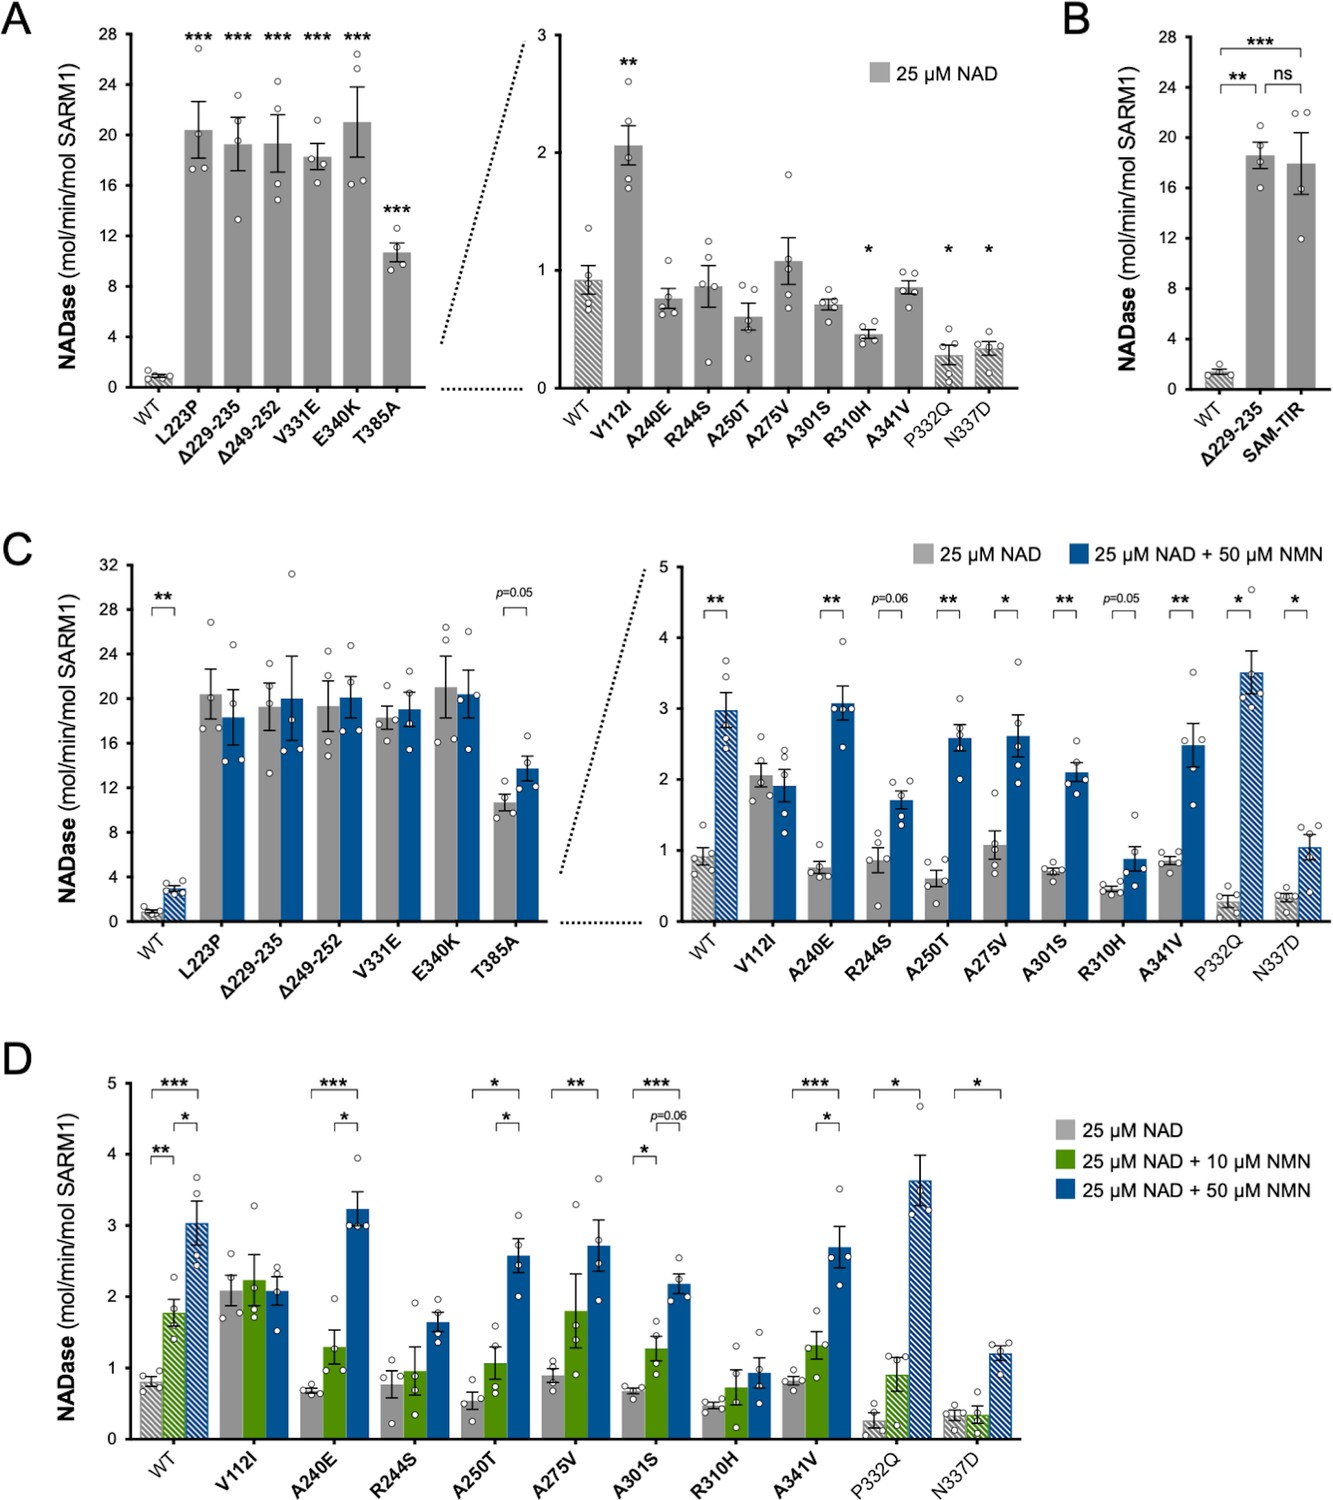
Constitutive NADase activity and NMN responsiveness of SARM1 ARM domain variants in Project MinE.
Each panel is designed to show different statistical comparisons and some of the same data are used in different tests, as described. WT SARM1, and P332Q and N337D SARM1 (seen in both patient and control groups in Project MinE), are shown as hatched bars throughout to differentiate them from patient-specific variants (bold text, filled bars). (A) and (B) Constitutive (basal) NADase activities of immunoprecipitated WT SARM1, variant SARM1, or SAM-TIR fragment (as indicated) in the presence of 25 µM NAD+. In part A, data for variants with high or low NADase activity, obtained in parallel, are plotted separately, against different scales, to more clearly show all differences relative to WT SARM1 (included on both). Means ± SEM with individual data points (n = 4 or 5) are plotted. *p < 0.05, **p < 0.01, ***p < 0.001 and ns (not significant) = p > 0.05, multiple pairwise comparisons to WT SARM1 with FDR correction for part A and one-way ANOVA with Tukey’s correction for part B (both after log transformation). (C) Activation of SARM1 NADase by 50 µm NMN (in the presence of 25 µM NAD+). Constitutive activities (no NMN) are as in part A with rates + NMN calculated from assays performed in parallel. High and low NADase activity variants are plotted separately (as in part A). Means ± SEM with individual data points (n = 4 or 5) are plotted. *p < 0.05 and **p < 0.01, multiple paired t tests of rates ± NMN with FDR correction (after log transformation). (D) Activation of SARM1 NADase by 10 or 50 µm NMN (in the presence of 25 µM NAD+). NMN-insensitive variants with very high constitutive NADase activity were not tested. Constitutive and +50 µM NMN activities are a subset of those shown in part B and are only those from assays performed in parallel with 10 µM NMN. Means ± SEM with individual data points (n = 4) are plotted. *p < 0.05, **p < 0.01, and ***p < 0.001, two-way ANOVA with Šidák’s correction (after log transformation).
-
Figure 3—source data 1
Source data for Figure 3, Figure 3—figure supplements 1 and 2.
- https://cdn.elifesciences.org/articles/70905/elife-70905-fig3-data1-v3.zip
Figure 3—figure supplement 1
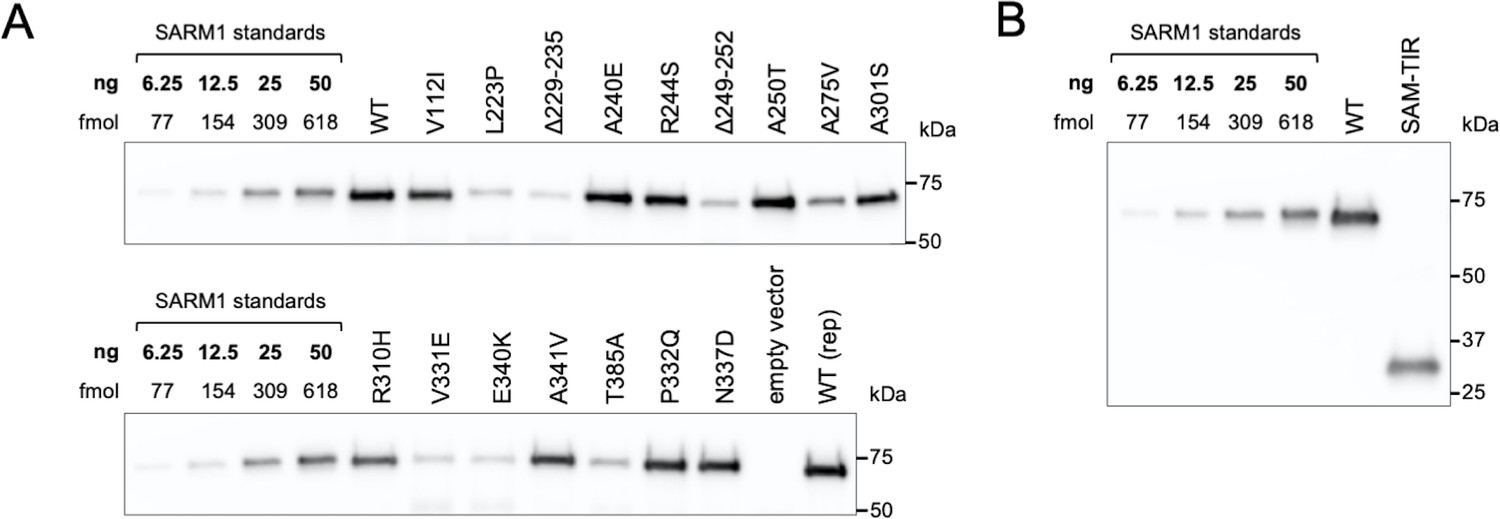
Purification of recombinant SARM1 proteins for use in NADase assays.
Representative immunoblots of immunoprecipitated WT and ALS patient variant SARM1 (A) and WT SARM1 (full-length) and SAM-TIR fragment (B). Immunoprecipitations were performed as described in the Methods. HEK 293T cells were used to support any mammalian-specific post-translational modification that might be critical for activity. SARM1 bound to the equivalent of 0.625 µl of bead suspension were loaded per lane alongside a dilution series of purified SARM1 to generate a standard curve for quantification. Blots were probed with a polyclonal antibody raised against the SAM domains of human SARM1 as, unlike the WT and ALS patient variant SARM1, the purified SARM1 standard is not Flag-tagged. Molecular weight markers (kDa) are shown on the right of each panel. Faint bands at ~50 kDa in some of the more concentrated strong GoF variant samples likely represent weak, non-specific cross-reaction to the heavy chain of the Flag antibody used for the immunoprecipitation. SAM-TIR fragment retains the SAM domains involved in SARM1 multimerization but, notably, there is no detectable co-immunoprecipitation of endogenous SARM1, presumably because levels of endogenous SARM1 are so low in this HEK 293T cell clone (Figure 2—figure supplement 1B). Endogenous SARM1 is thus unlikely to contribute significant activity in assays of any of the purified proteins.
Figure 3—figure supplement 2
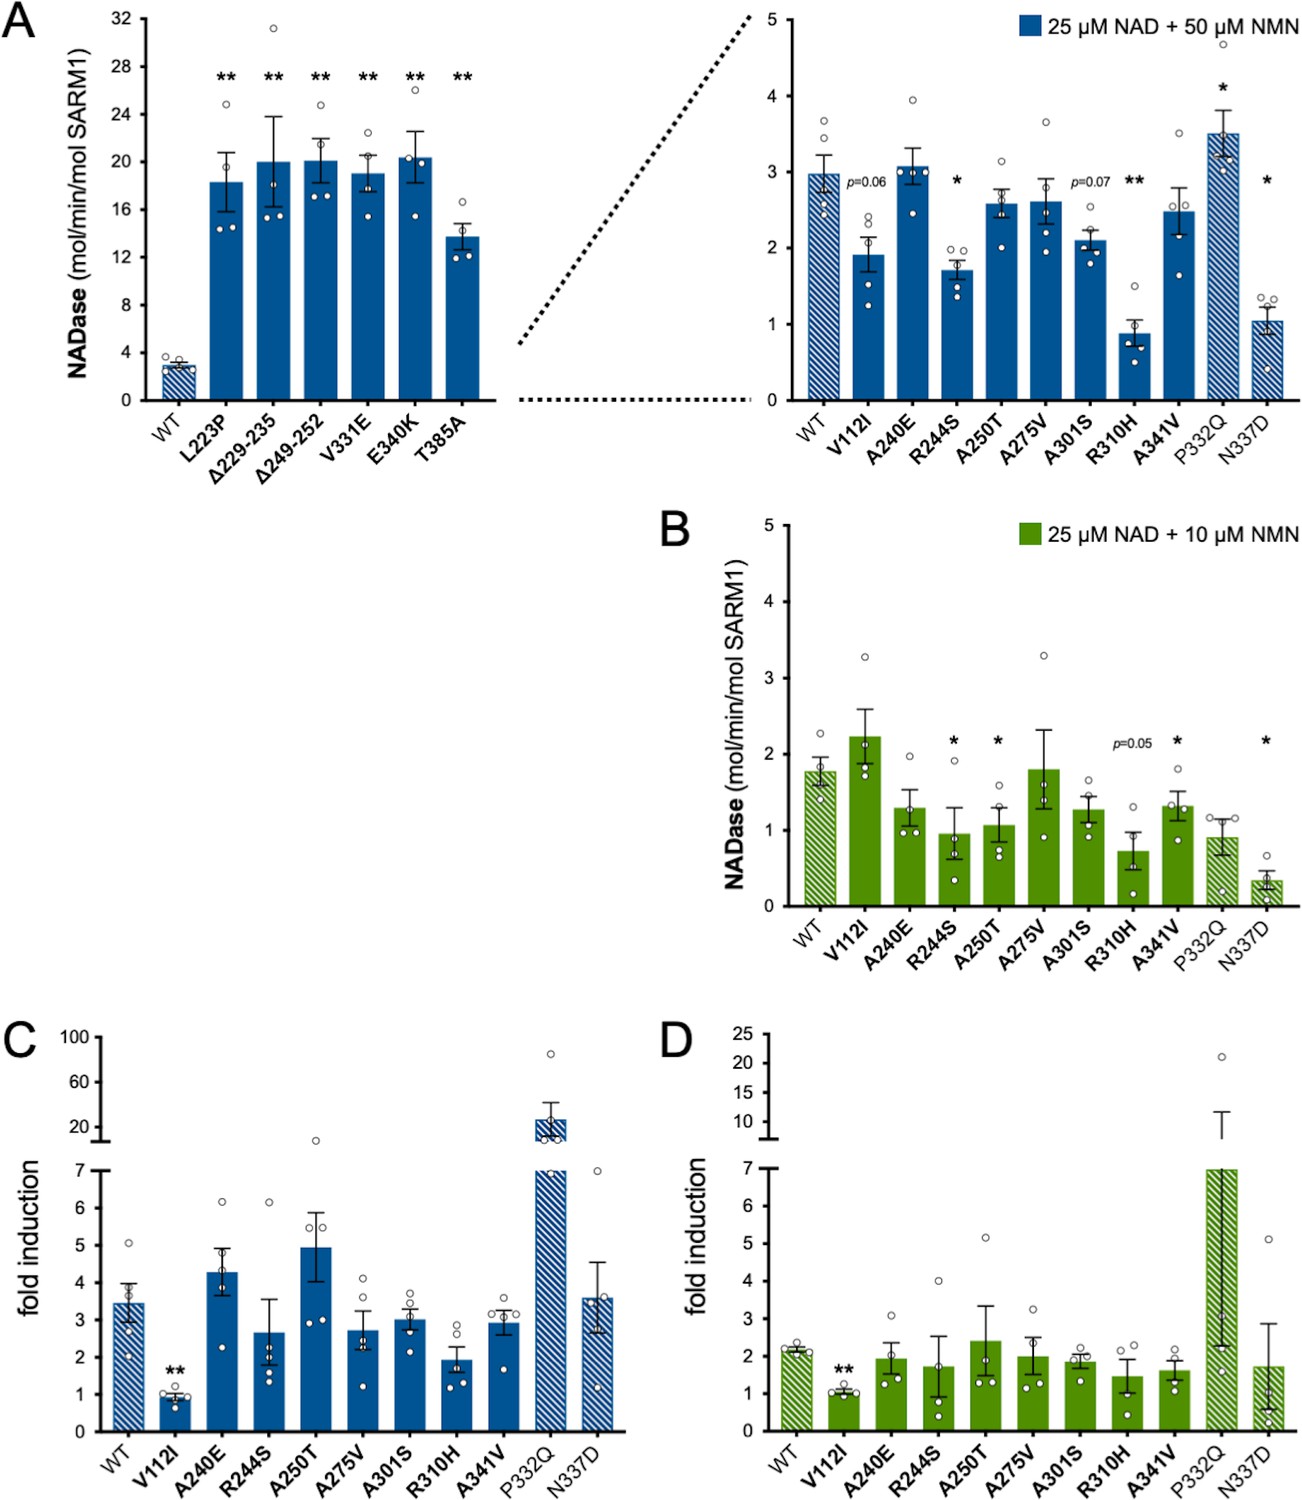
Relative NMN responsiveness of Project MinE DF1 SARM1 ARM domain variants.
(A) and (B) NADase activities of immunoprecipitated WT or variant SARM1 after activation by 50 µM NMN (A) or 10 µM NMN (B) (in the presence of 25 µM NAD+). The data in parts A and B are the same as in Figure 3C,D respectively but are separately presented here to show the results of a different statistical test. In part A, variants with high or low NADase activity are plotted separately, against different scales, to more clearly show all differences relative to WT SARM1 (included on both). Variants with very high basal NADase and no responsiveness to 50 µM NMN were not tested for activation by 10 µM NMN. Means ± SEM with individual data points (n = 4 or 5) are plotted. *p < 0.05 and **p < 0.01, multiple pairwise comparisons to WT SARM1 with FDR correction (part A after log transformation). (C) and (D) Fold change in NADase activity of immunoprecipitated WT and ALS patient variant SARM1 by 50 µM NMN (C) or 10 µM NMN (D) relative to their constitutive (basal) activity (NAD+ alone). Strong NADase GoF variants that are not NMN-responsive are not shown. Fold induction is calculated from the data presented in Figure 3C,D. Means ± SEM with individual data points (n = 5 and n = 4 respectively) are plotted. ** p <0.01, multiple pairwise comparisons to WT SARM1 with FDR correction (both after log transformation). Bars for WT SARM1, and P332Q and N337D SARM1 (seen in patient and control groups in Project MinE DF1), are hatched to differentiate them from patient-specific variants (bold text, filled bars).
Figure 4
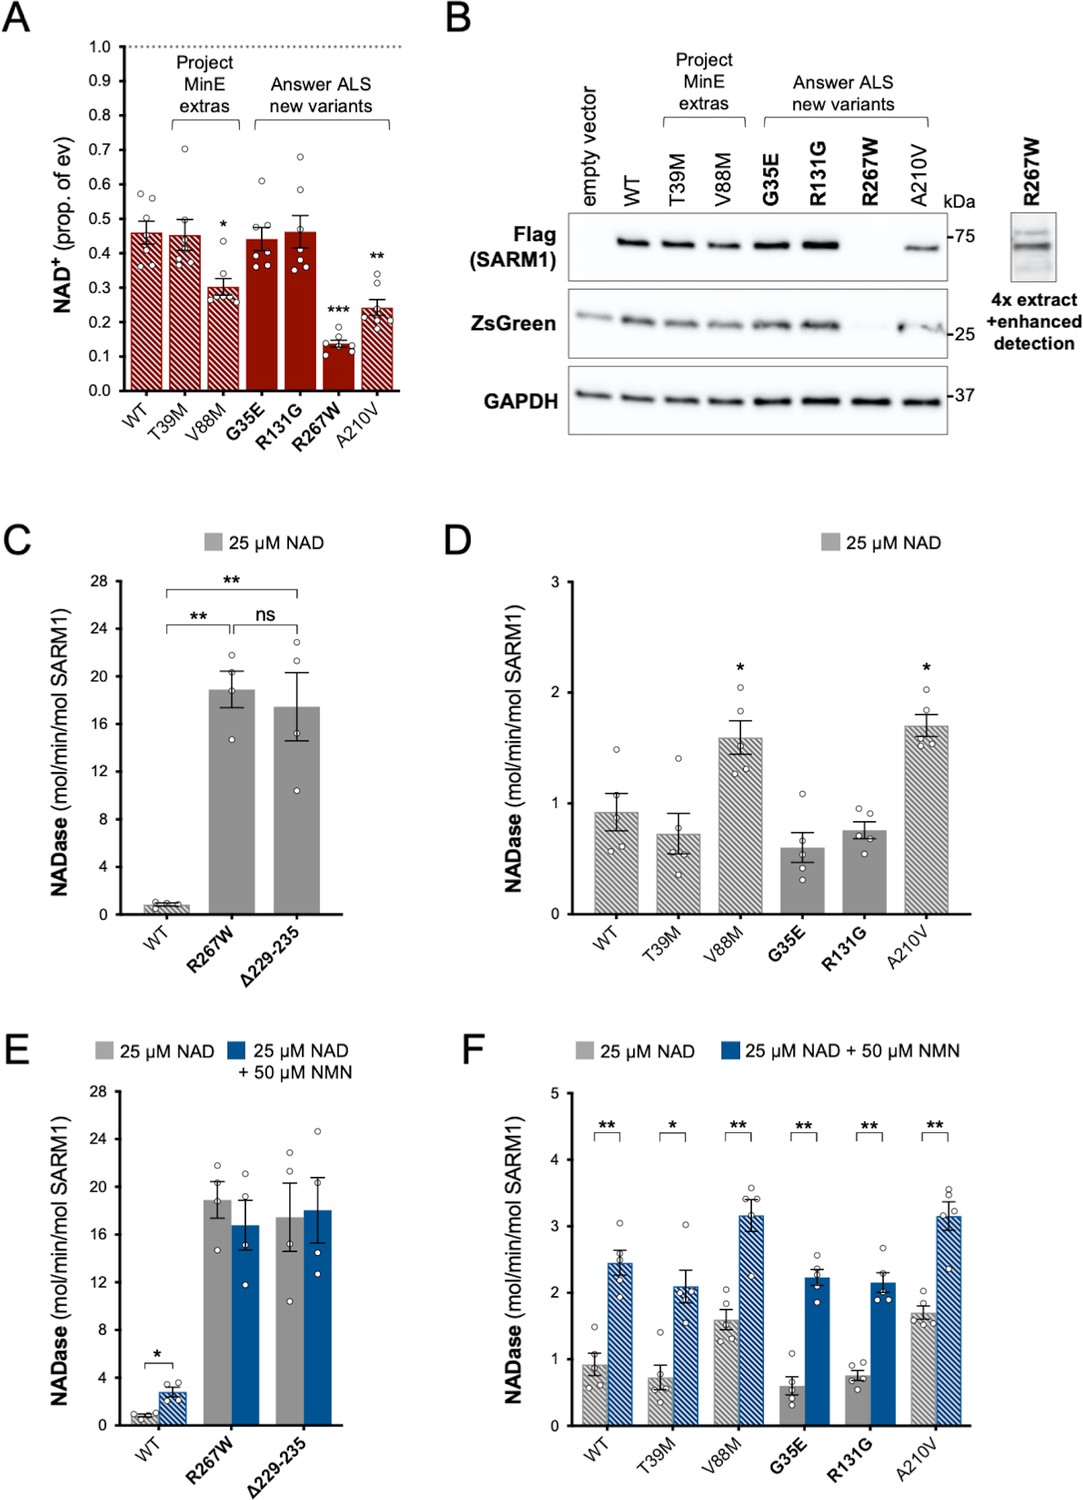
Functional characterisation of additional ARM domain and other N-terminal SARM1 coding variants in the Answer ALS database and Project MinE DF1.
Bars for WT and variants that are only seen in controls are hatched throughout to differentiate them from patient-specific variants (bold text, filled bars). (A) NAD+ levels in extracts of HEK 293T cells 24 hr after transfection with expression constructs for Flag-tagged WT or variant SARM1 (as listed). Details are as per Figure 2. Means ± SEM with individual data points (n = 7) are plotted. *p < 0.05, **p < 0.01, and ***p < 0.001, multiple pairwise comparisons to WT SARM1 with FDR correction (after log transformation). (B) Representative immunoblots of extracts as described in part A. Blots were probed as in Figure 2D. Four times the amount of extract and enhanced detection was needed to detect R267W SARM1 (right). Molecular weight markers (kDa) are shown on the right of each panel. (C) and (D) Constitutive NADase activities (at 25 µM NAD+) of recombinant WT and variant SARM1, as indicated. Predicted strong GoF R267W SARM1 was compared directly to WT SARM1 and strong NADase GoF Δ229–235 SARM1 in part C, separately from the other variants in part D. Means ± SEM with individual data points (n = 4 or 5) are plotted. *p < 0.05, **p < 0.01, ***p < 0.001 and ns (not significant) = p > 0.05, one-way ANOVA with Tukey’s correction (after log transformation) in part C and multiple pairwise comparisons to WT SARM1 with FDR correction in part D. (E) and (F) Activation of the NADase activity of recombinant WT and variant SARM1, as indicated, by 50 µm NMN (in the presence of 25 µM NAD+). Constitutive activities (no NMN) are as in parts C and D with rates + NMN calculated from assays performed in parallel. Means ± SEM with individual data points (n = 4 or 5) are plotted. *p < 0.05 and **p < 0.01, multiple paired t tests of rates ± NMN with FDR correction (after log transformation in part E).
-
Figure 4—source data 1
Source data for Figure 4.
- https://cdn.elifesciences.org/articles/70905/elife-70905-fig4-data1-v3.zip
Figure 5

Δ229–235 SARM1 retains its strong NADase GoF properties in complexes with WT SARM1.
(A) NAD+ levels in extracts of HEK 293T cells 24 hr after transfection with individual expression constructs or mixtures of constructs for HA- or Flag-tagged WT SARM1 and/or Flag-tagged Δ229–235 SARM1. Details as per Figure 2, except that 50 ng SARM1 vector was combined with 750 ng empty vector for single constructs and 25 ng each for mixtures. Means ± SEM with individual data points (n = 5) are plotted. **p < 0.01, ***p < 0.001 and ns (not significant) = p > 0.05, one-way ANOVA with Tukey’s correction (after log transformation). Only relevant comparisons are shown. (B) Representative immunoblots of extracts as described in part A. Duplicate blots were probed with Flag or HA antibodies to independently assess levels of co-expressed Flag- or HA-tagged WT or Flag-tagged Δ229–235 SARM1. Both blots were probed for ZsGreen and GAPDH (acting as a loading control) to confirm the blots were representative replicates. A faint, non-specific cross-reaction of the HA antibody to Flag-tagged SARM1 was consistently seen under the conditions used (WT-Flag only lane). Molecular weight markers (kDa) are shown on the right of each panel. (C) Representative immunoblots (of n = 3) of reciprocal co-immunoprecipitation of HA-tagged WT SARM1 with Flag-tagged WT or Δ229–235 SARM1. Immunoprecipitations using Flag or HA antibodies or no antibody were performed on the same extracts of transfected HEK 293T cells co-expressing HA-tagged WT SARM1 with Flag-tagged WT or Flag-tagged Δ229–235 SARM1 (from equal amounts of construct), or expressing individual proteins. Duplicate immunoblots of immunoprecipitated proteins, and the original extracts used in the immunoprecipitations (input), were probed with Flag or HA antibodies. A small amount of non-specific binding of tagged proteins to protein A/G beads was consistently seen for inputs with the highest expression levels. Molecular weight markers (kDa) are shown on the right of each panel. (D) Constitutive NADase activity (in the presence of 25 µM NAD+) of immunoprecipitated WT + Δ229–235 SARM1 complexes compared to WT or Δ229–235 SARM1 alone. All proteins were Flag-tagged to ensure complete immunoprecipitation of complexes of WT and Δ229–235 SARM1. Means ± SEM with individual data points (n = 4) are plotted. *p < 0.05 and **p < 0.01, one-way ANOVA with Tukey’s correction (after log transformation). (E) Inducibility of immunoprecipitated WT + Δ229–235 SARM1 complexes and WT or Δ229–235 SARM1 alone by 50 µm NMN (in the presence of 25 µM NAD+). Constitutive activities (no NMN) are as in part D with rates + NMN calculated from assays performed in parallel. Means ± SEM with individual data points (n = 4) are plotted. **p < 0.01, multiple paired t tests of rates ± NMN with FDR correction (after log transformation).
-
Figure 5—source data 1
Source data for Figure 5.
- https://cdn.elifesciences.org/articles/70905/elife-70905-fig5-data1-v3.zip
Figure 6 with 2 supplements
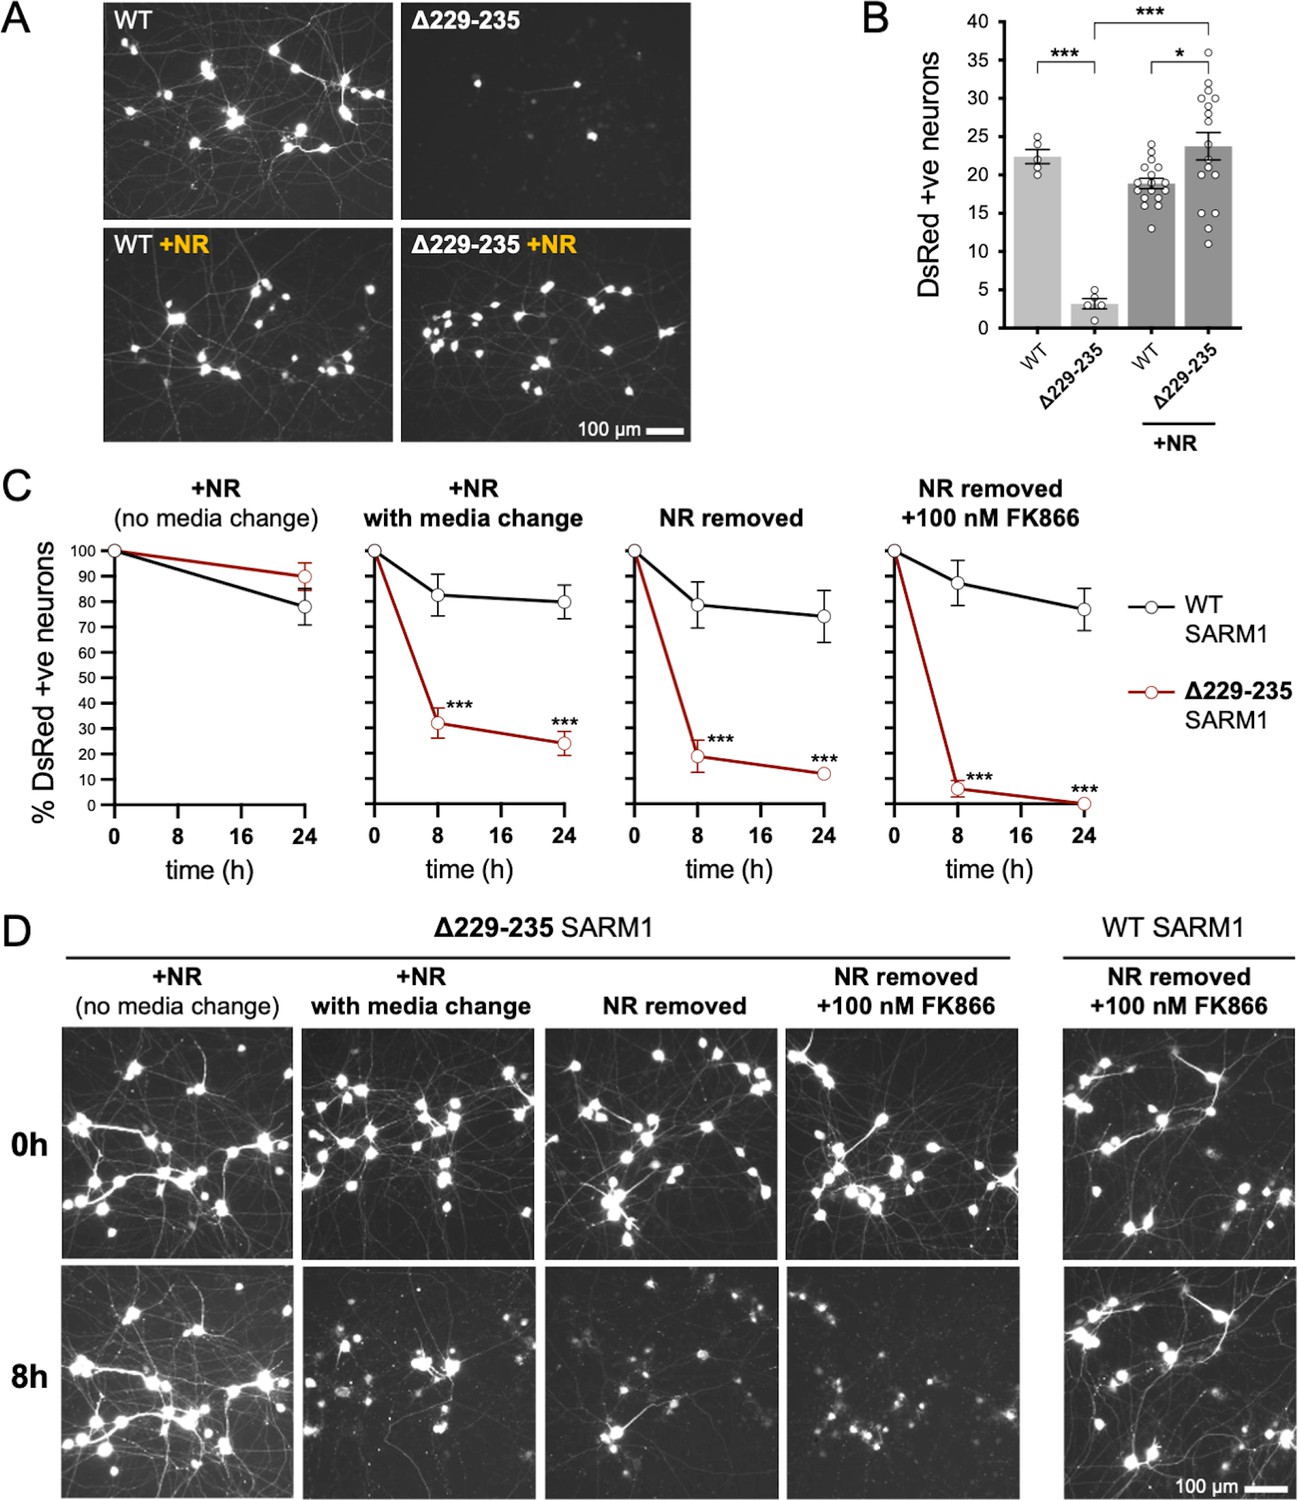
Strong NADase GoF Δ229–235 SARM1 reduces SCG neuron viability under mild stress conditions.
(A) Representative images of DsRed-positive wild-type SCG neurons 24 hr after microinjection with expression constructs for WT or Δ229–235 SARM1 and DsRed (at 2.5 ng/µl and 40 ng/µl in the injection mix, respectively), with or without supplementation of the culture medium with 2 mM NR at the time of injection. Equal numbers of neurons were injected. (B) Quantification of DsRed-positive neurons for the conditions described in part A. Means ± SEM with individual data points (n = 5 or 17) are plotted. *p < 0.05 and ***p < 0.001, one-way ANOVA with Tukey’s correction. Only relevant comparisons are shown. (C) Time course of survival of DsRed-positive neurons after manipulation of culture conditions as indicated. Neurons were injected as in part A and maintained in medium containing NR. Manipulations were performed 24 hr after injection which corresponds to time 0 on the graphs. Survival of injected, DsRed-labelled neurons was assessed as described in part D and is expressed as a percentage of those present at time 0. Means ± SEM (n = 4 or 5) are plotted. ***p < 0.001, two-way ANOVA with Šidák’s correction. (D) Representative images for data presented in part C. Only one representative condition is shown for neurons injected with the WT SARM1 construct. Survival of DsRed-positive neurons was assessed by comparing signal intensity and neuron size / shape at different timepoints, a method that provides an accurate reflection of survival rates (Gilley and Coleman, 2010).
-
Figure 6—source data 1
Source data for Figure 6, Figure 6—figure supplements 1 and 2.
- https://cdn.elifesciences.org/articles/70905/elife-70905-fig6-data1-v3.zip
Figure 6—figure supplement 1
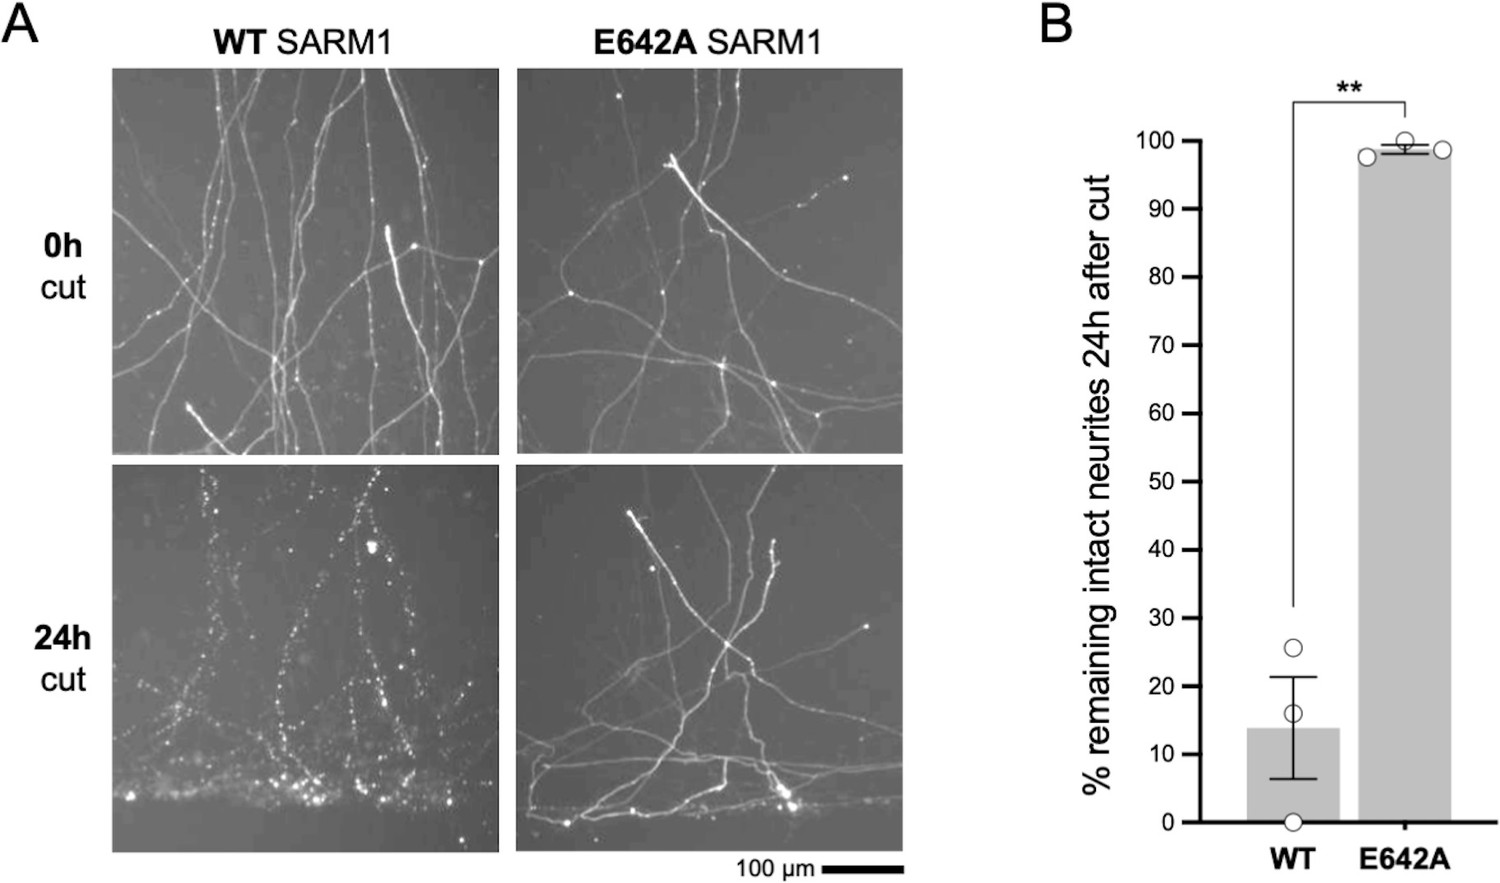
Microinjection of 2.5 ng/µl WT SARM1 expression construct provides expression that is functionally relevant.
(A) Images of transected DsRed-labelled neurites of Sarm1-/- SCG neurons at the time of cut (0h) and 24 hr (24h) after cut. Neurons had been microinjected with a mix containing 2.5 ng/µl of WT or NADase-dead E642A SARM1 expression construct together with a DsRed expression construct (pDsRed2) at 40 ng/µl (to allow visualisation) 48 hr prior to cut. Sarm1-/- SCG neurites are protected for several days after transection but the WT SARM1 expression construct used at this concentration is sufficient to restore degeneration of almost all the cut neurites within 24 hr. In contrast, neurites remain intact after injection of the construct for NADase-defective E642A mutant SARM1. (B) Quantification of neurite survival at 24 hr after cut for experiments described in panel A. The number of intact neurites with continuous DsRed fluorescence at 24 hr is shown as a percentage of intact neurites at 0 hr. Means ± SEM with individual data points (n = 3) are plotted. ***p < 0.001, paired t test. These data establish a low concentration of a WT SARM1 expression construct for injection that still provides a functionally-relevant level of expression, although the exogenous WT SARM1 is below the threshold for detection by immunostaining under these conditions. SARM1 (untagged) was expressed from a pCMV-Tag2 vector backbone in these experiments whereas SARM1 with a C-terminal Flag tag was expressed from a pLVX-IRES-ZsGreen1 vector backbone in experiments in Figure 6. However, in both cases expression is driven by the same CMV promoter and the use of the different vector backbones does not alter the functional outcome (data not shown).
Figure 6—figure supplement 2
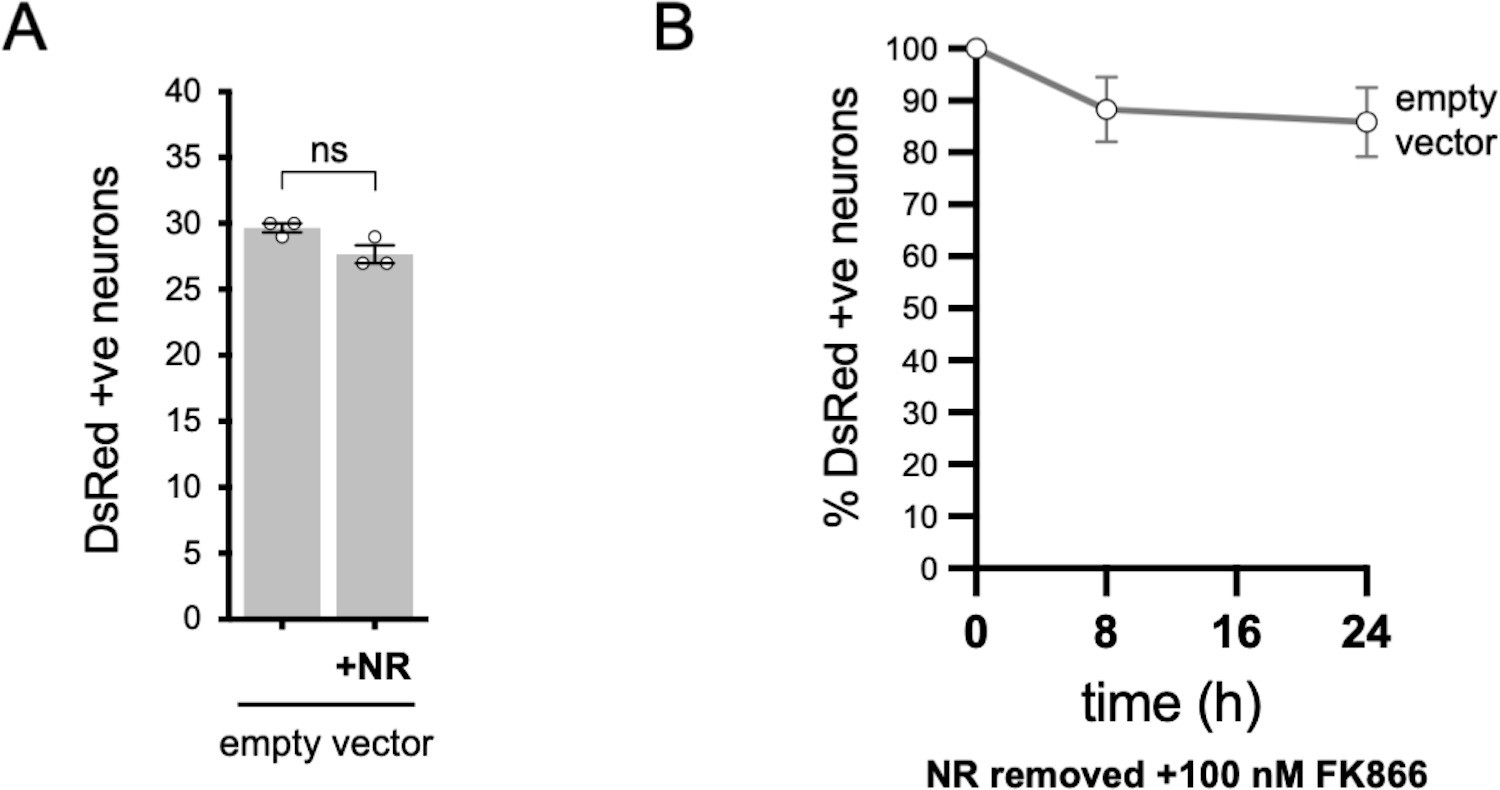
Injection of empty vector does not affect SCG neuron viability.
(A) Numbers of DsRed-positive neurons 24 hr after microinjection with empty pLVX-IRES-ZsGreen1 vector (the backbone for the SARM1 constructs used in Figure 6) and DsRed (at 2.5 ng/µl and 40 ng/µl in the injection mix, respectively) ± 2 mM NR addition to the culture medium at the time of injection. Equal numbers of neurons were injected. Means ± SEM with individual data points (n = 3) are plotted. ns (not significant) = p > 0.05, paired t test. (B) Time course of survival of DsRed-positive neurons injected as in part A and maintained in medium containing NR prior to removal of NR and addition of 100 nM FK866 24 hr after injection (corresponding to time 0 on the graphs). Survival of injected neurons was assessed as described in Figure 6D and is expressed as a percentage of those present at time 0. Means ± SEM (n = 3) are plotted.
Figure 7
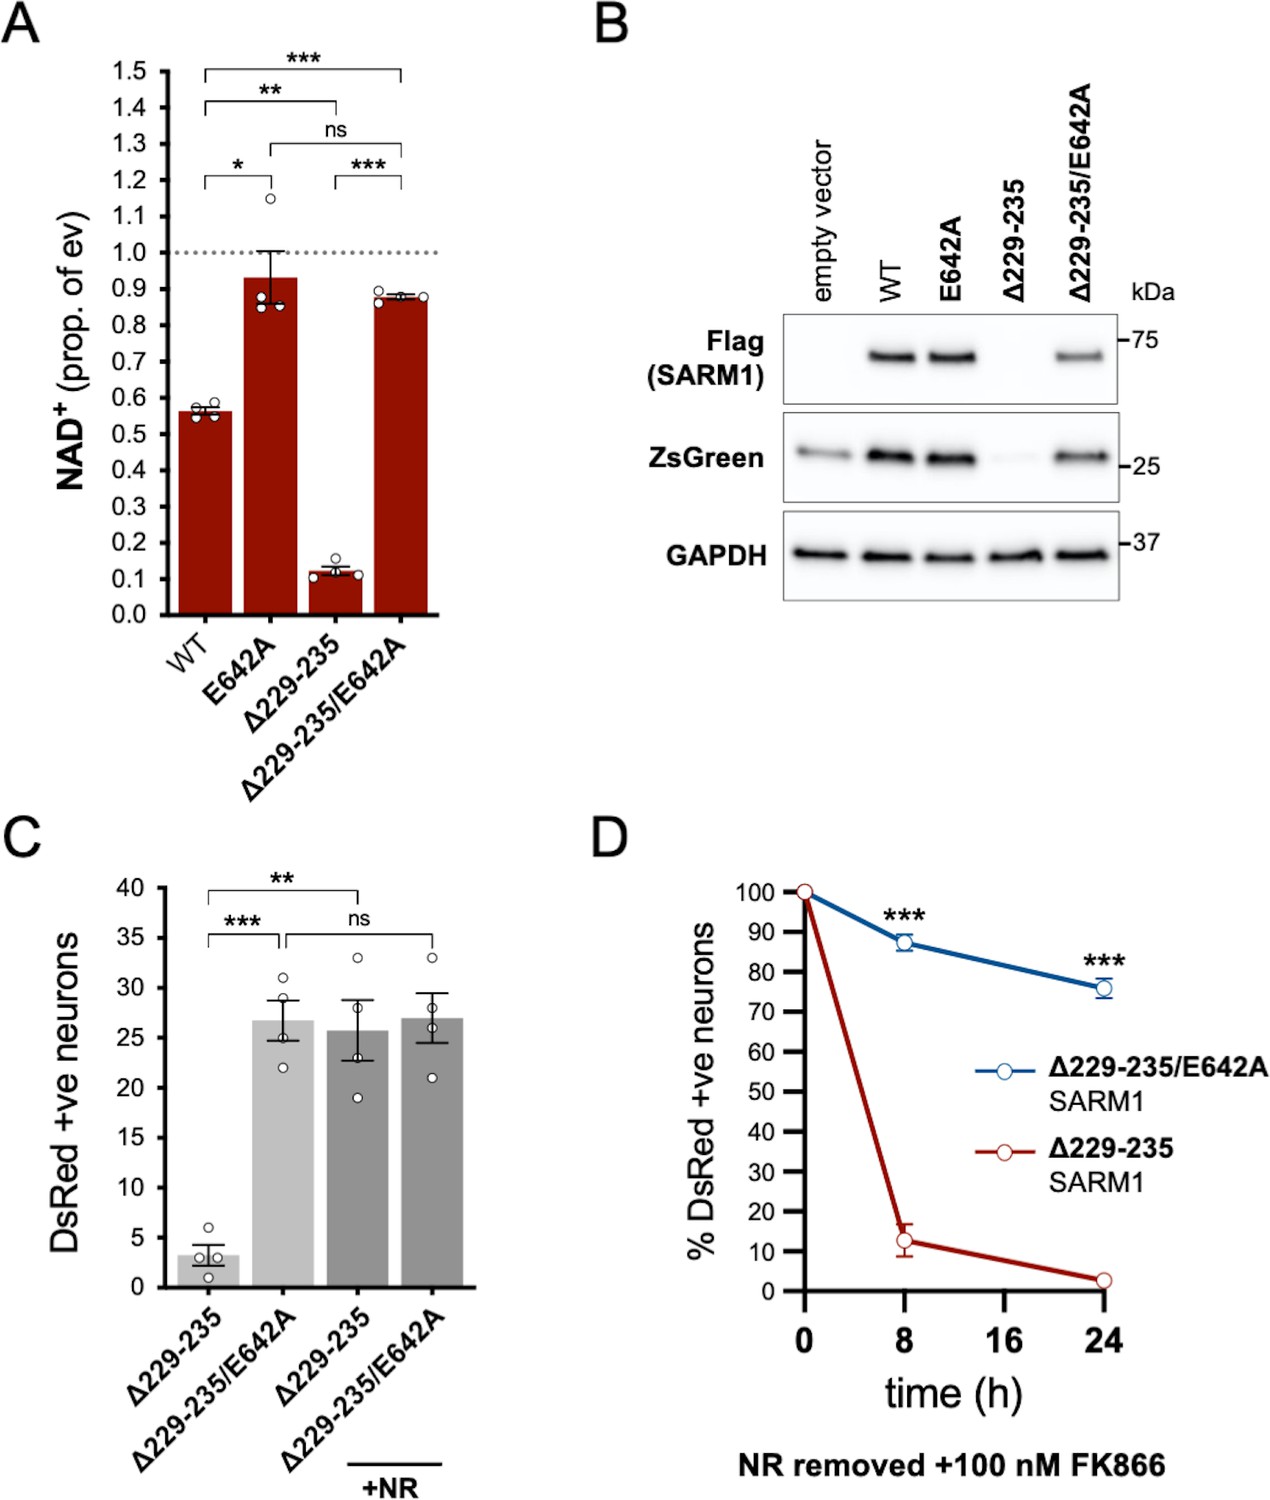
NADase activity is required for the pro-death effects of Δ229–235 SARM1 in SCG neurons.
(A) Relative levels of NAD+ in extracts of HEK 293T cells 24 hr after transfection with expression constructs for WT, E642A, Δ229–235 or Δ229–235/E642A SARM1, as per Figure 2. Means ± SEM with individual data points (n = 4) are plotted. *p < 0.05, **p < 0.01, ***p < 0.001 and ns (not significant) = p > 0.05, one-way ANOVA with Tukey’s correction (after log transformation). Only relevant comparisons are shown. (B) Representative immunoblots of extracts as described in part A. Blots were probed as in Figure 2D. Molecular weight markers (kDa) are shown on the right of each panel. (C) Numbers of DsRed-positive neurons 24 hr after microinjection with expression constructs for Δ229–235 SARM1 or Δ229–235/E642A SARM1 and DsRed (at 2.5 ng/µl and 40 ng/µl in the injection mix, respectively), with or without supplementation of the culture medium with 2 mM NR at the time of injection. Equal numbers of neurons were injected. Means ± SEM with individual data points (n = 4) are plotted. **p < 0.01, ***p < 0.001 and ns = p > 0.05, one-way ANOVA with Tukey’s correction. Only relevant comparisons are shown. (D) Time course of survival of DsRed-positive neurons injected as in part C and maintained in medium containing NR prior to removal of NR and addition of 100 nM FK866 24 hr after injection (corresponding to time 0 on the graphs). Survival of injected neurons was assessed as described in Figure 5D and is expressed as a percentage of those present at time 0. Means ± SEM (n = 4) are plotted. ***p < 0.001, two-way ANOVA with Šidák’s correction.
-
Figure 7—source data 1
Source data for Figure 7.
- https://cdn.elifesciences.org/articles/70905/elife-70905-fig7-data1-v3.zip
Figure 8
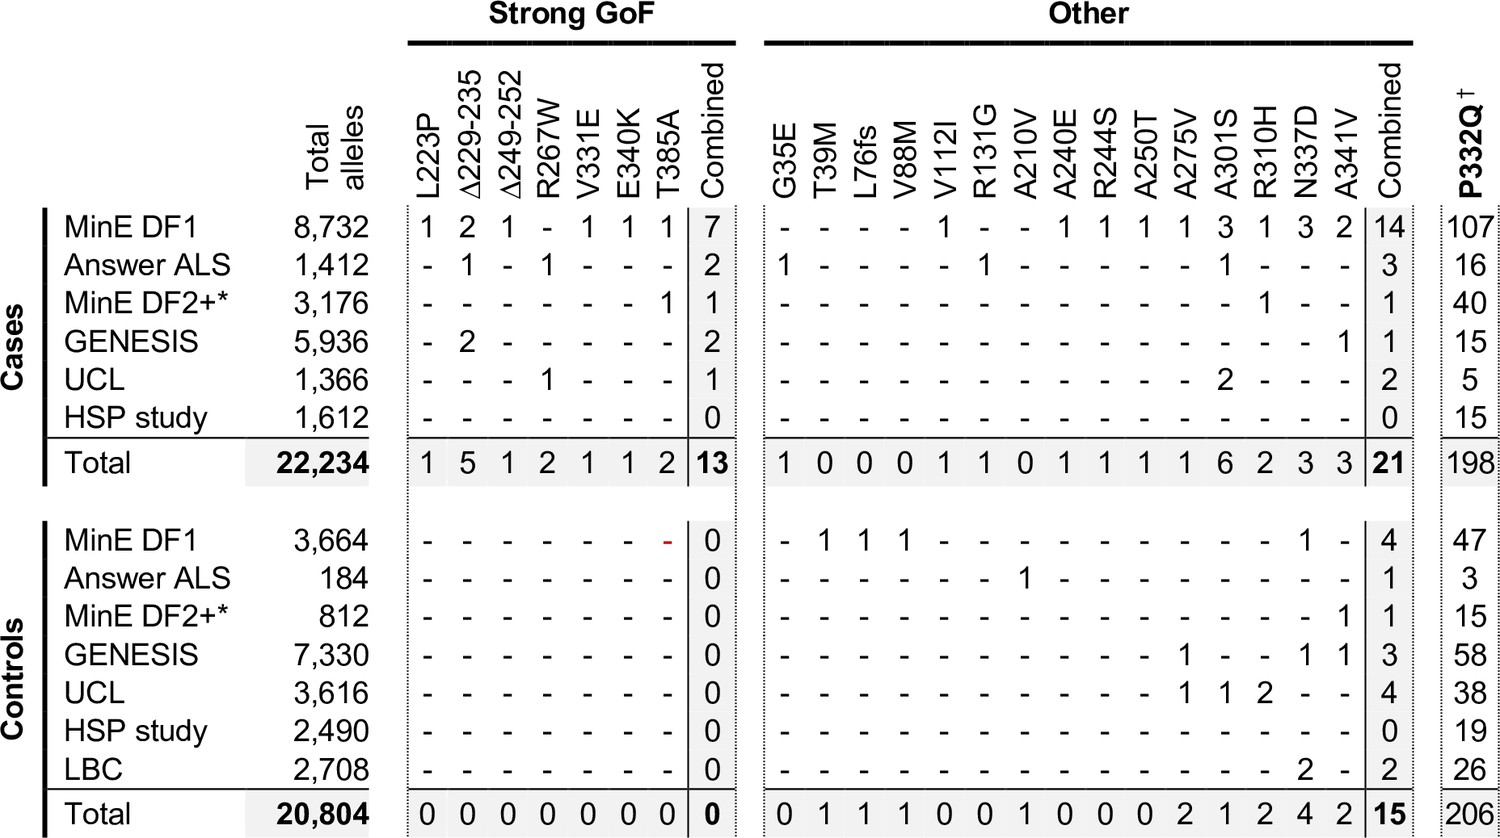
Occurrences of SARM1 alleles encoding ARM domain and other N-terminal variants in individual datasets.
* Extra samples in Project MinE DF2 that were not part of DF1. † MAFs for the P332Q SARM1 allele in each dataset (in cases plus controls combined) of 0.012 (MinE DF1), 0.012 (Answer ALS), 0.014 (MinE DF2 extras), 0.0055 (GENESIS), 0.0086 (UCL), 0.0010 (LBC) and 0.0083 (HSP study) are, barring the more ethnically-diverse GENESIS cohorts, broadly consistent with each dataset containing predominantly European samples as the European MAF of 0.012 is substantially higher than in other populations (gnomAD v3.1.1).
-
Figure 8—source data 1
Source data for Figure 8.
- https://cdn.elifesciences.org/articles/70905/elife-70905-fig8-data1-v3.docx
Tables
Table 1
SARM1 coding variants in Project MinE DF1.
| SARM1 domain | Coding variant* | rsID | Chr.17 position and change† | EuropeanMAF‡ | Carriers | |
|---|---|---|---|---|---|---|
| Cases (4,366) | Controls (1,832) | |||||
| T39M | rs988047470 | 28372148 C > T | 0 | 1 | ||
| ARM | L76fs | - | 28372255 del | 0 | 1 | |
| V88M | rs1555584160 | 28372294 G > A | 0 | 1 | ||
| V112I | rs1032963037 | 28372366 G > A | 0.000015 | 1 | ||
| L223P | - | 28381400 T > C | 0 | 1 | ||
| Δ229–235 § | rs782325355 | 28381417_37 del | 0.000059 | 2 | ||
| A240E | rs1449836804 | 28381451 C > A | 0.000015 | 1 | ||
| R244S | - | 28381462 C > A | 0 | 1 | ||
| Δ249–252 | - | 28381475_86 del | 0 | 1 | ||
| A250T | rs1555585243 | 28381480 G > A | 0 | 1 | ||
| A275V | rs376587698 | 28381556 C > T | 0.000029 | 1 | ||
| A301S | rs782606059 | 28381633 G > T | 0.00012 | 3 | ||
| R310H | rs369186722 | 28381661 G > A | 0.00016 | 1 | ||
| V331E | rs1555585331 | 28381724 T > A | 0 | 1 | ||
| P332Q | rs140811640 | 28381727 C > A | 0.012 | 107 | 47 | |
| N337D | rs375690432 | 28381741 A > G | 0.00038 | 3 | 1 | |
| E340K | rs781854217 | 28381750 G > A | 0.000059 | 1 | ||
| A341V | rs373458416 | 28381754 C > T | 0.00012 | 2 | ||
| T385A | rs2068039068 | 28384420 A > G | 0 | 1 | ||
| SAM | Q418H | rs1194545365 | 28384521 G > T | 0.000029 | 1 | 1 |
| Y429F | - | 28384553 A > T | 0 | 1 | ||
| E431G | rs1555585662 | 28384559 A > G | 0 | 1 | ||
| R465T | - | 28385039 G > C | 0 | 1 | ||
| C482Y | - | 28385090 G > A | 0 | 1 | ||
| R484C | rs1555585809 | 28385095 C > T | 0 | 1 | ||
| A488E | rs782228906 | 28385108 C > A | 0.00012 | 2 | ||
| Y501H | rs144613221 | 28385146 T > C | 0.0029 | 32 | 13 | |
| T50211P | rs782421919 | 28385149 A > C | 0.000074 | 1 | ||
| V518L | rs782106973 | 28385197 G > C | 0.000088 | 3 | ||
| S558N | - | 28388216 G > A | 0 | 1 | ||
| TIR | R569C | rs571724138 | 28388248 C > T | 0.000029 | 1 | |
| R615H | rs782753946 | 28388460 G > A | 0.000044 | 1 | ||
| G624* | rs141324431 | 28388486 G > T | 0.000073 | 1 | ||
| D637Y | rs1451417529 | 28388525 G > T | 0 | 1 | ||
| A646S | rs782676389 | 28395917 G > T | 0 | 1 | ||
| Q673* | - | 28395998 C > T | 0 | 1 | ||
| A719V | rs146812537 | 28396267 C > T | 0.00050 | 2 | ||
| G722V | rs1298702390 | 28396276 G > T | 0 | 1 | 1 | |
-
All ARM domain and other N-terminal variants, barring L76fs, have been tested for function in this study.
-
An additional frameshift variant (corresponding to 28372175dup, G46fs, rs11437592) was reported, but it appears to be an artefact due to sequence discrepancies in the GRCh37 genome build.
-
*
numbering based on the canonical 724 amino acid human SARM1.
-
†
numbering according to GRCh38 after lift over from GRCh37 which contains sequence discrepancies that result in anomalous numbering (see Figure 1 legend and Materials and Methods).
-
‡
minor allele frequency for European (non-Finnish) population in gnomAD v3.1.1 as the best ethnicity match for this dataset.
-
§
This variant is reported as Δ226–232 elsewhere (Bloom et al., 2021). At the DNA level the deletion encompasses a 32 bp region with 11 bp identical repeats at each end and, as such, any 21 bp deletion within this region will have an identical effect at both the DNA and protein level. Δ226–232 and Δ229–235 are thus identical proteins. We have used the Δ229–235 nomenclature for consistency with its rsID.
Table 2
SARM1 coding variants in Answer ALS.
| SARM1domain | Coding variant* | rsID | Chr.17 position and change† | EuropeanMAF‡ | Carriers | |
|---|---|---|---|---|---|---|
| Cases(706) | Controls(92) | |||||
| G35E | rs1480321233 | 28372136 G > A | 0.000015 | 1 | ||
| ARM | R131G | rs1389320808 | 28372423 C > G | 0.000015 | 1 | |
| A210V | - | 28381361 C > T | 0 | 1 | ||
| Δ229–235 § | rs782325355 | 28381417_37 del | 0.000059 | 1 | ||
| R267W | rs11658194 | 28381531 C > T | 0.000015 | 1 | ||
| A301S § | rs782606059 | 28381633 G > T | 0.00012 | 1 | ||
| P332Q § | rs140811640 | 28381727 C > A | 0.012 | 16 | 3 | |
| SAM | Y501H § | rs144613221 | 28385146 T > C | 0.0029 | 5 | 5 |
| TIR | S684F | rs782256561 | 28396162 C > T | 0.000044 | 1 | |
| A719V § | rs146812537 | 28396267 C > T | 0.00050 | 1 | ||
-
All ARM domain and other N-terminal variants have been tested for function in this study.
-
*
numbering based on the canonical 724 amino acid human SARM1.
-
†
numbering according to genome build GRCh38.
-
‡
minor allele frequency for European (non-Finnish) population in gnomAD v3.1.1 as the best ethnicity match for this dataset.
-
§
Variants also present in the Project Mine DF1 dataset.
Table 3
Occurrences and MAFs of SARM1 alleles encoding ARM domain and other N-terminal variants aggregated from all datasets used in this study.
| Variant | Study alleles* | gnomAD alleles† | Study MAF* | gnomAD MAF† | |||
|---|---|---|---|---|---|---|---|
| Cases | Controls | Cases | Controls | ||||
| /22,234 | /20,804 | /63,882 | |||||
| Strong GoF | L223P | 1 | 0 | 0 | 0.000045 | 0 | 0 |
| Δ229–235 | 5 | 0 | 4 | 0.00022 | 0 | 0.000063 | |
| Δ249–252 | 1 | 0 | 0 | 0.000045 | 0 | 0 | |
| R267W | 2 | 0 | 1 | 0.000090 | 0 | 0.000016 | |
| V331E | 1 | 0 | 0 | 0.000045 | 0 | 0 | |
| E340K | 1 | 0 | 4 | 0.000045 | 0 | 0.000063 | |
| T385A | 2 | 0 | 0 | 0.000090 | 0 | 0 | |
| Combined | 13 | 0 | 9 | 0.00058 | 0 | 0.00014 | |
| Other | G35E | 1 | 0 | 1 | 0.000045 | 0 | 0.000016 |
| T39M | 0 | 1 | 0 | 0 | 0.000048 | 0 | |
| L76fs | 0 | 1 | 0 | 0 | 0.000048 | 0 | |
| V88M | 0 | 1 | 0 | 0 | 0.000048 | 0 | |
| V112I | 1 | 0 | 1 | 0.000045 | 0 | 0.000016 | |
| R131G | 1 | 0 | 1 | 0.000045 | 0 | 0.000016 | |
| A210V | 0 | 1 | 0 | 0 | 0.000048 | 0 | |
| A240E | 1 | 0 | 0 | 0.000045 | 0 | 0 | |
| R244S | 1 | 0 | 0 | 0.000045 | 0 | 0 | |
| A250T | 1 | 0 | 0 | 0.000045 | 0 | 0 | |
| A275V | 1 | 2 | 2 | 0.000045 | 0.000096 | 0.000031 | |
| A301S | 6 | 1 | 8 | 0.00027 | 0.000048 | 0.00013 | |
| R310H | 2 | 2 | 11 | 0.000090 | 0.000096 | 0.00017 | |
| N337D | 3 | 4 | 26 | 0.00013 | 0.00019 | 0.00041 | |
| A341V | 3 | 2 | 8 | 0.00013 | 0.000096 | 0.00013 | |
| Combined | 21 | 15 | 58 | 0.00094 | 0.00072 | 0.00091 | |
| P332Q* | 198 | 206 | 789 | 0.0089 | 0.010 | 0.012 | |
-
*
Aggregated values for all datasets listed in Figure 8.
-
†
Values for the non-neuro European (non-Finnish) population in gnomAD v3.1.1. These values do not include case samples collected as part of a neurologic or psychiatric case/control study. However, that does not guarantee that any carriers of the alleles listed are not already affected or will not go on to develop a motor nerve disorder.
Table 4
Clinical information for motor nerve disorder patients heterozygous for SARM1 GoF alleles.
| Clinical diagnosis(site of onset) | SARM1variant | Cohort | Sex | Age-of-onset/ progression | Other variants | Close relatives affected | Other observations / co-morbidities |
|---|---|---|---|---|---|---|---|
| ALS (bulbar) | L223P | Project MinE | M | 59 / 3 yr. dead | None * | Not known | |
| ALS (bulbar) | Δ229–235 | Answer ALS | F | 70 / 2 yr. dead | None† | Not known | - No FTD- Hyperlipidaemia |
| ALS | Δ229–235 | GENESIS | M | 66 / 1 yr. dead | ‡SOD1 | None | - Rapid progression |
| ALS (spinal) | Δ229–235 | Unattributed | F | 71 / 2 yr. dead | Not available | None | - Lower extremity onset- FTD |
| ALS (spinal) | Δ229–235 | Project MinE | M | 42 / 3 yr. dead | None * | Not known | |
| ALS (spinal) | Δ229–235 | Project MinE | M | 57 / 3 yr. dead | None * | Not known | |
| ALS (bulbar) | Δ249–252 | Project MinE | M | 65 / 4 yr. dead | None * | Not known | |
| ALS (spinal) | R267W | Answer ALS | M | 58 / 2 yr. dead | §FIG4† | Not known | - Lower limb onset- COPD and Type II diabetes |
| ALS (spinal) | V331E | Project MinE | M | 53 / 5 yr. dead | None * | Not known | |
| ALS (spinal) | E340K | Project MinE | M | 75 / 6 yr. dead | None * | Not known | |
| ALS (spinal) | T385A | Project MinE | M | 69 / 6 yr. alive | None * | Not known | |
| ALS (bulbar) | T385A | Project MinE | F | 63 / 1 yr. dead | None * | Not known | |
| HSP (pure) | Δ229–235 | GENESIS | F | 5 / 14 yr. alive | Not available | None | - Presented with lower extremity spasticity and hyperreflexia extensor plantar responses- Wheelchair use at 19 yr.- Normal total spine MRI (smallish thoracic cord) |
| Upper and lower motor nerve disorder | R267W | UCL | M | 40 / 25 yr. alive | None ¶ | None | - Presented with right leg weakness, thigh fasciculations and slowly progressive wasting- No sensory, bladder, bowel, or bulbar involvement- Mild hand weakness and brisk reflexes by 50 yr.- Lower limb spasticity by 61 yr.- Still ambulates independently- Proximal lower limb denervation> distal upper limb denervation. |
| ALS (spinal) | V112I | Project MinE | M | 52 / 17 yr. dead | None * | Not known |
-
FTD; frontotemporal dementia, COPD; chronic obstructive pulmonary disease.
-
*
Screened for variation in C9orf72, FUS, SOD1 and TARDBP.
-
†
Screened for variation in ALS2, ATXN2, C9orf72, CCNF, CHCHD10, FUS, OPTN, PFN1, SOD1, TARDBP, TBK1, UBQLN2, VAPB and VCP.
-
‡
Heterozygous for the partially-penetrant I114T SOD1 variant associated with sporadic ALS.
-
§
Heterozygous for the L17P Figure 4 variant, a variant that has previously only been associated with CMT4J in combination with a null allele.
-
¶
Screened for variation in Androgen Receptor expansion, ALS2, ANG, C9orf72, CYP7B1, DCTN1, FA2H, Figure 4, FUS, GJC2, KIAA0196, KIF5A, NIPA1, OPTN, PLP1, PNPLA6, REEP1, RTN2, SPAST, SPG7, SLC52A1, SLC52A2, SLC52A3, SMN, SOD1, TARDBP, UBQLN2, VAPB, VCP, whole mtDNA sequencing in blood.
Additional files
Download links
A two-part list of links to download the article, or parts of the article, in various formats.
Downloads (link to download the article as PDF)
Open citations (links to open the citations from this article in various online reference manager services)
Cite this article (links to download the citations from this article in formats compatible with various reference manager tools)
Enrichment of SARM1 alleles encoding variants with constitutively hyperactive NADase in patients with ALS and other motor nerve disorders
eLife 10:e70905.
https://doi.org/10.7554/eLife.70905


