Supracellular organization confers directionality and mechanical potency to migrating pairs of cardiopharyngeal progenitor cells
- Center for Developmental Genetics, Department of Biology, New York University, United States
- Courant Institute of Mathematical Sciences and Department of Biology, New York University, United States
- Mathematics and Computational Medicine, University of North Carolina at Chapel Hill, United States
- Sars International Centre for Marine Molecular Biology, Norway
- Department of Heart Disease, Haukeland University Hospital, Norway
Figures
Figure 1 with 3 supplements
Model of force distribution in migrating trunk ventral cell (TVC) pairs.
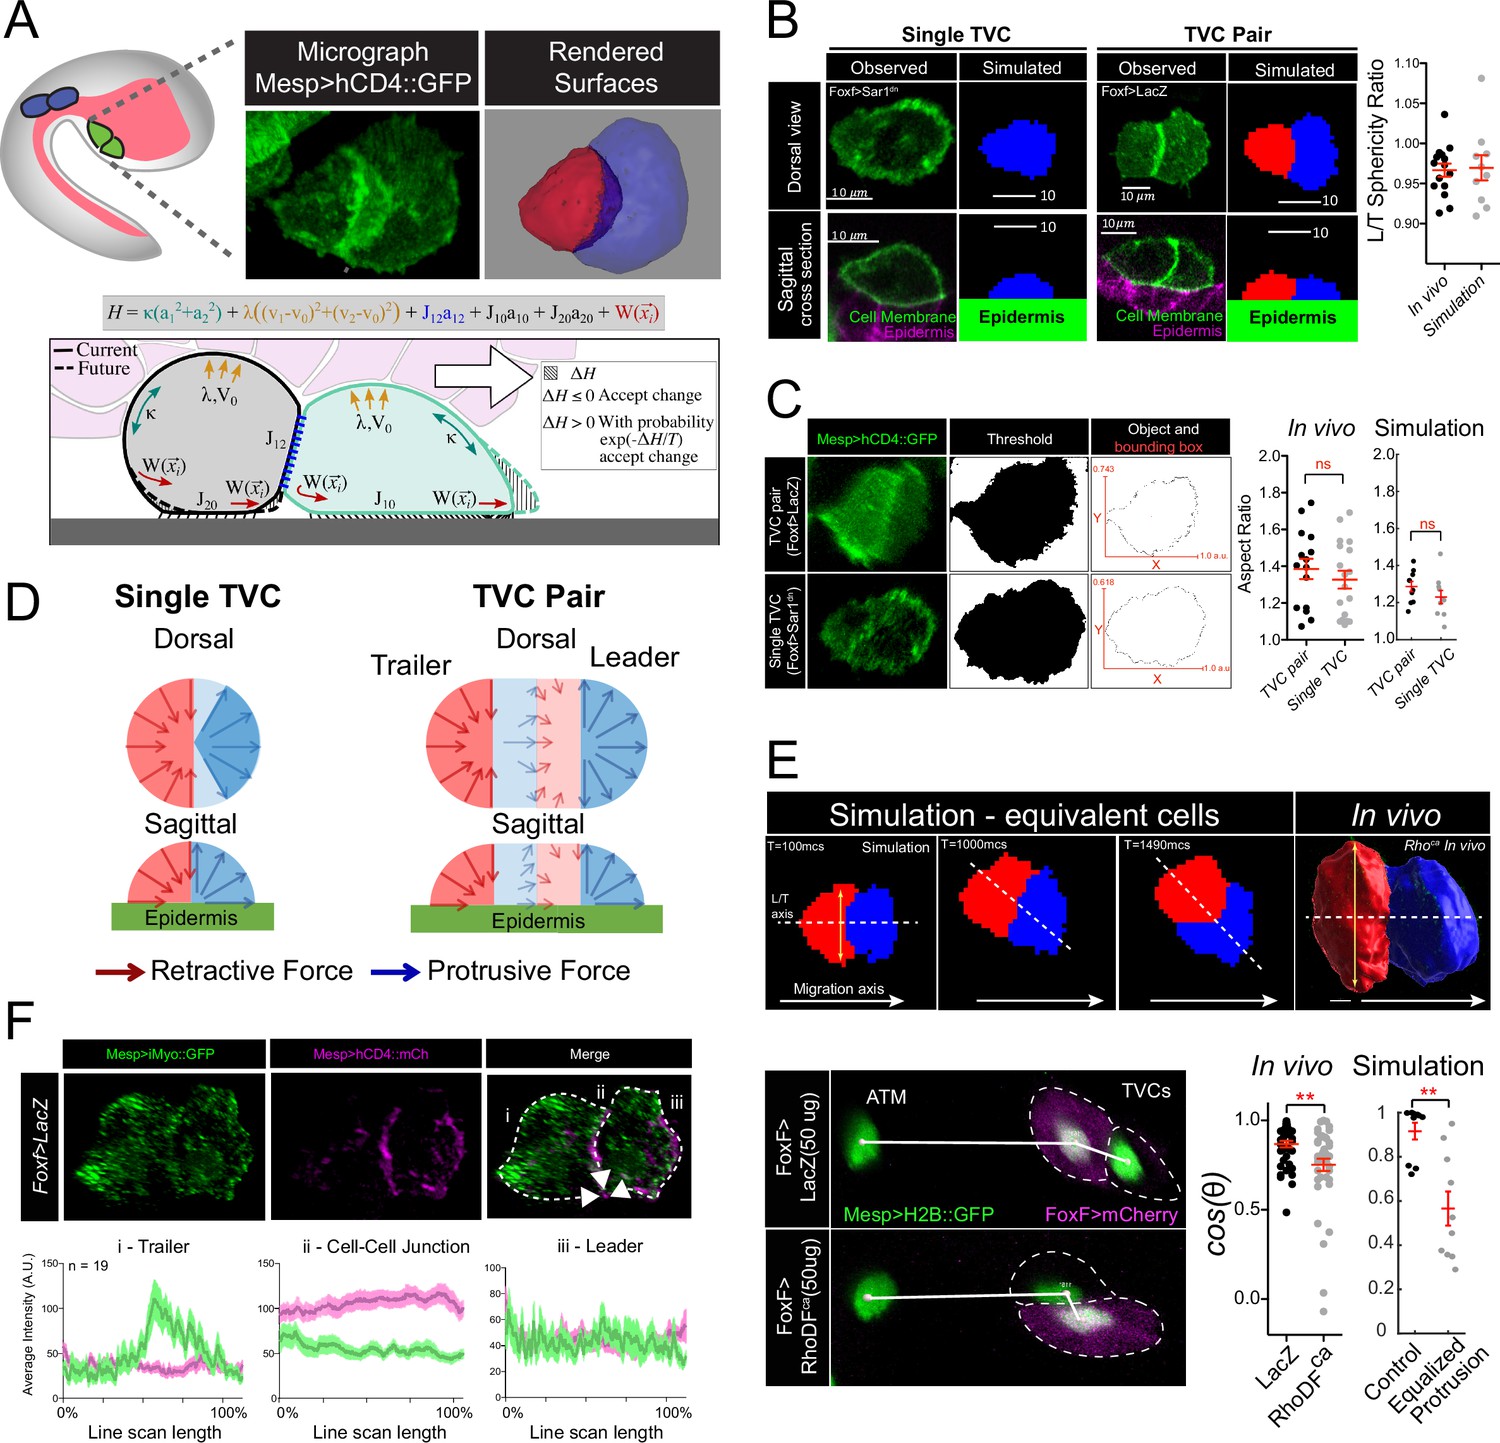
(A) Diagram of Ciona robusta embryo at the late tailbud stage (embryonic stage 23). Migrating TVCs are shown in green, their non-migratory sister cells, anterior tail muscles (ATMs), in blue. The endoderm is shown in pink. A micrograph of a migratory pair of TVCs is shown with the leader to the right and the trailer to the left. Cell membranes are marked with Mesp>hCD4::GFP. To the right is a surface-rendered image of the migratory TVC pair with leader in blue and trailer in red. Schematic diagram showing the mechanical parameters related to cells’ movement and morphology, reflecting volume conservation (yellow), surface tension (green), cell-cell adhesion (blue), cell-epidermis adhesion (black), and active protrusion/retraction forces (red). The cell pair moves to the right, with the green cell as the leader cell and the gray cell as the trailer cell. Overlying endoderm cells are shown in pink; the underlying epidermis in gray. The shape change (shaded area) is accepted or rejected depending on the energy change related to it. The equation above shows the effective mechanical energy, H, of the cell pair. The meaning of the parameters is explained in the text. (B) Comparison of cell shape in the experiment and in simulation for single migrating cell and migrating cell pair. Scatter plot shows ratio of leader to trailer sphericity derived from in vivo measurements and in simulations. In vivo data were pooled from two biological replicates. No statistical difference was identified by Student’s t-test between the in vivo and simulated data. Micrographs show dorsal and lateral view of 3D images of TVC. TVC membranes are marked with Mesp>hCD4::GFP, and epidermal cell membranes are marked with Mesp>hCD4::mCherry. (C) Aspect ratios of migrating cell pairs compared to aspect ratios of single migrating cells calculated in Fiji and in simulations. Red lines show length of bounding box width and heights normalized to the width. Scatter plots show mean with standard error of in vivo and simulated data. Statistical analysis was performed using Student’s t-test. No significant difference between conditions in vivo and in simulation. Data are pooled from two biological replicates. (D) Dorsal and sagittal views of force distributions within a single cell (left) and two connected cells (right) in our model for unperturbed cells. Arrow thickness indicates relative strength and direction of force. Cell anterior is in blue and posterior in red. (E) Simulation and in vivo verification of equalized protrusion in leader and trailer. Top panels show results of simulated cell positions at indicated time points and the morphology of an in vivo cell pair when trailer protrusion is upregulated by expression of constitutively active Ras (Rasca). Solid arrows show the direction of migration. Bottom panels show representative positions of migrating cells with respect to the stationary ATMs. Graphs show the cosine of the radian angle of the leader/trailer axis to the axis of migration derived from in vivo and simulations. Inheritance of the perturbing plasmid is followed using the cytoplasmic marker FoxF>mCherry (magenta), and the nuclei of the TVCs and ATMs is marked with Mesp>H2B::GFP histone marker. In vivo data were pooled from two biological replicates. Statistical analysis was performed using Student’s t-test for the experimental data and Student’s t-test with Welch’s correction for the simulation data, ** p<0.01. In simulations here and below, time is measured in units of Monte Carlo step (mcs). (F) Distribution of myosin reporter iMyo-GFP intensity compared to membrane marker Mesp>hCD4::mCherry. Dashed arrows on the merged micrograph indicate the directionality of the line scan, which moves in the direction of the arrow. Mean values with standard error are plotted on the graphs. Data were pooled from two biological replicates.
Figure 1—figure supplement 1
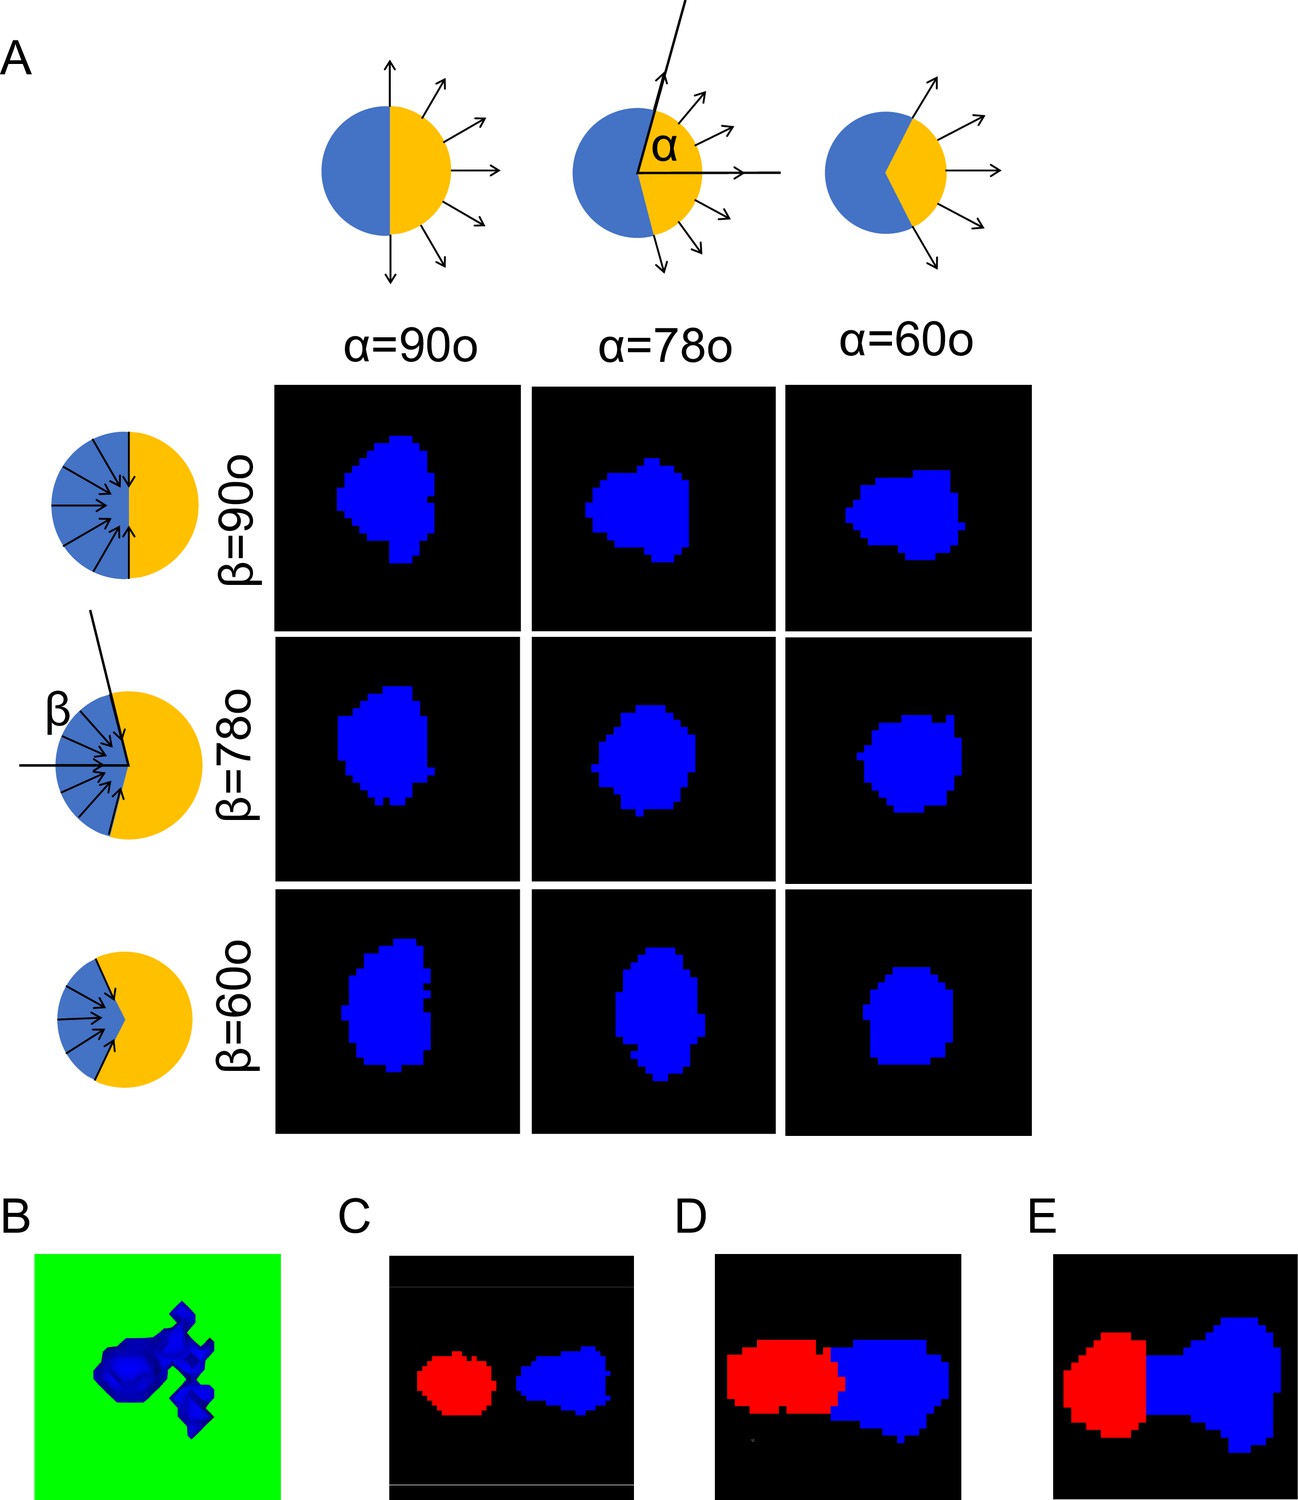
In silico analysis of evolution of single-cell shape and two-cell cohesion under differing force distribution.
(A) Typical cell shapes for protrusive and retractive forces distributed within different ranges. (B) Unstable deformation of cell front resulting from focusing the protrusive force in the narrow layer near the flat substrate. (C) Detachment of the trailer from the leader resulting from failure to increase retractive forces in the trailer. (D) Elongation of the leading cell when using the force distribution associated with a single migratory cell. (E) Abnormal cell pair shape produced by loss of protrusive force in trailer and retractive force in leader.
Figure 1—figure supplement 2
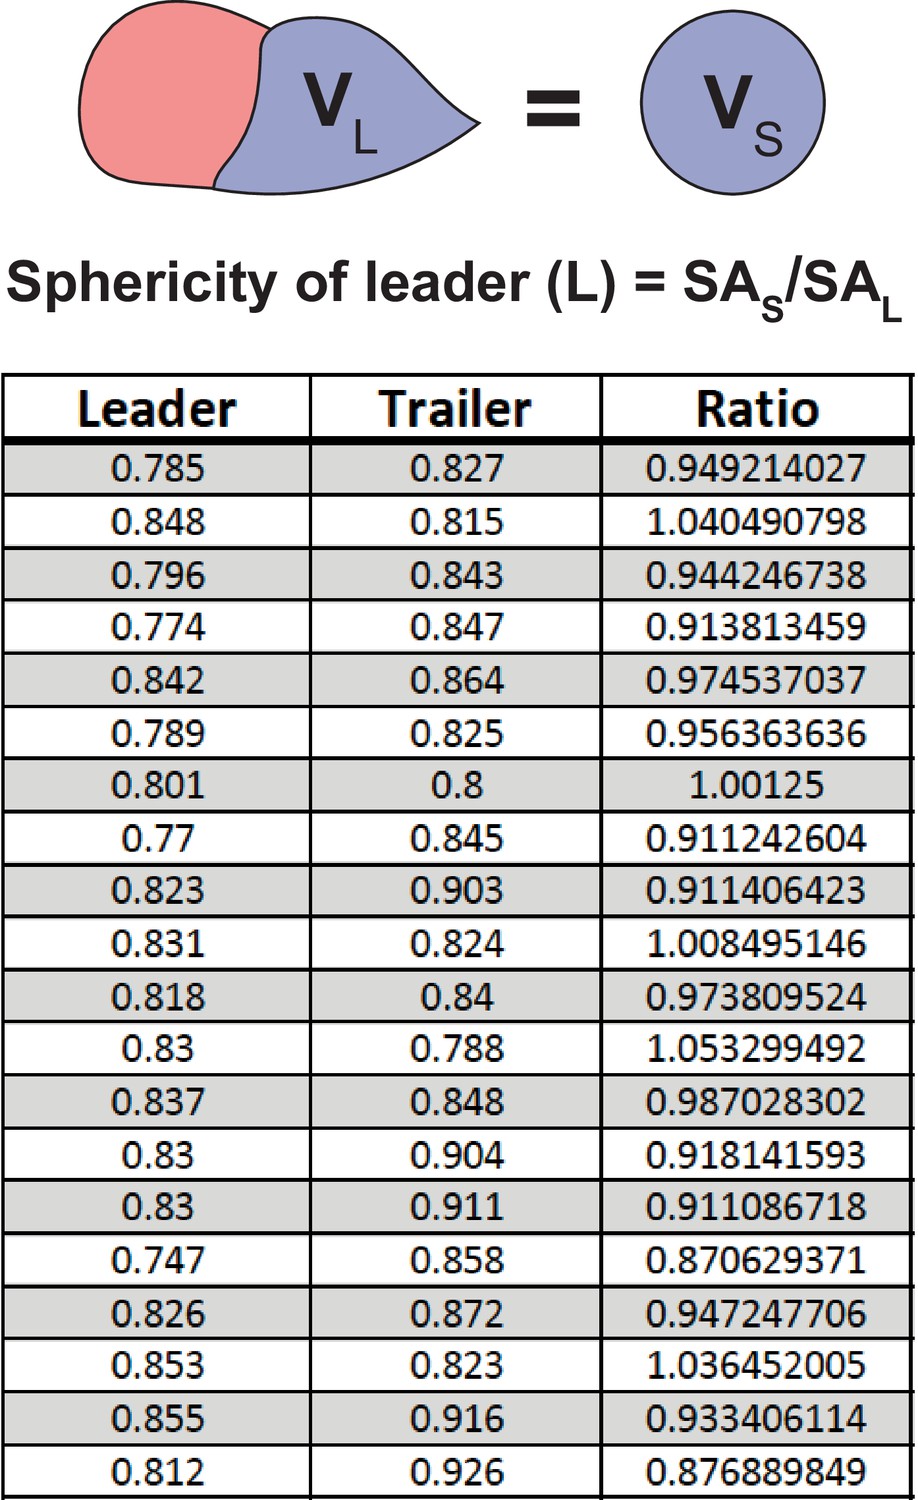
Sphericity of leader and trailer cells.
Sphericity is measured using automated Bitplane Imaris function and calculated as the ratio of surface area of sphere with volume equal to that of a cell being analyzed to the actual surface area of the cell. VL, volume of leader cell; VS, volume of sphere that is equivalent to the volume of leader cell; SA, surface area. Table shows individual sphericity values for matched leader/trailer cells.
Figure 1—figure supplement 3
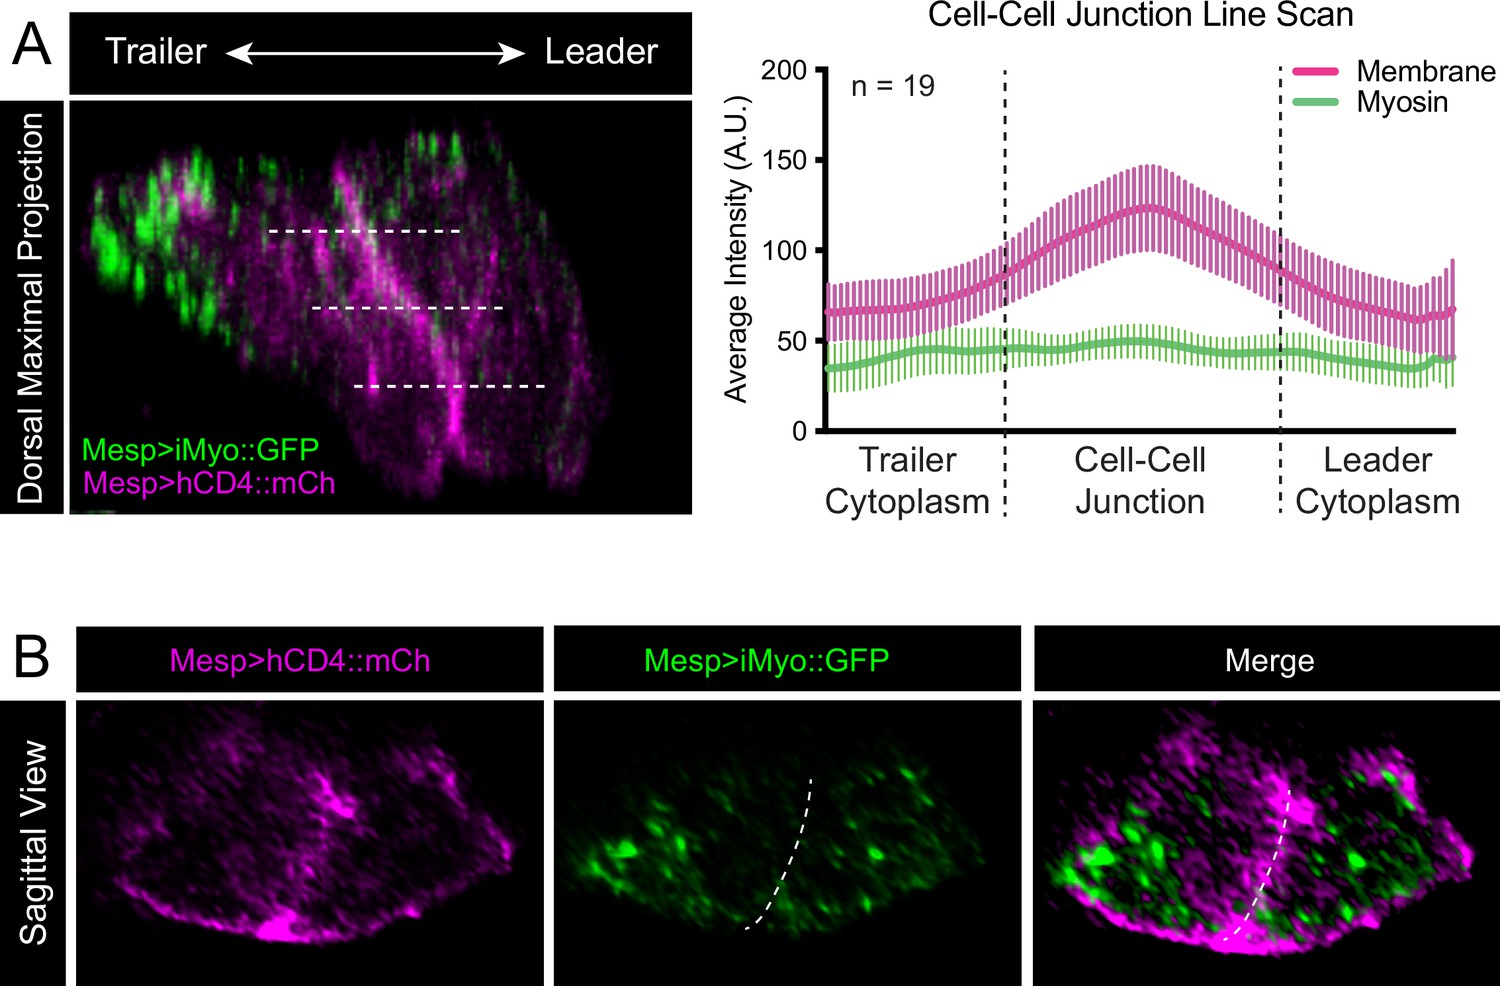
Myosin distribution at the cell-cell junction.
(A) Micrograph at left shows a dorsal view of a leader/trailer cell pair with leader oriented to the right. Dashed lines show positions of line scans of fluorescence intensity (a.u.) taken in the green (Mesp>iMyo::GFP) and magenta (Mesp>hCD4::mCherry) channels with the center of the line positioned over the cell-cell junction. A total of 19 cell pairs from two biological replicates were analyzed with three line scans per pair. All line scans were of the same length, and fluorescence intensity was averaged per cell pair to represent relative intensity of the two markers. Averages of fluorescence intensities of 19 embryos are shown in the graph with means and SEM. (B) Sagittal slice through a representative trunk ventral cell (TVC) pair with membrane marker Mesp>hCD4::mCherry in magenta and Mesp>iMyo::GFP in green. Images are oriented with leader to the right. Dashed line represents position of cell-cell junction.
Figure 2 with 1 supplement
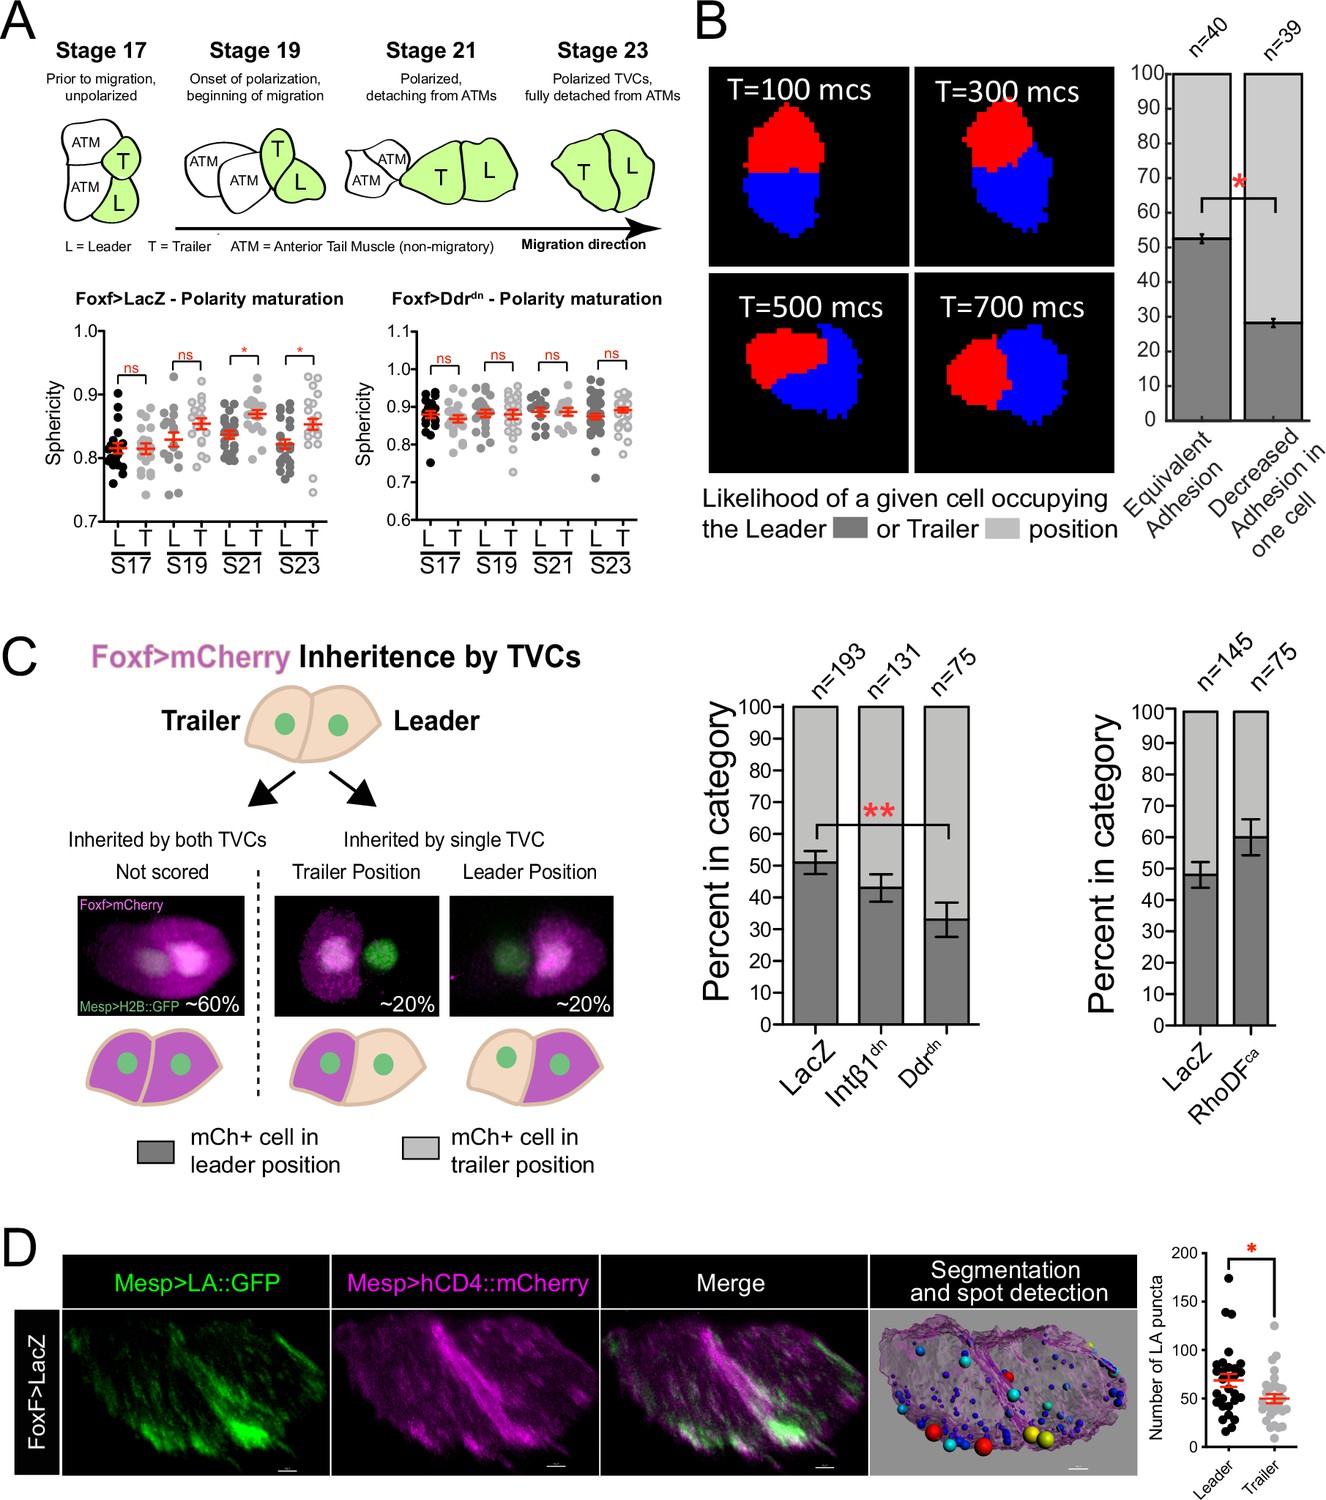
Polarized matrix adhesion promotes adoption of leader/trailer cell state.
(A) Establishment of leader/trailer polarity as measured by the asymmetry that develops between leader and trailer sphericity as cells polarize in the direction of migration. Diagram depicts dorsal view of cells at stages when sphericity was calculated. Migratory cells are highlighted in green. L, leader; T, trailer; ATM, anterior tail muscle. Scatter plots show mean with standard error. Data were pooled from three biological replicates. Statistical significance tested using ANOVA followed by Bonferroni test to compare means. *p<0.05 (B) Simulation of decreasing extracellular matrix (ECM) adhesion in one cell (red) of a migrating cell pair. Cells are migrating to the right starting in a parallel orientation as shown in T = 100 Monte Carlo steps (mcs). Bar graphs show likelihood of either cell assuming the leader or trailer position in either control conditions (50/50 likelihood) or when adhesion in red cell is decreased. Standard error of proportion is shown, and statistical analysis of the proportions is done using Fisher’s exact test. (C) In vivo modulation of ECM adhesion using mosaic inheritance of the Foxf>Intβ1dn, Foxf>Ddrdn, and Foxf>RhoDFca, marked by Foxf>mCherry. Diagram shows a schematic of mosaic inheritance of transgenes and resulting distribution of mCherry fluorescence. Bar graphs show likelihood of cell that inherits the transgenic constrict to be found in either leader or trailer position. Data were pooled from three biological replicates. Error bars are standard error of proportion. Statistical analysis was performed using Fisher’s exact test. (D) Micrographs show distribution of Mesp>Lifeact::GFP in leader and trailer cells. Image on the right shows a representative rendered cell pair surface with spot detection based on 10% highest GFP intensity. Spots are color-coded from smallest (blue) to largest (red). Scatter plot on the right shows number of GFP puncta per cell. Data were pooled from two biological replicates. Statistical analysis was performed using Student’s t-test. *p<0.05.
Figure 2—figure supplement 1
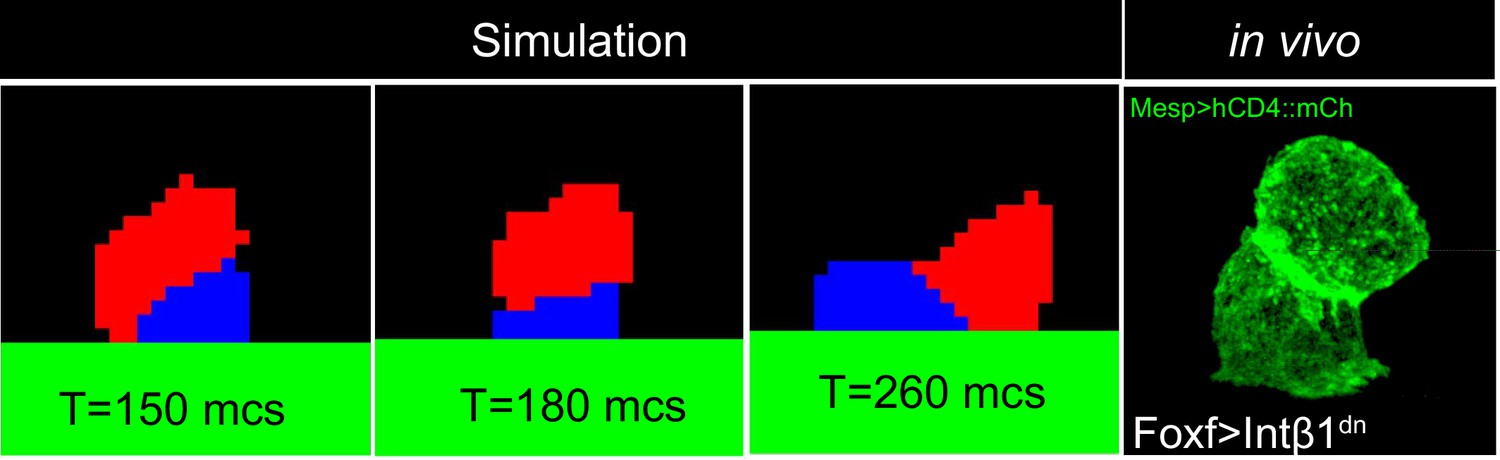
Acute reduction of extracellular matrix (ECM) adhesion in single cell (red) causes detachment of that cell from the underlying epidermis and recapitulates the phenotype observed in vivo (bottom right) with the detached cell positioned on top of the cell that maintains ECM adhesion.
Micrograph at the bottom right shows trunk ventral cell (TVC) pair expressing Foxf>Intβ1dn with membranes marked by Mesp>hCD4::GFP.
Figure 3
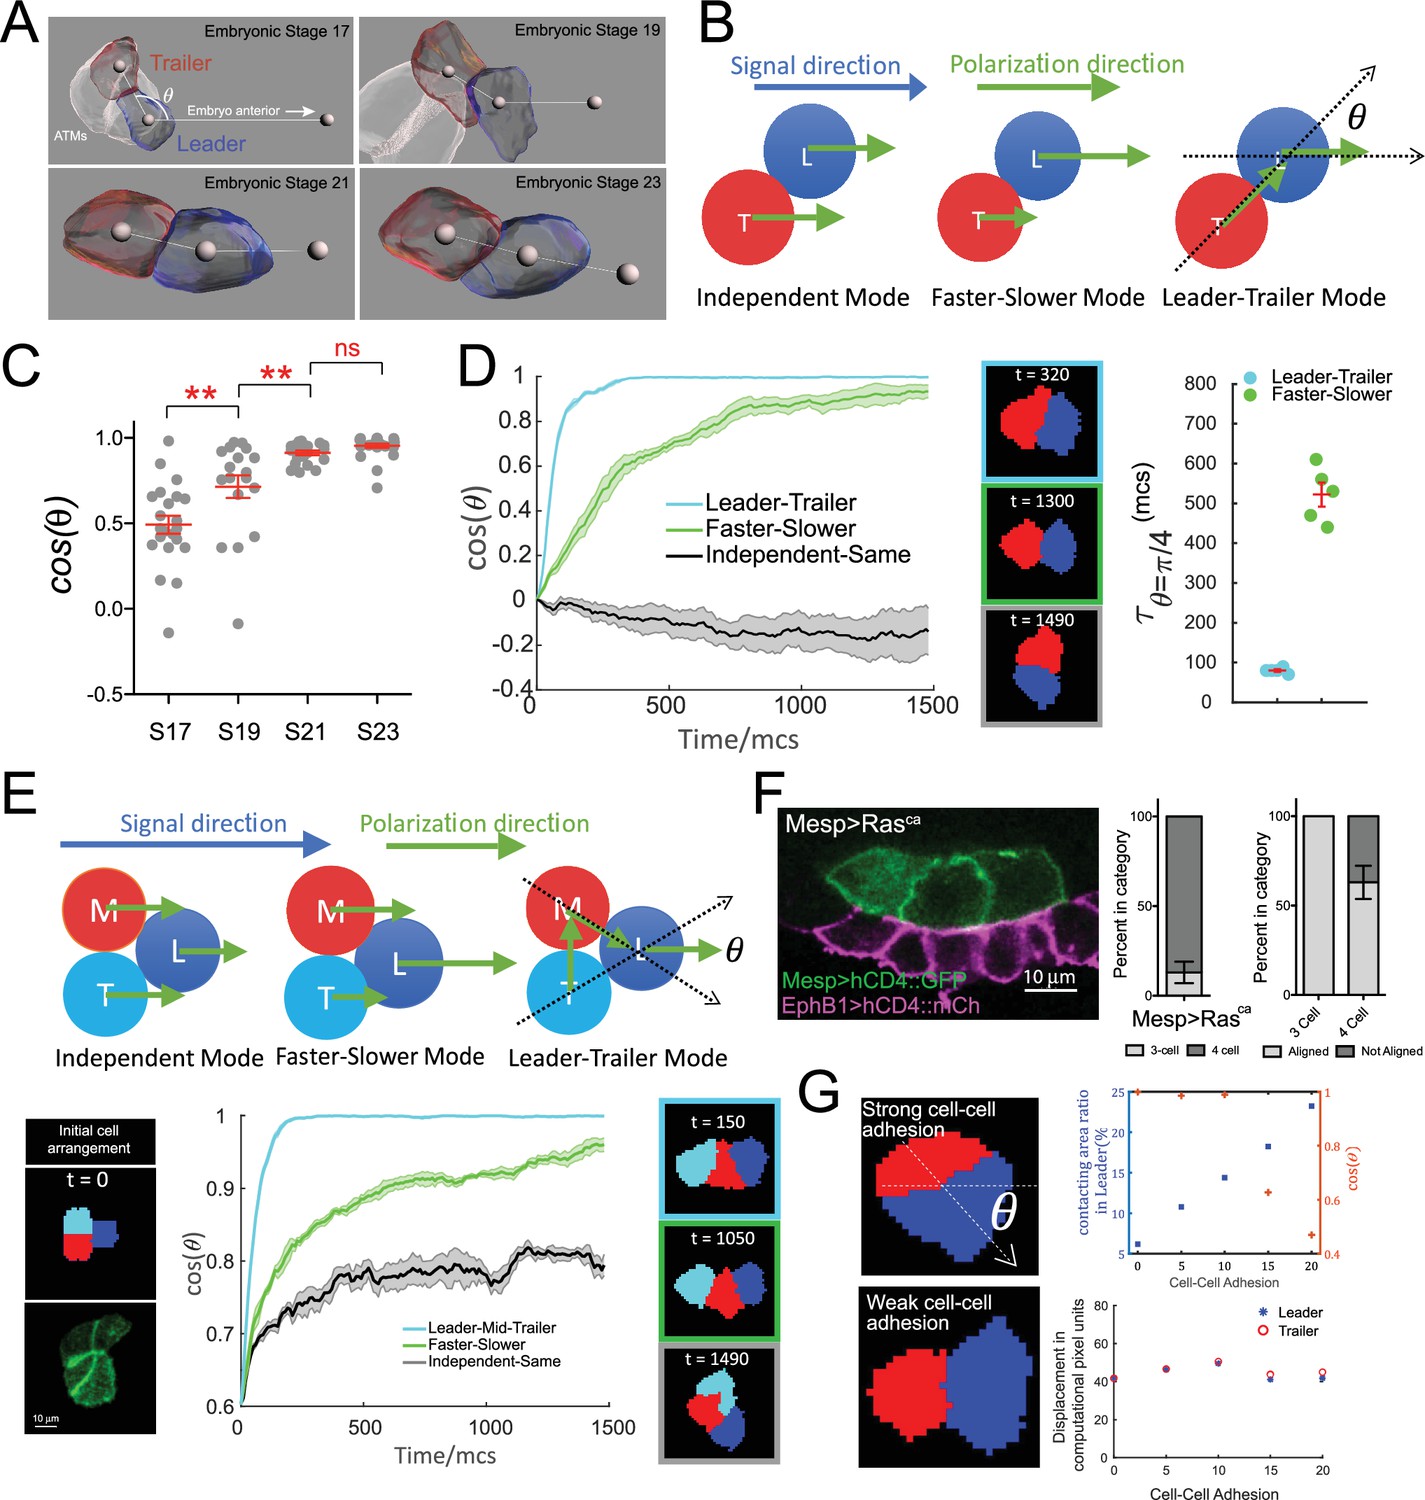
Hierarchical organization of multicellular migratory clusters.
(A) Evolution of trunk ventral cell (TVC) polarization. Panels show in vivo-rendered images of cells at the indicated embryonic stages. Leader in blue, trailer in red, non-migratory anterior tail muscles (ATMs) in white. Spheres inside cells mark the center of mass, sphere to the right indicates direction of anterior migration. Angle theta between the axis of leader/trailer and direction of migration is indicated. (B) Three hypothesized polarization modes for two-cell migration. Independent: cells polarize independently in the signal direction and move with the same speed. Faster-slower: cells polarize independently in the signal direction, but one cell moves faster than the other. Leader-trailer: one cell (leader) follows the signal direction, while the other (trailer) polarizes in the direction of the leader’s center of mass. L, leader; T, trailer. (C) Establishment of alignment between the leader/trailer axis and direction of migration. Cos(θ) is shown for indicated embryonic stages. Data were pooled from two biological replicates. Statistical analysis was performed using one-way ANOVA and Bonferroni post test. **p<0.01. (D) Left: the simulated evolution of two cells’ geometry, quantified as cosine of the angle between the line connecting the cells centroids and the signal direction, (), for the three polarization modes shown in (B). Five simulations are run for each mode, and the shaded area shows the standard error. Center: representative snapshots of two cells reaching linear arrangement or at the end of simulation using each mode. The colors of the frames correspond to the dataset on the graph. Right: scatter plot showing the time when reaches for two modes with mean and standard error and statistical analysis using Student’s t-test with Welch’s correction. (E) Top: hypothesized polarization modes for three cells. Independent: cells polarize independently in the signal direction and move with equal speeds. Faster-slower: cells polarize independently in the signal direction, in this case, the leader travels the fastest, trailer the slowest, and middle cell travels at an intermediate speed. Leader-trailer: one cell (leader) follows the signal direction, middle cell polarizes towards the leader, and trailer polarizes toward the middle cell. Bottom: simulation of the three-cell group polarization under the three hypothesized polarization modes. Left: the initial cell arrangement in silico (top) and in vivo (bottom). Note that in vivo there are always four cells prior to migration arranged in a rectangular pattern. Center: the polarization of migrating cell clusters over time is quantified by the cosine of the angle between the lines connecting the leader and the two posterior cells separately, as shown in (F). Five simulations were run for each mode, and shaded area shows the standard error. Right: representative snapshots when the three cells reach linear arrangement for the three modes examined (for the independent-same mode, linear arrangement is never reached, snapshot shows cells at the end of a simulation run). The colors of the frames correspond to the datasets on the graph. (F) Three migratory cells are linearly arranged in the direction of migration in vivo. Bar graphs show the proportion of TVCs that migrate as either three or four cells under induced MAPK signaling by Mesp>Rasca and proportion of cell groups that are linearly polarized in each subset. Data were pooled from two biological replicates. Error bars show standard error of proportion. (G) Effects of modulating cell-cell adhesion on the contacting area between the two cells and on their speed, quantified by the percentage of total surface area of the leader cell (top graph, left y-axis, blue symbols), on the ability of the cell pair to polarize in the direction of migration quantified by (top graph, right y-axis, red symbols), where is the angle between the line connecting two cells and the moving direction as shown in the top image on the left, and on the total displacement of the leader/trailer pair (bottom graph). x-axis shows the relative energy of the cell-cell junction (the adhesion parameter is rescaled here so that larger value means stronger cell-cell adhesion). Images show cell pairs with either high (top) or low (bottom) cell-cell adhesion. Arrow represents leader/trailer axis.
Figure 4
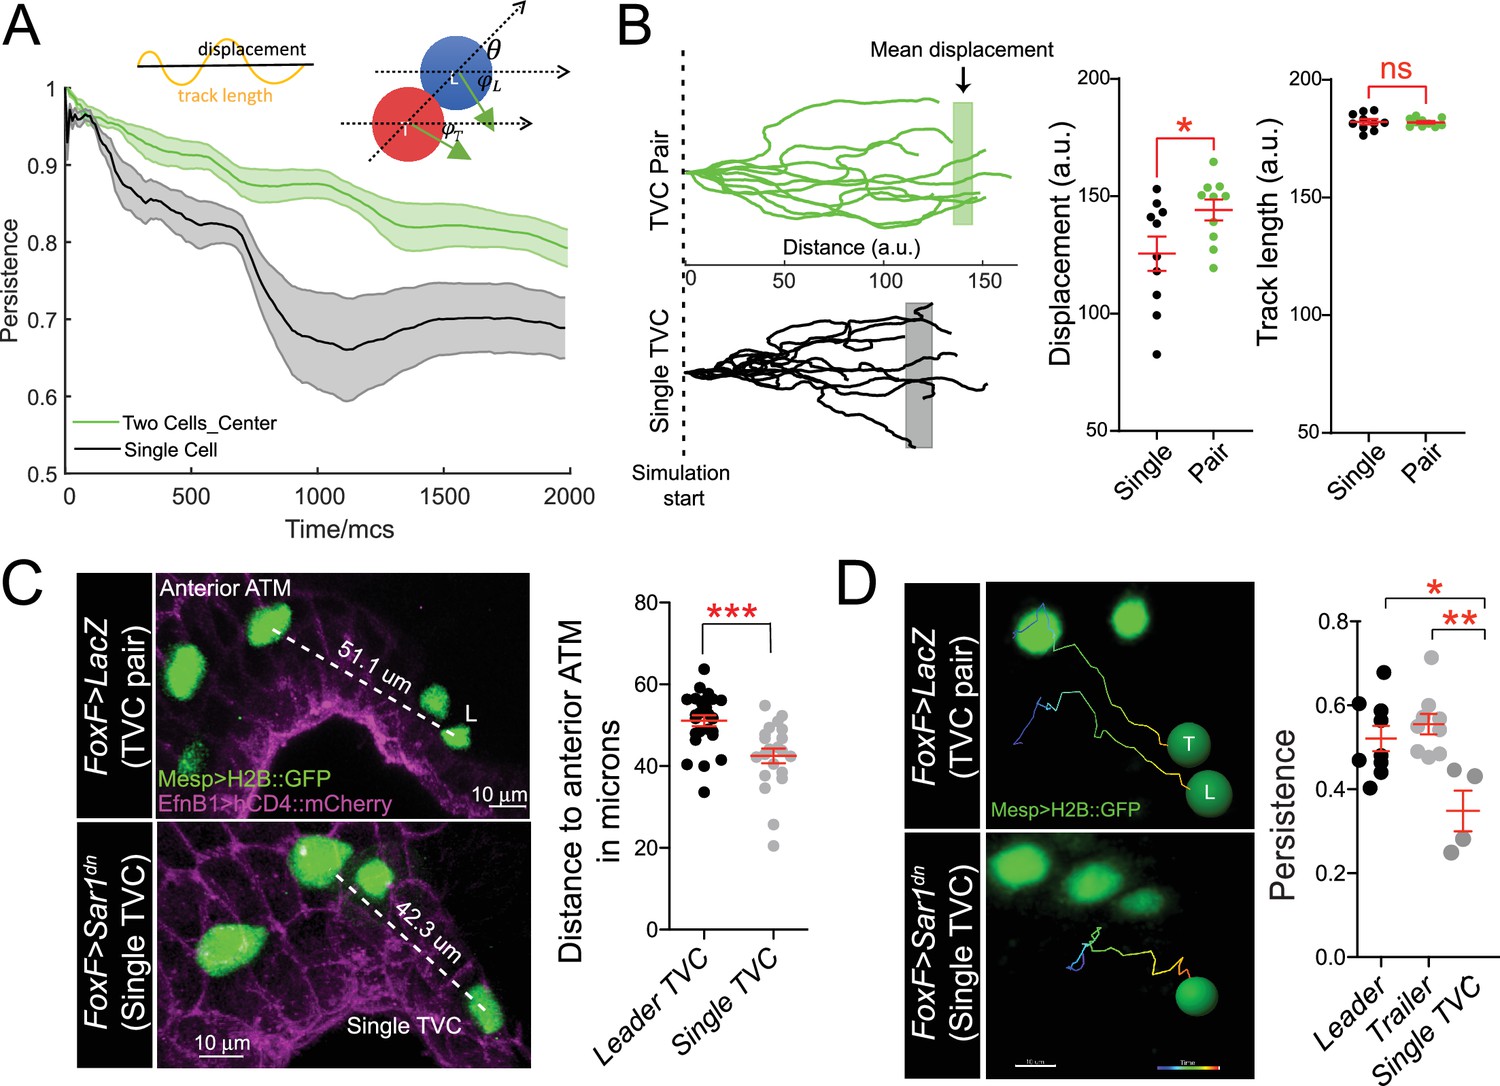
Migratory persistence of cell pairs and single cells.
(A) Left: simulation of migration persistence over time for single cell and the centroid of the cell pair. The shaded area shows the standard error. In the model, green arrows show the direction of active forces for each cell that is directionally biased but also fluctuates randomly. The leader cell is biased to the right, which is the direction of the external cue, and the trailer cell is biased to the leader cell. and are the angles between the green arrows and the right direction, and is the angle between the line connecting two cells and the right direction. The specific stochastic equation for is given in the Materials and methods section using the same angle notations. The diagram on top shows the relationship between displacement and track length and . (B) Comparison of tracks from simulations of either migrating cell pairs or single cells within the same simulation time. Shaded vertical lines represent mean final displacement. Graphs on the right show mean total displacement and mean total track length with standard error. Statistical analysis was performed using Student’s t-test. *p<0.05. (C) In vivo analysis of total displacement of leader cells in a cell pair and single trunk ventral cells (TVCs) from the anterior tail muscle (ATM). TVC and ATM nuclei are marked with Mesp>H2B::GFP, epidermal cell membranes are marked with EphB1>hCD4::mCherry. Data were pooled from two biological replicates. Scatter plot shows average displacement and standard error. ***p<0.001. (D) In vivo migration of TVC pairs compared to single TVC. Nuclei of the cells are used to track cell migration path in 4D datasets. Paths are color-coded from early (blue) to late (red). Scatter plot shows mean persistence of leader (n = 8), trailer (n = 8), and single TVC (n = 4) with standard error. Statistical analysis was performed using one-way ANOVA with Bonferroni post test. *p<0.05, **p<0.01.
Figure 5
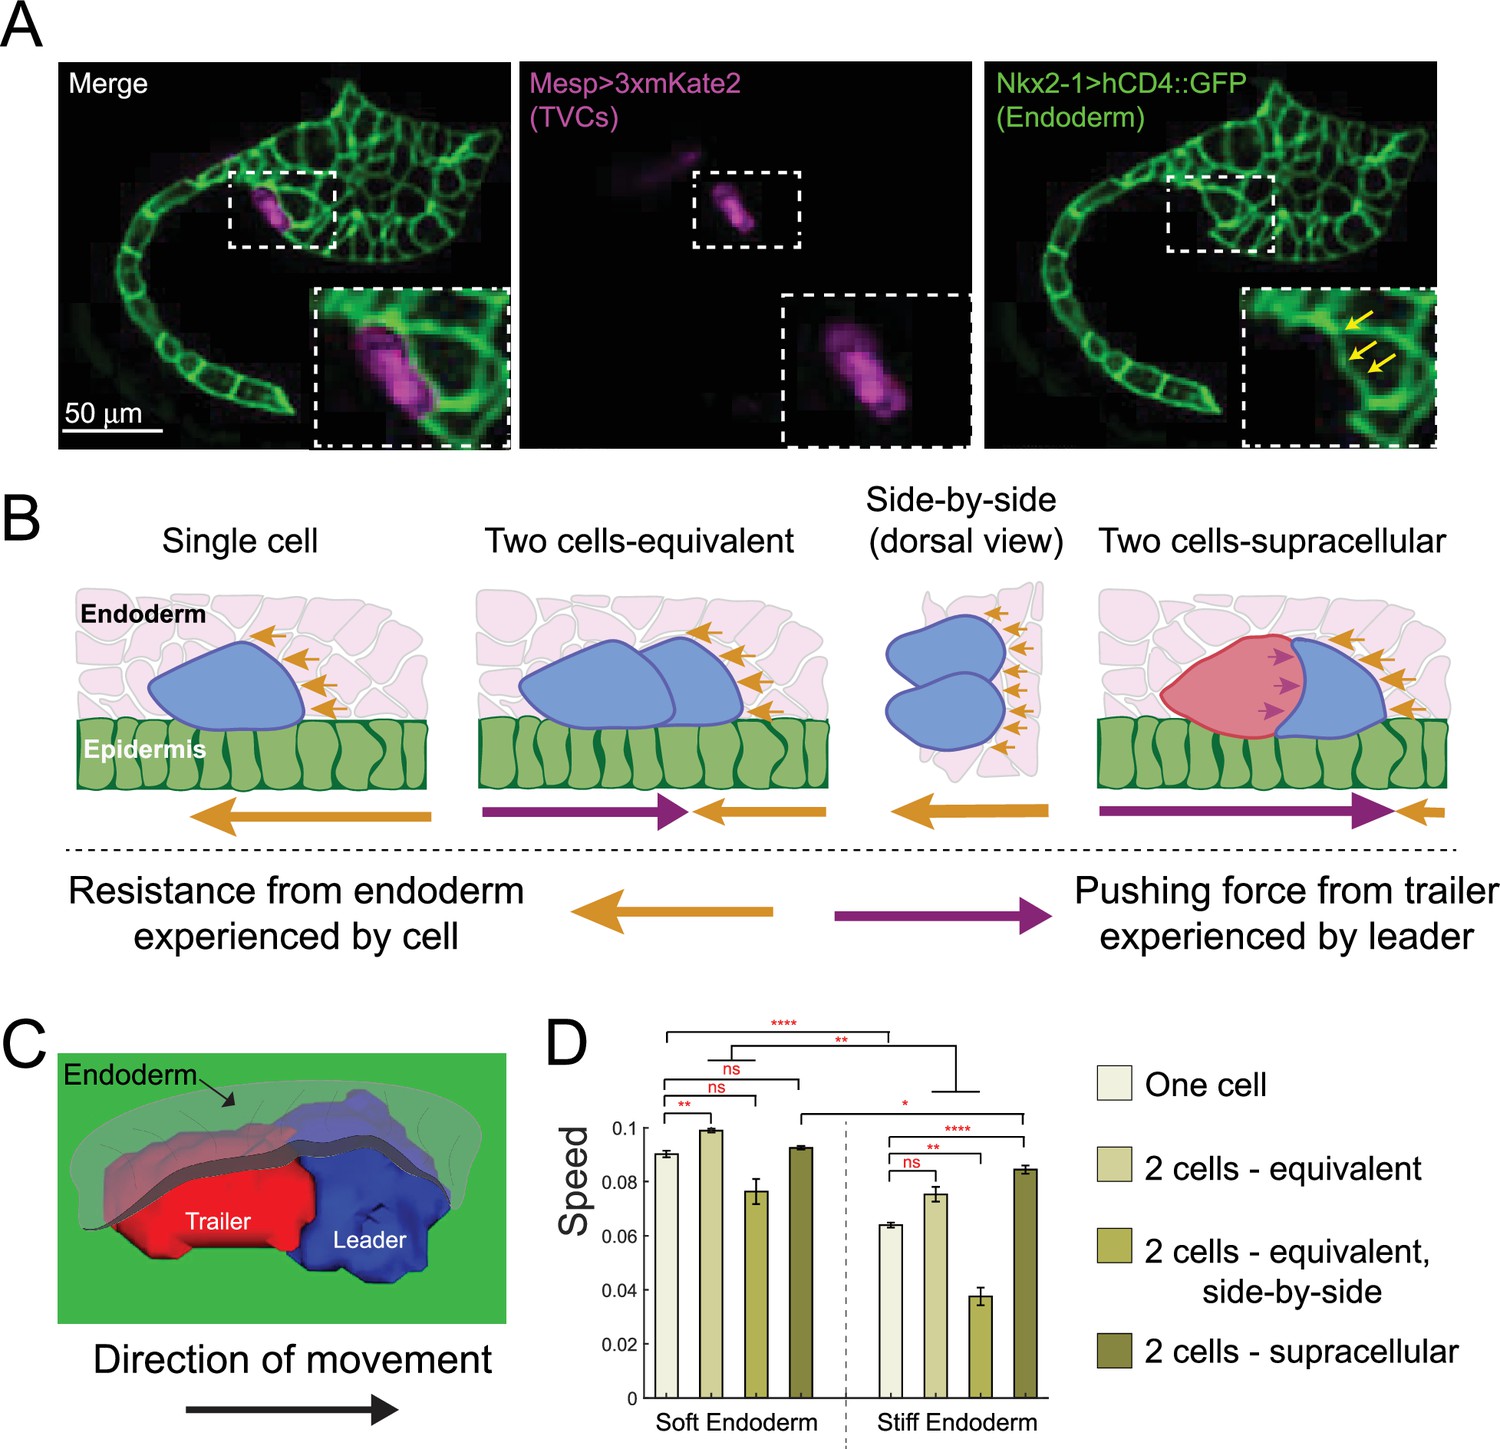
Supracellular cell pairs are more efficient at dispersing pressure from surrounding tissues.
(A) Micrographs of stage 23 embryos showing the endodermal pocket formed during trunk ventral cell (TVC) migration. Embryos are oriented with anterior to the right. Endodermal cells are marked with Nkx2-1>hCD4::GFP (green), TVCs are marked with Mesp>3xmKate2 (magenta). Yellow arrows point to depression pocket left in the endoderm by migrating TVCs. (B) Proposed model for higher efficiency of supracellular cell pairs in overcoming resistance from the endodermal tissue (pink) during migration: the adhesive cell pair shares the resistance force (yellow arrows), which otherwise each single cell must overcome alone. Pressure from the posterior trailer (purple arrows) can help the cell pair overcome resistance from the endoderm. Size of the arrows below the graphics represents relative strength of the force experienced by the cell in the direction of the arrow. (C) Simulated supracellular cell pair underneath the endoderm. Epidermis is shown in green. The endoderm is rendered transparent. (D) Speed comparison between single cell and differently arranged cell pairs with different profiles and force distributions under the endoderm of varying stiffness. Five simulations are run for each condition; the error bar is the standard error. Statistical analysis is performed using Brown–Forsythe and Welch ANOVA test. *p<0.05, **p<0.01, ****p<0.0001.
Videos
Video 1
In silico model of a single migrating trunk ventral cell (TVC).
Video 2
In silico model of trunk ventral cell (TVC) pair (leader in blue, trailer in red) migrating along a surface.
Video 3
In silico modeling of cell position rearrangement of two migrating cells using the faster-slower mode of migration.
Video 4
In silico modeling of cell position rearrangement of two migrating cells using the leader-trailer mode of migration.
Video 5
In silico modeling of cell position rearrangement of three migrating cells using the faster-slower mode of migration.
Video 6
In silico modeling of cell position rearrangement of three migrating cells using the leader-trailer mode of migration.
Video 7
In vivo conversion of anterior tail muscle (ATM) fate to trunk ventral cell (TVC) by misexpression of Mesp>Rasca, resulting in migration of four cells.
B7.5 lineage. Nuclei are marked with Mesp>H2B::GFP. Epidermal cells are marked with EphB1>hCD4::mCherry. Epidermal marker is used to orient the embryo.
Video 8
In vivo conversion of anterior tail muscle (ATM) fate to trunk ventral cell (TVC) by misexpression of Mesp>Rasca, resulting in migration of four cells.
B7.5 lineage. Cell membranes are marked with Mesp>hCD4::GFP. Epidermal cells are marked with EphB1>hCD4::mCherry. Epidermal marker is used to orient the embryo.
Video 9
In vivo migration of a control trunk ventral cell (TVC) pair.
Nuclei are marked with Mesp>H2B::GFP. Epidermal cells are marked with EphB1>hCD4::mCherry. Epidermal marker is used to orient the embryo. Track traces the path of the nucleus centroid during migration.
Video 10
In vivo migration of a single trunk ventral cell (TVC), produced by misexpression of Foxf >Sar1dn.
Nuclei are marked with Mesp>H2B::mCherry, and cell membranes are marked with Mesp>hCD4::GFP. Epidermal cells are marked with EphB1>hCD4::mCherry. Epidermal marker is used to orient the embryo. Track traces the path of the nucleus centroid during migration.
Tables
Key resources table
| Reagent type (species) or resource | Designation | Source or reference | Identifiers | Additional information |
|---|---|---|---|---|
| Software, algorithm | https://github.com/HaicenYue/3D-simulation-of-TVCs.git | |||
| Genetic reagent (Ciona robusta) | Wild-caught | M-Rep, San Diego,CA | https://www.m-rep.com | |
| Sequence-based reagent | RhoDFca-F | This paper | PCR primers | TGAAACTTGTATTGCGGCCGC |
| Sequence-based reagent | RhoDFca-R | This paper | PCR primers | agacgtacgt GAATTCTCACAATAGC AAACAACAGCAGCAG |
| Sequence-based reagent | iMyo::GFP – F | This paper | PCR primers | ACTTGTATTG CGGCCGCAACCAT GGCCGAGGTGCAGC |
| Sequence-based reagent | iMyo::GFP – R | This paper | PCR Primers | gctgagcgcGAA TTCTTACTTGT ACAGCTCGTCCATGC |
| Recombinant DNA reagent | pCESA: Mesp > hCD4::GFP (plasmid) | PMID:30610187 | B7.5 lineage specific GFP membrane marker | |
| Recombinant DNA reagent | pCESA: Mesp > H2B::GFP (plasmid) | PMID:30610187 | B7.5 lineage specific GFP histone/nuclear marker | |
| Recombinant DNA reagent | pCESA: Mesp > iMyo::GFP (plasmid) | This paper | B7.5 lineage specific GFP myosin intrabody | |
| Recombinant DNA reagent | pCESA: Foxf > mCherry (plasmid) | PMID:30610187 | mCherry TVC-specific marker | |
| Recombinant DNA reagent | pCESA: EfnB > hCD4::mCherry (plasmid) | PMID:30610187 | Epidermal mCherry membrane marker | |
| Recombinant DNA reagent | pCESA: Mesp > 3xmKate2 (plasmid) | PMID:30610187 | B7.5 lineage specific mKate2 marker | |
| Recombinant DNA reagent | pCESA: Nkx2−1> hCD4::GFP (plasmid) | PMID:30610187 | Endoderm specific GFP cell membrane marker | |
| Recombinant DNA reagent | pCESA: Foxf>Sar1dn (plasmid) | PMID:25564651 | TVC-specific dominant negative Sar1 | |
| Recombinant DNA reagent | pCESA: Foxf > Rhodfca (plasmid) | PMID:18535245 | TVC-specific constitutively active RhoD/F | |
| Recombinant DNA reagent | pCESA: Mesp > LacZ (plasmid) | PMID:30610187 | B7.5 lineage specific LacZ loading control | |
| Recombinant DNA reagent | pCESA: Foxf > Intβ1dn (plasmid) | PMID:30610187 | TVC-specific dominant negative Intβ1 | |
| Recombinant DNA reagent | pCESA: Foxf > Rasca (plasmid) | PMID:18535245 | TVC-Specific constituitivley active Ras | |
| Recombinant DNA reagent | pCESA: Foxf > Ddrdn (plasmid) | PMID:30610187 | TVC-specific dominant negative Ddr | |
| Software, algorithm | FIJI | Schindelin et al., 2012 PMID:22743772 | RRID:SCR_002285 | |
| Software, algorithm | Bitplane Imaris | Bitplane Imaris | RRID:SCR_007370 | |
| Software, algorithm | Prism 9 | https://www.graphpad.com/ | RRID:SCR_002798 |
Appendix 1—table 1
Parameterization of cell-shaping forces, cell adhesion, polarization, and endoderm stiffness for single migrating cells and cell pairs.
| Parametername | Standard single | Supracellulardouble | Doublesame | Climbing | |||
|---|---|---|---|---|---|---|---|
| Used in figure | Figure 1B and C | Figures 1B, C, 2B (after polarization), Figure 3D (LT mode), Figure 3G | Figures 1E and 2B (before polarization), Figure 3D (I mode, FS mode) | Figure 2—figure supplement 1 | |||
| 0.1 | 0.1 | 0.1 | 0.2 | ||||
| 905 | 905 | 905 | 905 | ||||
| 0.02 | 0.02 | 0.02 | 0.06 | ||||
| 16 | 16 | 16 | |||||
| 14 | 14 | 14 | 14 | ||||
| 15 | 14 | 40 | |||||
| 160 | 180 | 160 (200 for FS mode in Figure 3D) | 180 | ||||
| 40 | 20 | 40 (50 for FS mode in Figure 3D) | 20 | ||||
| 160 | |||||||
| 70 | 40 (30 for FS mode in Figure 3D) | 300 | |||||
| 66° | 90° | 66° | 90° | ||||
| 90° | 90° | 90° | 90° | ||||
| 90° | 66° | 90° | |||||
| 90° | 90° | 90° | |||||
| With noise | |||||||
| Used in figure | Figure 4A and B | Figure 4A and B | |||||
| 0.005 | 0.005 | ||||||
| 0.1 | |||||||
| 0.1 | 0.1 | ||||||
| With endoderm cells | |||||||
| Used in figure | Figure 5D | Figure 5D | Figure 5D | ||||
| Soft | Stiff | Soft | Stiff | Soft | Stiff | ||
| 0.05 | 0.5 | 0.05 | 0.5 | 0.05 | 0.5 | ||
| 1,000 | 1,000 | 1,000 | 1,000 | 1,000 | 1,000 | ||
| 0.01 | 0.01 | 0.01 | 0.01 | 0.01 | 0.01 | ||
| 0 | 0 | 0 | 0 | 0 | 0 | ||
| 10 | 10 | 16 | 16 | ||||
| All the other s not listed above are 20.The s not listed for the ‘with noise’ and ‘with endoderm’ part are the same as the part without noise or endoderm.in the subscripts of parameter names mean ‘leader,’ ‘trailer,’ ‘endoderm,’ and ‘substrate,’ respectively.* is as listed in equations in the Materials and methods section. | |||||||
Appendix 1—table 2
Parameterization of migration mode of three migrating cells.
| Parametername | Three cells: independent mode and leader-mid-trailer mode | Three cells: faster-slower mode |
|---|---|---|
| Used in figure | Figure 3E | Figure 3E |
| 0.1 | 0.1 | |
| 905 | 905 | |
| 0.02 | 0.02 | |
| 16 | 16 | |
| 15 | 15 | |
| 160 | 170 | |
| 40 | 45 | |
| 160 | 150 | |
| 40 | 40 | |
| 160 | 120 | |
| 40 | 30 | |
| 66° | 66° | |
| 90° | 90° | |
| 66° | 66° | |
| 90° | 90° | |
| 66° | 66° | |
| 90° | 90° | |
| All the other s not listed above are 20.in the subscripts of parameter names mean ‘leader,’ ‘trailer,’ ‘middle,’ and ‘substrate,’ respectively. | ||
Additional files
Download links
A two-part list of links to download the article, or parts of the article, in various formats.
Downloads (link to download the article as PDF)
Open citations (links to open the citations from this article in various online reference manager services)
Cite this article (links to download the citations from this article in formats compatible with various reference manager tools)
Supracellular organization confers directionality and mechanical potency to migrating pairs of cardiopharyngeal progenitor cells
eLife 10:e70977.
https://doi.org/10.7554/eLife.70977


