Piezo1 ion channels inherently function as independent mechanotransducers
- Department of Neurobiology, Duke University Medical Center, United States
Figures
Figure 1 with 2 supplements
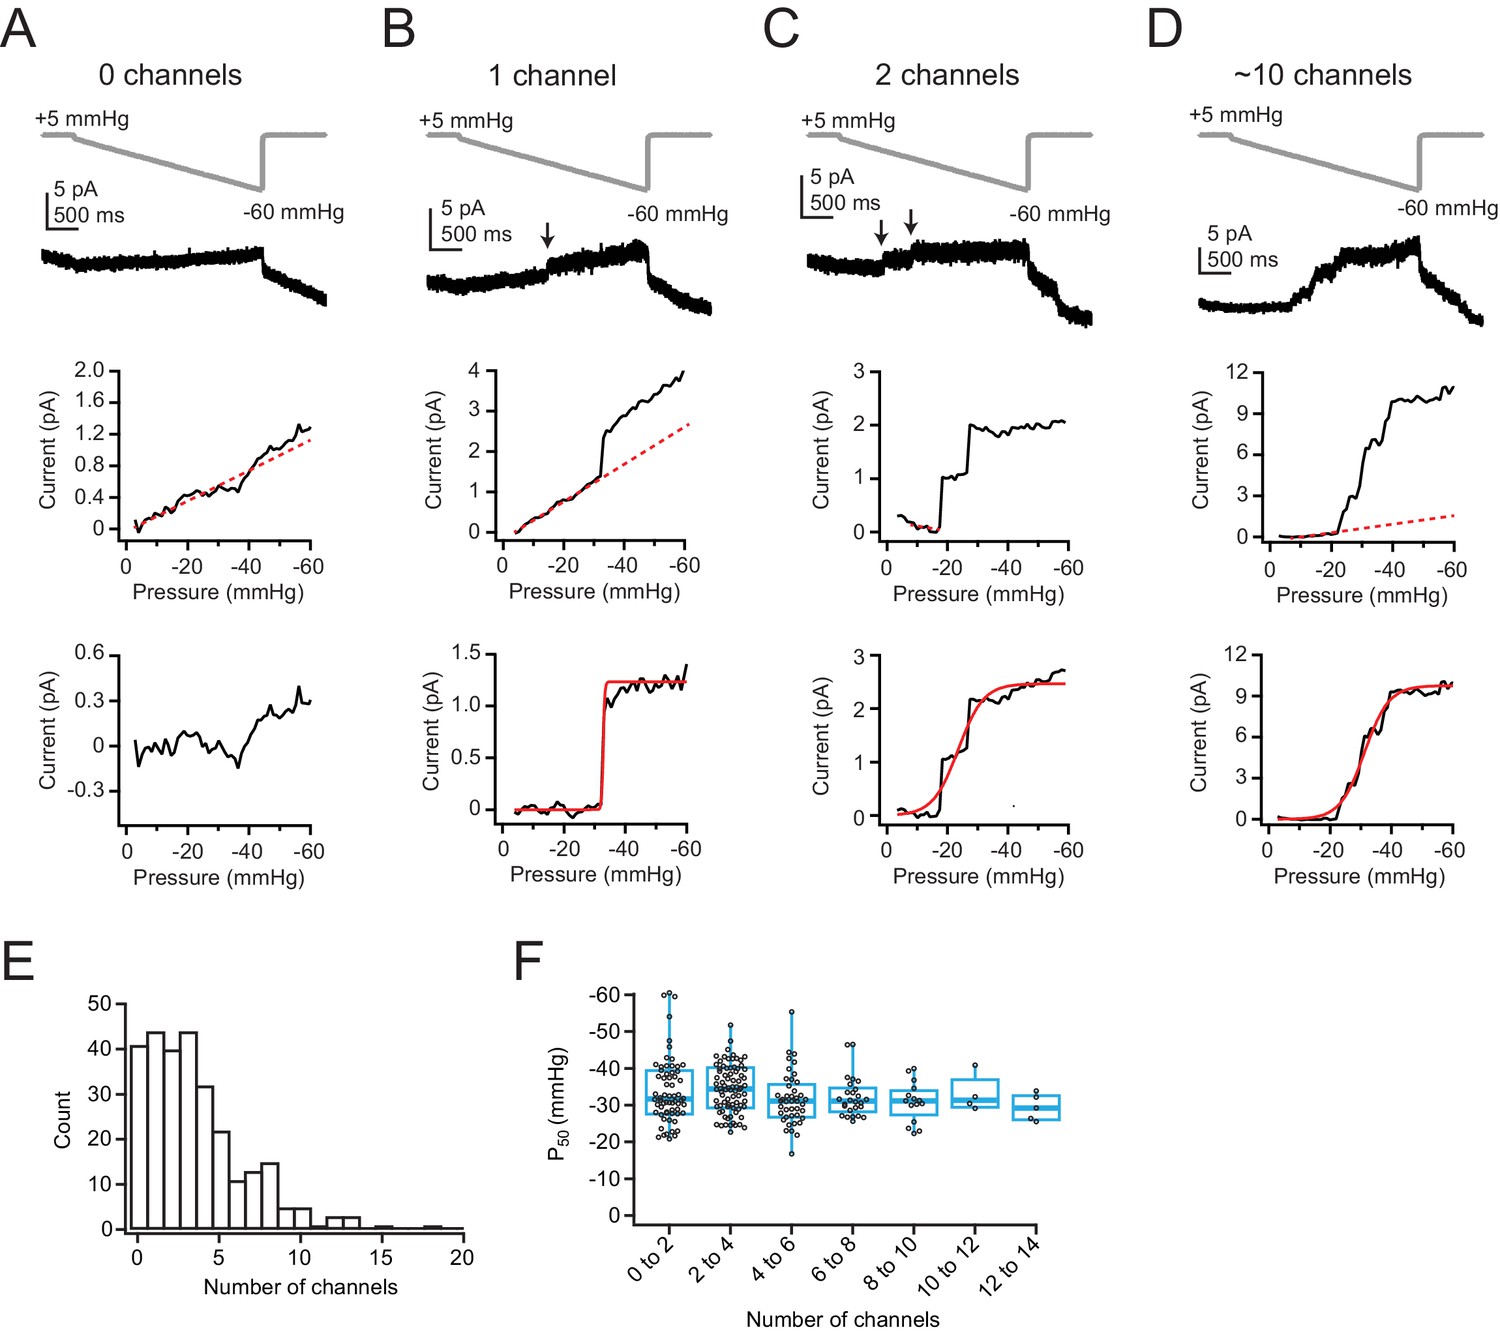
Low levels of Piezo1 expression in Neuro2A cells do not influence pressure sensitivity.
(A) Top, Pressure protocol (gray) and current (black) from a cell-attached patch from Neuro2A cells with zero channels. Holding potential was +60 mV. Middle, Current-pressure relationship for the same patch. Mean current was calculated for each step, in 1 mmHg increments, and plotted as a function of pressure. Note the linear relationship between current and pressure during the step, despite no channel activity in this patch (inferred from the lack of discrete channel opening events). This is likely due to small changes in seal quality and/or capacitance. The linear portion of the current-pressure relationship was fitted with a line (red dashes). Bottom, Current as a function of pressure after subtraction of the current corresponding to the fitted line. (B) As in (A), for a patch with one channel. Arrow indicates discrete channel opening event. Bottom, current was fitted with a Boltzmann equation (see Materials and methods). From the fit (red line), Imax, which corresponds to single-channel current, was 1.2 pA and P50 was –32.8 mmHg. (C) As in (A, B), for a patch with two channels. From the fit (red line), Imax was 2.5 pA and P50 was –23.6 mmHg. (D) As in (A–C), for a patch with many channels. From the fit (red line), Imax was 9.8 pA and P50 was –31.2 mmHg. (E) Histogram of channel number in each patch. n=281 patches. (F) P50 values, measured from sigmoidal fits to currents in (A–D), as a function of channel number. Bin width is two channels. n=281 patches.
-
Figure 1—source data 1
Low levels of Piezo1 expression in Neuro2A cells do not influence pressure sensitivity.
- https://cdn.elifesciences.org/articles/70988/elife-70988-fig1-data1-v1.xlsx
Figure 1—figure supplement 1
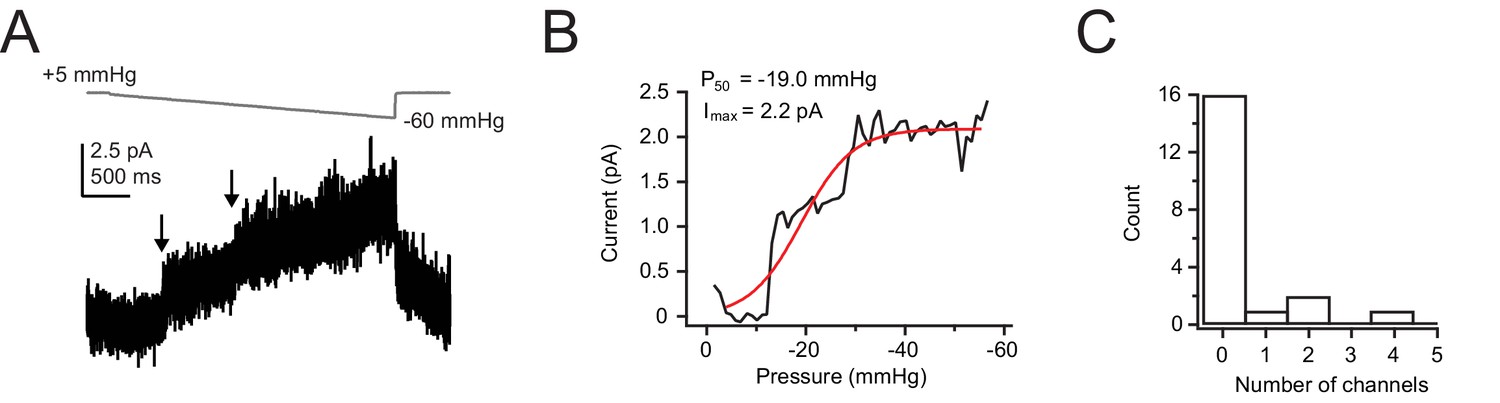
HUVECs express low levels of Piezo1.
(A) Pressure protocol (gray) and current (black) from a cell-attached patch from a wild-type HUVEC cell. Pressure was increased stepwise from +5 mmHg to −60 mmHg in 1 mmHg steps, 50 ms per step. Pressure was clamped at +5 mmHg for 2 s prior to the step protocol to remove resting tension from the patch. Holding potential was +60 mV to minimize inactivation. (B) Current-pressure relationship for the same patch. Mean current was calculated for each step, in 1 mmHg increments, and plotted as a function of pressure. (C) Histogram of number of channels per patch. n=20 patches. HUVEC, human umbilical vein endothelial cell.
-
Figure 1—figure supplement 1—source data 1
HUVECs express low levels of Piezo1.
HUVEC, human umbilical vein endothelial cell.
- https://cdn.elifesciences.org/articles/70988/elife-70988-fig1-figsupp1-data1-v1.xlsx
Figure 1—figure supplement 2
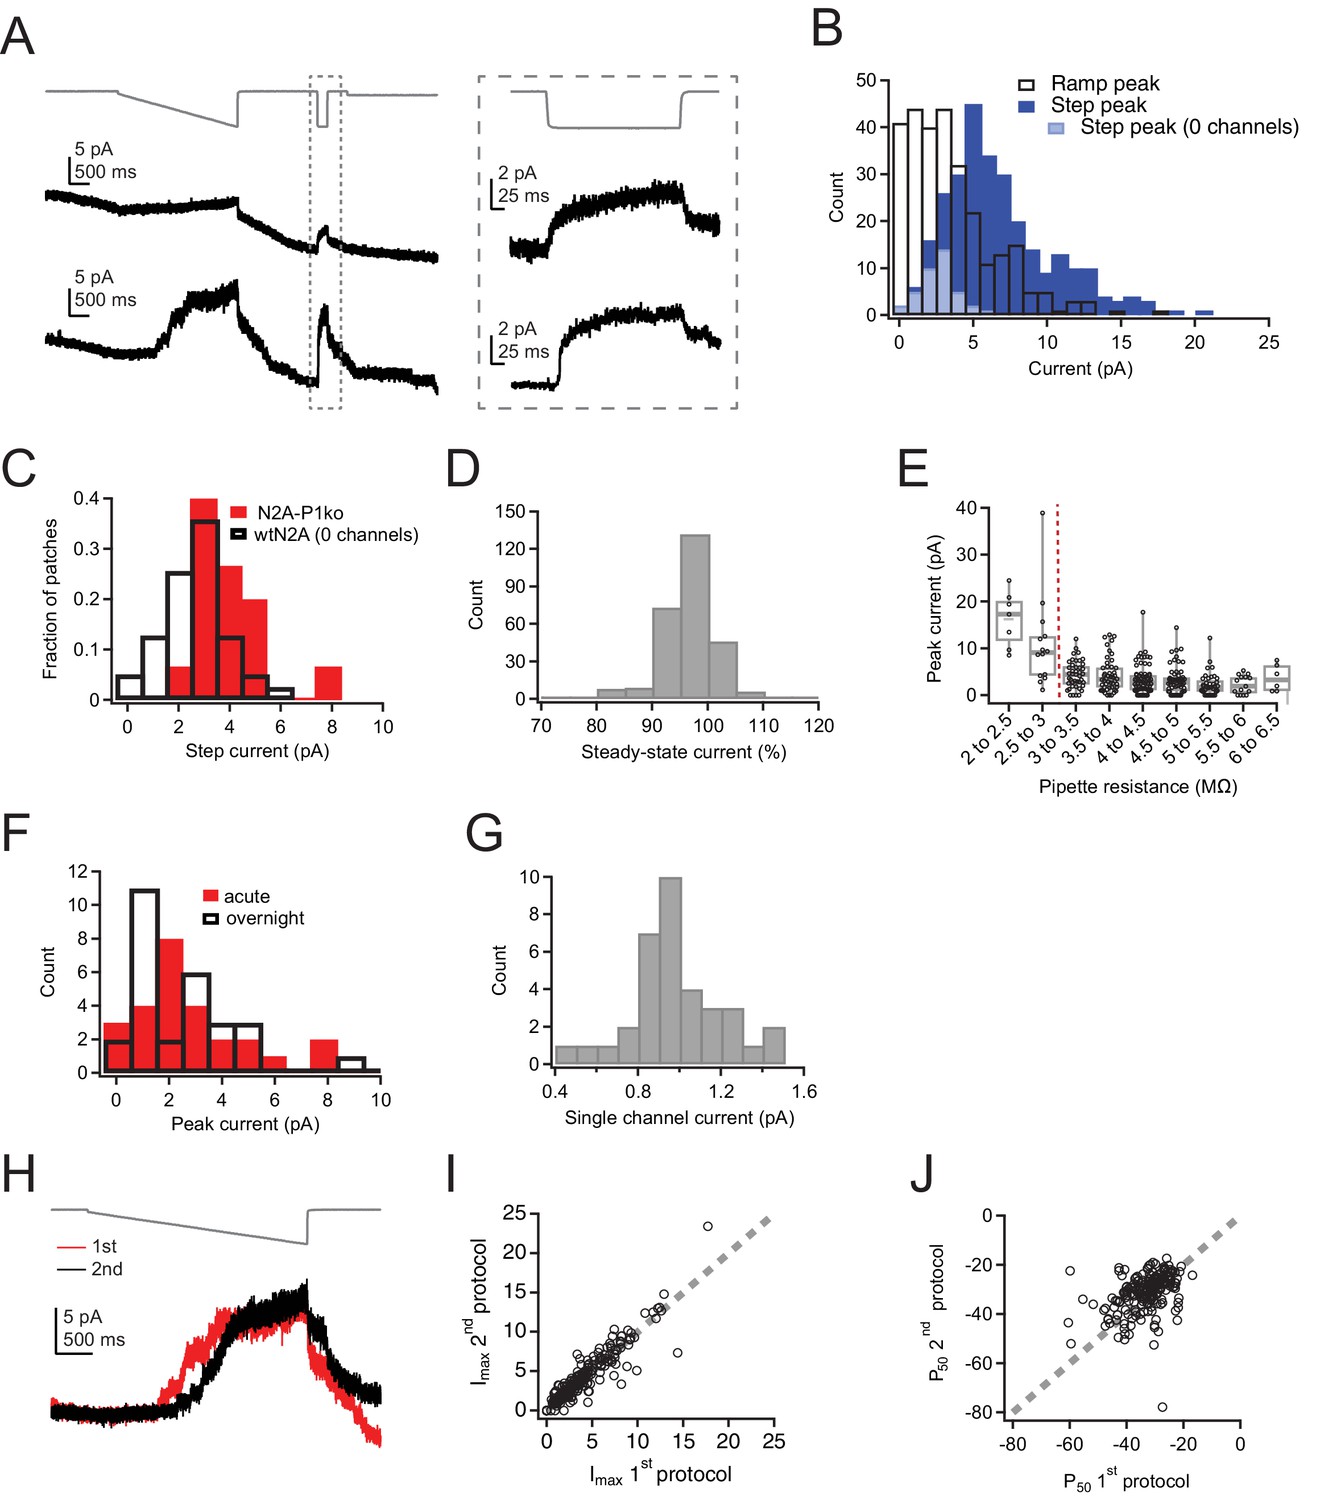
Ramp-like protocol effectively measures Imax in Neuro2A cells.
(A) Pressure protocol (gray) and current (black) from two cell-attached patches from wild-type Neuro2A cells, one with zero channels (top) and one with many channels (bottom). Note the step protocol (inset on the right) elicits a small current in the patch with zero channels, despite no evidence of discrete channel openings during the ramp protocol on the left. (B) Histogram of peak currents elicited by the ramp (black) and step (dark blue) portions of the protocol. Ramp peak currents are leak subtracted according to the protocol in Figure 1; step peak currents are therefore right shifted due to the inability to subtract the leak current. n=281 patches. Light blue, step peak currents for patches with zero channel openings identified during the ramp portion of the protocol (n=33 patches). (C) Normalized histograms for peak current elicited by the step protocol for patches from wild-type Neuro2A cells with zero channels (n=33 patches) and patches from Neuro2A-p1ko cells (n=15 patches). (D) Steady-state current during the step portion of the protocol (Figure 1—figure supplement 2A, inset), calculated as the mean current during the last 10 ms divided by the peak current, smoothed over 0.5 ms. (E) Peak current during the ramp protocol as a function of pipette resistance. Only patches made with pipettes with a resistance of >3 MW (red dashed line) were used in the final analysis. (F) Histogram of peak current amplitudes for acutely plated or day-matched overnight plated wild-type Neuro2A cells (see Materials and methods). Acute, n=26 patches; overnight, n=28 patches. (G) Histogram of single-channel current amplitudes, measured from the Imax values of patches that had precisely one channel. n=35 patches. (H) Pressure protocol (gray) and current for two protocols run successively on the same patch. (I) Imax for the second protocol as a function of Imax for the first protocol from the same patch. Gray dashed line represents unity. (J) P50 values for the second protocol as a function of P50 for the first protocol from the same patch. Gray dashed line represents unity.
-
Figure 1—figure supplement 2—source data 1
Ramp-like protocol effectively measures Imax in Neuro2A cells.
- https://cdn.elifesciences.org/articles/70988/elife-70988-fig1-figsupp2-data1-v1.xlsx
Figure 2

P50 and slope values are identical for Neuro2A patches with 1–5 Piezo1 channels.
(A) Idealized current-pressure relationship for all patches with precisely 1–5 channels. Each patch is a different color/weight; thick black line is the mean open probability for all patches (see Materials and methods). Mean open probability was fit with a sigmoidal relationship (dashed red lines): 1 channel: P50=–23.2 mmHg, k=–3.3 mmHg, n=35 patches. 2 channels: P50=–23.6 mmHg, k=–5.1 mmHg, n=40 patches. 3 channels: P50=–25.9 mmHg, k=–4.5 print mmHg, n=33 patches. 4 channels: P50=–24.9 mmHg, k=–4.0 mmHg, n=27 patches. 5 channels: P50=–23.7 mmHg, k=–4.2 mmHg, n=9 patches. (B) Overlaid mean open probability as a function of pressure for patches with precisely 1, 2, 3, 4, or 5 channels.
-
Figure 2—source data 1
P50 and slope values are identical for Neuro2A patches with 1–5 Piezo1 channels.
- https://cdn.elifesciences.org/articles/70988/elife-70988-fig2-data1-v1.xlsx
Figure 3
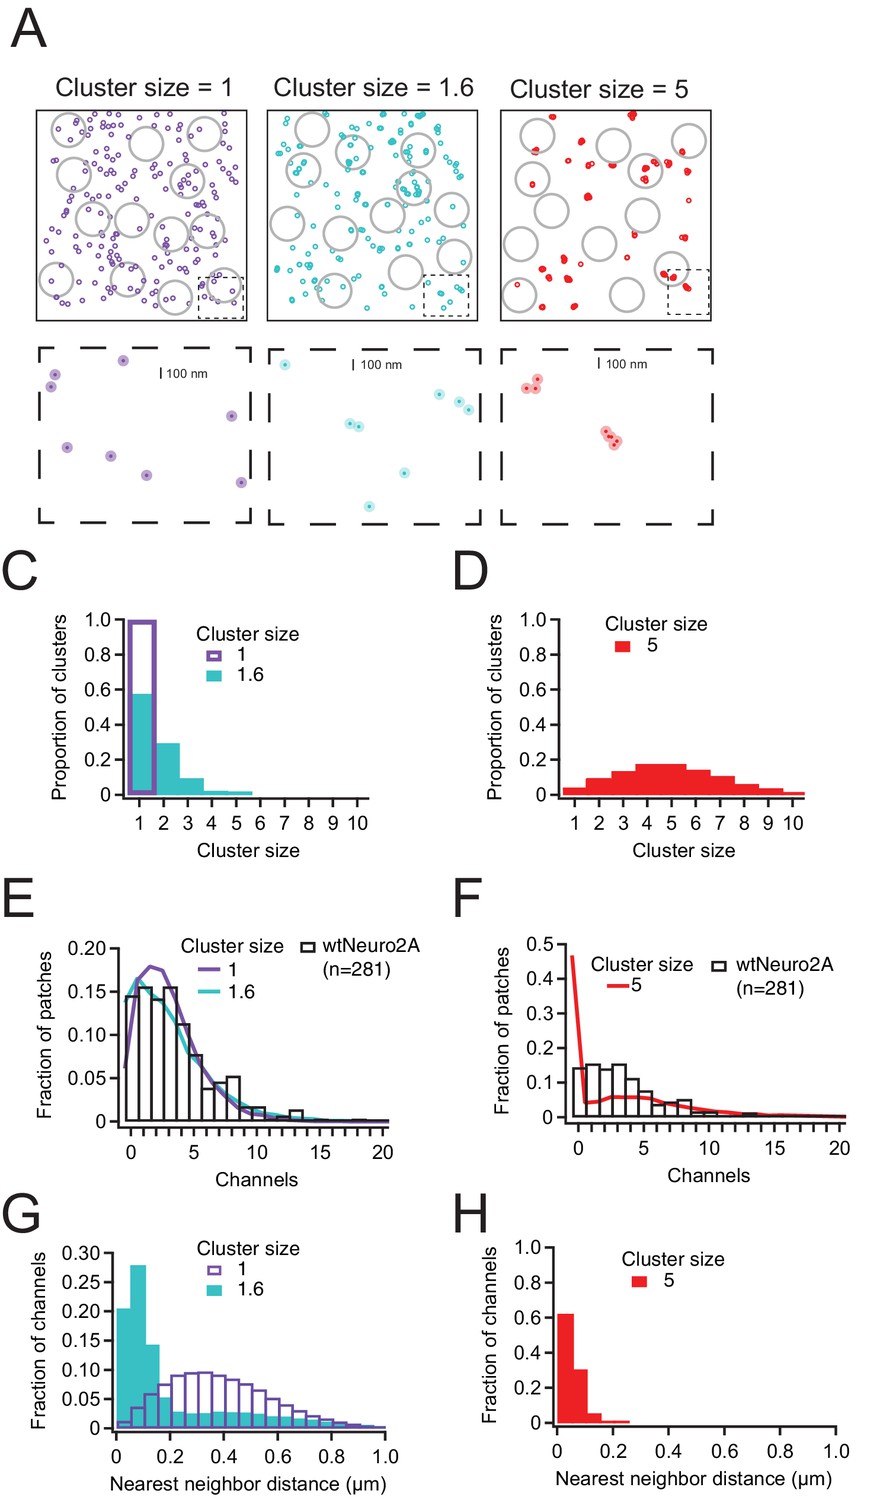
Piezo1 distribution in Neuro2a cells is best explained by little or no clustering of channels.
(A) Representative channel distributions generated using a Thomas point process with overall densities equivalent to that of wild-type Neuro2A cells (~1.75 channels/µm2); in each condition, daughter ‘channels’ are assigned to a center ‘parent’disc, with a mean distance of 50 nm (~1 Piezo footprint) from the center of the disc. Three separate degrees of clustering (cluster size) were introduced; one in which every cluster has precisely one channel, one with a mean of 1.6 channels per cluster, and one with a mean of 5 channels per cluster. Gray circles represent model patch domes used to sample the distributions, with a mean radius of 0.8 µm. Below, insets (dashed boxes) of each distribution; dark circles are the projected area of the Piezo footprint to scale; light circles are ~3× the membrane footprint for each channel (radius=50 nm). (C, D) Distributions of channels per cluster for mean cluster sizes of 1 and 1.6 (C) and 5 (D). (E, F) Normalized histogram of channels per patch for wild-type Neuro2A cells for mean cluster sizes of 1 and 1.6 (E) and 5 (F). (G, H) Histogram of nearest-neighbor distances for mean cluster sizes of 1 and 1.6 (G) and 5 (H).
-
Figure 3—source data 1
Piezo1 distribution in Neuro2a cells is best explained by little or no clustering of channels.
- https://cdn.elifesciences.org/articles/70988/elife-70988-fig3-data1-v1.xlsx
Figure 4 with 4 supplements
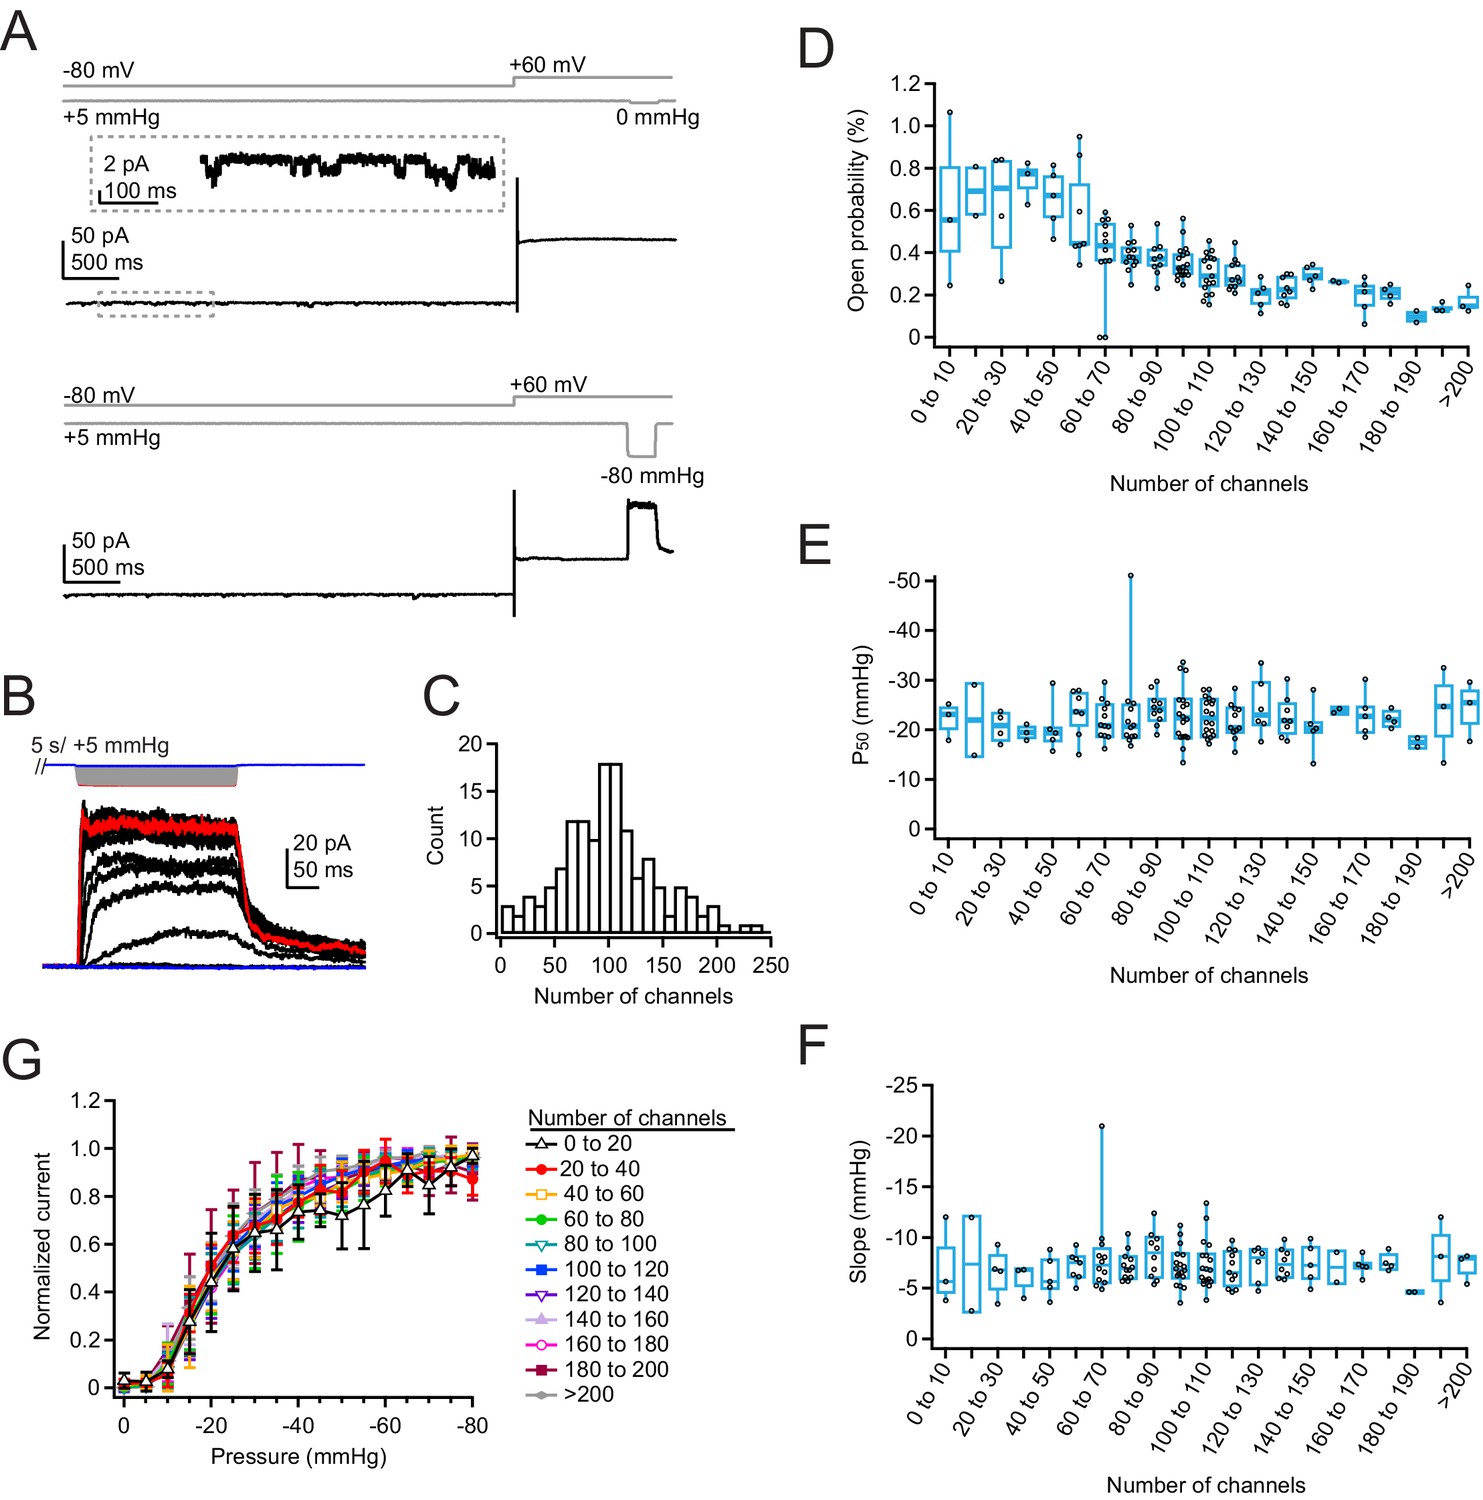
Density of overexpressed Piezo1 channels does not affect resting open probability or pressure sensitivity.
(A) Pressure protocol (gray) and current from a cell-attached patch from a Neuro2A-p1ko cell overexpressing mouse Piezo1. Pressure steps to 0 mmHg (top) and –80 mmHg (bottom) were preceded by a 5 s prepulse to +5 mmHg to relieve resting membrane tension. Top inset shows spontaneous single-channel activity at –80 mV during the prepulse, used to calculate open probability in the nominal absence of tension. (B) Full pressure-response protocol and currents for the cell in (A). Pressure steps were from 0 to –80 mmHg in –5 mmHg increments. (C) Histogram of channel counts, obtained by dividing the peak current elicited during the protocol in (A) by the single-channel current measured from unitary events (see also Figure S5). n=144 patches. (D) Open probability during the +5 mmHg prepulse as a function of number of channels. n=2–18 patches. (E) P50 values measured from sigmoidal fits to current-pressure relationships from the protocol in (B) as a function of number of channels. (F) Slope (k) values measured from sigmoidal fits to current-pressure relationships from the protocol in (B) as a function of the number of channels. (G) Mean pressure-response curves, generated by first normalizing each patch to its maximal current, binning by number of channels, then averaging normalized currents at each pressure. n=2–18 patches.
-
Figure 4—source data 1
Density of overexpressed Piezo1 channels does not affect resting open probability or pressure sensitivity.
- https://cdn.elifesciences.org/articles/70988/elife-70988-fig4-data1-v1.xlsx
Figure 4—figure supplement 1
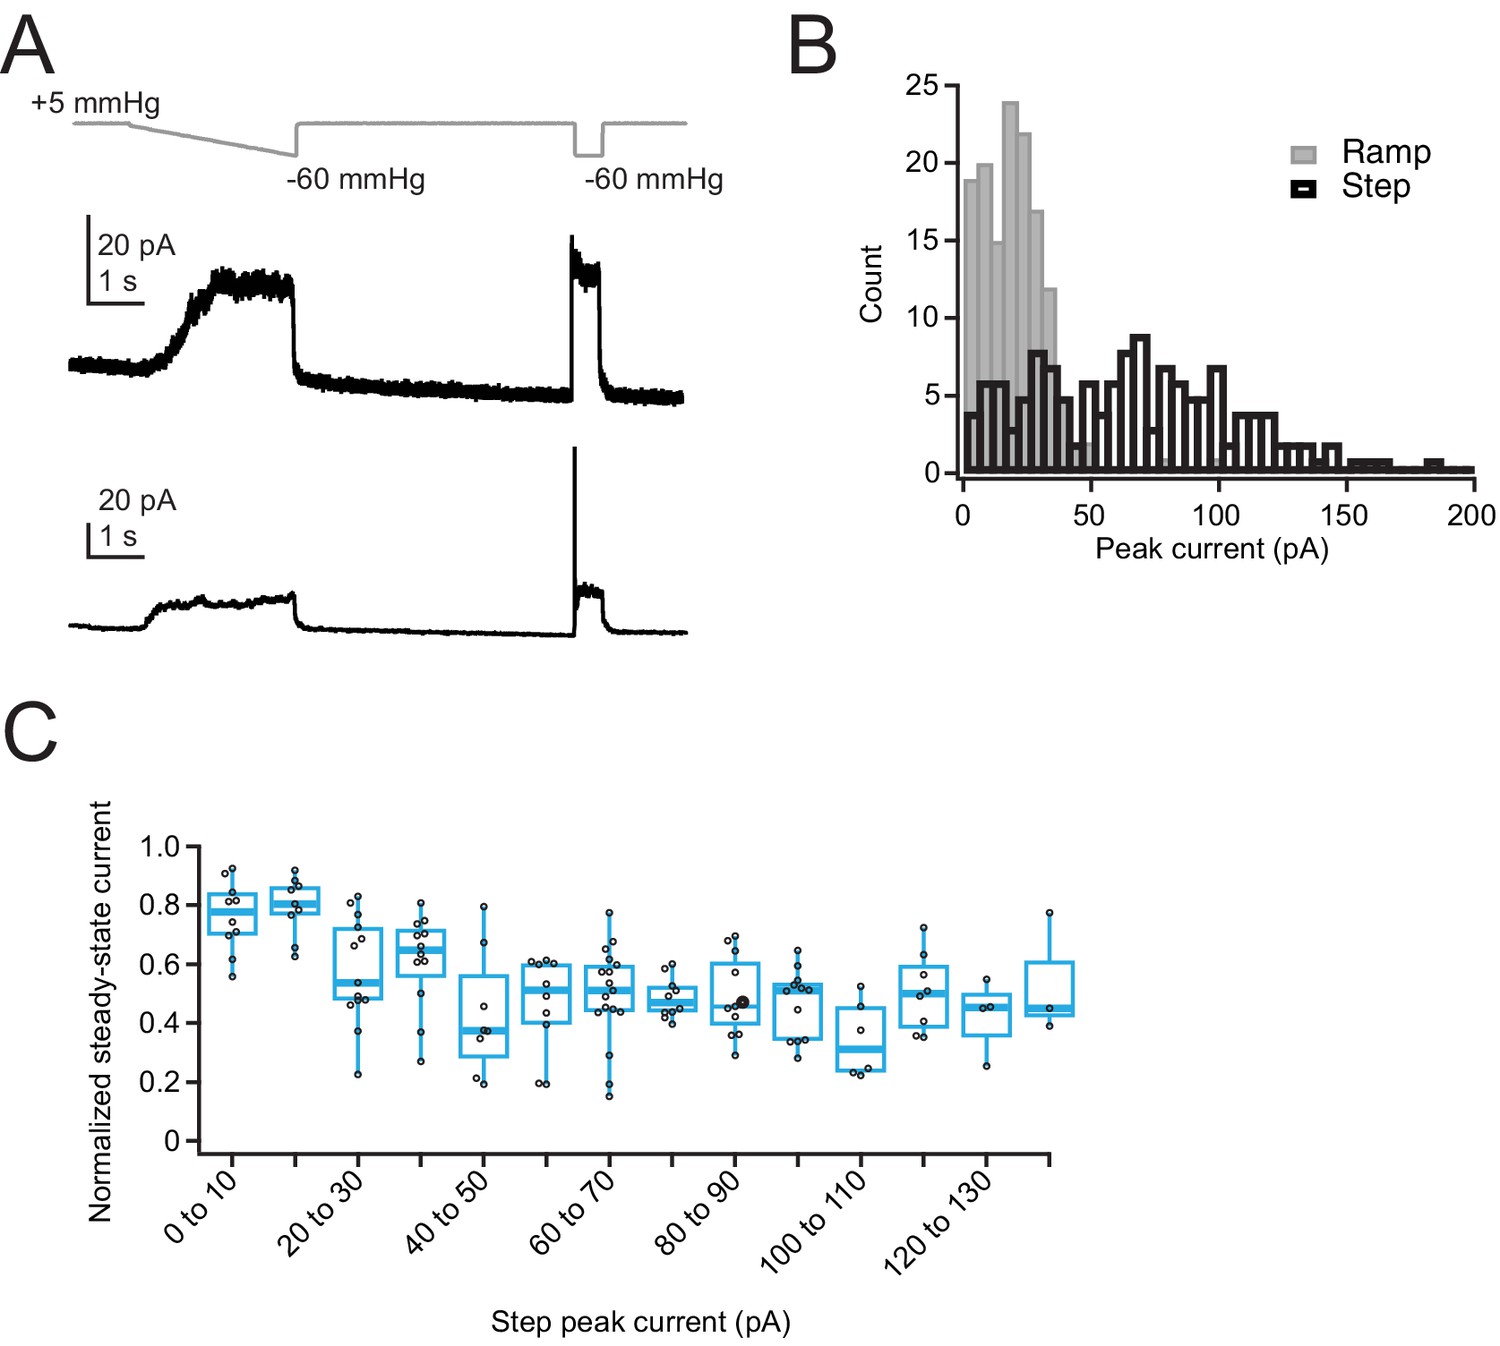
Ramp-like protocol induces substantial inactivation in overexpressed Piezo1 channels.
(A) Pressure protocol (gray) and current (black) from cell-attached patches from two Neuro2A-p1ko cells overexpressing mouse Piezo1. Top patch has minimal inactivation during the step portion of the protocol, bottom patch has substantial inactivation during the step portion of the protocol. (B) Histogram of peak currents elicited by the ramp (gray) and step (black) portions of the protocol. Note that the ramp protocol substantially underestimates the total peak current owing to inactivation. n=138 patches. (C) Normalized steady-state current, measured during the last 10 ms of the step pulse, as a function of peak step current.
-
Figure 4—figure supplement 1—source data 1
Ramp-like protocol induces substantial inactivation in overexpressed Piezo1 channels.
- https://cdn.elifesciences.org/articles/70988/elife-70988-fig4-figsupp1-data1-v1.xlsx
Figure 4—figure supplement 2
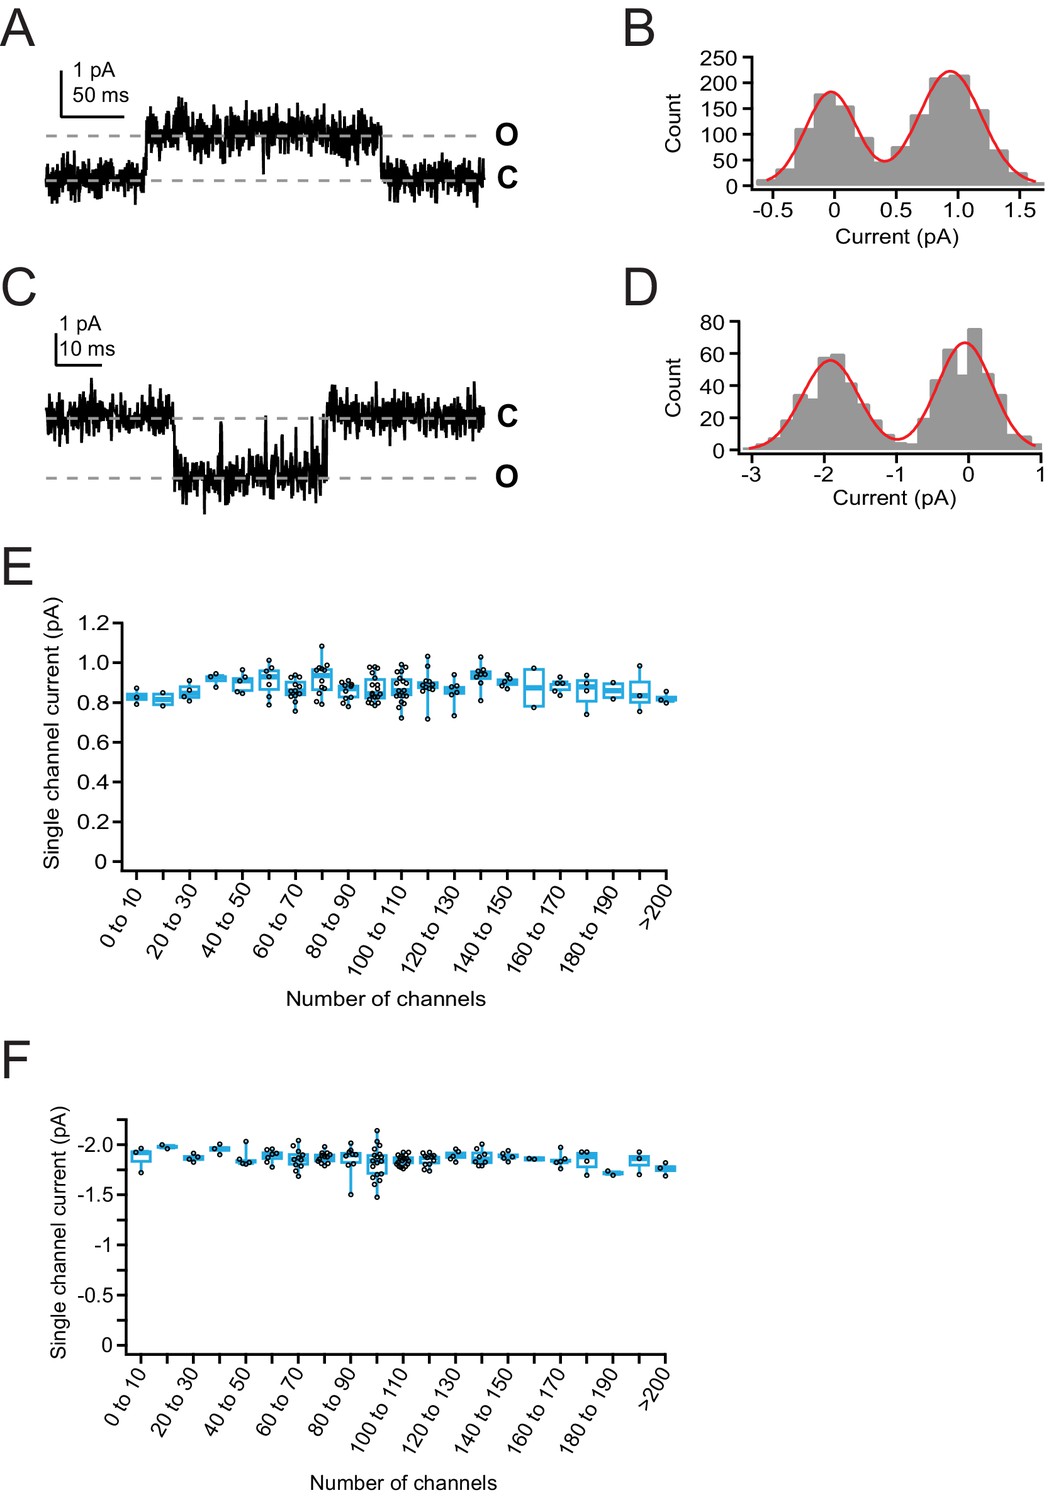
Single-channel current measurements from overexpressed Piezo1.
(A) Single-channel current from a cell-attached patch from a Neuro2A-p1ko cell overexpressing mouse Piezo1. Pressure was +5 mmHg and voltage was +80 mV. (B) All-points histogram generated from current sweep in (A). Red line is a double-Gaussian fit to binned data. (C) Single-channel current from the same patch in (A), at –80 mV. Pressure was +5 mmHg. (D) All-points histogram generated from current sweep in (B). Red line is a double-Gaussian fit to binned data. (E) Single-channel current at +60 mV as a function of number of channels in the patch. n=144 patches. (F) Single-channel current at –80 mV as a function of number of channels in the patch. n=144 patches.
-
Figure 4—figure supplement 2—source data 1
Single-channel current measurements from overexpressed Piezo1.
- https://cdn.elifesciences.org/articles/70988/elife-70988-fig4-figsupp2-data1-v1.xlsx
Figure 4—figure supplement 3
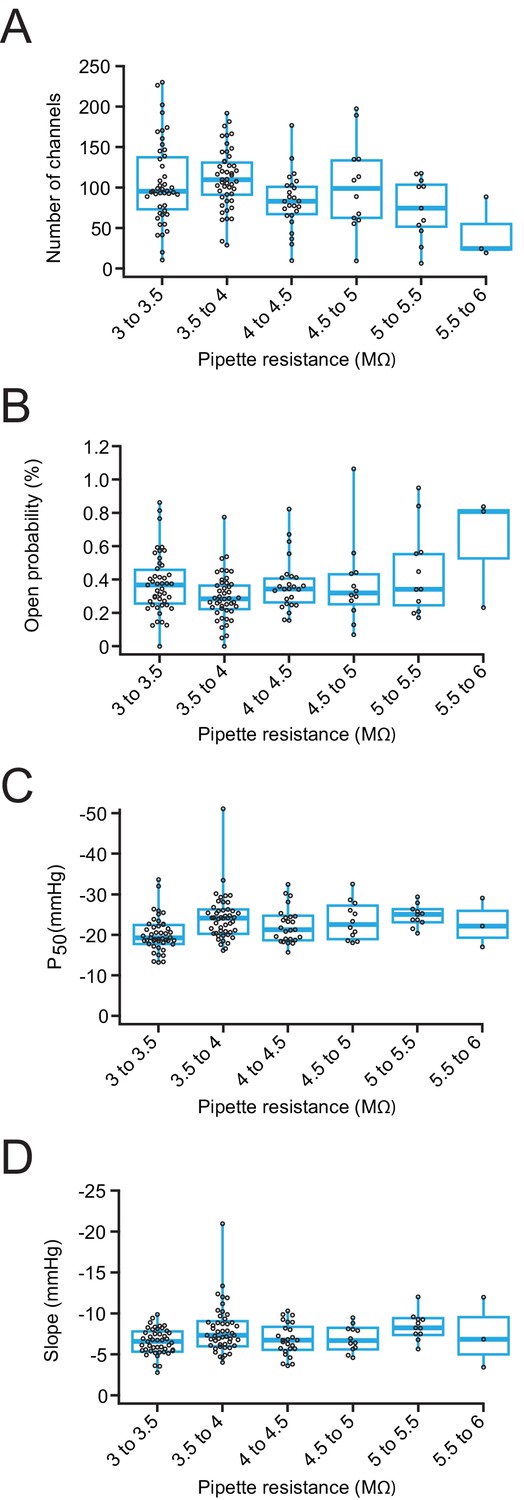
Pipette resistance does not affect Piezo1 open probability or pressure sensitivity.
(A) Number of channels as a function of pipette resistance for patches from Neuro2A-p1ko cells overexpressing mouse Piezo1. (B) Open probability, measured during the –80 mV portion of the +5 mmHg prepulse from the protocol in Figure 5A, as a function of pipette resistance. (C) P50 values measured from sigmoidal fits to current-pressure relationships from the protocol in Figure 5A as a function of pipette resistance. (D) Slope values, measured from sigmoidal fits to current-pressure relationships from the protocol in Figure 5A as a function of pipette resistance. n=144 patches for all panels.
-
Figure 4—figure supplement 3—source data 1
Pipette resistance does not affect Piezo1 open probability or pressure sensitivity.
- https://cdn.elifesciences.org/articles/70988/elife-70988-fig4-figsupp3-data1-v1.xlsx
Figure 4—figure supplement 4
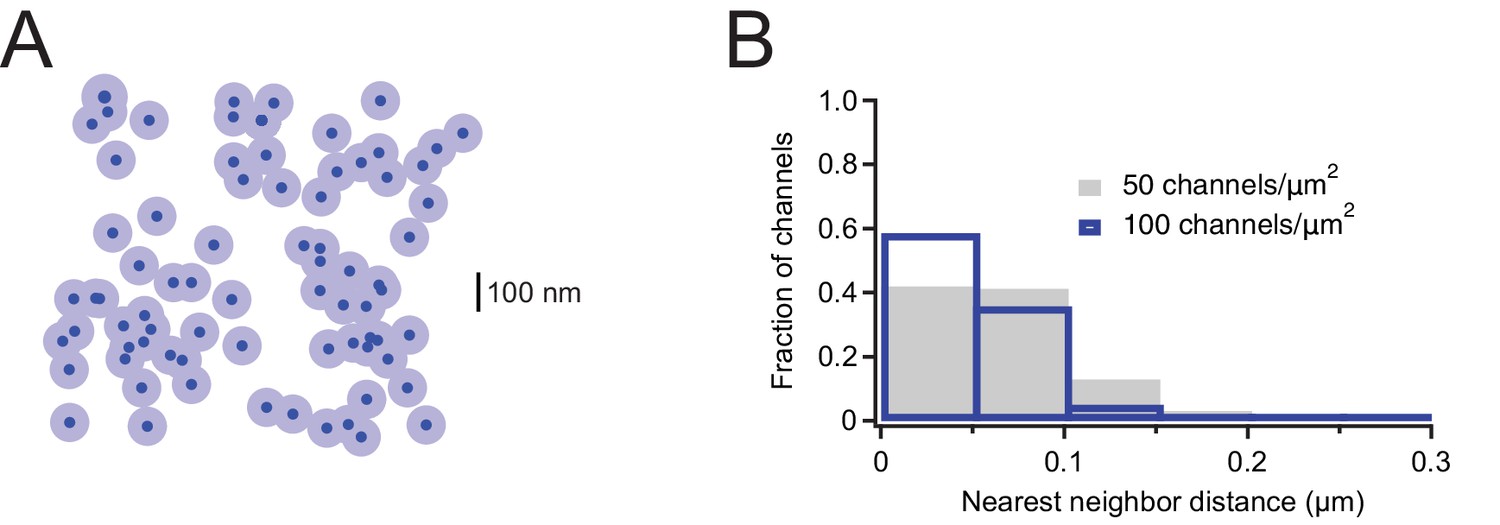
Estimation of nearest-neighbor distances for overexpressed Mouse Piezo1.
(A) Representative channel distribution generated using a Thomas point process with overall densities equivalent to that of the highest density we see with overexpression of mouse Piezo1 in Neuro2A-p1ko cells (~100 channels/µm2). Dark blue circles are the projected area of the Piezo footprint to scale; light blue circles are ~3× the membrane footprint for each channel (radius=50 nm). (B) Histogram of nearest-neighbor distances for densities representing the mean density in our overexpression dataset (~50 channels/µm2) and the maximum density (~100 channels/µm2).
-
Figure 4—figure supplement 4—source data 1
Estimation of nearest-neighbor distances for overexpressed Mouse Piezo1.
- https://cdn.elifesciences.org/articles/70988/elife-70988-fig4-figsupp4-data1-v1.xlsx
Figure 5 with 1 supplement
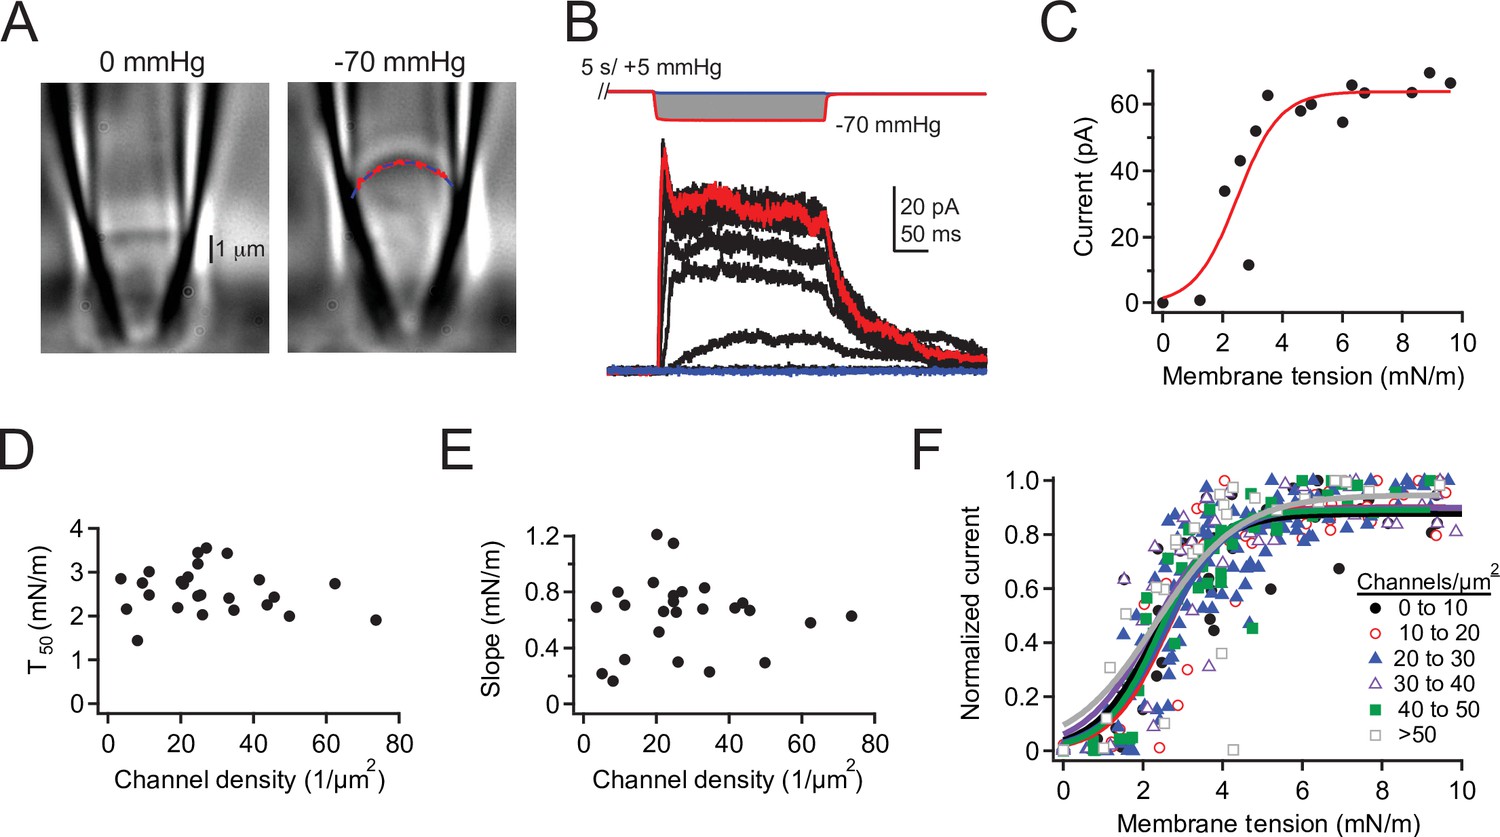
Density of overexpressed Piezo1 channels does not affect tension sensitivity.
(A) DIC image of a cell-attached patch from a Neuro2A-p1ko cell expressing mouse Piezo1 at 0 mmHg (left) and –70 mmHg (right). Red dashed line represents a circle fit to the membrane outline in blue and was used to calculate patch radius (see Materials and methods). (B) Full pressure-response protocol and currents from the patch in (A). Pressure steps were from 0 to –70 mmHg in –5 mmHg increments. (C) Peak current during the pressure step as a function of tension for the patch in (A), calculated from patch radius using Laplace’s law (see Materials and methods). Red line is a sigmoidal fit used to calculate half-maximal tension for activation (T50)and slope (k) using the equation.(D, E) T50 and slope values (k) as a function of channel density. n=25 patches. (F) Mean tension-response curves, generated by first normalizing each patch to its maximal current, binning by channel density, then fitting all data as a function of tension. 0–10 channels: T50=2.3±0.2 mN/m, k=0.8±0.1 mN/m; 10–20 channels: T50=2.6± 0.2 mN/m, k=0.7±0.2 mN/m; 20–30 channels: T50=2.6 ± 0.1 mN/m, k=0.8 ± 0.1 mN/m; 30–40 channels: T50=2.2±0.2 mN/m, k=0.9 ± 0.2 mN/m; 40–50 channels: T50=2.4 ± 0.1 mN/m, k=0.7 ± 0.1 mN/m; >50 channels: T50=2.3±0.4 mN/m, k=1.1±0.4 mN/m. n=2–9 patches. DIC, differential interference contrast.
-
Figure 5—source data 1
Density of overexpressed Piezo1 channels does not affect tension sensitivity.
- https://cdn.elifesciences.org/articles/70988/elife-70988-fig5-data1-v1.xlsx
Figure 5—figure supplement 1

Estimation of patch dome size as a function of pipette resistance.
(A) Surface area as a function of pipette resistance for cell-attached patches from Neuro2A-p1ko cells expressing mouse Piezo1.
-
Figure 5—figure supplement 1—source data 1
Estimation of patch dome size as a function of pipette resistance.
- https://cdn.elifesciences.org/articles/70988/elife-70988-fig5-figsupp1-data1-v1.xlsx
Tables
Key resources table
| Reagent type (species) or resource | Designation | Source or reference | Identifiers | Additional information |
|---|---|---|---|---|
| Cell line (Mus musculus) | Neuro2A | ATCC#CCL-131 | ||
| Cell line (M. musculus) | Neuro2A-p1ko | Gift of Gary Lewin; Moroni et al., 2018 | ||
| Cell line (Homo sapiens) | HUVECS, pooled | Clonetics CC-2519 | ||
| Transfected construct (M. musculus) | Piezo1-IRES-GFP | Gift of Ardem Patapoutian; Coste et al., 2010 |
Additional files
Download links
A two-part list of links to download the article, or parts of the article, in various formats.
Downloads (link to download the article as PDF)
Open citations (links to open the citations from this article in various online reference manager services)
Cite this article (links to download the citations from this article in formats compatible with various reference manager tools)
Piezo1 ion channels inherently function as independent mechanotransducers
eLife 10:e70988.
https://doi.org/10.7554/eLife.70988


