Analysis of meiosis in Pristionchus pacificus reveals plasticity in homolog pairing and synapsis in the nematode lineage
- Department of Molecular and Cell Biology, University of California, Berkeley, United States
- Howard Hughes Medical Institute, United States
- Darwin Tree of Life Project, Wellcome Sanger Institute, United Kingdom
- Department of Energy Joint Genome Institute, United States
- Okinawa Institute of Science and Technology Graduate University, Japan
- Chan Zuckerberg Biohub, United States
- Biological Systems and Engineering Division, Lawrence Berkeley National Laboratory, United States
- California Institute for Quantitative Biosciences, United States
Figures
Figure 1 with 8 supplements

Germline organization and meiotic nuclear morphology in P. pacificus are superficially similar to C. elegans.
(A) Projection image of the distal arm of a P. pacificus hermaphrodite gonad stained with DAPI. Scale bar, 30 μm. Insets show representative nuclei from the premeiotic region (PM), transition zone (TZ), pachytene (Pach), diplotene (Dip), diffuse stage (Diff), and diakinesis. Scale bar, 5 μm. (B) Distal region of a P. pacificus germline following injection of fluorescent nucleotides to label replicating DNA. Scale bar, 30 μm. (C) Metaphase I oocyte expressing CENP-C::V5, stained with anti-V5, DAPI, and anti-tubulin. Scale bar, 10 μm. (D) Mitotic chromosomes (DAPI) in the premeiotic germline of adult hermaphrodites and a 2–4 cell stage embryo and expressing CENP-C::V5 (magenta). Scale bar, 2 μm.
Figure 1—figure supplement 1
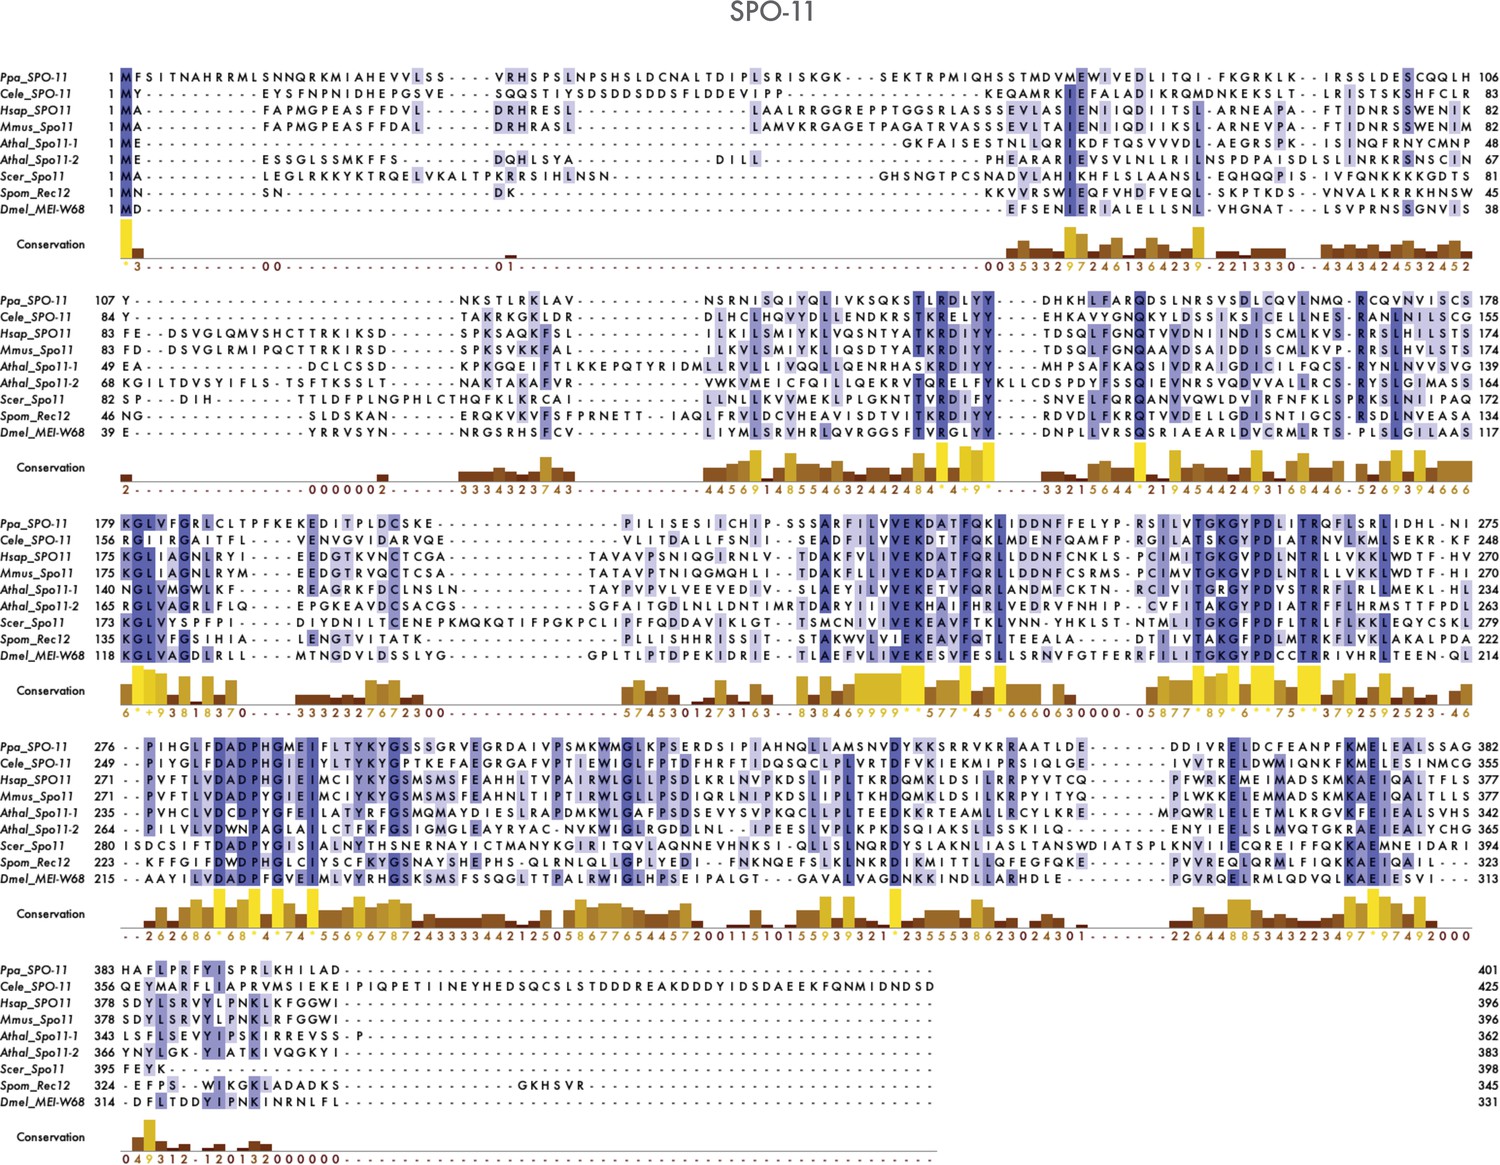
Multiple sequence alignments of homologs of proteins analyzed in this study.
Sequences from species other than nematodes were obtained from Uniprot; nematode sequences were from Wormbase (wormbase.org) and pristionchus.org (see Figure 1—figure supplement 1—source data 1, Figure 1—figure supplement 2—source data 1, Figure 1—figure supplement 3—source data 1, Figure 1—figure supplement 4—source data 1, Figure 1—figure supplement 5—source data 1, Figure 1—figure supplement 6—source data 1, Figure 1—figure supplement 7—source data 1, Figure 1—figure supplement 8—source data 1). For Pristionchus pacificus (Ppa) proteins, ‘El Paco’ gene predictions were refined by our own alignments and in some cases, RNA sequence data. For broadly conserved proteins, homologs from Caenorhabditis elegans (Cele), humans (Hsap), mouse Mus musculus (Mmus), Arabidopsis thaliana (Athal), the budding yeast Saccharomyces cerevisiae (Scer), the fission yeast Schizosaccharomyces pombe (Spom), and, where available, the fruit fly Drosophila melanogaster (Dmel) were included. Recognizable homologs of the meiotic cyclin COSA-1/CNTD-1 are restricted to metazoans and are not found in Drosophila. Homologs of SYP-4 are only found in nematodes, so an expanded group of nematode sequences was included in the alignment, including three Caenorhabditis species, C. elegans (Cele), C. briggsae (Cbri), C. remanei (Crem), plus Haemonchus contortus (Hcon), and Dictyocaulus viviparus (Dviv). Multiple sequence alignments were computed using MAFFT (Katoh et al., 2019) with default settings and displayed using Jalview (Waterhouse et al., 2009).
-
Figure 1—figure supplement 1—source data 1
Amino acid sequences of homologs of SPO-11.
See the figure supplement legend for details.
- https://cdn.elifesciences.org/articles/70990/elife-70990-fig1-figsupp1-data1-v2.docx
Figure 1—figure supplement 2
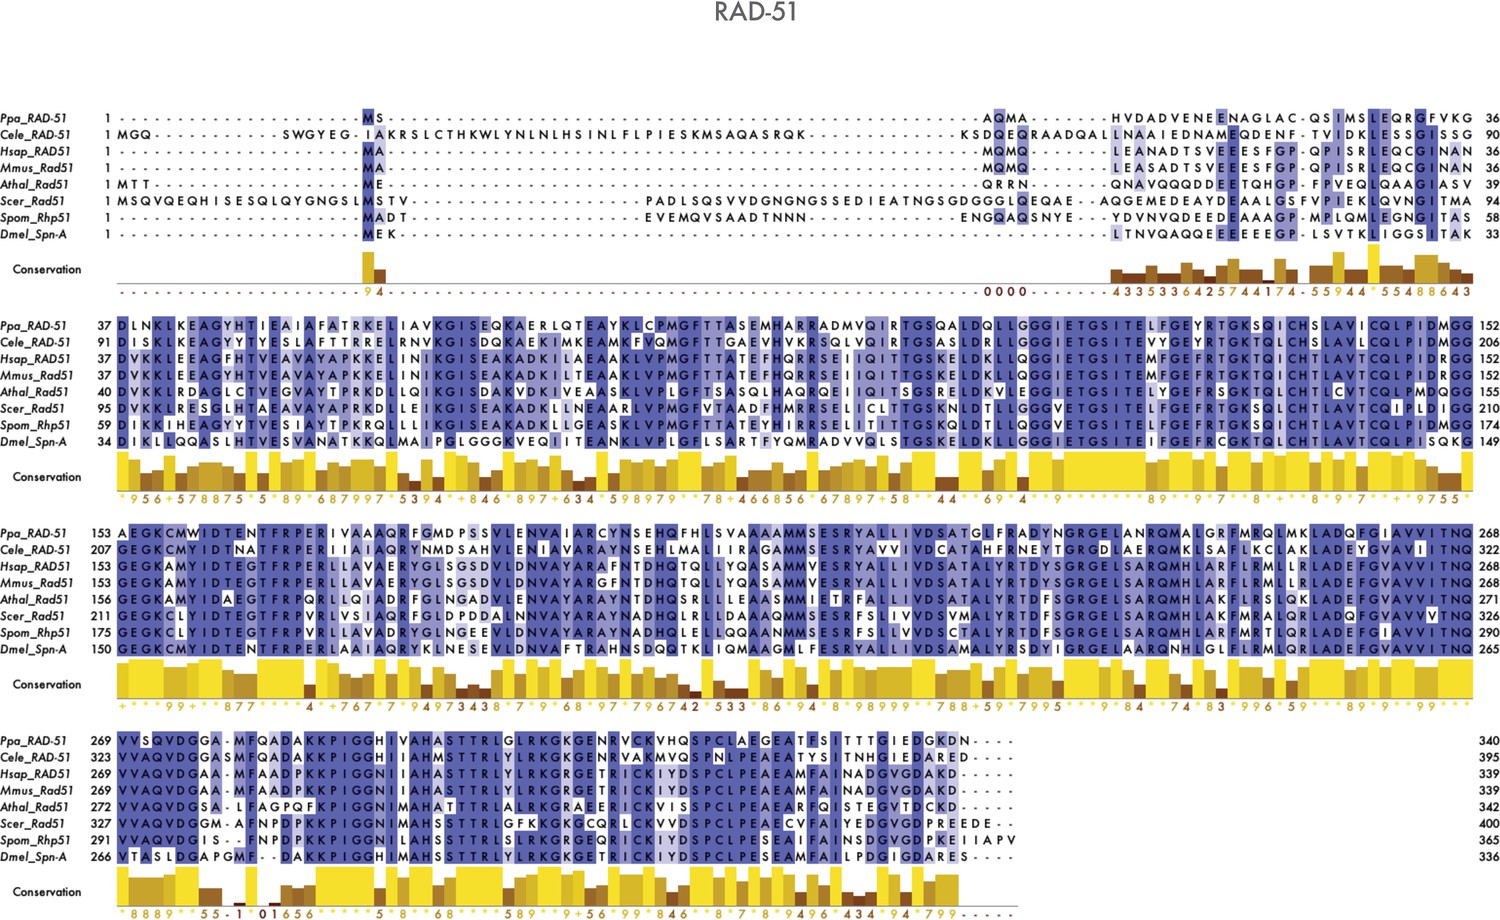
Multiple sequence alignment of Rad51/RAD-51 proteins.
-
Figure 1—figure supplement 2—source data 1
Amino acid sequences of homologs of RAD-51.
See the figure supplement legend for details.
- https://cdn.elifesciences.org/articles/70990/elife-70990-fig1-figsupp2-data1-v2.docx
Figure 1—figure supplement 3
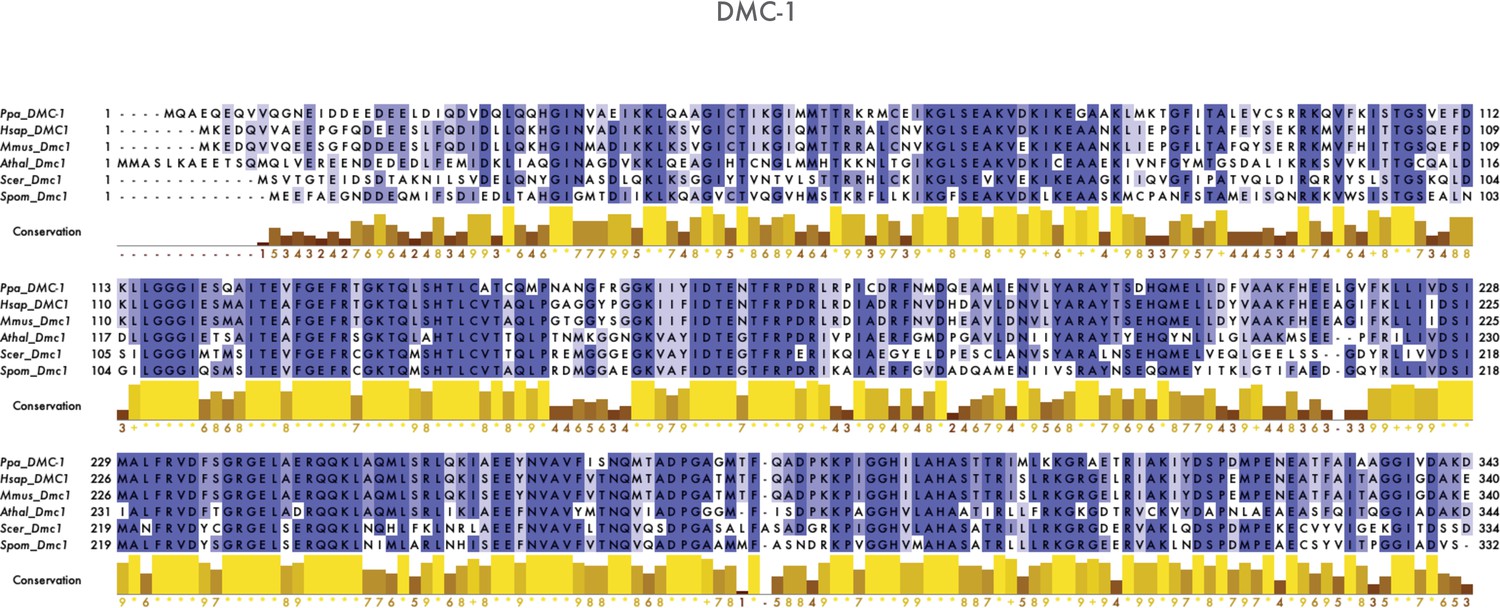
Multiple sequence alignment of Rad51/RAD-51 proteins.
-
Figure 1—figure supplement 3—source data 1
Amino acid sequences of homologs of DMC-1.
See the figure supplement legend for details.
- https://cdn.elifesciences.org/articles/70990/elife-70990-fig1-figsupp3-data1-v2.docx
Figure 1—figure supplement 4
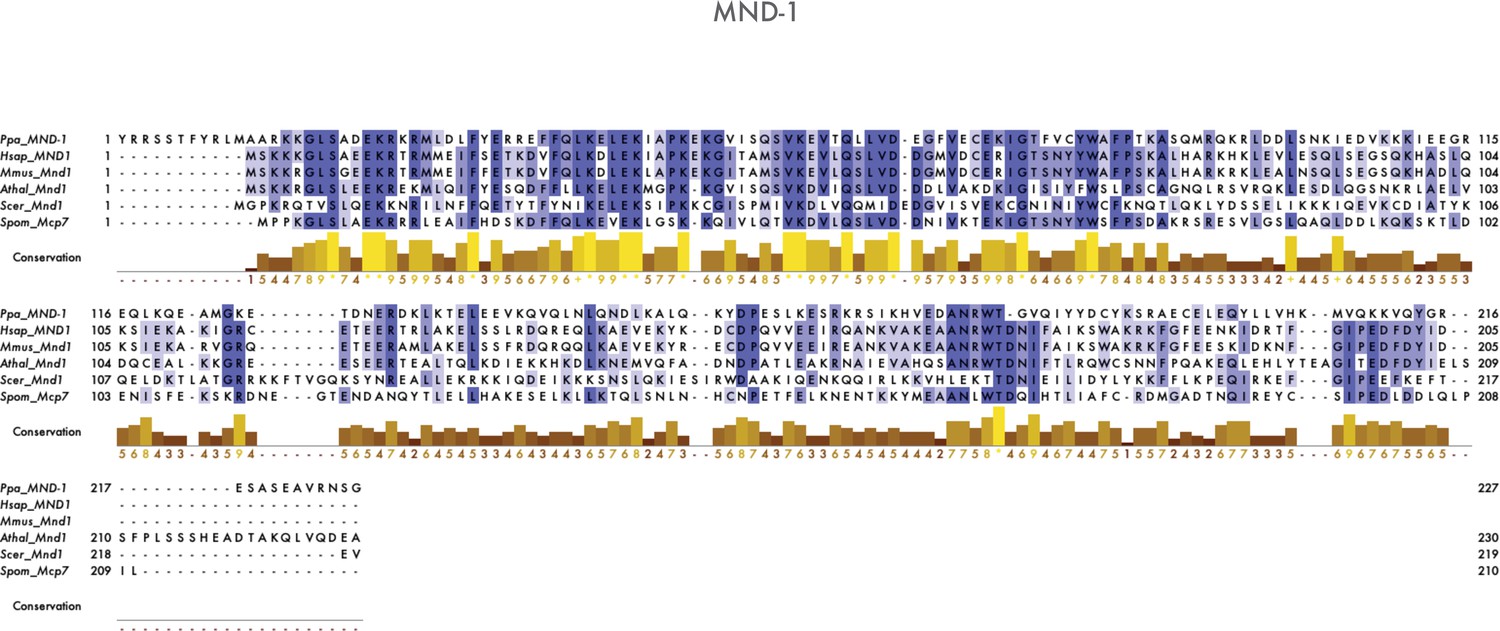
Multiple sequence alignment of Mnd1/MND-1 proteins.
-
Figure 1—figure supplement 4—source data 1
Amino acid sequences of homologs of MND-1.
See the figure supplement legend for details.
- https://cdn.elifesciences.org/articles/70990/elife-70990-fig1-figsupp4-data1-v2.docx
Figure 1—figure supplement 5
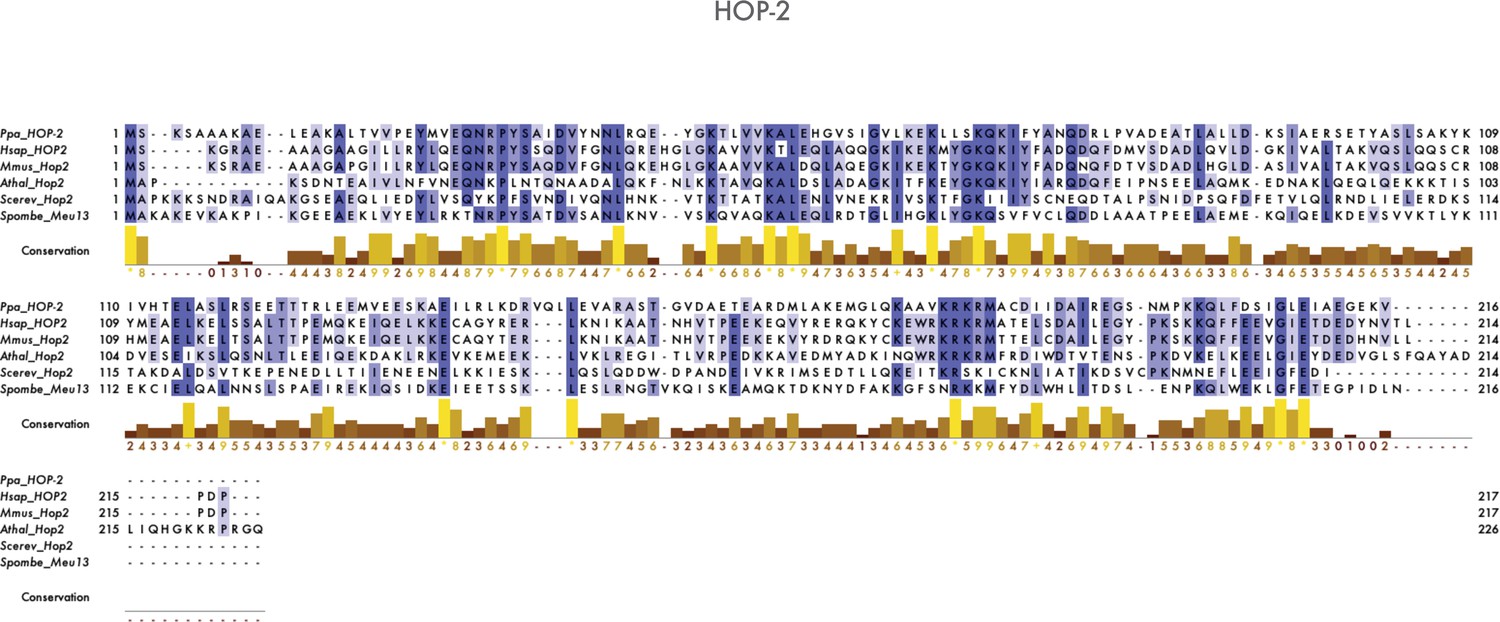
Multiple sequence alignment of Hop2/HOP-2 proteins.
-
Figure 1—figure supplement 5—source data 1
Amino acid sequences of homologs of HOP-2.
See the figure supplement legend for details.
- https://cdn.elifesciences.org/articles/70990/elife-70990-fig1-figsupp5-data1-v2.docx
Figure 1—figure supplement 6
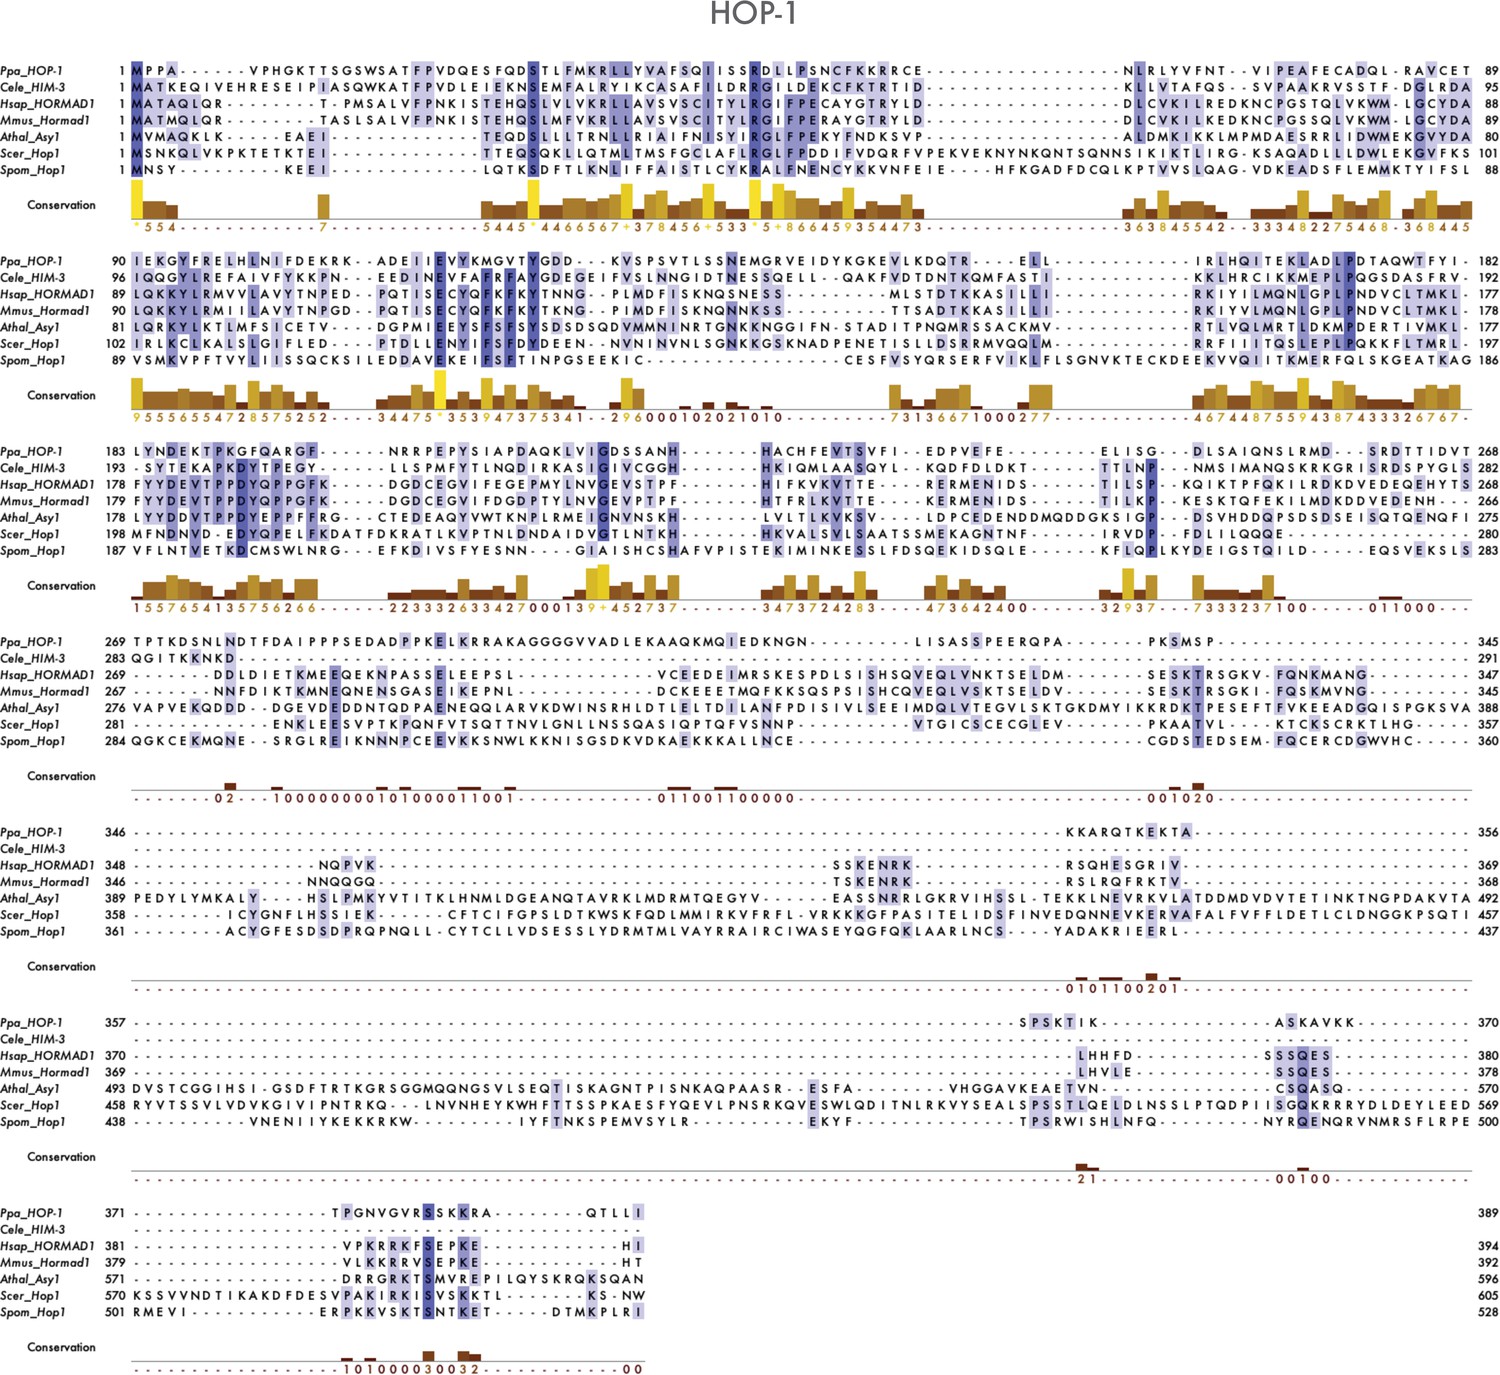
Multiple sequence alignment of meiotic HORMA domain proteins homologous to P. pacificus HOP-1.
-
Figure 1—figure supplement 6—source data 1
Amino acid sequences of homologs of HOP-1.
See the figure supplement legend for details.
- https://cdn.elifesciences.org/articles/70990/elife-70990-fig1-figsupp6-data1-v2.docx
Figure 1—figure supplement 7
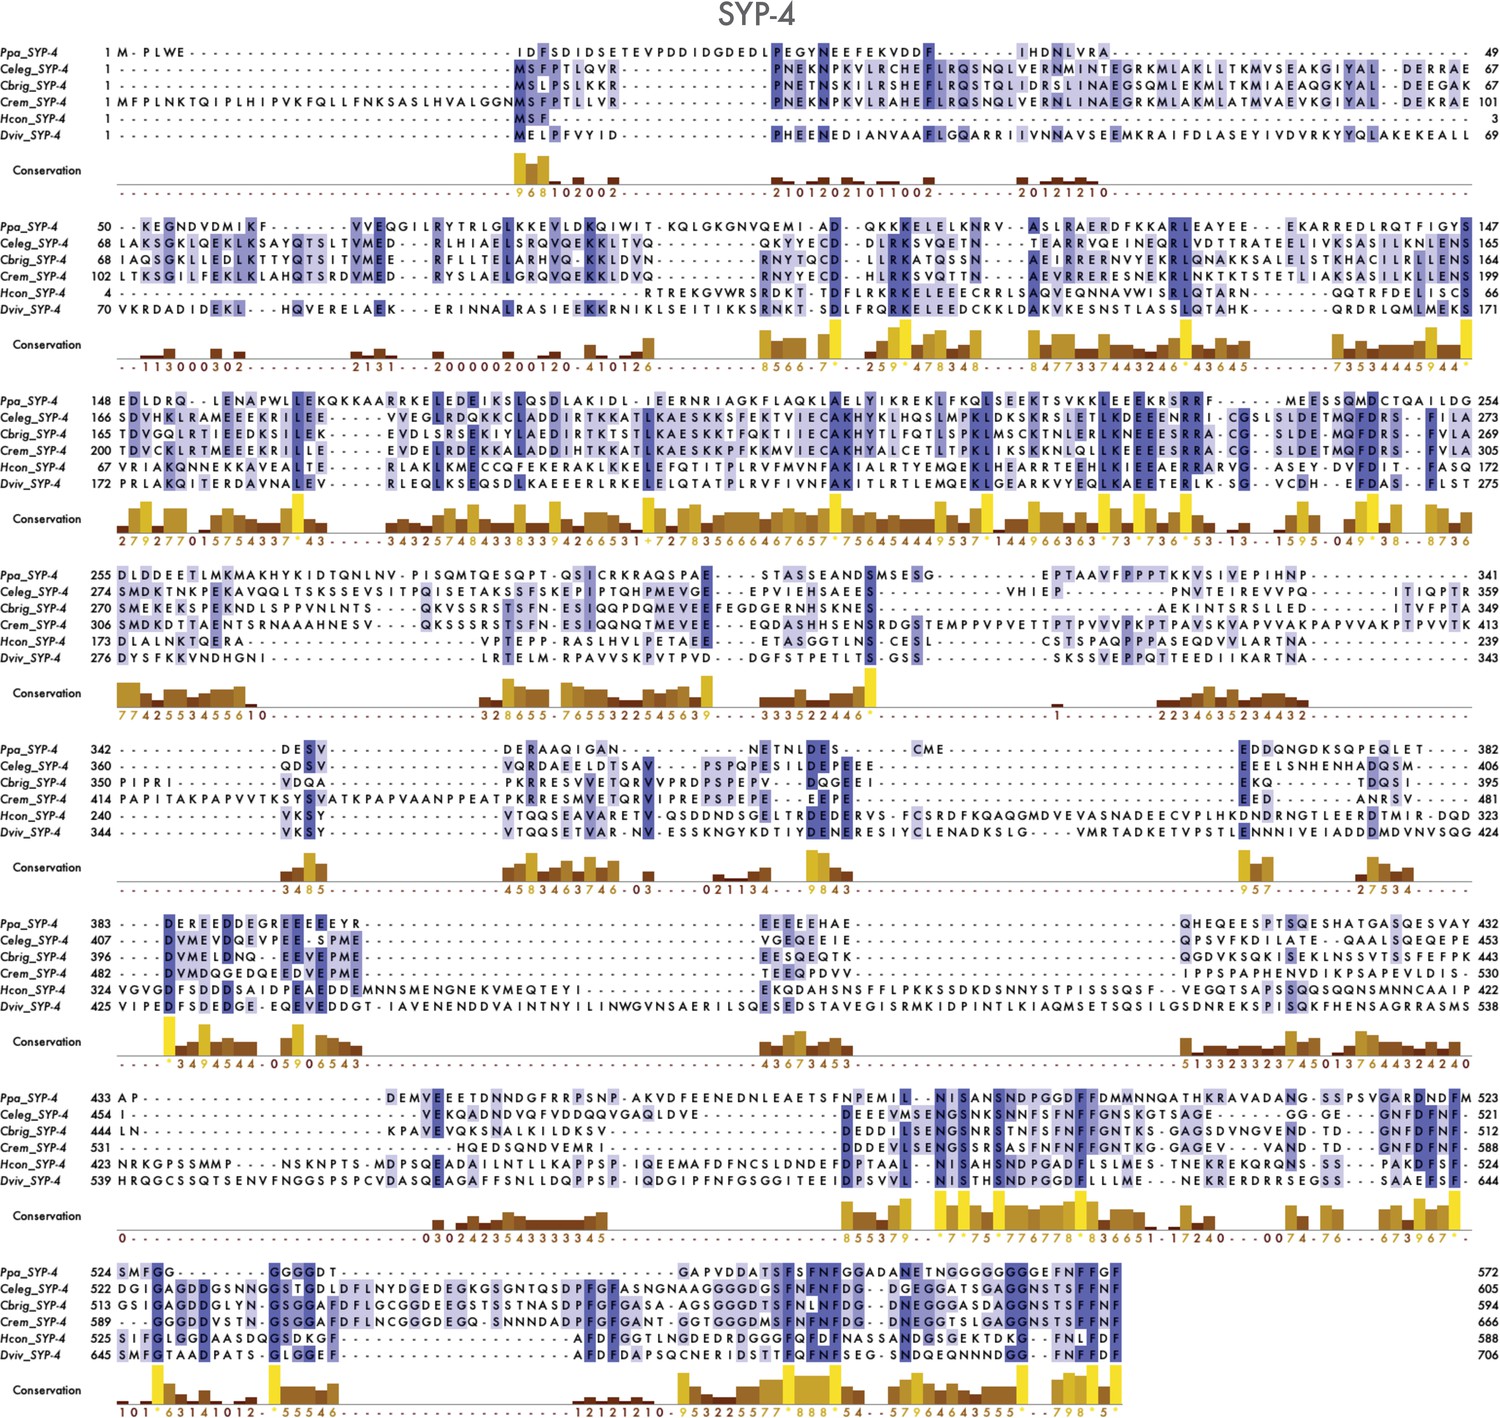
Multiple sequence alignment of SYP-4 homologs from several nematode species.
-
Figure 1—figure supplement 7—source data 1
Amino acid sequences of homologs of SYP-4.
See the figure supplement legend for details.
- https://cdn.elifesciences.org/articles/70990/elife-70990-fig1-figsupp7-data1-v2.docx
Figure 1—figure supplement 8
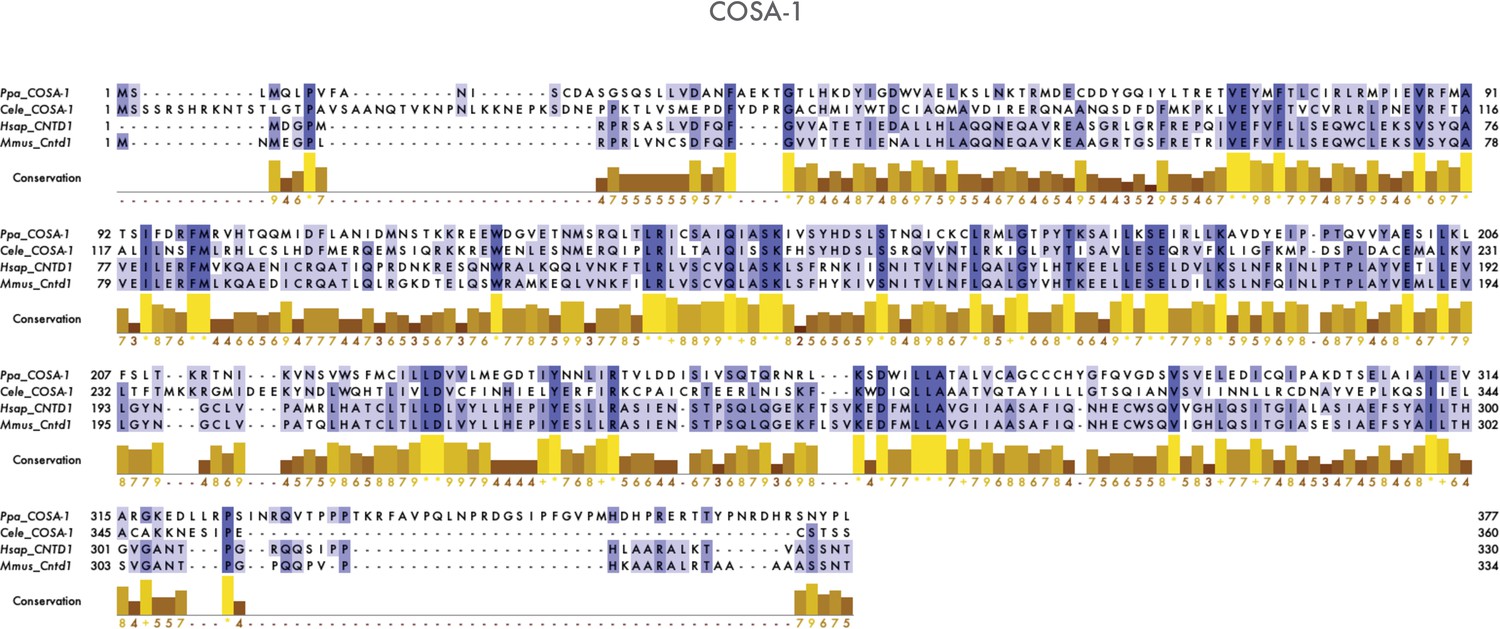
Multiple sequence alignment of COSA-1/Cntd1 proteins from metazoans.
-
Figure 1—figure supplement 8—source data 1
Amino acid sequences of homologs of COSA-1.
See the figure supplement legend for details.
- https://cdn.elifesciences.org/articles/70990/elife-70990-fig1-figsupp8-data1-v2.docx
Figure 2 with 2 supplements
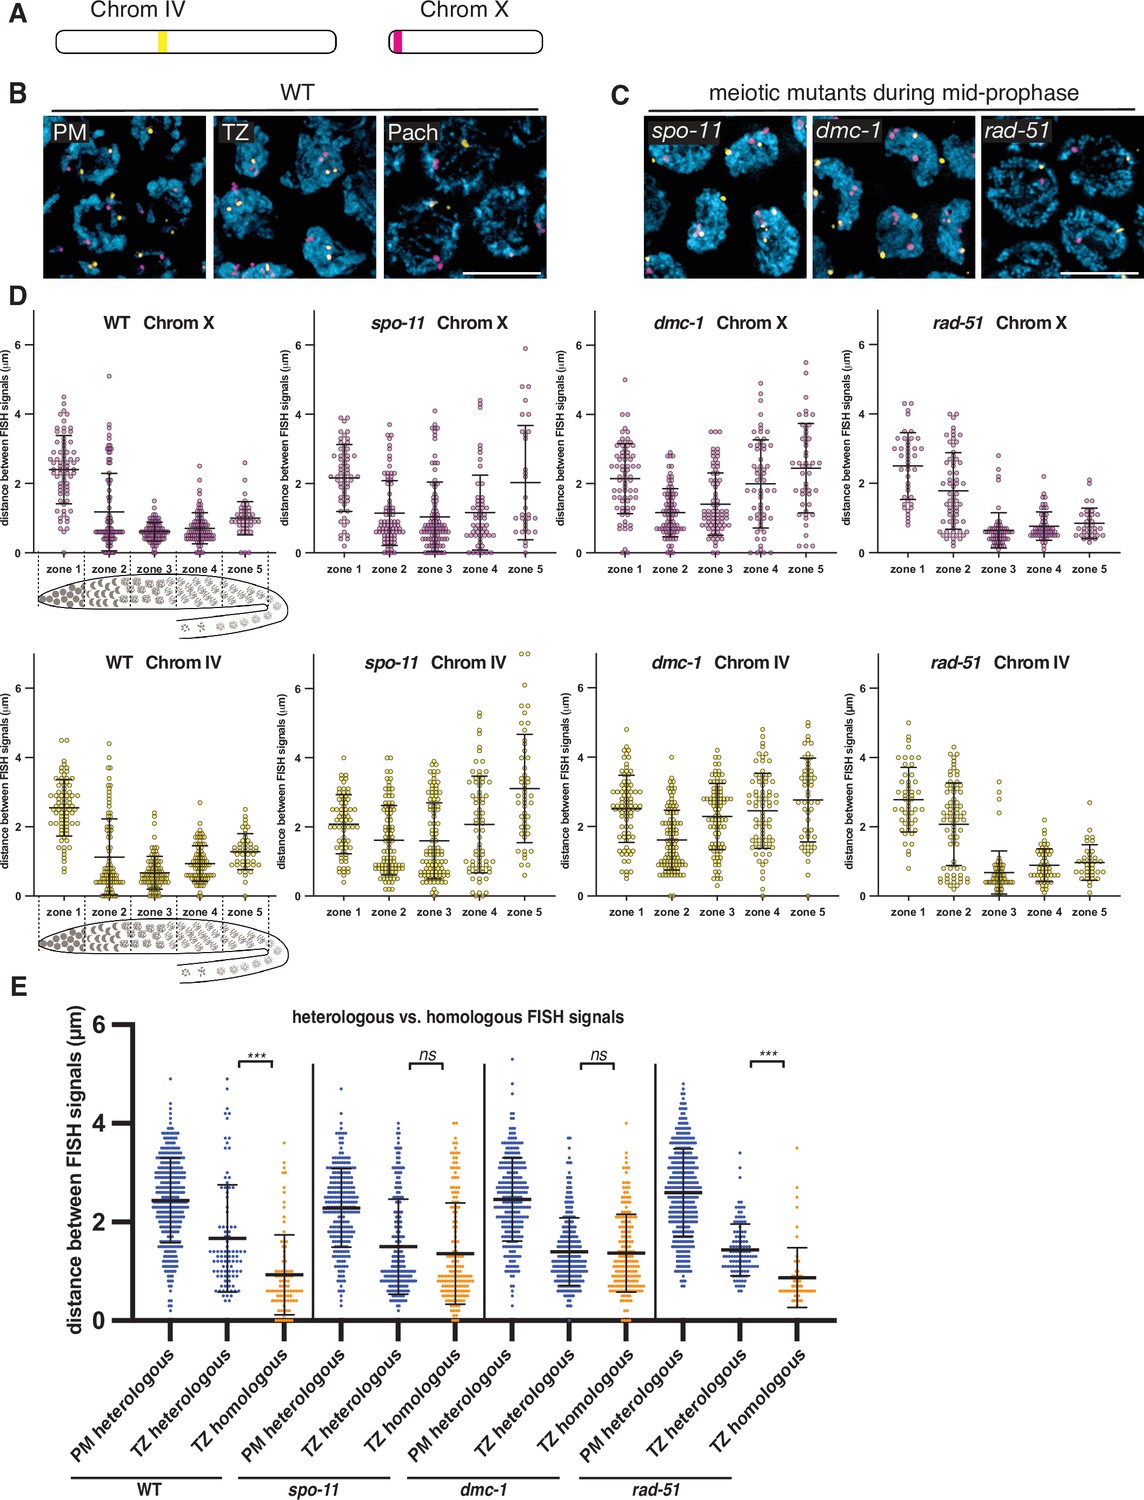
Stable homolog pairing requires double-strand breaks (DSBs) and strand invasion.
(A) Diagram showing the locations of tandem repeat sequences used to generate DNA FISH probes for pairing analysis in P. pacificus. (B) Representative images show the progression of homolog pairing of chromosome X (magenta) and chromosome IV (yellow) during meiotic prophase in wild-type hermaphrodites. Premeiotic region (PM), transition zone (TZ), and pachytene (Pach). Scale bar, 5 μm. (C) Representative images of FISH probe signals in spo-11, dmc-1, and rad-51 mutants during mid-prophase stage (roughly equivalent to the pachytene stage in wild-type germlines). Scale bar, 5 μm. (D) Temporal progression of X and IV chromosome pairing in WT, spo-11, dmc-1, and rad-51 mutants. Graphs show the distribution of distances within each of five equally sized zones spanning meiotic prophase. (E) Distance between pairs of heterologous FISH signals was measured in premeiotic (PM) and transition zone (TZ) nuclei in WT, spo-11, dmc-1, and rad-51 mutants (spanning zones 1 and 2 only). Distances between pairs of homologous FISH signals (Chr. X and IV combined) in TZ nuclei are included for comparison. ***p<0.0001, by Student’s t-test. See also Figure 2—figure supplement 1, Figure 2—figure supplement 2, and Figure 2—source data 1.
-
Figure 2—source data 1
Distances between FISH signals plotted in Figure 2.
- https://cdn.elifesciences.org/articles/70990/elife-70990-fig2-data1-v2.xlsx
Figure 2—figure supplement 1
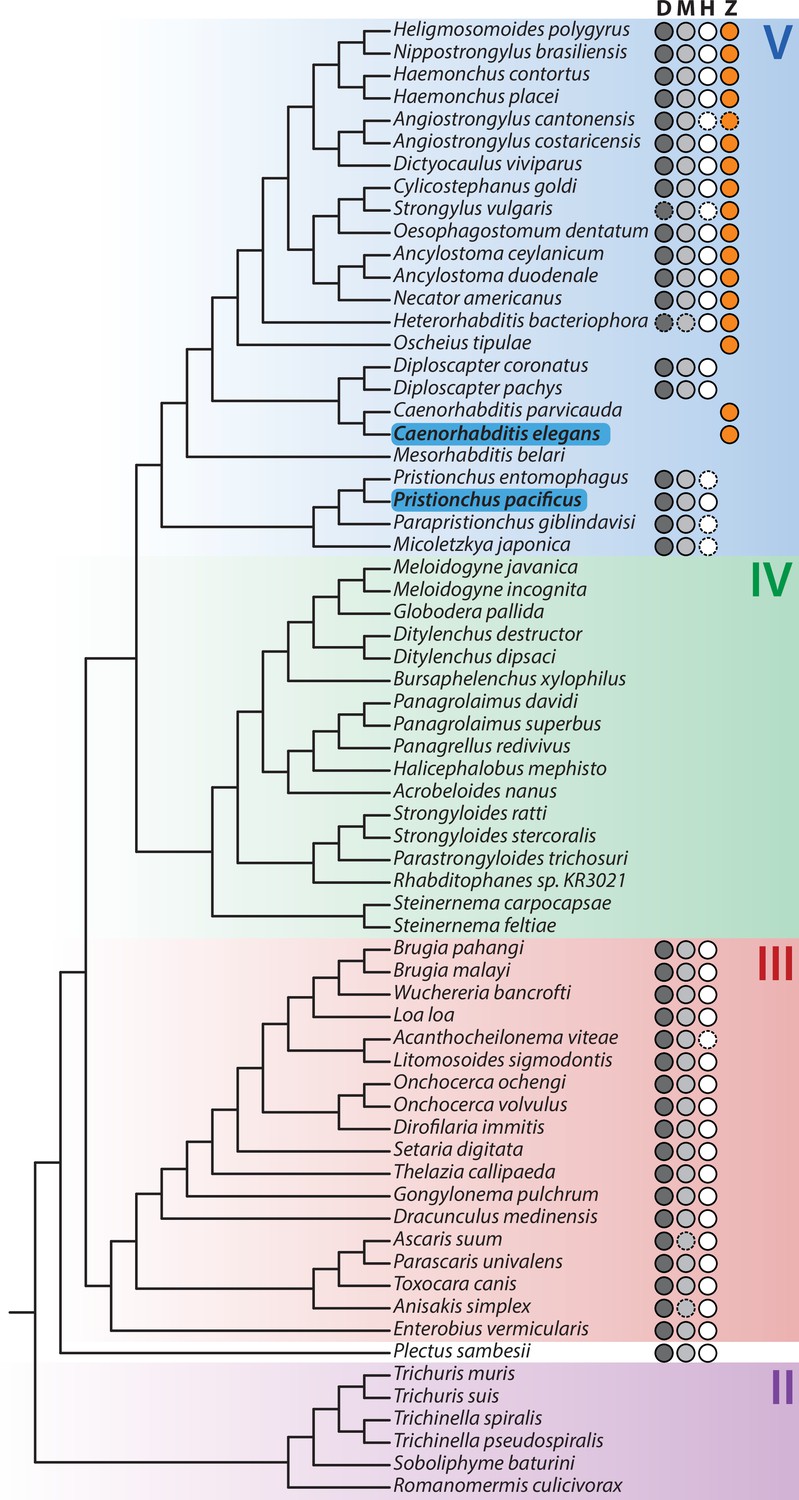
Presence of meiotic pairing proteins across the nematode phylogeny.
D: Dmc1; M: Mnd1; H: Hop2; Z: HIM-8/ZIM-1,2,3. Circles indicate the presence of a homolog; solid outlines indicate homologs identified via orthology clustering; dashed outlines represent evidence of a homolog from TBLASTN searches of the genome sequence. C. elegans and P. pacificus are highlighted in blue. Major nematode clades are highlighted. Phylogeny rooted on two tardigrade species (Hysibius exemplaris and Ramazzottius varieornatus); not shown. Branch lengths are not shown.
Figure 2—figure supplement 2
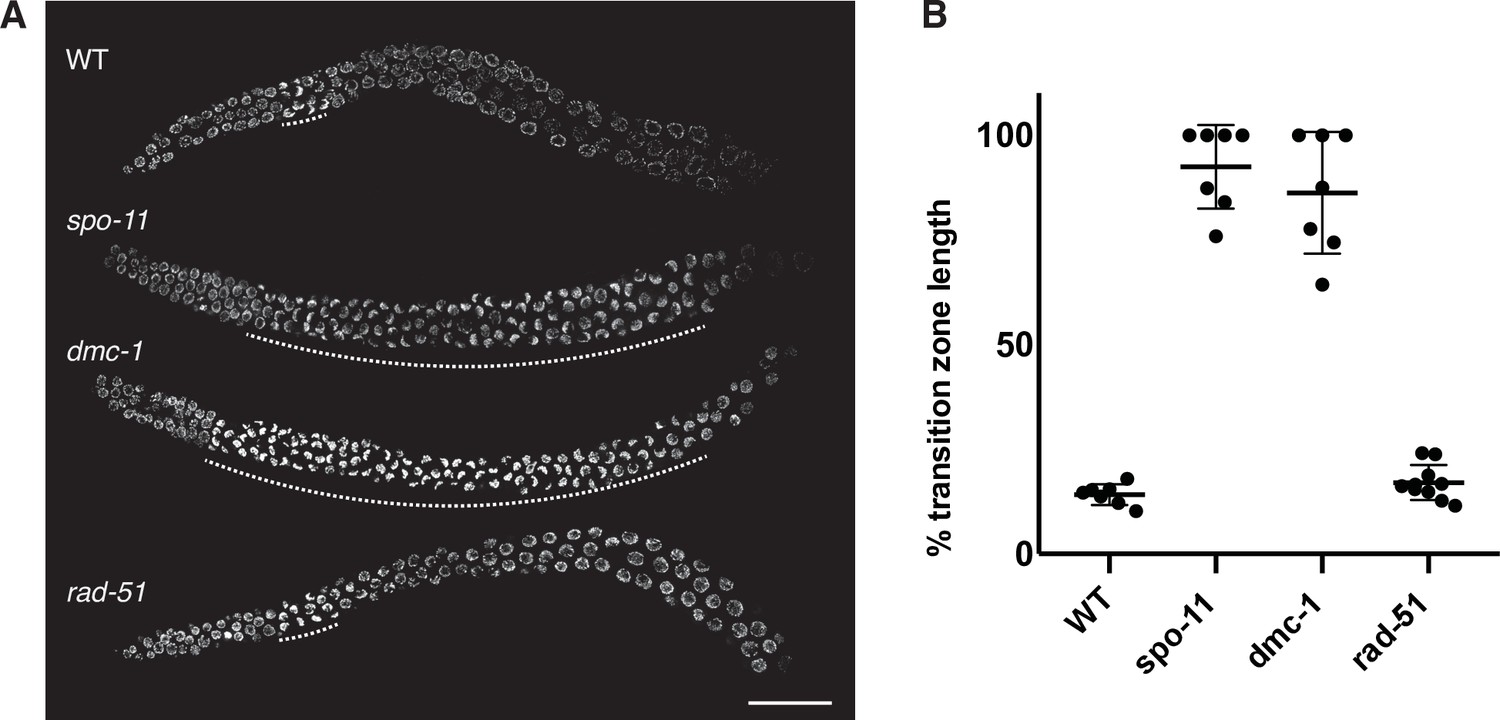
A prolonged region of polarized nuclear morphology ("transition zone" nuclei) is seen in spo-11 and dmc-1, but not in rad-51 mutants.
(A) Composite projection images of whole gonads stained with DAPI from WT, spo-11, dmc-1, and rad-51 mutants. The extent of the transition zone of each gonad is indicated with dashed lines. Scale bar, 30 μm. (B) Quantification of transition zone length as a fraction of the distance from meiotic onset to the end of pachytene in WT (n = 7), spo-11 (n = 7), dmc-1 (n = 7), and rad-51 (n = 10). Error bars indicate mean ± SD. spo-11 and dmc-1 mutants show significant differences from WT (p<0.0001) but not Ppa-rad-51 (p=0.8426) by ordinary one-way ANOVA.
Figure 3
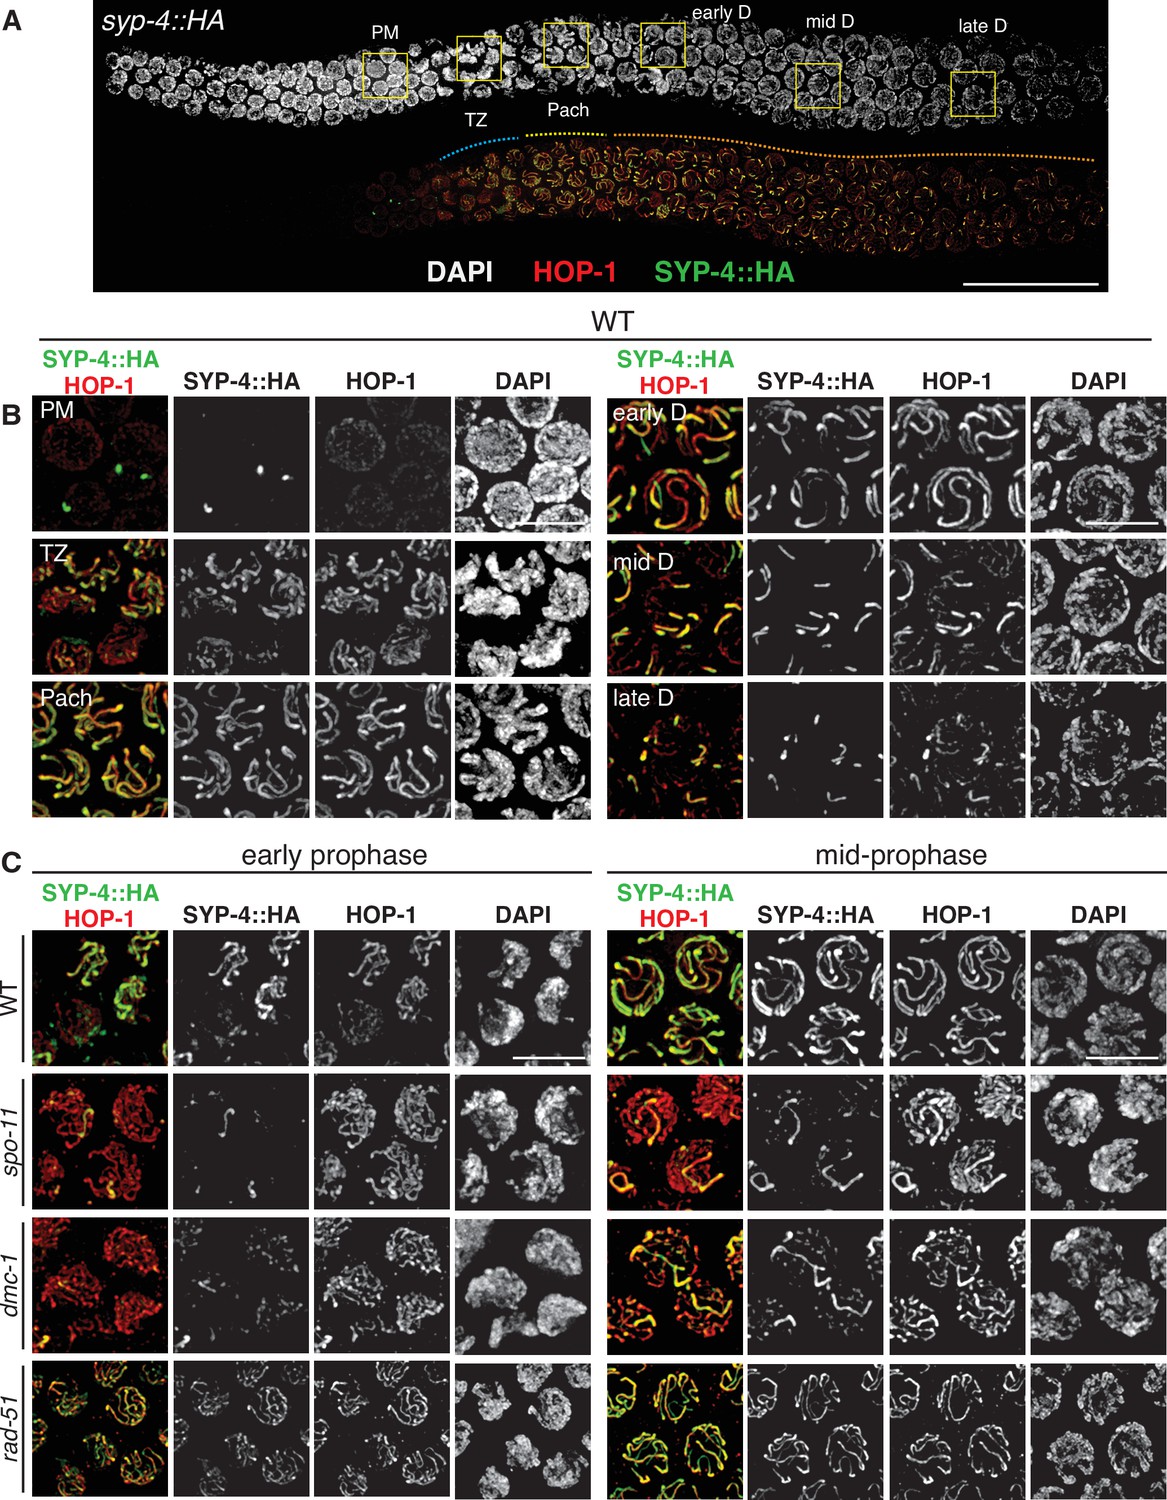
SPO-11 and DMC-1 are required for homologous synapsis in P. pacificus, while RAD-51 is dispensable.
(A) Composite projection image of a wild-type strain expressing SYP-4::HA, stained with DAPI (gray), anti-HOP-1 (red), and anti-HA (green). Meiosis progresses from left to right. Scale bar, 30 μm. (B) Higher magnification images of wild-type nuclei in the premeiotic region (PM), transition zone (TZ), pachytene (Pach), and diplotene (D) stages. (C) Localization of SYP-4::HA and HOP-1 in WT, spo-11, dmc-1, and rad-51 mutants during early and mid-prophase (roughly equivalent to the TZ and pachytene regions in wild-type germlines, respectively). Synapsis fails in the absence of spo-11 and dmc-1 function but occurs normally in rad-51 mutants. Scale bar, 5 μm. See also Figure 3—source data 1.
-
Figure 3—source data 1
All epitope-tagged proteins described in this study support normal meiosis.
Epitope-tagged alleles were generated by in-frame insertion into the endogenous gene loci using CRISPR/Cas9 (see Materials and methods) and homozygosed by selfing of successfully edited progeny. Fidelity of meiotic segregation in the resulting strains was analyzed by counting the frequency of viable embryos and male progeny among whole broods from self-fertilizing hermaphrodites, as indicated. Quantification of wild-type broods is also reported in Figure 5D.
- https://cdn.elifesciences.org/articles/70990/elife-70990-fig3-data1-v2.docx
Figure 4 with 2 supplements

DMC-1 and RAD-51 localize sequentially to meiotic chromosomes.
(A) Composite projection image of a wild-type gonad expressing DMC-1::V5, stained with DAPI (blue), anti-V5 (magenta), and anti-RAD-51 (yellow). Meiotic progression is from left to right. Scale bar, 30 μm. Inset shows the distinct localization of DMC-1 (magenta) and RAD-51 (yellow) in the transition zone and pachytene regions, respectively. Scale bar, 5 μm. (B) Higher magnification images of nuclei in the transition zone and pachytene region. DMC-1 is present along chromatin in the transition zone and disappears at pachytene. By contrast, RAD-51 localizes to discrete foci starting at pachytene. Scale bar, 5 μm. (C) Occasional nuclei at the transition from leptotene-zyogtene to pachytene are positive for both DMC-1 and RAD-51. The signals do not completely overlap. Scale bar, 2 μm. (D) Example of a nucleus with polarized DAPI morphology and strong DMC-1 signal during later prophase. Such ‘straggler’ cells may be delayed in completing synapsis or undergoing apoptosis. Scale bar, 2 μm. See also Figure 4—figure supplement 1.
Figure 4—figure supplement 1
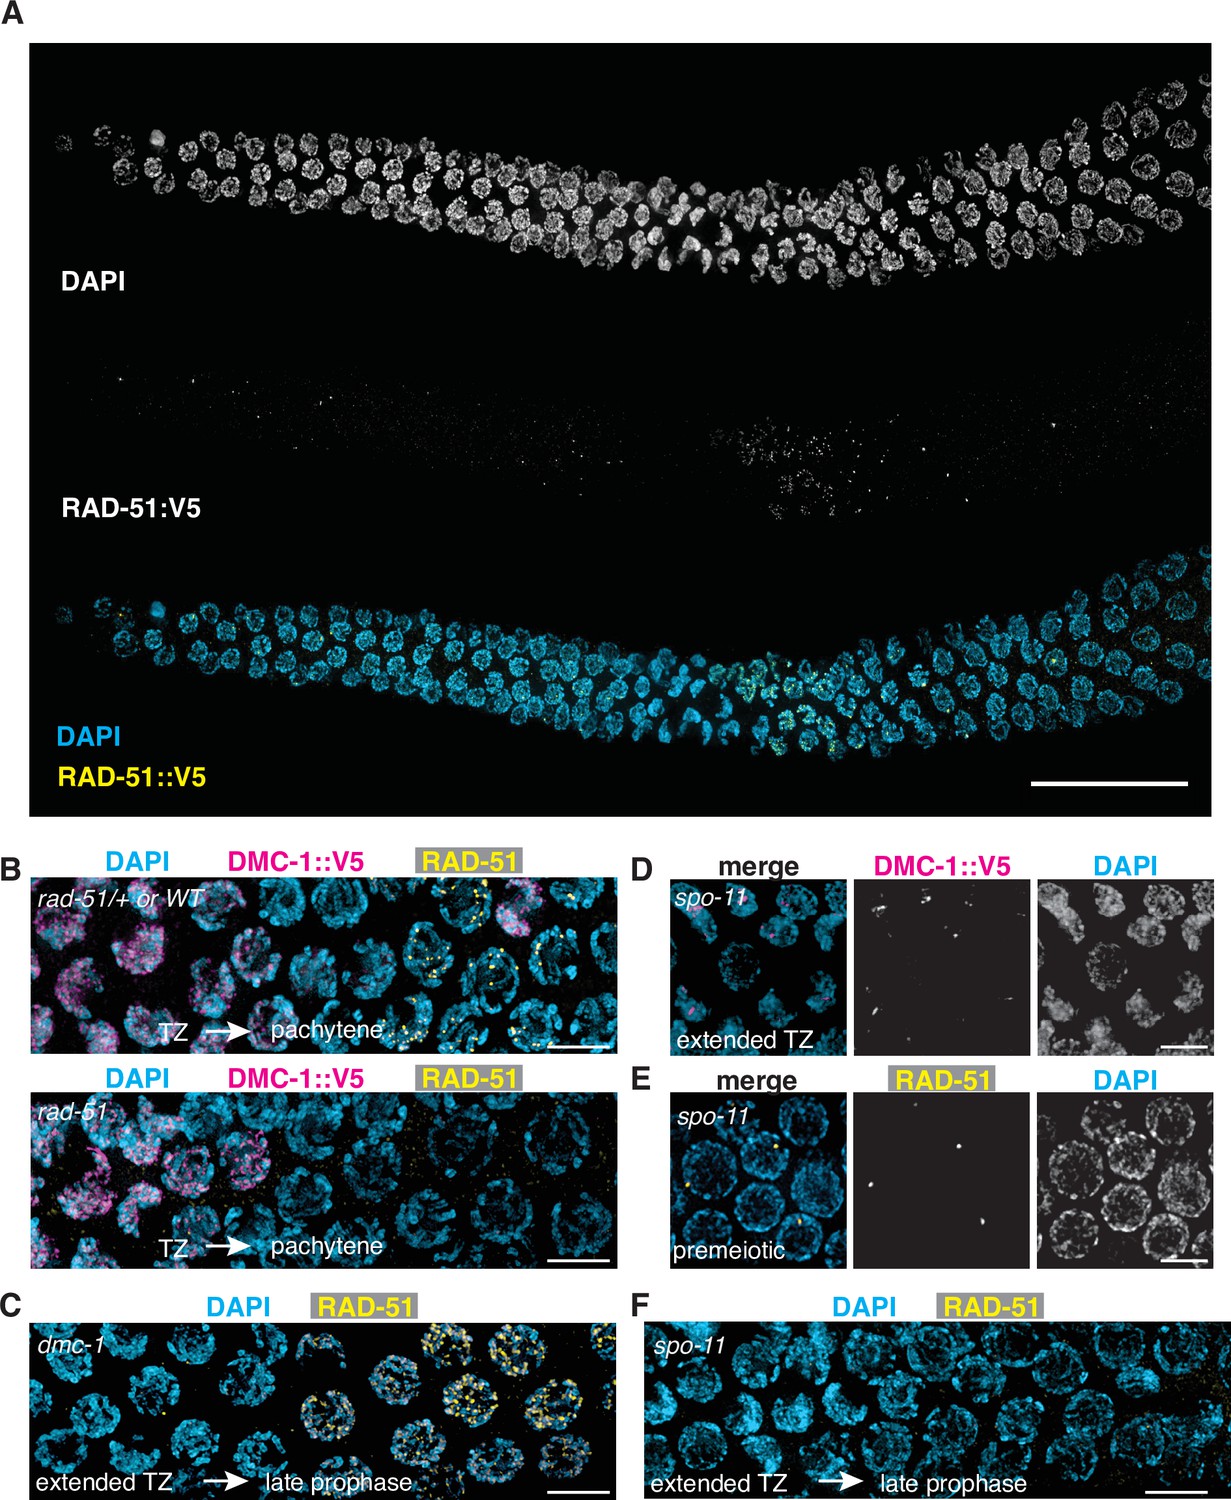
Localization of RAD-51:V5 using anti-V5 antibodies recapitulates the distribution of untagged RAD-51 detected with anti-RAD-51 polyclonal antibodies.
(A) Localization of RAD-51::V5. Composite projection image of a wild-type gonad expressing RAD-51::V5, stained with DAPI and anti-V5. Meiotic progression is from left to right. Scale bar, 30 μm. (B) DMC-1 (magenta) is abundant on chromosomes in transition zone nuclei of rad-51 mutants. Anti-RAD-51 immunofluorescence was used to identify homozygous mutants among the progeny of heterozygotes. (C) RAD-51 foci are observed in late pachytene nuclei of dmc-1 mutants, proximal to the extended transition zone. RAD-51 foci appear larger and more numerous than in wild-type pachytene nuclei. (D) DMC-1 forms nuclear aggregates in spo-11 mutants and does not localize along chromosomes. (E, F). RAD-51 foci are detected in premeiotic nuclei of spo-11 mutants but are absent during meiotic prophase. Scale bar, 5 µm.
Figure 4—figure supplement 2
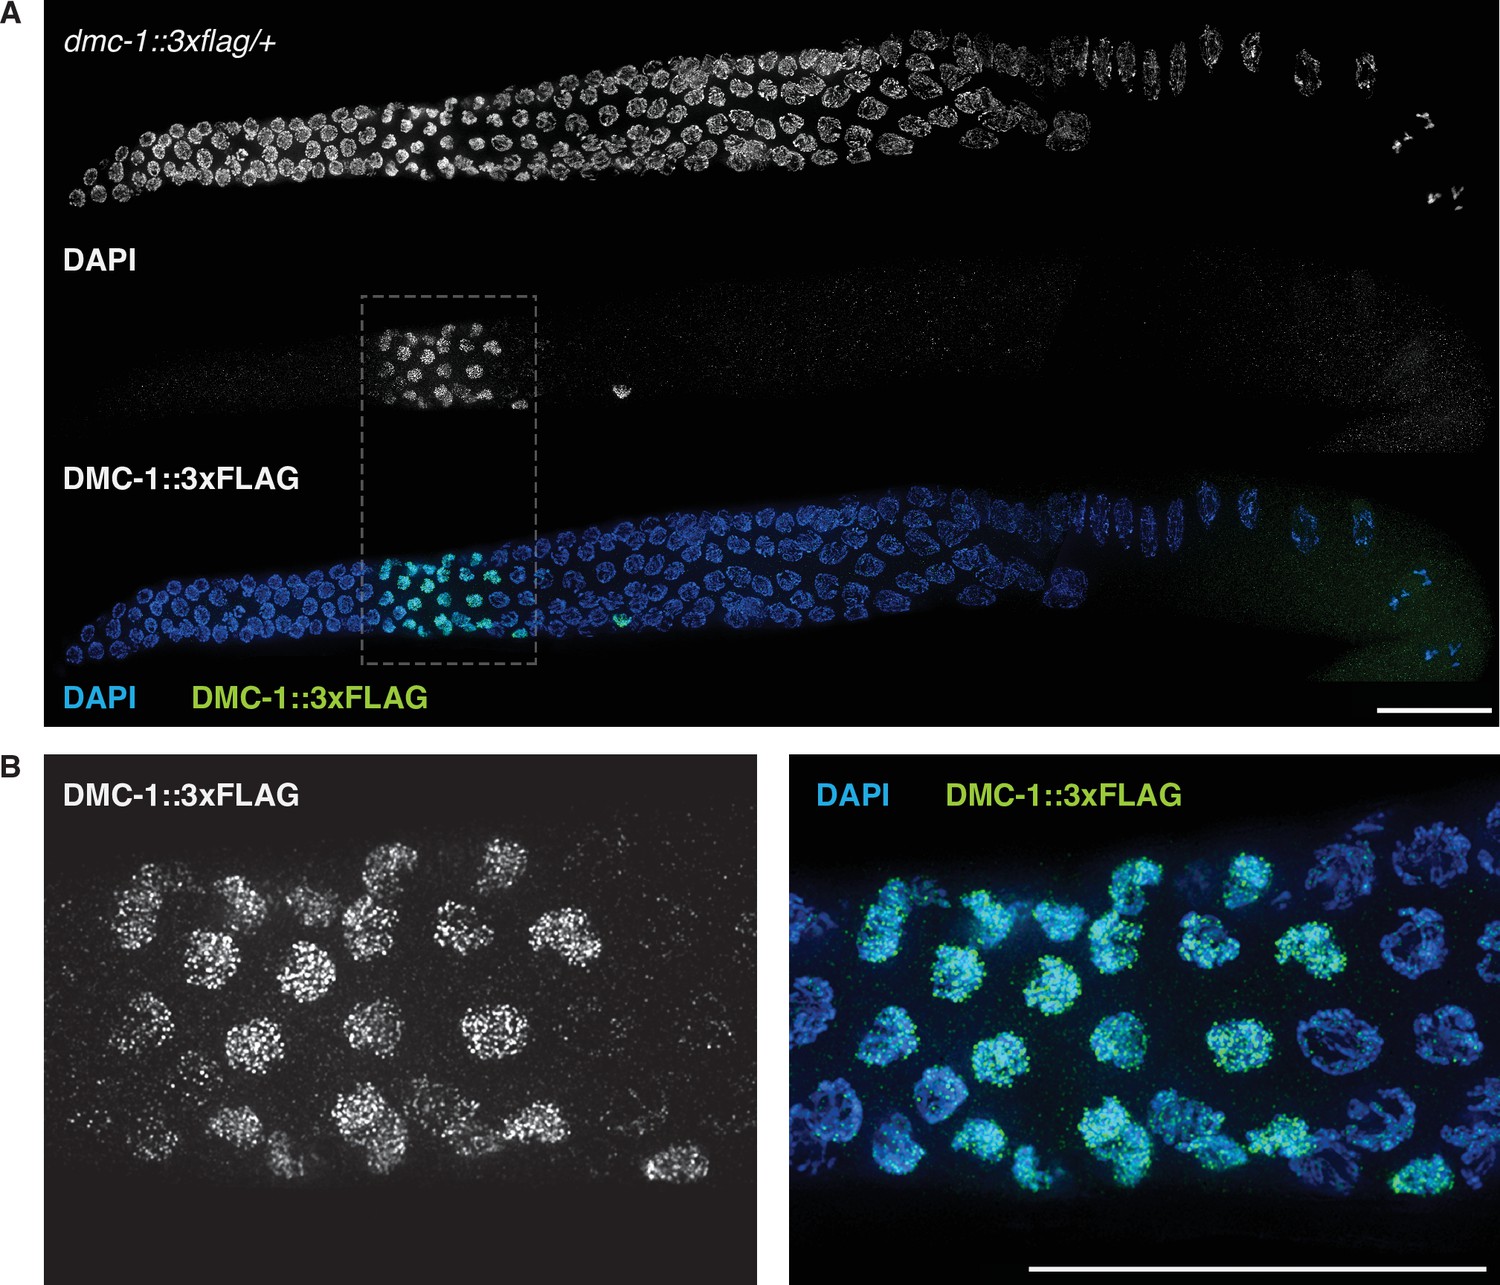
Localization of DMC-1::3XFLAG in the germline of a hermaphrodite heterozygous for the epitope-tagged allele (dmc-1::3xflag/+).
(A) Maximum-intensity projection images showing DAPI-stained nuclei and anti-FLAG immunofluorescence as grayscale images, and combined in a pseudocolored image. (B) Enlarged views of the regions outlined in (A) for both grayscale and merged images.
Figure 5
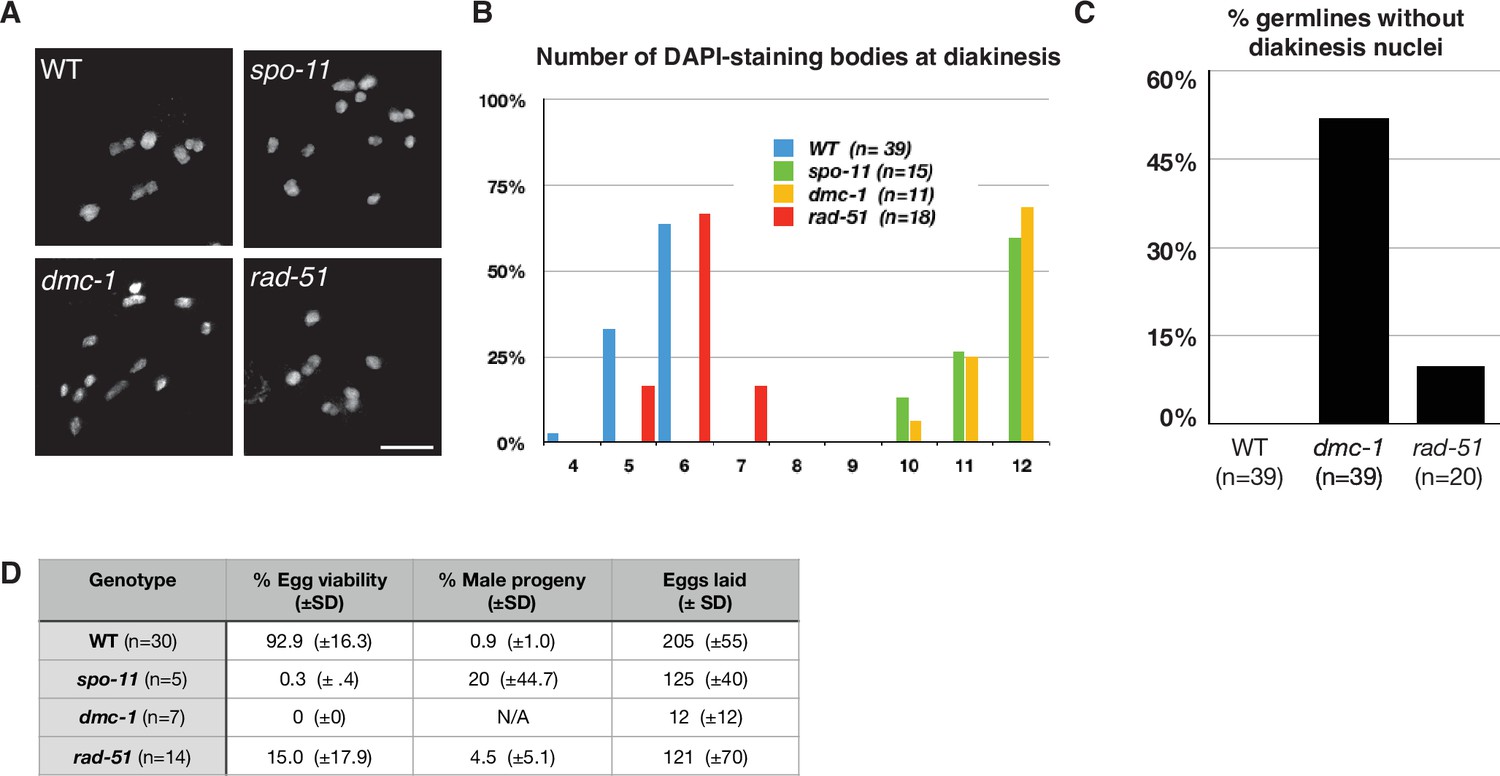
Crossover (CO) formation requires SPO-11 and DMC-1, but not RAD-51.
(A) Representative images of DAPI-staining bodies at diakinesis for each indicated genotype. Scale bar, 5 μm. (B) Quantification of DAPI-staining bodies in the ‘–1’ oocyte (immediately distal to the spermatheca) at diakinesis for each indicated genotype (n = represents number of nuclei scored). (C) Quantification of gonads that lacked nuclei with DAPI-staining bodies at diakinesis stage. n is the number of germlines scored for each genotype. (D) Frequencies of viable embryos and male progeny of whole broods from wild type, spo-11, dmc-1, and rad-51 mutant hermaphrodites.
Figure 6 with 3 supplements
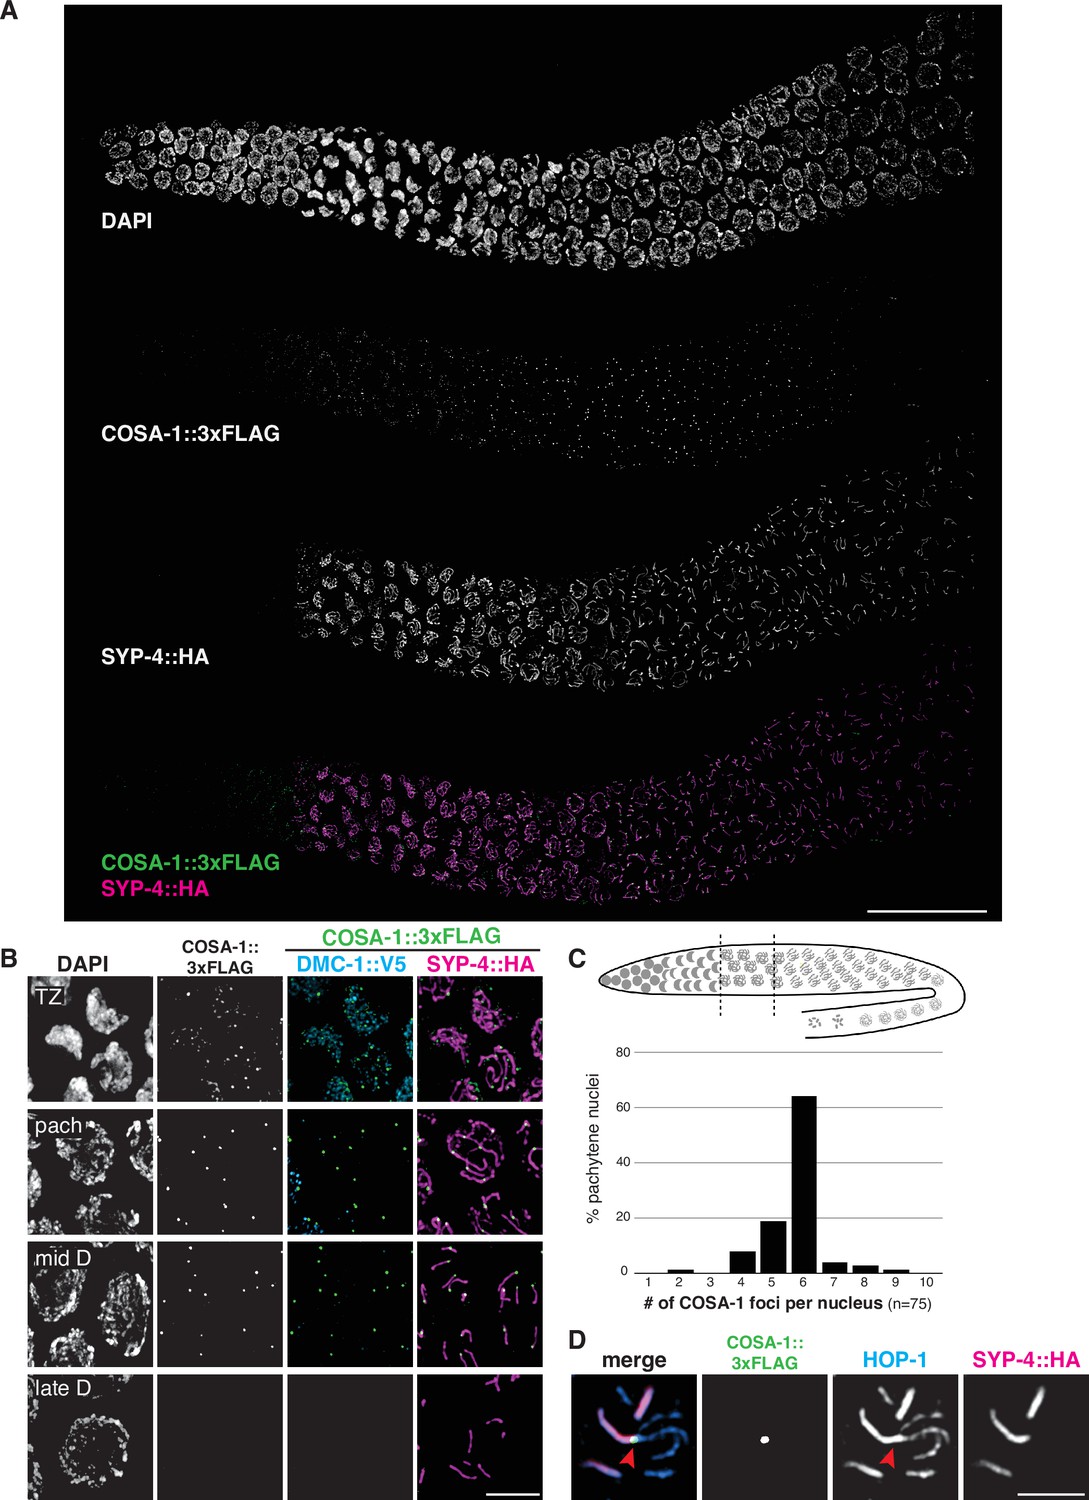
COSA-1 accumulates at a single focus per chromosome pair.
(A) Composite projection image of a wild-type strain expressing three epitope-tagged proteins (COSA-1::3xFLAG, DMC-1::V5, and SYP-4::HA), stained with anti-FLAG, anti-V5, and anti-HA antibodies. Scale bar, 30 μm. (B) Higher magnification images of nuclei from the transition zone (TZ), pachytene (pach), mid- and late diplotene (D). COSA-1::3xFLAG (green) foci are detected in transition zone nuclei but do not colocalize with DMC-1::V5 (cyan). Foci peak in brightness in pachytene nuclei and gradually become dimmer until they are no longer detected during late diplotene. In early to mid-diplotene nuclei, six short stretches of SYP-4::HA (magenta) are observed per nucleus, each associated with a single COSA-1::3xFLAG focus. Scale bar, 5 μm. (C) Histogram showing the number of COSA-1::3xFLAG foci observed per nucleus in the pachytene region. Analysis was restricted to 15 nuclei per gonad immediately proximal to the transition zone and lacking DMC-1::V5 signal. Five individual gonads were analyzed, for a total of 75 nuclei scored. (D) Partial projection of a representative nucleus in mid to late diplotene, stained with anti-HOP-1 (blue), anti-HA (marking the synaptonemal complex [SC], magenta), and anti-FLAG (marking COSA-1, green). A single COSA-1::3xFLAG focus is observed at a junction (marked with a red arrowhead) between the ‘short arm,’ where SYP-4::HA is retained, and splayed ‘long arms’ lacking SC but positive for HOP-1. Scale bar, 2 μm. See also Figure 6—figure supplement 1, Figure 6—video 1, and Figure 6—figure supplement 2.
Figure 6—figure supplement 1
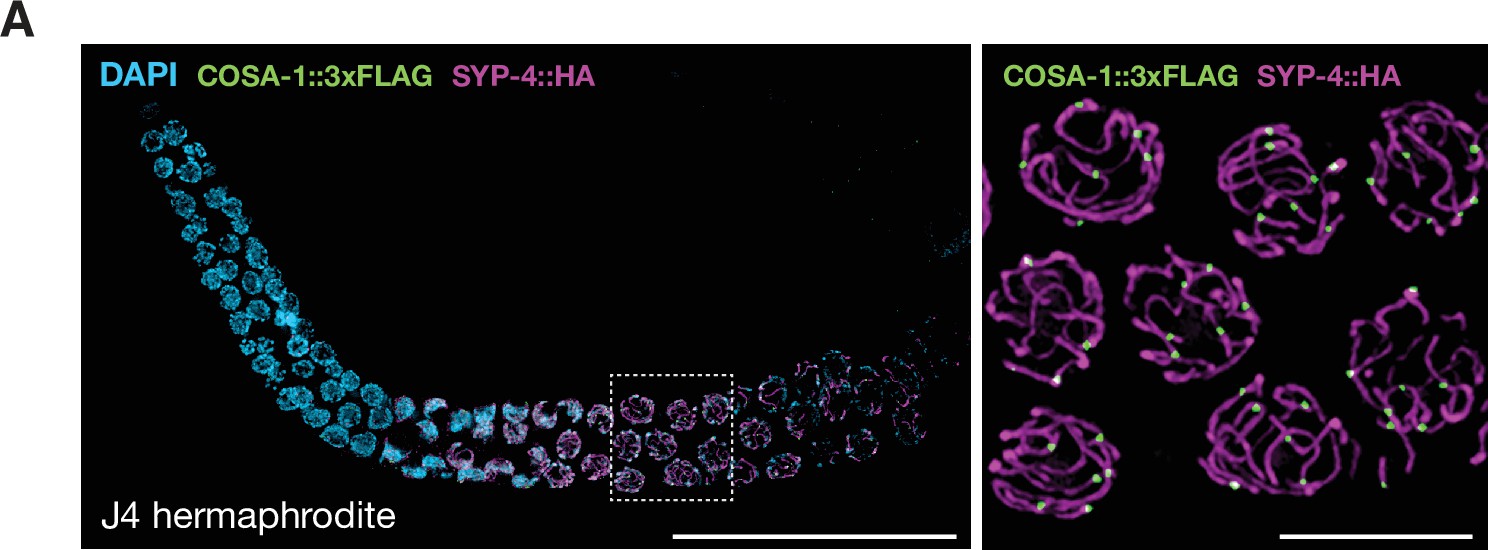
COSA-1 accumulates at a single site per chromosome pair during spermatogenesis.
(A) Composite projection image of a wild-type gonad from a J4-stage hermaphrodite expressing COSA-1::3xFLAG (green) and SYP-4::HA (magenta). Scale bar, 30 μm. At this stage, the germline is still undergoing spermatogenesis. Inset shows a higher magnification image of nuclei in the pachytene region. As during oogenesis, approximately six COSA-1::3xFLAG foci are observed in pachytene nuclei during spermatogenesis. Scale bar, 5 μm.
Figure 6—figure supplement 2
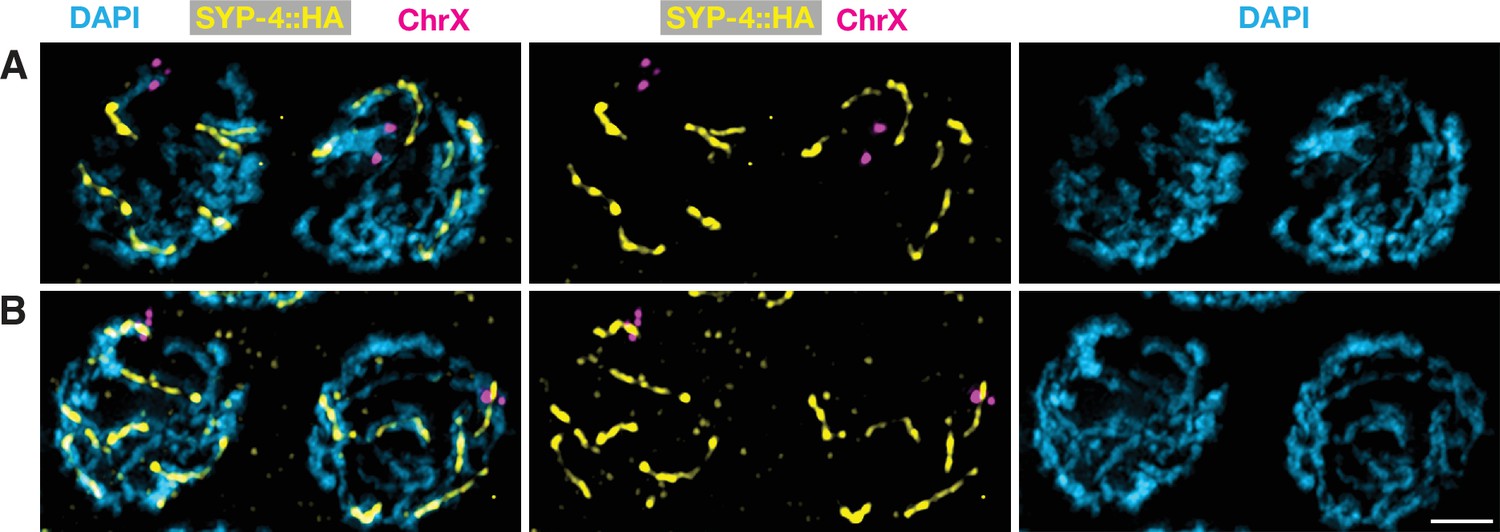
Asymmetric disassembly of the synaptonemal complex can occur along either arm of bivalent chromosomes.
Projection images of representative wild-type diplotene nuclei expressing SYP-4::HA, hybridized with a fluorescent probe specific for the left end of chromosome X (magenta), and stained with anti-HA (yellow) and DAPI (blue). (A) Nuclei in which the FISH signal recognizes the ‘long arm’ lacking SYP-4::HA. (B) Nuclei in which the probe recognizes the ‘short arm’ that retains SYP-4::HA. Scale bar, 2 μm.
Figure 6—video 1
COSA-1/Cntd1 accumulates at a single site per chromosome pair.
3D volume rendering of a single nucleus from the pachytene region of a wild-type worm expressing COSA-1::3xFLAG (green) and SYP-4::HA (magenta). Each frame is a maximum intensity projection from a region of a deconvolved 3D image. Each stretch of SYP-4::HA is associated with a COSA-1::3xFLAG focus.
Figure 7
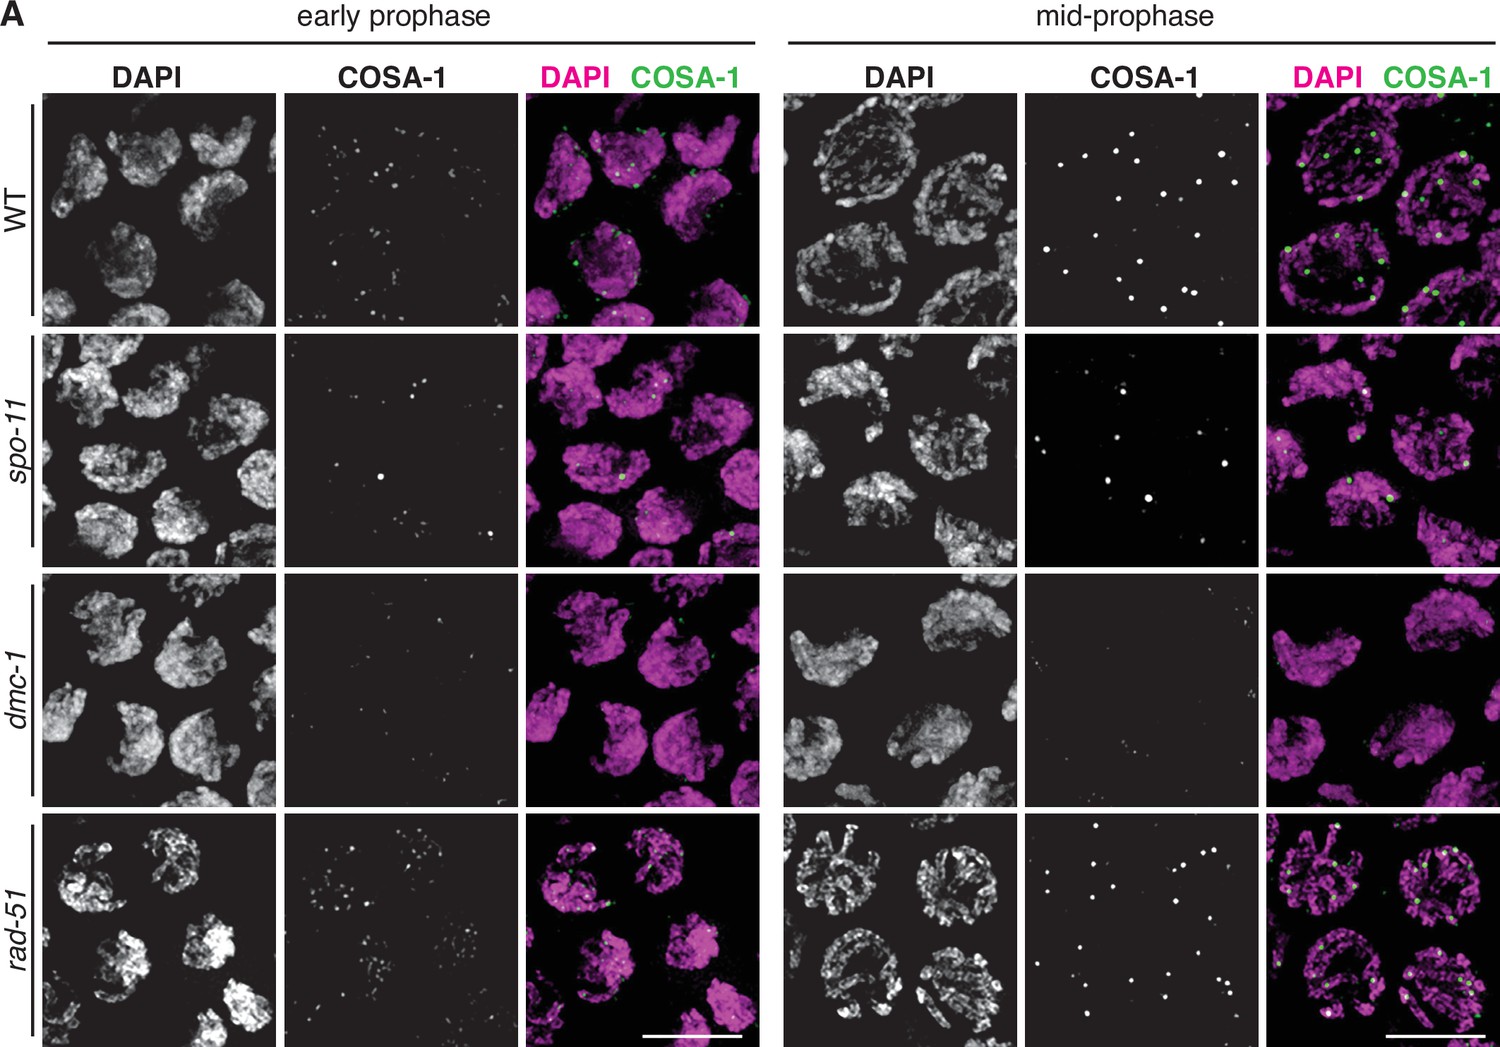
COSA-1::3xFLAG accumulates at sites of presumptive crossovers (COs).
(A) Nuclei from hermaphrodites of the indicated genotype displaying COSA-1::3xFLAG (green) in early and mid-prophase (roughly equivalent to the transition zone and pachytene regions in wild-type germlines, respectively). COSA-1 foci are absent in dmc-1 mutants, but six foci per nucleus are detected in wild-type and rad-51 mutants. Occasional foci are detected in spo-11 mutants. Scale bar, 5 μm.
Figure 8 with 1 supplement
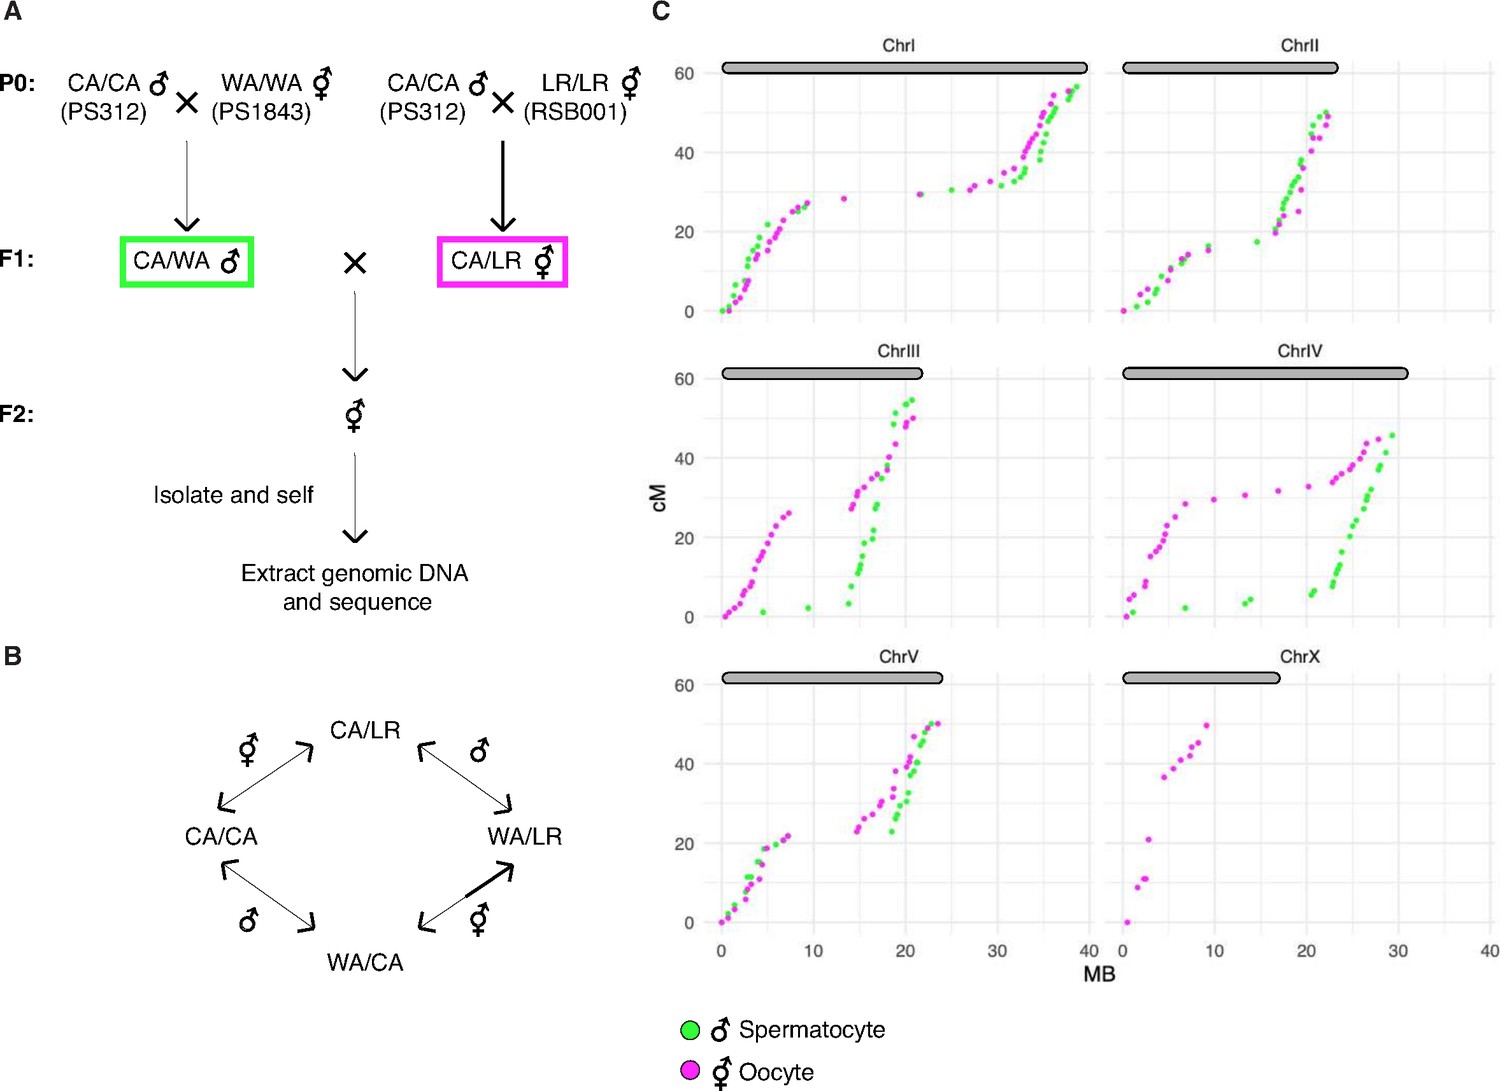
A genetic map for Pristionchus pacificus based on recombination in inter-strain hybrids.
(A) Crossing scheme to generate a recombination map using three parental strains. California PS312 (CA), Washington PS1843 (WA), and La Réunion Island RSB001 (LR) strains were crossed to obtain F1 hybrids, which were then crossed to each other. Whole-genome sequencing of progeny from crosses between hybrid F1s enabled the analysis of meiotic recombination events in each F1 parent. (B) Genotype transitions along a chromosome in F2 correspond to recombination in the male or hermaphrodite F1 parent. (C) Marey plots show genetic map position in centimorgans vs. the physical position in megabases for male (green) and hermaphrodite (magenta) meiosis. Each bin was treated as a single locus and dots were plotted at the center of each marker bin. Map positions were computed with OneMap as described. The observed map length of ~50 cM indicates that chromosomes undergo an average of one crossover (CO) per meiosis. The X chromosome lacks a homolog in males, so there is no male-specific map for the X in our data. See also Figure 8—figure supplement 1 and Figure 8—source data 1.
-
Figure 8—source data 1
Genotype calls and maps distances plotted in Figure 8 and Figure 8—figure supplement 1.
- https://cdn.elifesciences.org/articles/70990/elife-70990-fig8-data1-v2.xlsx
Figure 8—figure supplement 1
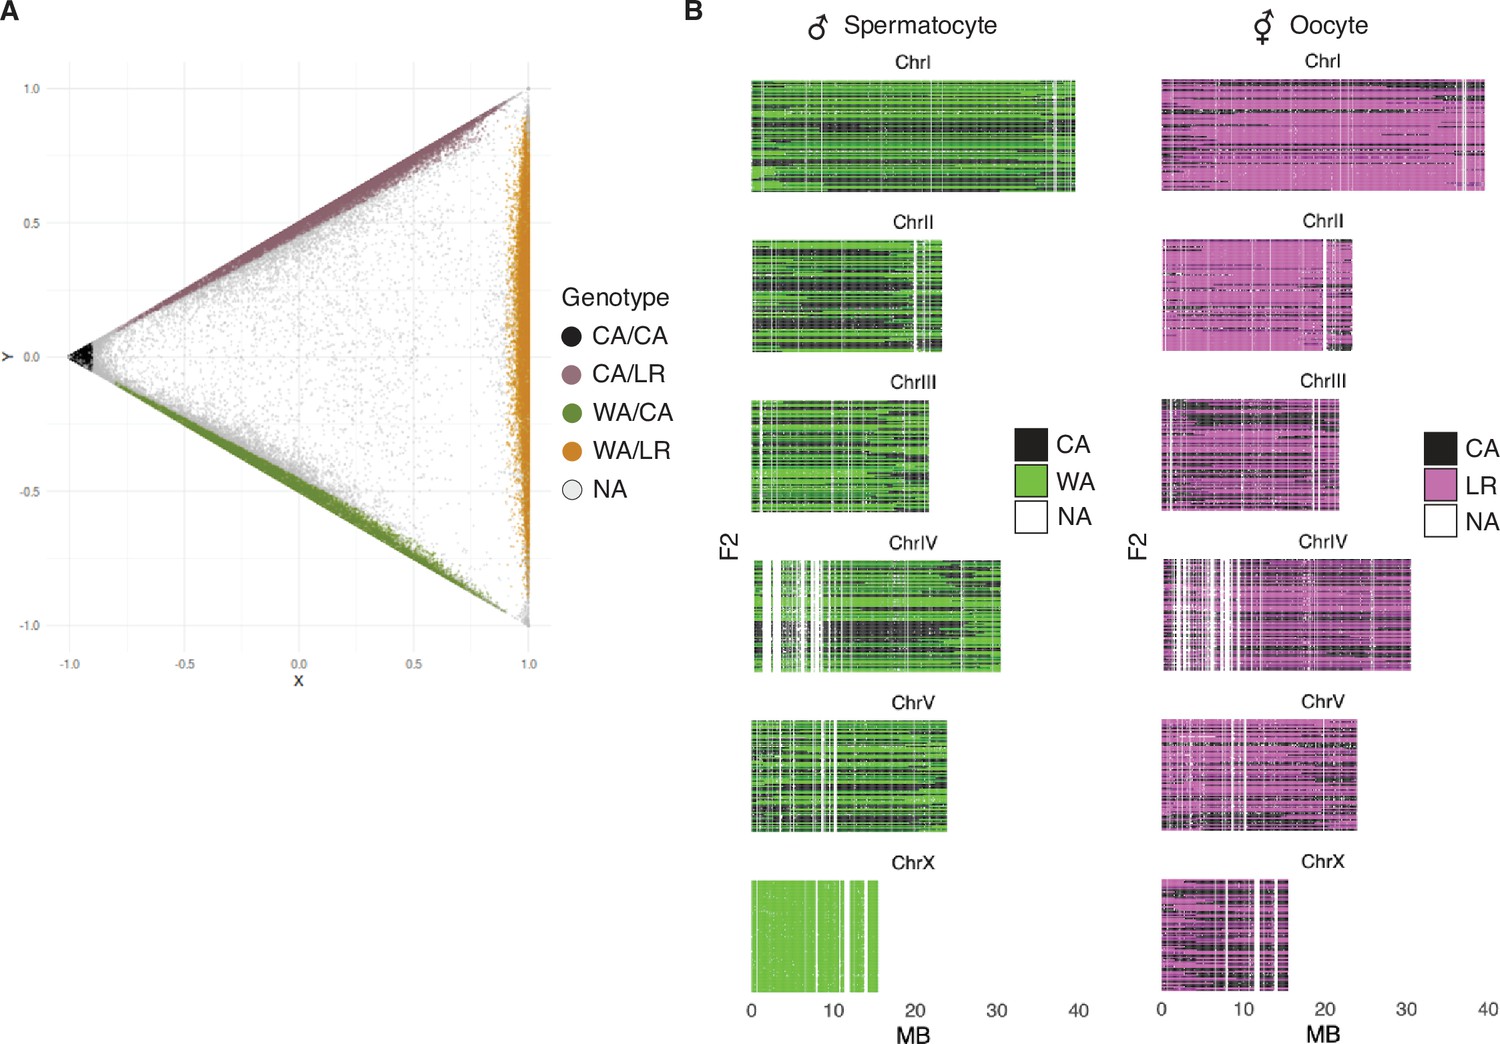
Identification of informative markers and genotyping of progeny from hybrid animals.
(A) Genotyping. For each 100 kb genomic block, progeny were genotyped based on the number of California PS312 (CA), Washington PS1843 (WA), and La Réunion Island RSB001 (LR)-specific variants they contained, given the expectation of four possible genotypes CA/CA, CA/LR, WA/CA, WA/LR. In scatterplot, each point represents a single bin in a specific individual, with X = fWA + fLR - 2fCA, and Y = fLR fWA. Gray dots represent genotypes that are conservatively left as ‘not called.’ (B) Genotypes of the mapping panel. F2 genotypes inherited from male (left) and hermaphrodite (right) parents. Each thin row is one progeny. White vertical stripes represent 100 kb windows that could not be reliably genotyped due to low numbers of P0-specific variant sites and/or sequencing depth of progeny.
Tables
Key resources table
| Reagent type (species) or resource | Designation | Source or reference | Identifiers | Additional information |
|---|---|---|---|---|
| Gene(Pristionchus pacificus) | cenp-c | El Paco genome reference, v1, 2017/Wormbase/this paper | El Paco genome reference, v1, 2017 ID:UMMS71-6.7mRNA-1; Wormbase ID:PPA37734 | See Supplementary file 1 |
| Gene(Pristionchus pacificus) | cosa-1 | El Paco genome reference, v1, 2017/Wormbase/this paper | El Paco genome reference, v1, 2017 ID:UMMS57-3.22mRNA-1; Wormbase ID:PPA23791 | See Supplementary file 1 |
| Gene(Pristionchus pacificus) | dmc-1 | El Paco genome reference, v1, 2017/this paper | El Paco genome reference, v1, 2017 ID:UMMS442-1.74mRNA-1 | See Supplementary file 1 |
| Gene(Pristionchus pacificus) | hop-1 | El Paco genome reference, v1, 2017/Wormbase/this paper | El Paco genome reference, v1, 2017 ID:UMMS341-6.31mRNA-1; Wormbase ID:PPA10281 | See Supplementary file 1 |
| Gene(Pristionchus pacificus) | rad-51 | El Paco genome reference, v1, 2017/Wormbase/this paper | El Paco genome reference, v1, 2017 ID:UMMS442-1.74mRNA-1; Wormbase ID:PPA42255 | See Supplementary file 1 |
| Gene(Pristionchus pacificus) | spo-11 | El Paco genome reference, v1, 2017/Wormbase/this paper | El Paco genome reference, v1, 2017 ID: UMMS230-10.9mRNA-1; Wormbase ID:PPA33054 | See Supplementary file 1 |
| Gene(Pristionchus pacificus) | syp-4 | El Paco genome reference, v1, 2017/this paper | El Paco genome reference, v1, 2017 ID: UMMS245-8.16mRNA-1 | See Supplementary file 1 |
| Strain, strain background (Pristionchus pacificus) | PS312, isolate 97 | Sommer Lab, MPI | ||
| Strain, strain background (Pristionchus pacificus) | PS1843 | Sommer Lab, MPI | ||
| Strain, strain background (Pristionchus pacificus) | RSB001 | Sommer Lab, MPI | ||
| Strain, strain background (Pristionchus pacificus) | P. pacificus allele and strain information | This paper | N/A | See Supplementary file 1 |
| Antibody | (Mouse polyclonal) anti-Ppa-RAD-51 | Pocono Rabbit Farm and Laboratory, Canadensis, PA | (1:300) | |
| Antibody | (Rabbit polyclonal) anti-Ppa-HOP-1 | SDIX, Newark, DE | (1:300) | |
| Antibody | (Mouse monoclonal) anti-FLAG M2 | Millipore Sigma | Cat#F1804; RRID:AB_262044 | (1:500) |
| Antibody | (Mouse monoclonal) anti-V5 | Thermo Fisher Scientific | Cat#R960-25; RRID:AB_2556564 | (1:500) |
| Antibody | (Rabbit polyclonal) anti-V5 | Millipore Sigma | Cat#V8137; RRID:AB_261889 | (1:250) |
| Antibody | (Goat polyclonal) anti-HA | Novus Biologicals | Cat##NB600-362; RRID:AB_10124937 | (1:500) |
| Antibody | (Mouse monoclonal) anti-a-tubulin, clone DM1A | Millipore Sigma | Cat#05-829; RRID:AB_310035 | (1:400) |
| Sequence-based reagent | FISH probe to the center of Chromosome IV | This paper | N/A | See Materials and methods, FISH probes |
| Sequence-based reagent | FISH probe to the left end of chromosone X | This paper | N/A | See Materials and methods, FISH probes |
| Sequence-based reagent | Alt-R CRISPR tracrRNA | Integrated DNA Technologies, Coralville, IA | Cat#1072534 | |
| Sequence-based reagent | Guide RNAs, DNA repair templates and genotyping primers | This paper | N/A | See Supplementary file 1 |
| Peptide, recombinant protein | Streptococcus pyogenes Cas9-NLS purified protein | QB3 MacroLab at UC Berkeley | N/A | |
| Commercial assay or kit | DNeasy Blood & Tissue Kit | Qiagen | Cat#69504 | |
| Commercial assay or kit | plexWell LP384 Library Preparation Kit | seqWell | LP384 | |
| Software, algorithm | For a list of used software and relevant parameters, see Supplementary file 4 |
Additional files
-
Supplementary file 1
Table listing genes, alleles, and genome editing reagents used in this manuscript.
- https://cdn.elifesciences.org/articles/70990/elife-70990-supp1-v2.docx
-
Supplementary file 2
Table listing species names and sequence accession numbers used for the phylogenetic analysis summarized in Figure 2—figure supplement 1.
- https://cdn.elifesciences.org/articles/70990/elife-70990-supp2-v2.xlsx
-
Supplementary file 3
Table listing SSLP markers and genotyping primers used to confirm cross-progeny for genetic map construction.
- https://cdn.elifesciences.org/articles/70990/elife-70990-supp3-v2.docx
-
Supplementary file 4
Table listing software version numbers and parameters used in this work.
- https://cdn.elifesciences.org/articles/70990/elife-70990-supp4-v2.docx
-
Supplementary file 5
Table showing summary of crossovers detected on each chromosome in hermaphrodite oocytes (XX) and male spermatocytes (XO), including the number of nonrecombinant chromatids and chromatids with one or two crossovers.
No higher-order recombinant chromatids were observed.
- https://cdn.elifesciences.org/articles/70990/elife-70990-supp5-v2.docx
-
Transparent reporting form
- https://cdn.elifesciences.org/articles/70990/elife-70990-transrepform1-v2.docx
Download links
A two-part list of links to download the article, or parts of the article, in various formats.
Downloads (link to download the article as PDF)
Open citations (links to open the citations from this article in various online reference manager services)
Cite this article (links to download the citations from this article in formats compatible with various reference manager tools)
Analysis of meiosis in Pristionchus pacificus reveals plasticity in homolog pairing and synapsis in the nematode lineage
eLife 10:e70990.
https://doi.org/10.7554/eLife.70990


