Perception is associated with the brain’s metabolic response to sensory stimulation
- Museo Storico della Fisica e Centro Studi e Ricerche Enrico Fermi, Italy
- Center for Magnetic Resonance Research, Department of Radiology, University of Minnesota, United States
- Department of Radiation Oncology, Campus Bio-Medico University of Rome, Italy
- Dipartimento di Neuroscienze, Imaging e Scienze Cliniche, Università Gabriele D’Annunzio, Italy
- Biomedical Magnetic Resonance, University Hospital Tübingen and High–Field Magnetic Resonance, Max Planck Institute for Biological Cybernetics, Germany
- Fondazione Santa Lucia IRCCS, Italy
Figures
Figure 1 with 5 supplements
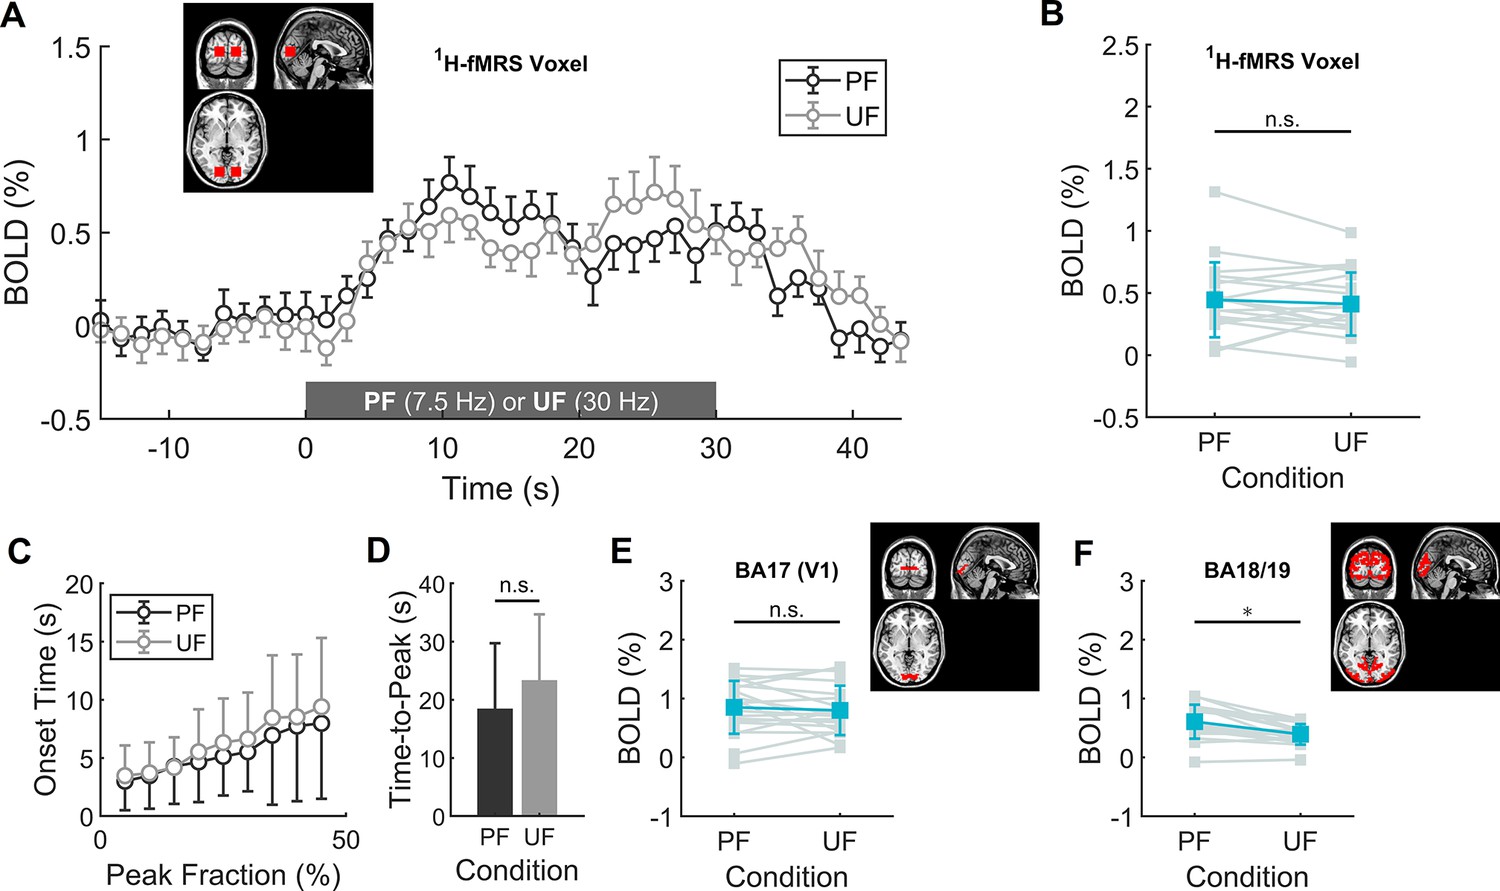
Main and differential effects of stimulation assessed by volume-of-interest (VOI)-based functional magnetic resonance imaging (fMRI) analysis.
(A) Mean time-course of blood oxygenation level-dependent (BOLD) signals in the transition between rest and perceived flickering (PF) or rest and unperceived flickering (UF), averaged over the fMRI voxels corresponding to the subject-specific spectroscopic VOI. (B) BOLD percent change during the experimental conditions, averaged over the fMRI voxels corresponding to the subject-specific spectroscopic VOI. No statistically significant difference in BOLD response was found between the two conditions with conventional statistics, and Bayesan paired sample t-test indicated moderate evidence for the absence of difference between the conditions. (C, D) Average onset time as a function of peak intensity fraction and corresponding time-to-peak (i.e., at 100% peak intensity). There is a small, although not statistically significant trend for slower onset and longer time-to-peak of BOLD increase during the UF condition. (E) BOLD percent change averaged over the fMRI voxels corresponding to the Brodmann Area 17 (i.e., V1). Within V1, there is no difference between PF and UF condition (unpaired two-sample t-test, p = 0.72). (F) BOLD percent change averaged over the fMRI voxels corresponding to the Brodmann Areas 18 and 19 (e.g., including V2, V3a, V4v, and V5/MT). Within these areas, the response to PF is significantly larger than the corresponding response to UF (unpaired two-sample t-test, p = 0.008). *, statistically significant.
-
Figure 1—source data 1
Demographics and functional magnetic resonance imaging (fMRI) study parameters.
- https://cdn.elifesciences.org/articles/71016/elife-71016-fig1-data1-v3.xlsx
-
Figure 1—source data 2
Datasets and Matlab scripts for generating panels from Figure 1 and associated figure supplements.
- https://cdn.elifesciences.org/articles/71016/elife-71016-fig1-data2-v3.zip
Figure 1—figure supplement 1
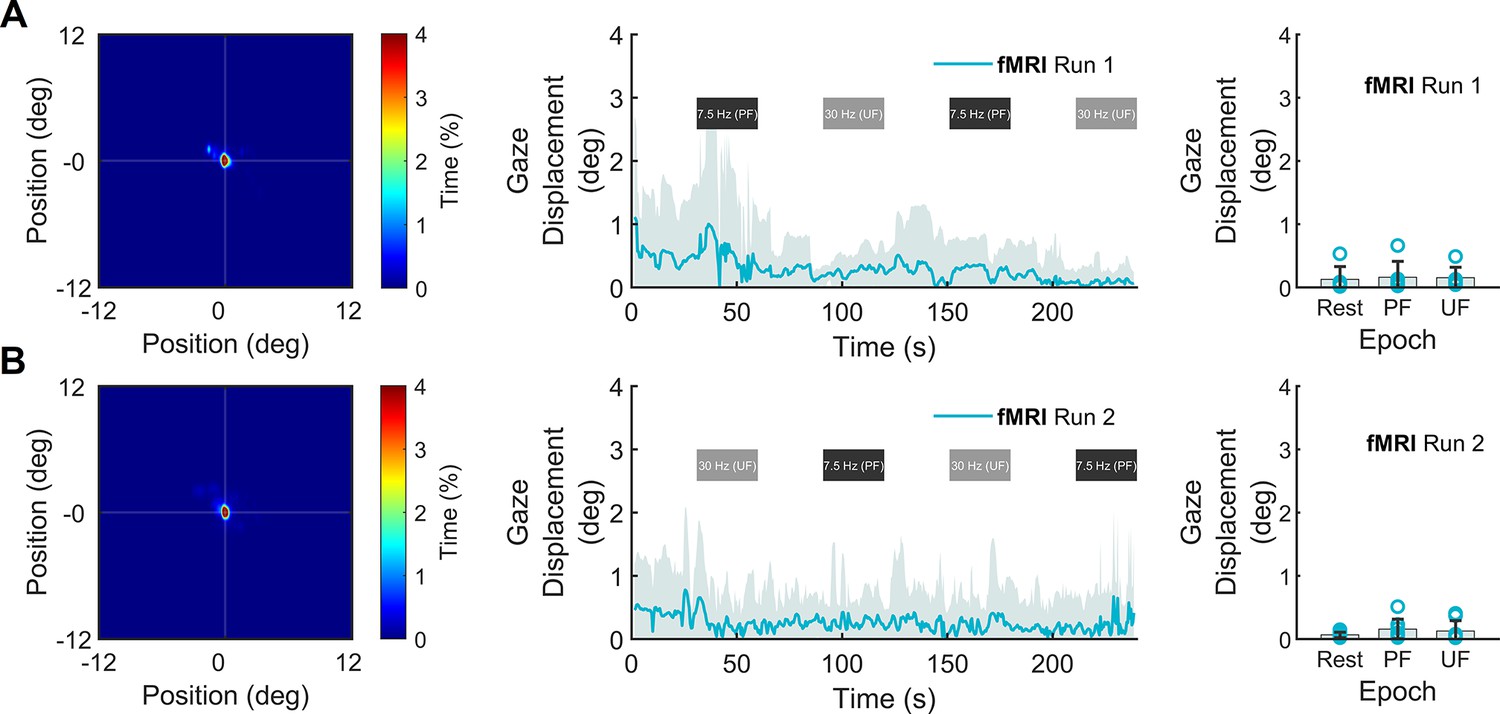
Eye position and gaze displacement during functional magnetic resonance imaging (fMRI) sessions.
(A, B) Left panels. Average heatmaps of eyes position (across subjects) during fMRI sessions (runs 1 and 2, respectively). Middle panels. Stability of mean gaze displacement from the fixation point. Right panels. Gaze displacement was not different across conditions.
Figure 1—figure supplement 2
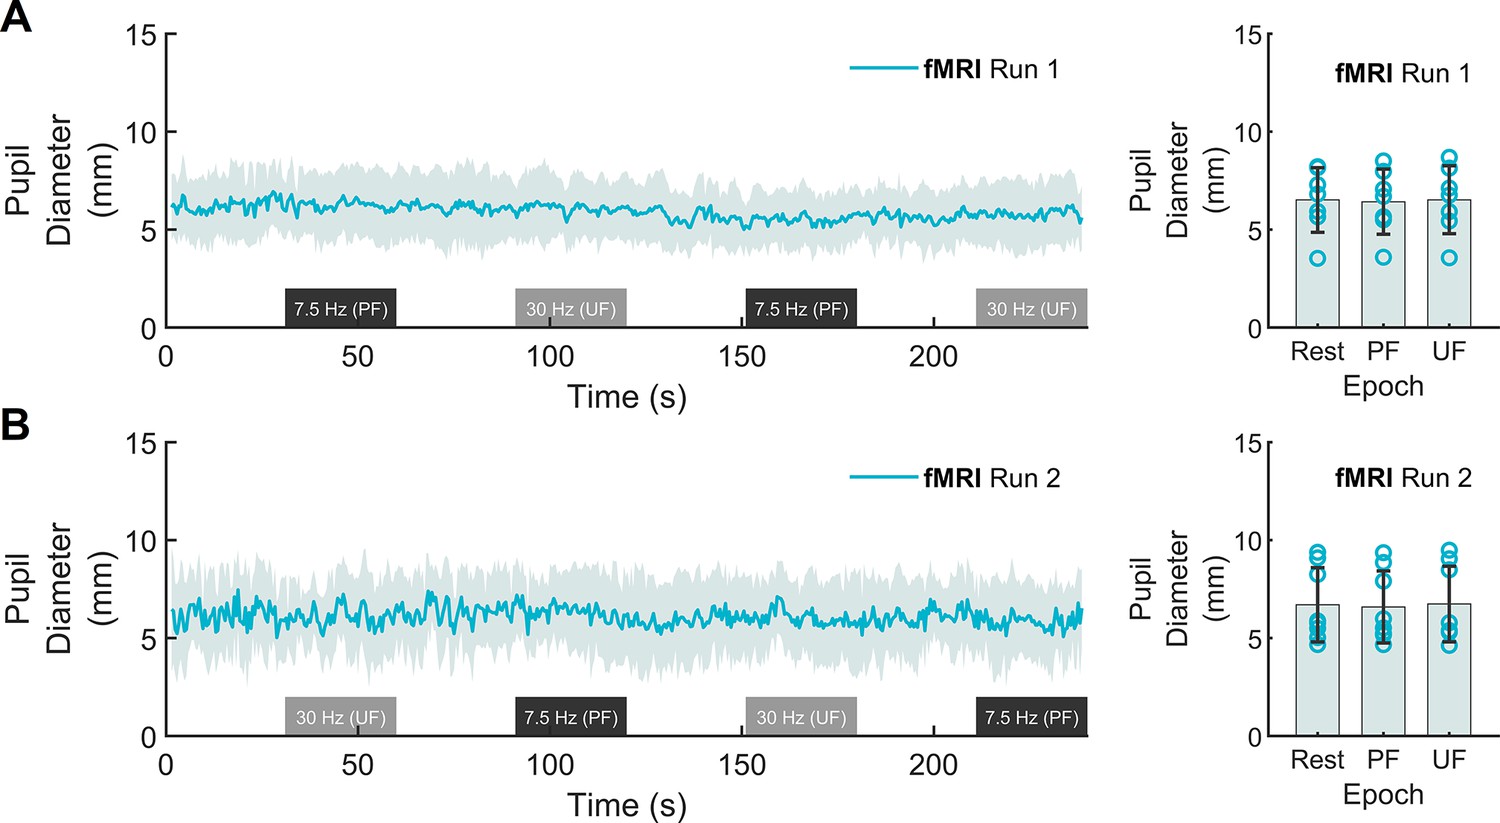
Pupil size dynamics during functional magnetic resonance imaging (fMRI) sessions.
(A, B) Left panels. Average pupil diameter (across subjects) during fMRI sessions (runs 1 and 2, respectively). Right panels. Mean pupil diameter was not statistically different across conditions.
Figure 1—figure supplement 3
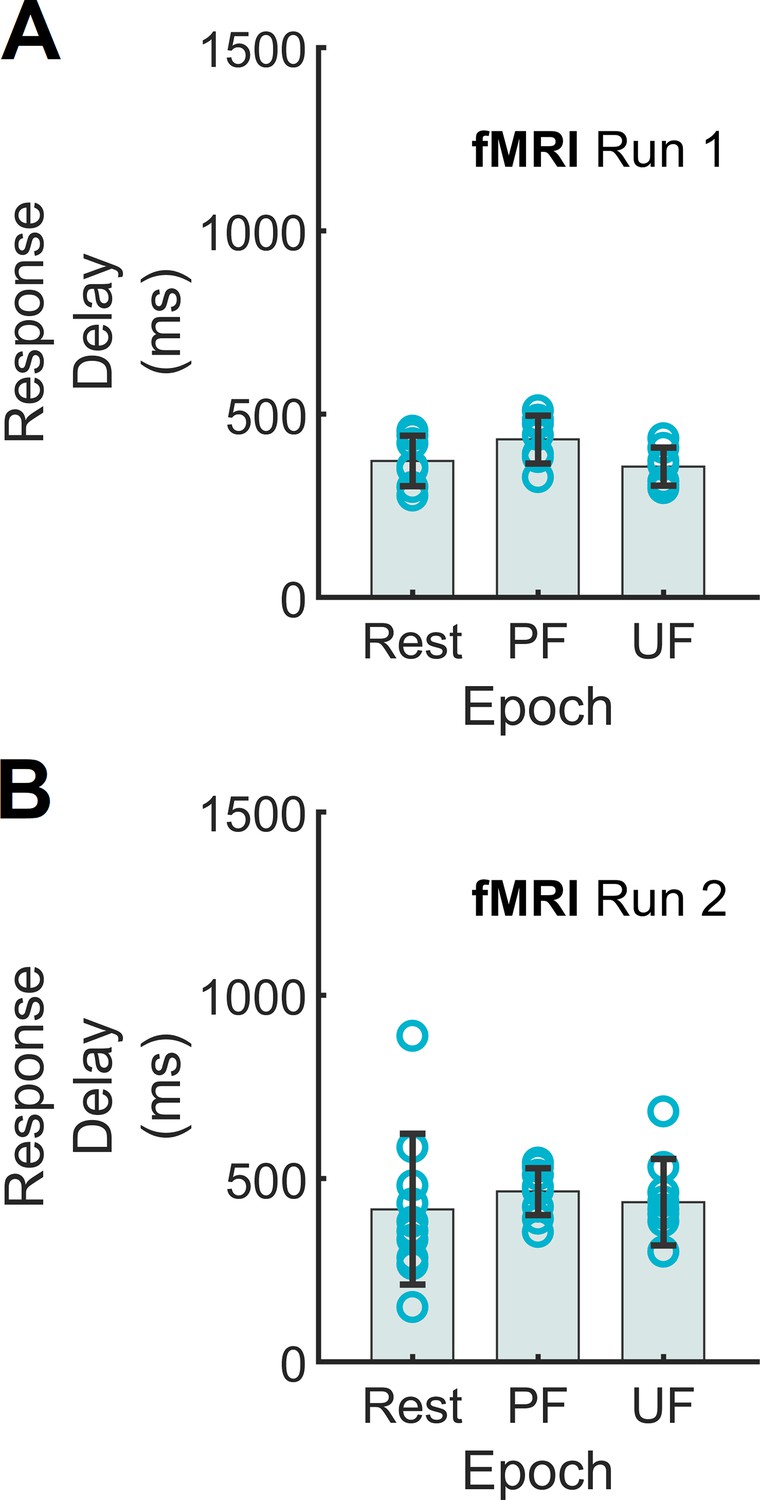
Task performance during functional magnetic resonance imaging (fMRI) sessions.
(A, B) Average task performance (across subjects) during fMRI sessions (runs 1 and 2, respectively). Response delay was not statistically different across conditions.
Figure 1—figure supplement 4

Correlation of task performance with eye position/pupil size during functional magnetic resonance imaging (fMRI) sessions.
(A, B) Correlation between task performance and eye-tracking data during fMRI sessions (runs 1 and 2, respectively). Left panels. There was no correlation between response delay and mean gaze displacement. Right panels. There was no correlation between response delay and mean pupil diameter.
Figure 1—figure supplement 5
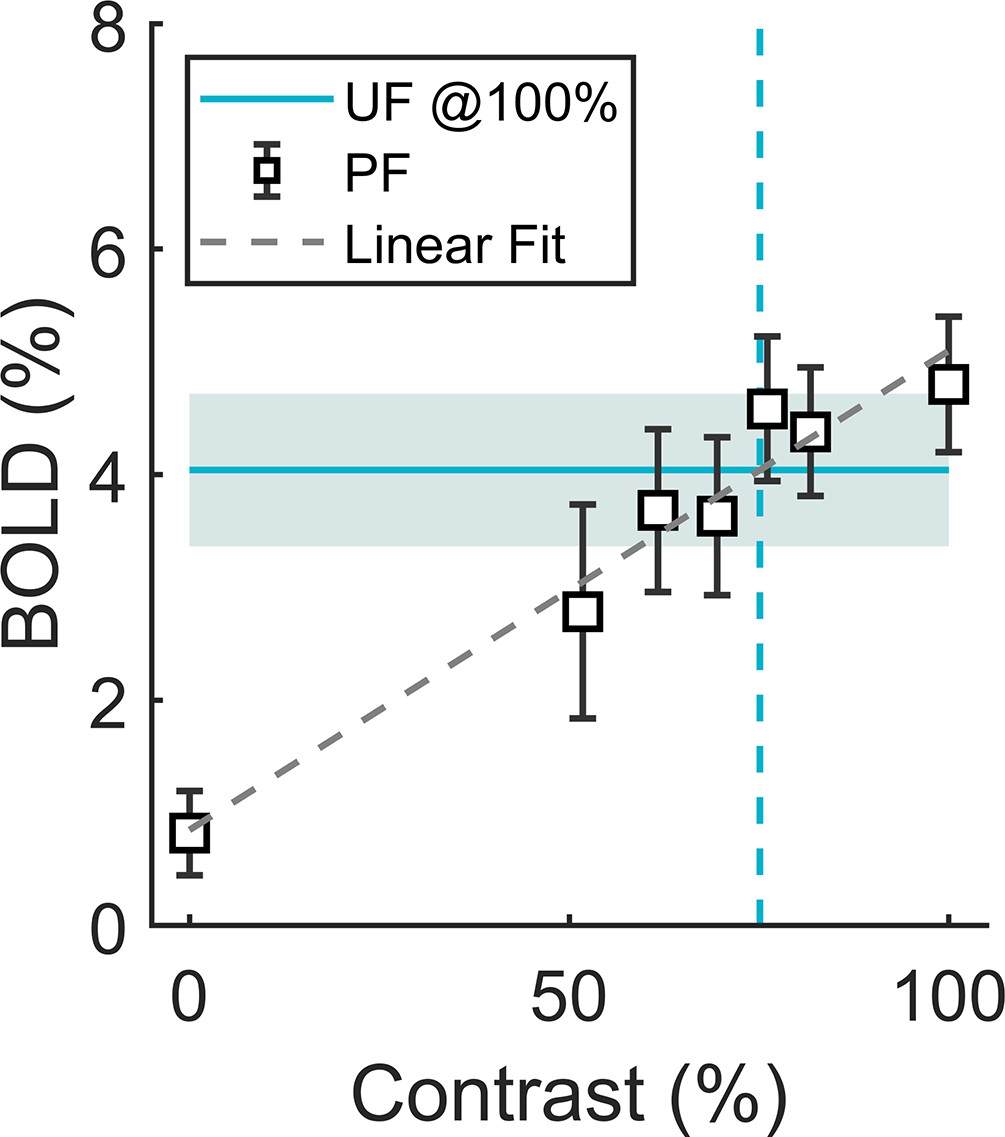
Perceived flickering (PF) versus unperceived flickering (UF) blood oxygenation level-dependent (BOLD) matching.
Calibration of image contrast to match BOLD response in V1 to PF and UF obtained in a preliminary session. The contrast of the PF image was reduced to 75% for subsequent stimulations (i.e., common to all subjects).
Figure 2 with 1 supplement
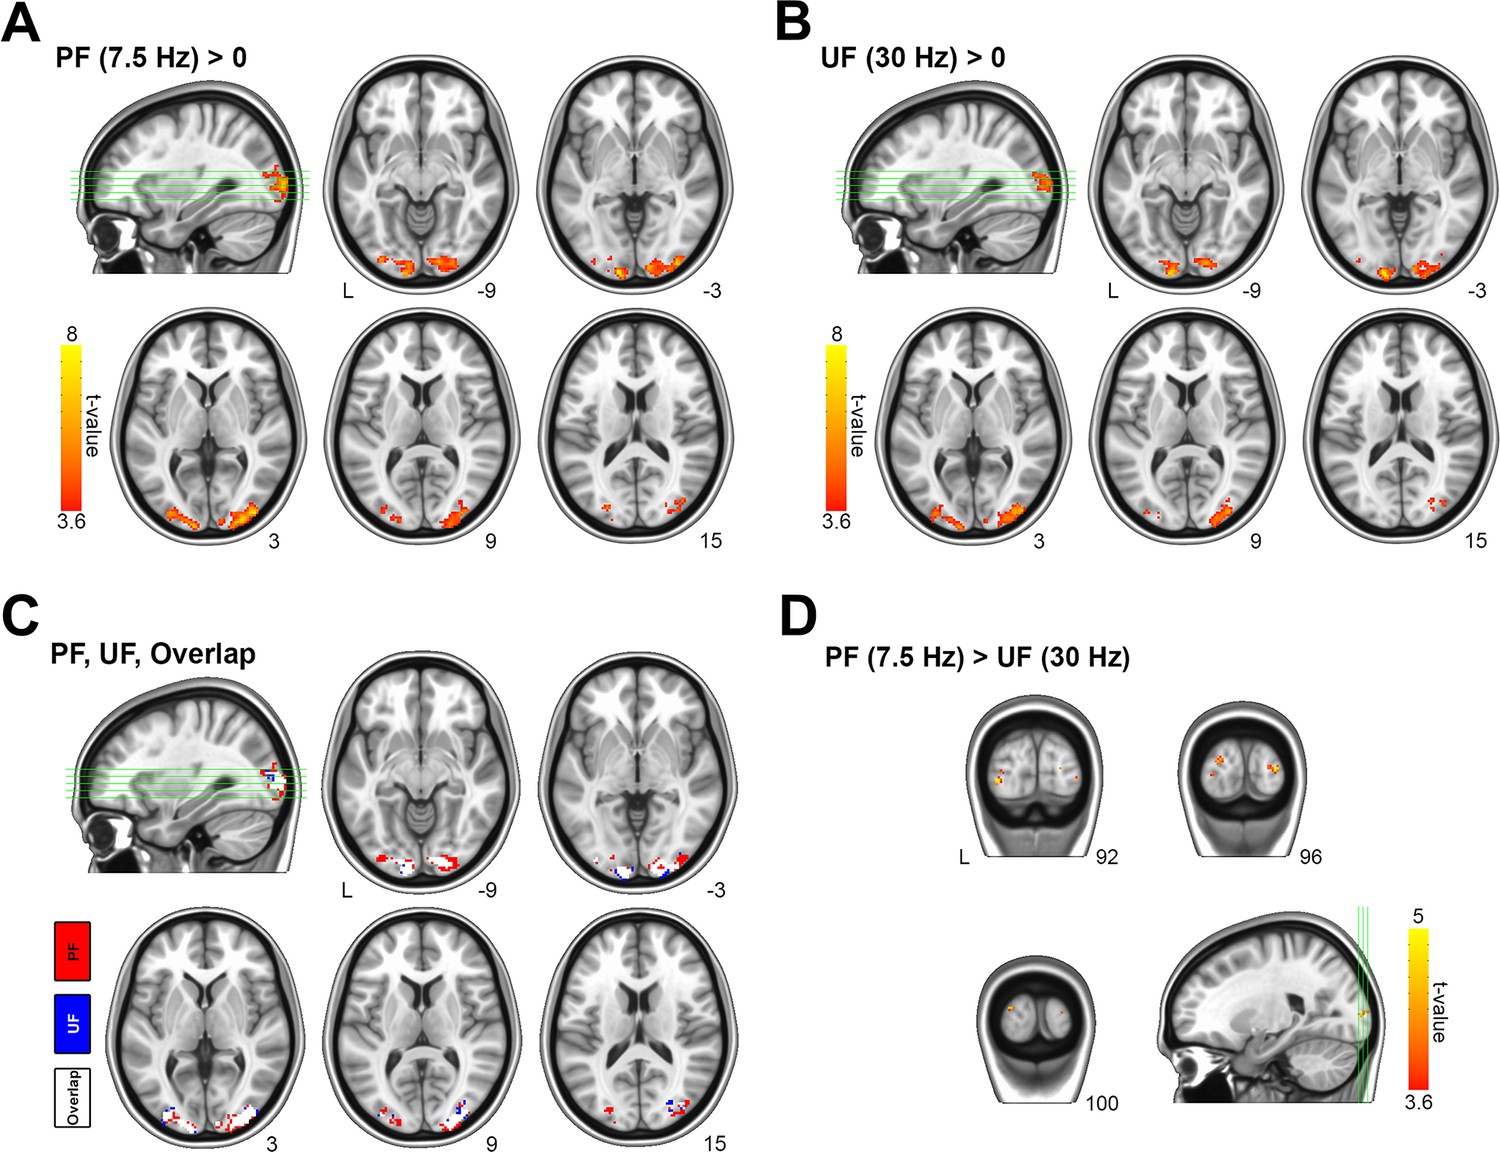
Main and differential effects of stimulation assessed by voxel-based functional magnetic resonance imaging (fMRI) analysis.
(A) Statistical maps for group-averaged positive effect of the perceived flickering (PF) visual stimulation versus rest (i.e., PF > rest). (B) Statistical maps for group-averaged positive effect of the PF visual stimulation versus rest (i.e., unperceived flickering [UF] > rest). (C) Overlap between activation maps relative to PF and UF. (D) Differential effect of stimulation (PF> UF). The differential response related to perception is localized in the lateral occipital cortex (secondary visual areas), with no responding voxels inside V1. For comparison, the inverse differential effect of stimulation (UF > PF) has no significant responding voxels (not shown). All statistical activation maps are thresholded at p < 0.001, with a false discovery rate (FDR) correction at the cluster level (corresponding to qFDR <0.05), and overlaid on MNI template.
-
Figure 2—source data 1
Cortical regions preferentially activated by perceived flickering (PF) compared to unperceived flickering (UF).
- https://cdn.elifesciences.org/articles/71016/elife-71016-fig2-data1-v3.xlsx
Figure 2—figure supplement 1
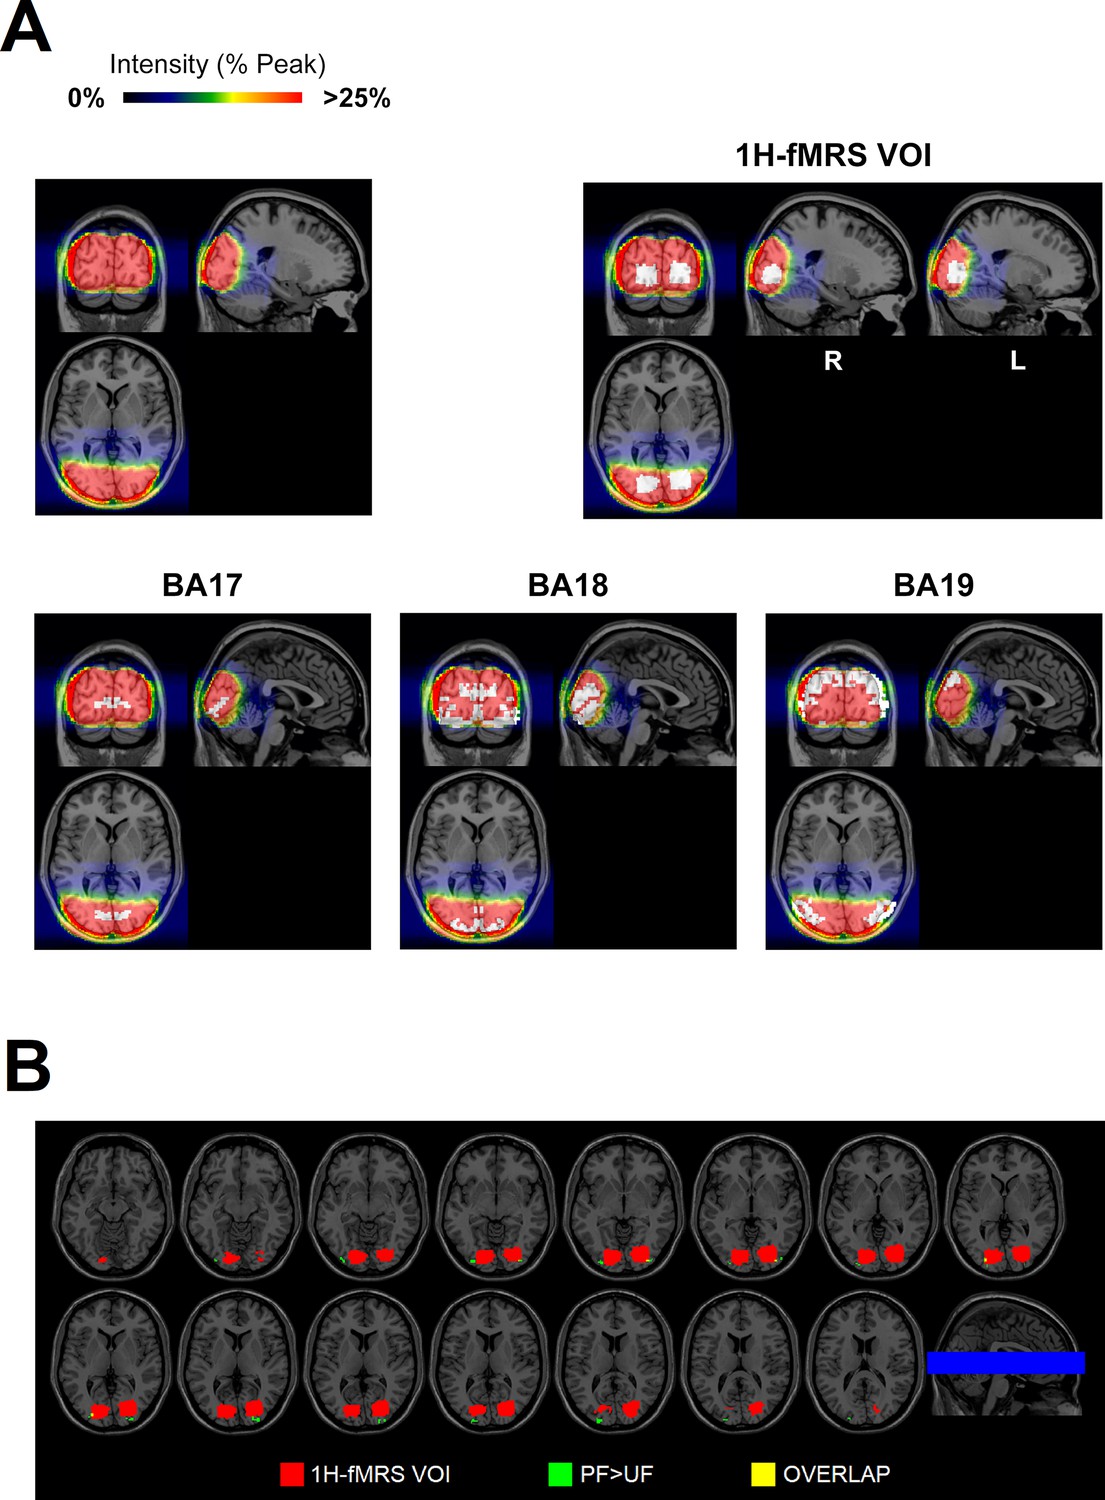
Positions of regions and volumes of interest within the imaging field.
(A) Intensity map of echo-planar (EPI) images acquired with the surface coil normalized to MNI template, superimposed to different regions of interest (ROIs, in white). Top panels. Average spectroscopic voxel (1H-fMRS [functional magnetic resonance spectroscopy] volume-of-interest [VOI]). Bottom panels. BA17 (i.e., V1), BA18, and BA19. (B) Location of the perceived flickering (PF) > unperceived flickering (UF) regions (green) in comparison with the spectroscopic VOI (red). The overlapping voxels are in yellow. Note that the average spectroscopic VOI has been thresholded to have the same mean volume (i.e., number of voxels) of the single-subject 1H-fMRS VOIs.
Figure 3 with 5 supplements
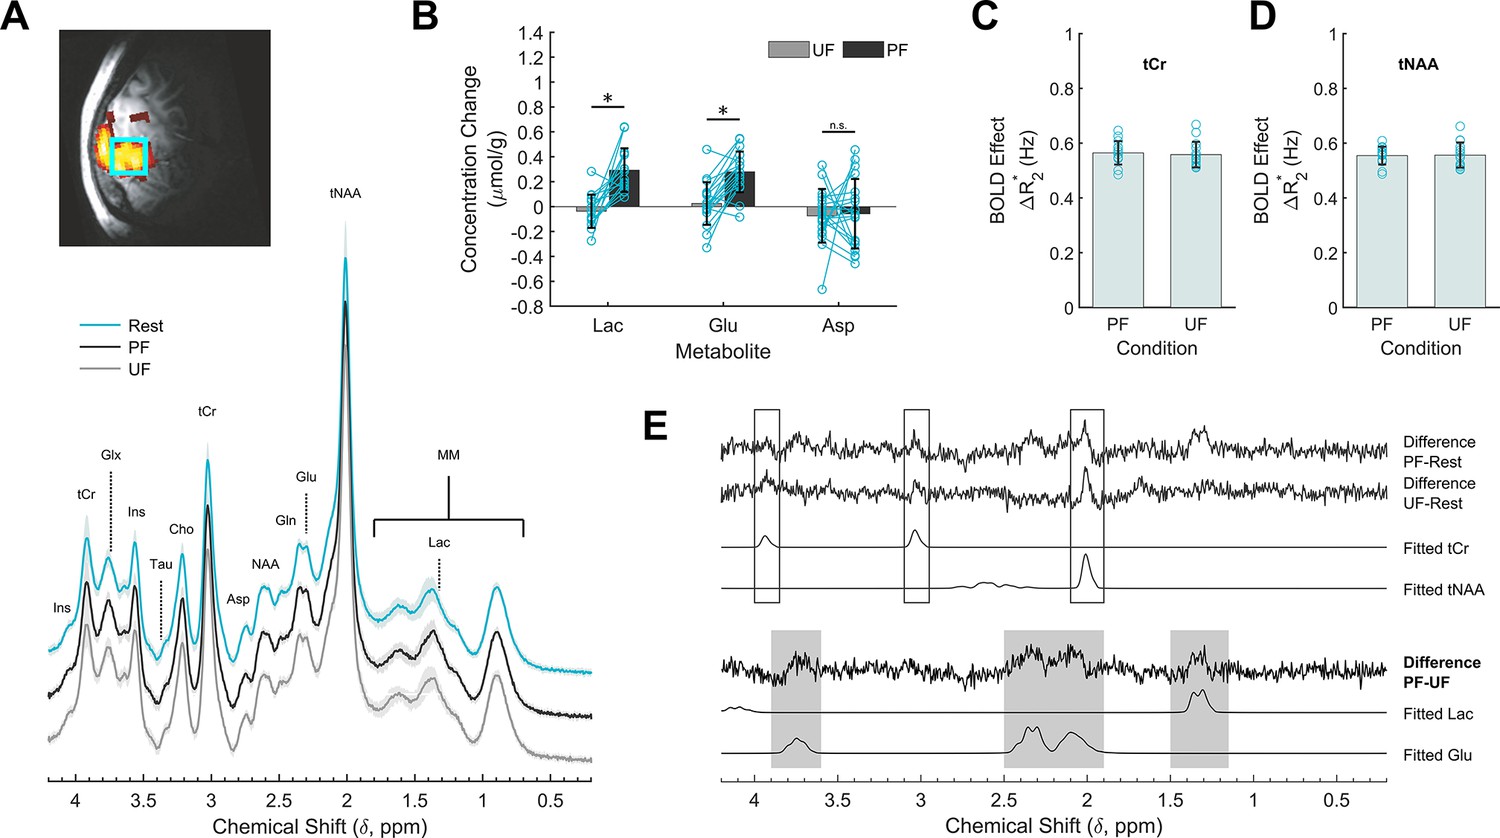
Effects of stimulation on the cortical metabolic profile assessed by 1H-fMRS (functional magnetic resonance spectroscopy) analysis.
(A) Spectroscopic data acquired during resting (R, cyan) as well as perceived flickering (PF; black) and unperceived flickering (UF; gray) conditions, averaged across subjects. A single-subject representative voxel location is reproduced on a parasagittal view of the blood oxygenation level-dependent (BOLD) activation and superimposed on the anatomical scan from the same subject. For visualization purposes, the processing of the spectra included frequency and phase correction of single transients, averaging, eddy currents correction, and Fourier transform. (B) Lactate, glutamate, and aspartate concentration changes during the stimulation conditions, relative to the rest conditions acquired immediately before. Data are averaged across subjects. There is significant increase in lactate (+28%) and glutamate (+3%) levels induced by PF stimulus, but not by UF stimulus. The concentration changes of the two metabolites were significantly different across the stimulation conditions, while there was no change for aspartate. (C, D) Spectral total creatine (tCr) and total N-acetylaspartate (tNAA) linewidth changes induced by the PF and UF stimuli show no statistically significant difference. (E) Differences between spectra acquired in the three experimental conditions. For reference, the corresponding LCModel fits are reported on the bottom for the Lac and Glu signals. tCr and tNAA singlets showed the expected BOLD-related features: there is a difference between stimulation and rest, but the difference spectra between the active conditions are within the noise. In the regions of lactate and glutamate the difference spectra between PF and rest and between PF and UF are similar, while they are clearly distinct from the difference spectra between UF and rest. *, statistically significant.
-
Figure 3—source data 1
Demographics and 1H-fMRS (functional magnetic resonance spectroscopy) study parameters.
- https://cdn.elifesciences.org/articles/71016/elife-71016-fig3-data1-v3.xlsx
-
Figure 3—source data 2
Modulations of metabolic profile of V1 during perceived flickering (PF) and unperceived flickering (UF) stimulations.
- https://cdn.elifesciences.org/articles/71016/elife-71016-fig3-data2-v3.xlsx
-
Figure 3—source data 3
Datasets and Matlab scripts for generating panels from Figure 3 and associated figure supplements.
- https://cdn.elifesciences.org/articles/71016/elife-71016-fig3-data3-v3.zip
Figure 3—figure supplement 1
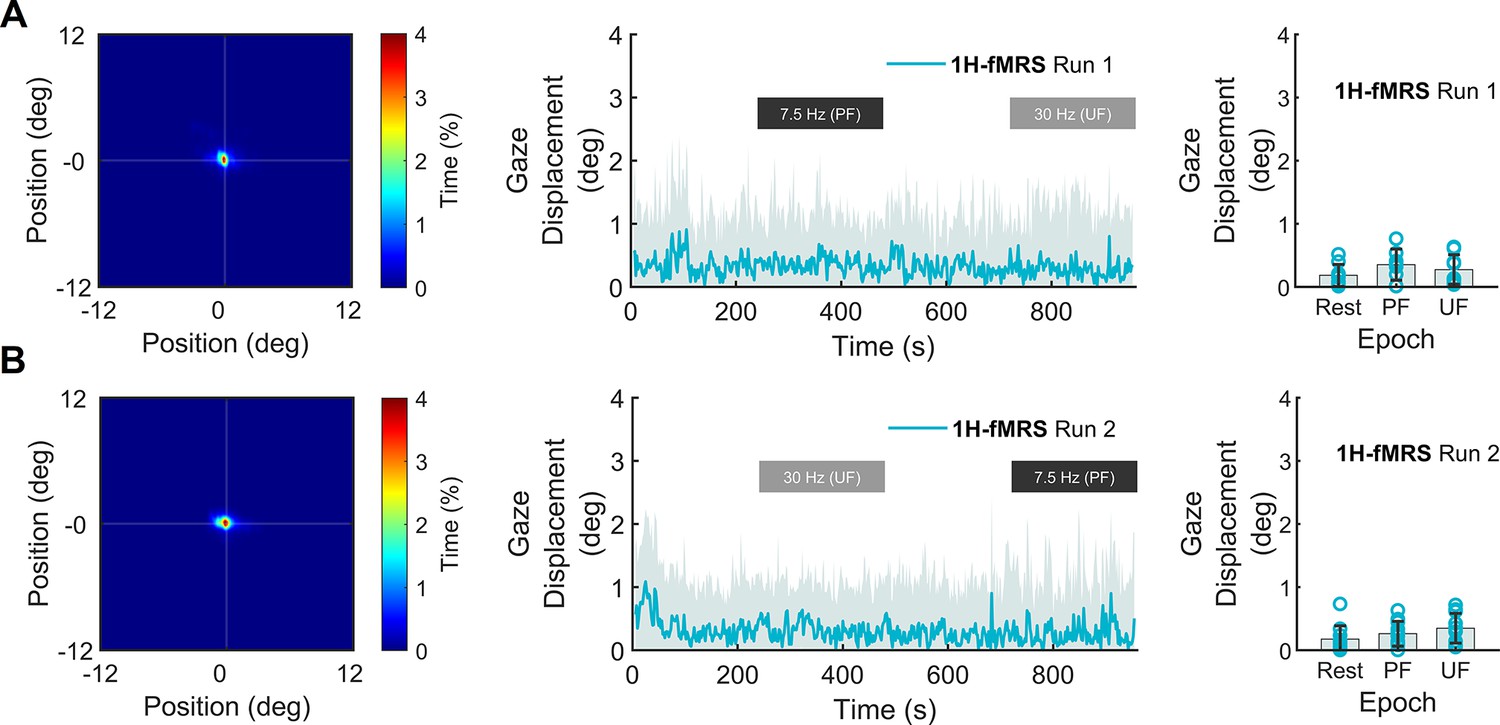
Eye position and gaze displacement during 1H-fMRS (functional magnetic resonance spectroscopy) sessions.
(A, B) Left panels. Average heatmaps of eyes position (across subjects) during 1H-fMRS sessions (runs 1 and 2, respectively). Middle panels. Stability of mean gaze displacement from the fixation point. Right panels. Gaze displacement was not different across conditions.
Figure 3—figure supplement 2
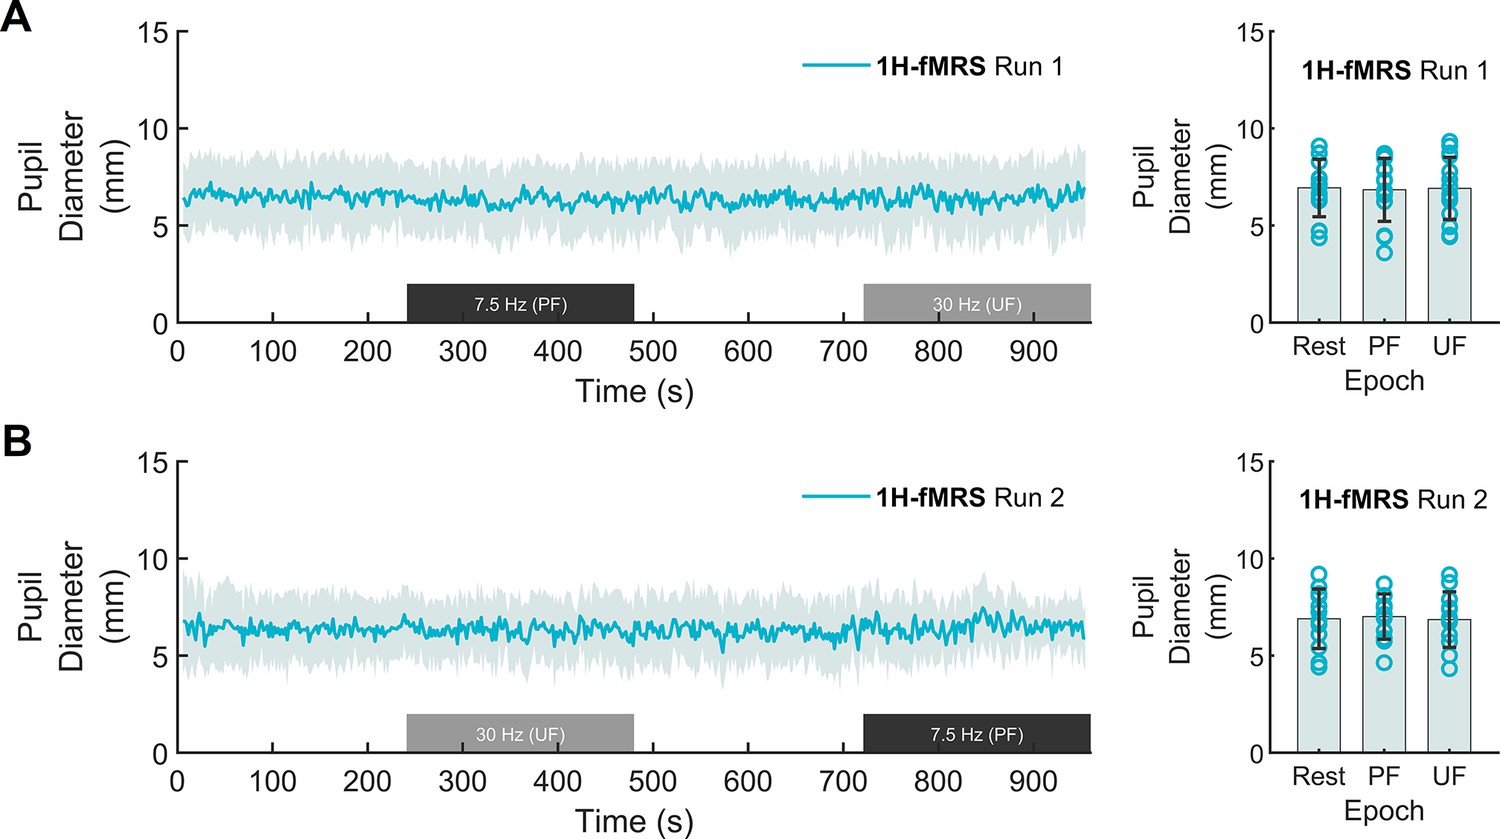
Pupil size dynamics during 1H-fMRS (functional magnetic resonance spectroscopy) sessions.
(A, B) Left panels. Average pupil diameter (across subjects) during 1H-fMRS sessions (runs 1 and 2, respectively). Right panels. Mean pupil diameter was not statistically different across conditions.
Figure 3—figure supplement 3

Task performance during 1H-fMRS (functional magnetic resonance spectroscopy) sessions.
(A, B) Average task performance (across subjects) during 1H-fMRS sessions (runs 1 and 2, respectively). Response delay was not statistically different across conditions.
Figure 3—figure supplement 4
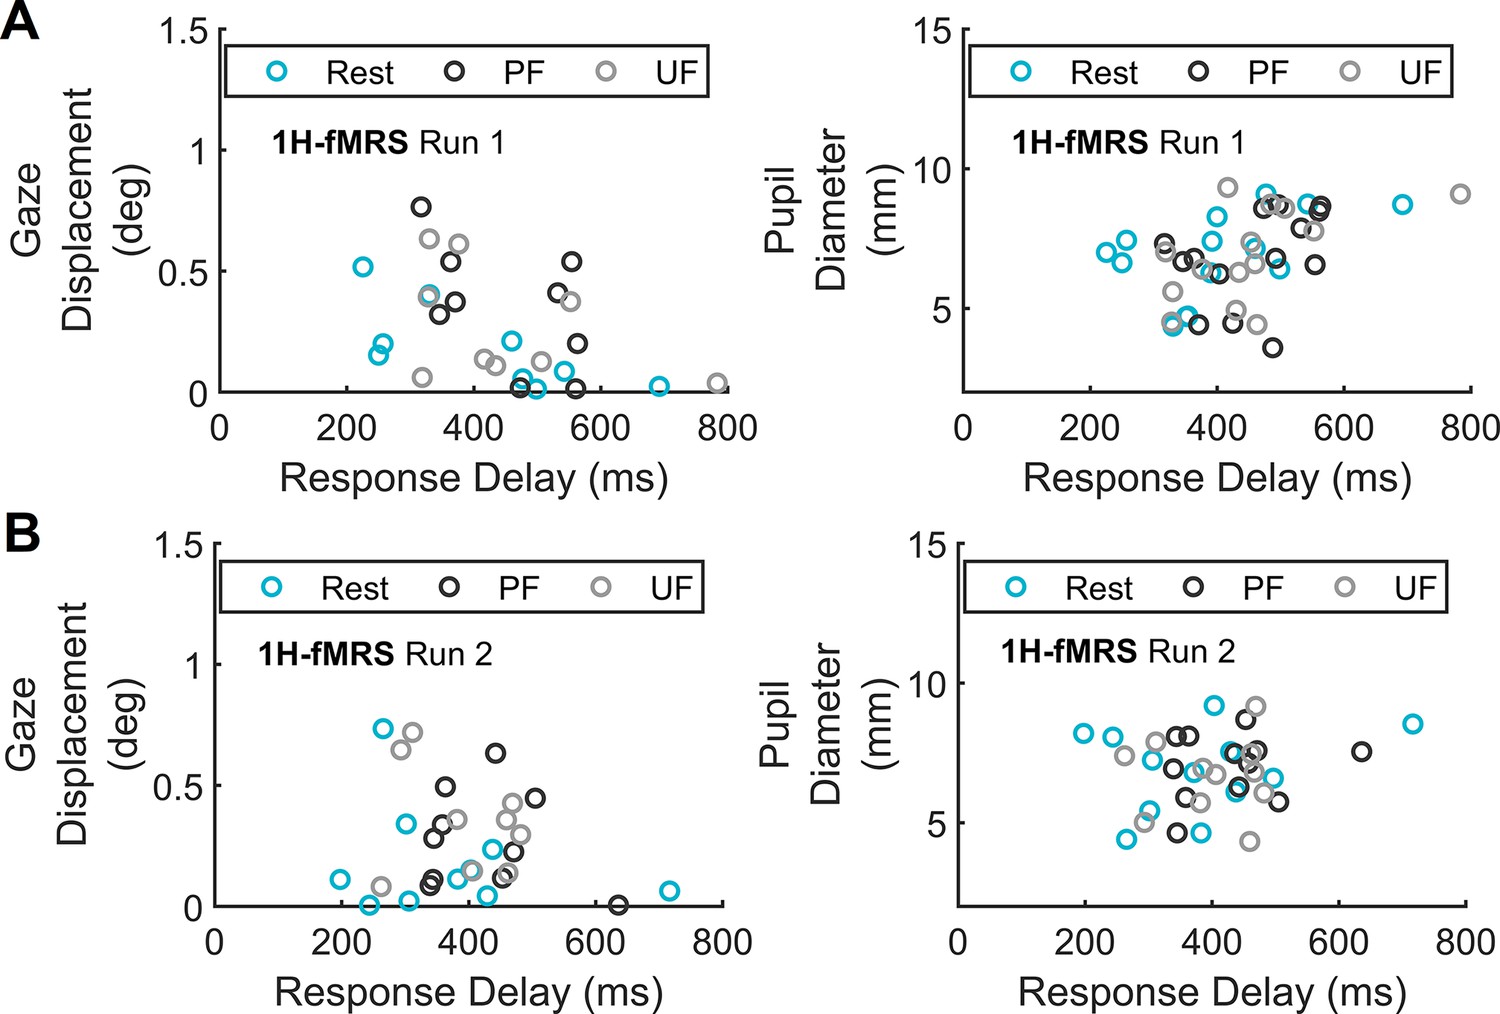
Correlation of task performance with eye position/pupil size during functional magnetic resonance imaging (fMRI) sessions.
(A, B) Correlation between task performance and eye-tracking data during 1H-fMRS (functional magnetic resonance spectroscopy) sessions (runs 1 and 2, respectively). Left panels. There was no correlation between response delay and mean gaze displacement. Right panels. There was no correlation between response delay and mean pupil diameter.
Figure 3—figure supplement 5
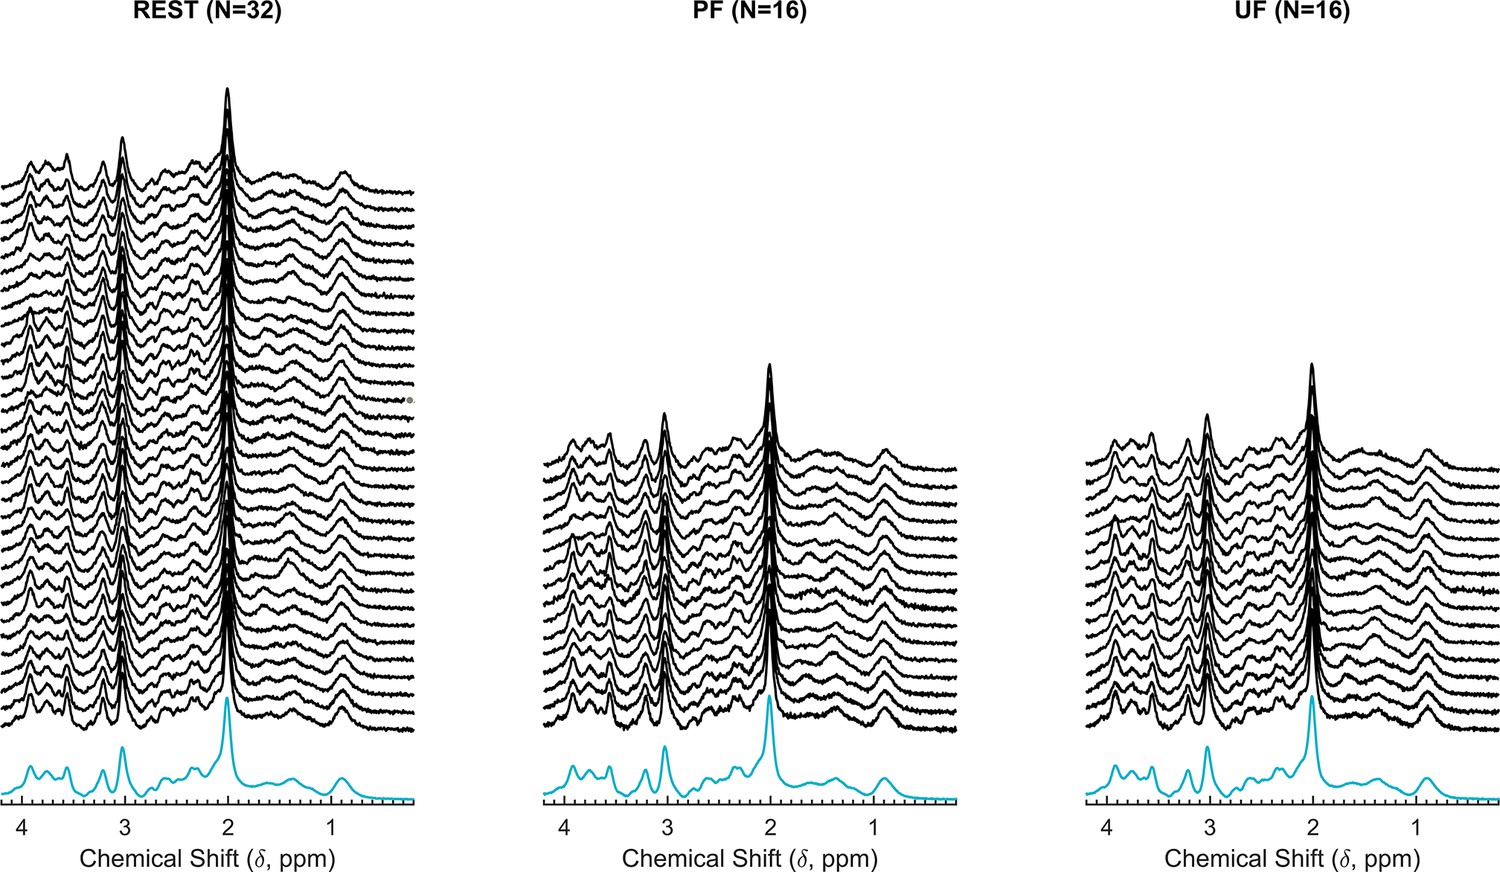
Quality of 1H-fMRS (functional magnetic resonance spectroscopy) spectra.
Averaged spectra across individual epochs (left: REST; center: perceived flickering [PF]; right: unperceived flickering [UF]) of the subset of subjects (N = 16) who had a reliable quantification for both Lac and Glu.
Videos
Video 1
The movie shows the physiological fluctuations of the pupil diameter, as well as the relevant behavioral responses, of a representative subject during a functional magnetic resonance imaging (fMRI) stimulation cycle, which included one unperceived flickering (UF; 30 s) and one perceived flickering (PF; 30 s) epoch.
Additional files
Download links
A two-part list of links to download the article, or parts of the article, in various formats.
Downloads (link to download the article as PDF)
Open citations (links to open the citations from this article in various online reference manager services)
Cite this article (links to download the citations from this article in formats compatible with various reference manager tools)
Perception is associated with the brain’s metabolic response to sensory stimulation
eLife 11:e71016.
https://doi.org/10.7554/eLife.71016


