Role of distinct fibroblast lineages and immune cells in dermal repair following UV radiation-induced tissue damage
- Centre for Stem Cells and Regenerative Medicine, King's College London, Guy's Hospital, United Kingdom
- Centre for Endocrinology, William Harvey Research Institute, Barts and The London School of Medicine, Queen Mary University of London, United Kingdom
- Research Center for Dynamic Living Systems, Graduate School of Biostudies, Kyoto University, Japan
- Division of Signaling and Functional Genomics, German Cancer Research Center (DKFZ), Germany
- Department of Cell and Molecular Biology, Medical Faculty Mannheim, Heidelberg University, Germany
- Division of Musculoskeletal and Dermatological Sciences, Faculty of Biology, Medicine and Health, School of Biological Sciences, Manchester Academic Health Science Centre, The University of Manchester and Salford Royal NHS Foundation Trust, United Kingdom
- The Francis Crick Institute, United Kingdom
Figures
Figure 1 with 2 supplements
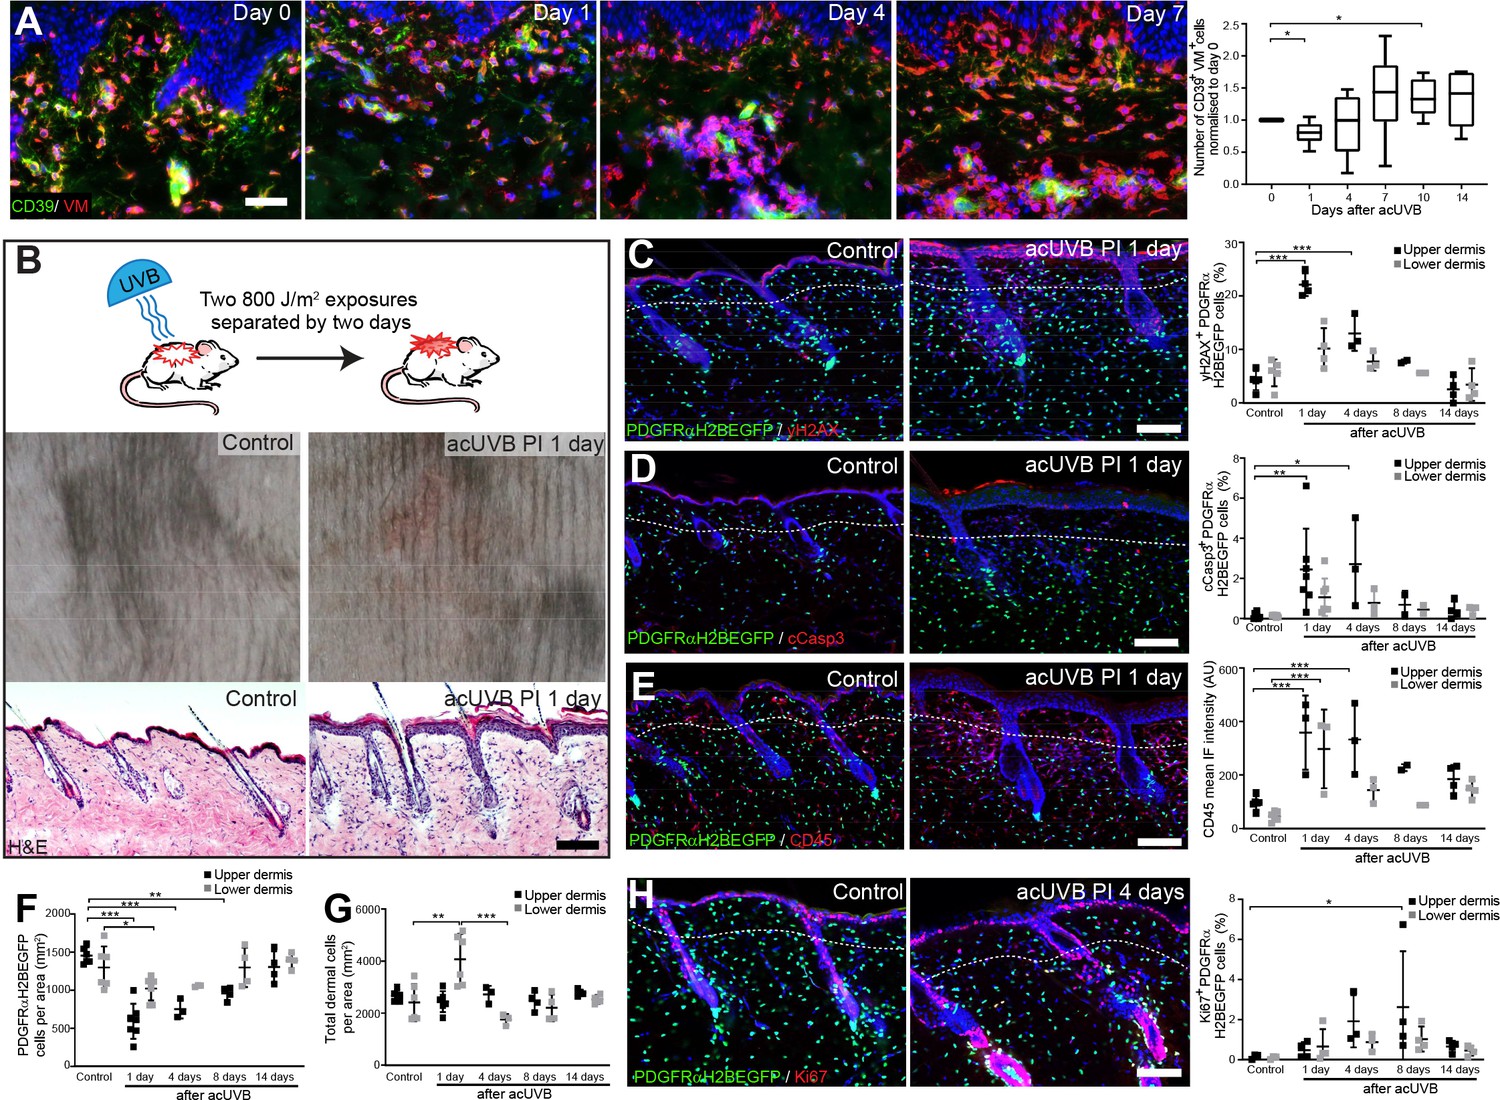
Acute UVB exposure depletes fibroblasts in the papillary dermis.
(A) Immunostaining of human skin for CD39 (green) and vimentin (VM) (red) and quantification of double-positive cells per field of view relative to control skin at indicated time points after acute ultraviolet radiation (acUVR) exposure (n = 6 biological replicates). (B) Experimental design of mouse acUVR model (top panel), representative images of skin erythema (middle panel), and H&E skin section (bottom panel), showing epidermal hyperplasia and increased dermal cell density 1 day after acUVR. (C, D) Representative PDGFRαH2BEGFP sections (green) stained for yH2AX (C), and cCasp3 (D) (red) of control and treated skin and quantification of double-positive cells at indicated time points post-acUVR. Note that the epidermis and upper dermis show pronounced DNA damage (yH2AX+) with clusters of apoptotic cells (cCasp3+) 24 hr post-acUVB. (E) Immunostaining of PDGFRαH2BEGFP back skin (green) for all lymphocytes (CD45; red) and quantification of the CD45 mean fluorescence intensity at indicated time points post-UVR. (F, G) Quantification of dermal fibroblast density (PDGFRαH2BEGFP+) (F) and total dermal density (DAPI+) (G) 24 hr after acUVB in the upper and lower dermis. (H) Representative PDGFRαH2BEGFP sections (green) stained for Ki67 (red) of control and treated skin and quantification of double-positive cells at indicated time points post-acUVR. Note that the epidermis and upper dermis show increased proliferation 4 days after acUVB.Nuclei labelled with DAPI and dashed white line delineates upper and lower dermis. Scale bars, 50 μm. Data are mean ± SD. *p<0.05, **p<0.01, ***p<0.001. Source data of shown quantifications are summarised in Figure 1—source data 1.
-
Figure 1—source data 1
Source data of quantifications represented as graphs in Figure 1.
- https://cdn.elifesciences.org/articles/71052/elife-71052-fig1-data1-v2.xlsx
Figure 1—figure supplement 1
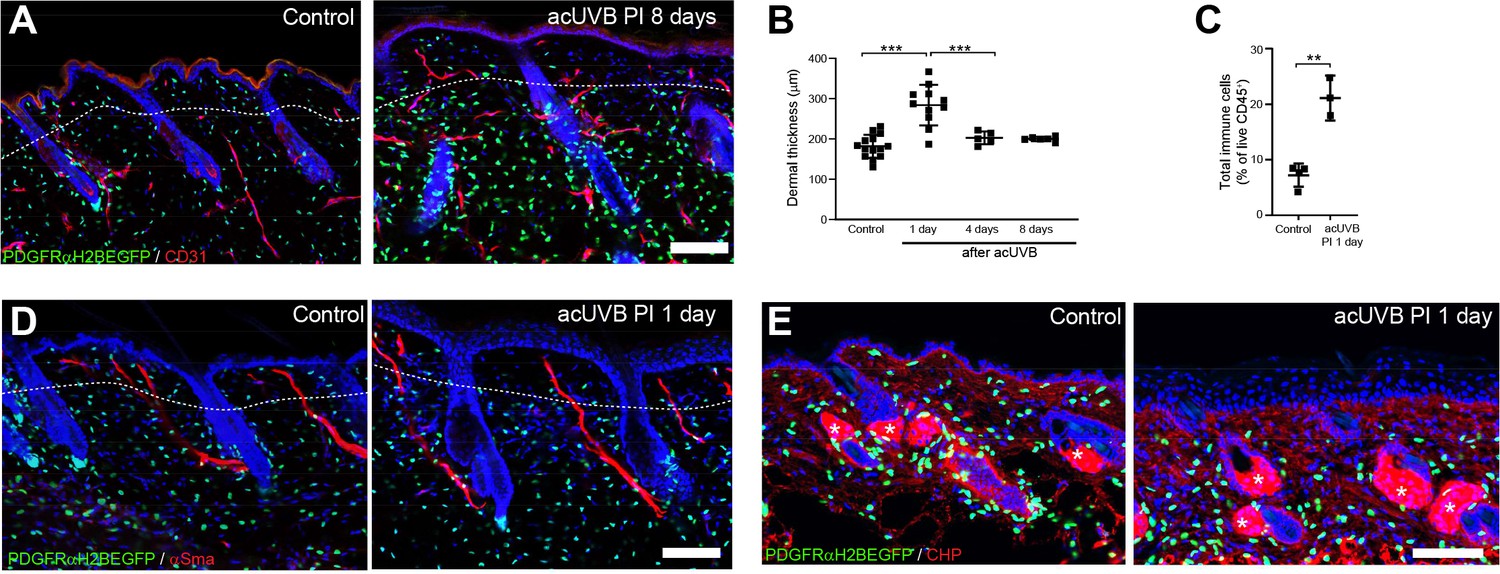
Dermal changes after acute ultraviolet radiation (UVR) exposure.
(A) Immunostaining of control and acute UVR (acUVR)-exposed PDGFRαH2BEGFP back skin (green) for blood vessels (CD31; red) after 8 days. (B) Changes in dermal thickness of the papillary and reticular layer after acUVB exposure at indicated time points . (C) FACS analysis of live CD45+ skin cells at 1 day after acUVB quantified as percentage from total live skin cell isolation. (D, E) Immunostaining of control and acUVR-exposed PDGFRαH2BEGFP back skin (green) for αSma (red) (D) and collagen (red) using the collagen hybridising peptide (CHP)-biotin probe after 1 daypost-UVR (E). White asterisks indicate unspecific CHP staining in sebaceous glands in (E). Nuclei were labelled with DAPI (blue), and dashed white line delineates upper and lower dermis. Scale bars, 50 μm. Data are mean ± SD. **p<0.01, ***p<0.001. Source data of shown quantifications are summarised in Figure 1—figure supplement 1—source data 1.
-
Figure 1—figure supplement 1—source data 1
Source data of quantifications represented as graphs in Figure 1—figure supplement 1.
- https://cdn.elifesciences.org/articles/71052/elife-71052-fig1-figsupp1-data1-v2.xlsx
Figure 1—figure supplement 2
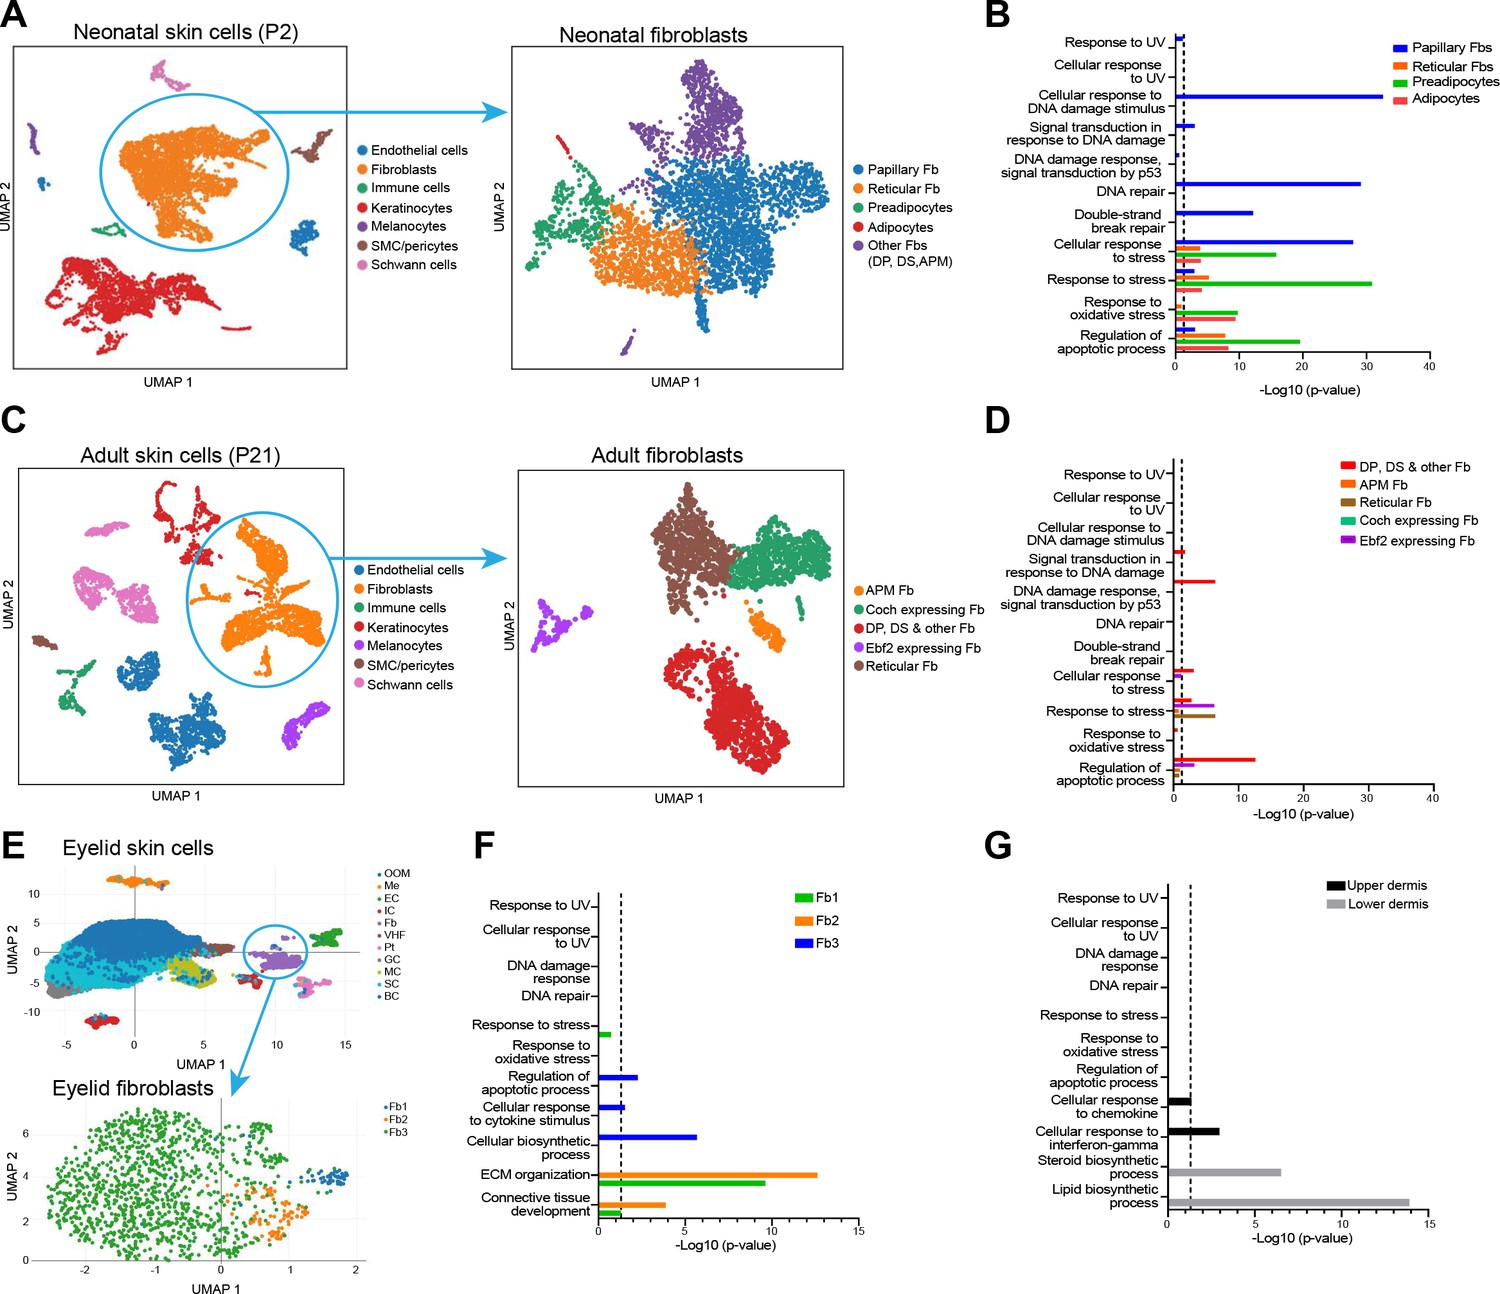
Transcriptomic analysis of mouse and human skin fibroblasts.
(A) UMAP visualisation of neonatal (P2) mouse skin cell populations (left panel) and fibroblast cluster analysis of the UMAP plot (right panel) (Phan et al., 2020). Each cell is colour coded according to the label. (B) Gene Ontology (GO) term analysis of upregulated entities in different fibroblast subpopulation clusters related to UV response, DNA repair/damage, apoptosis, and cell stress. (C) UMAP visualisation of adult (P21) skin cell populations (left panel) and fibroblast cluster analysis of the UMAP plot (right panel) (Phan et al., 2020). Each cell is colour coded according to the label. (D) GO term analysis of upregulated entities in different fibroblast subpopulation clusters related to UV response, DNA repair/damage, apoptosis, and cell stress. (E) UMAP visualisation of human eyelid skin cell populations (upper panel) and fibroblast cluster analysis of the UMAP plot (lower panel). Each cell is colour coded according to the label. Fb1&2 subpopulations have been identified as reticular fibroblast and Fb3 as papillary fibroblasts (Zou et al., 2021). (F) GO term analysis of upregulated entities in different fibroblast subpopulation clusters related to UV response, DNA repair/damage, apoptosis, and cell stress as well as fibroblast subpopulation functions (extracellular matrix [ECM], biosynthesis, and immune signalling). (G) GO term analysis of upregulated entities in microdissected upper and lower dermis (Philippeos et al., 2018) related to UV response, DNA repair/damage, apoptosis, and cell stress as well as dermal layer functions (immune signalling and lipid metabolism). (B, D, G) Dotted line indicates significance threshold of p=0.05. P, postnatal day; Fb, fibroblast; APM, arrector pili muscle; DP, dermal papilla; DS, dermal sheath; OOM, orbicularis oculi muscle; MC, mitotic cell; BC, basal cell; VHF, vellus hair follicle; Me, melanocyte; SC, spinous cell; GC, granular cell; EC, endothelial cell; IC, immune cell; LC, Langerhans cell; Pt, pericyte. Source data of GO term analysis are summarised in Figure 1—figure supplement 2—source data 1.
-
Figure 1—figure supplement 2—source data 1
Source data of Gene Ontology (GO) term analysis shown in Figure 1—figure supplement 2.
Files include the analysis protocol files of P2 and P21 mouse skin single-cell RNA-seq datasets and GO term enrichment analysis of indicated datasets and figure panel.
- https://cdn.elifesciences.org/articles/71052/elife-71052-fig1-figsupp2-data1-v2.zip
Figure 2 with 1 supplement
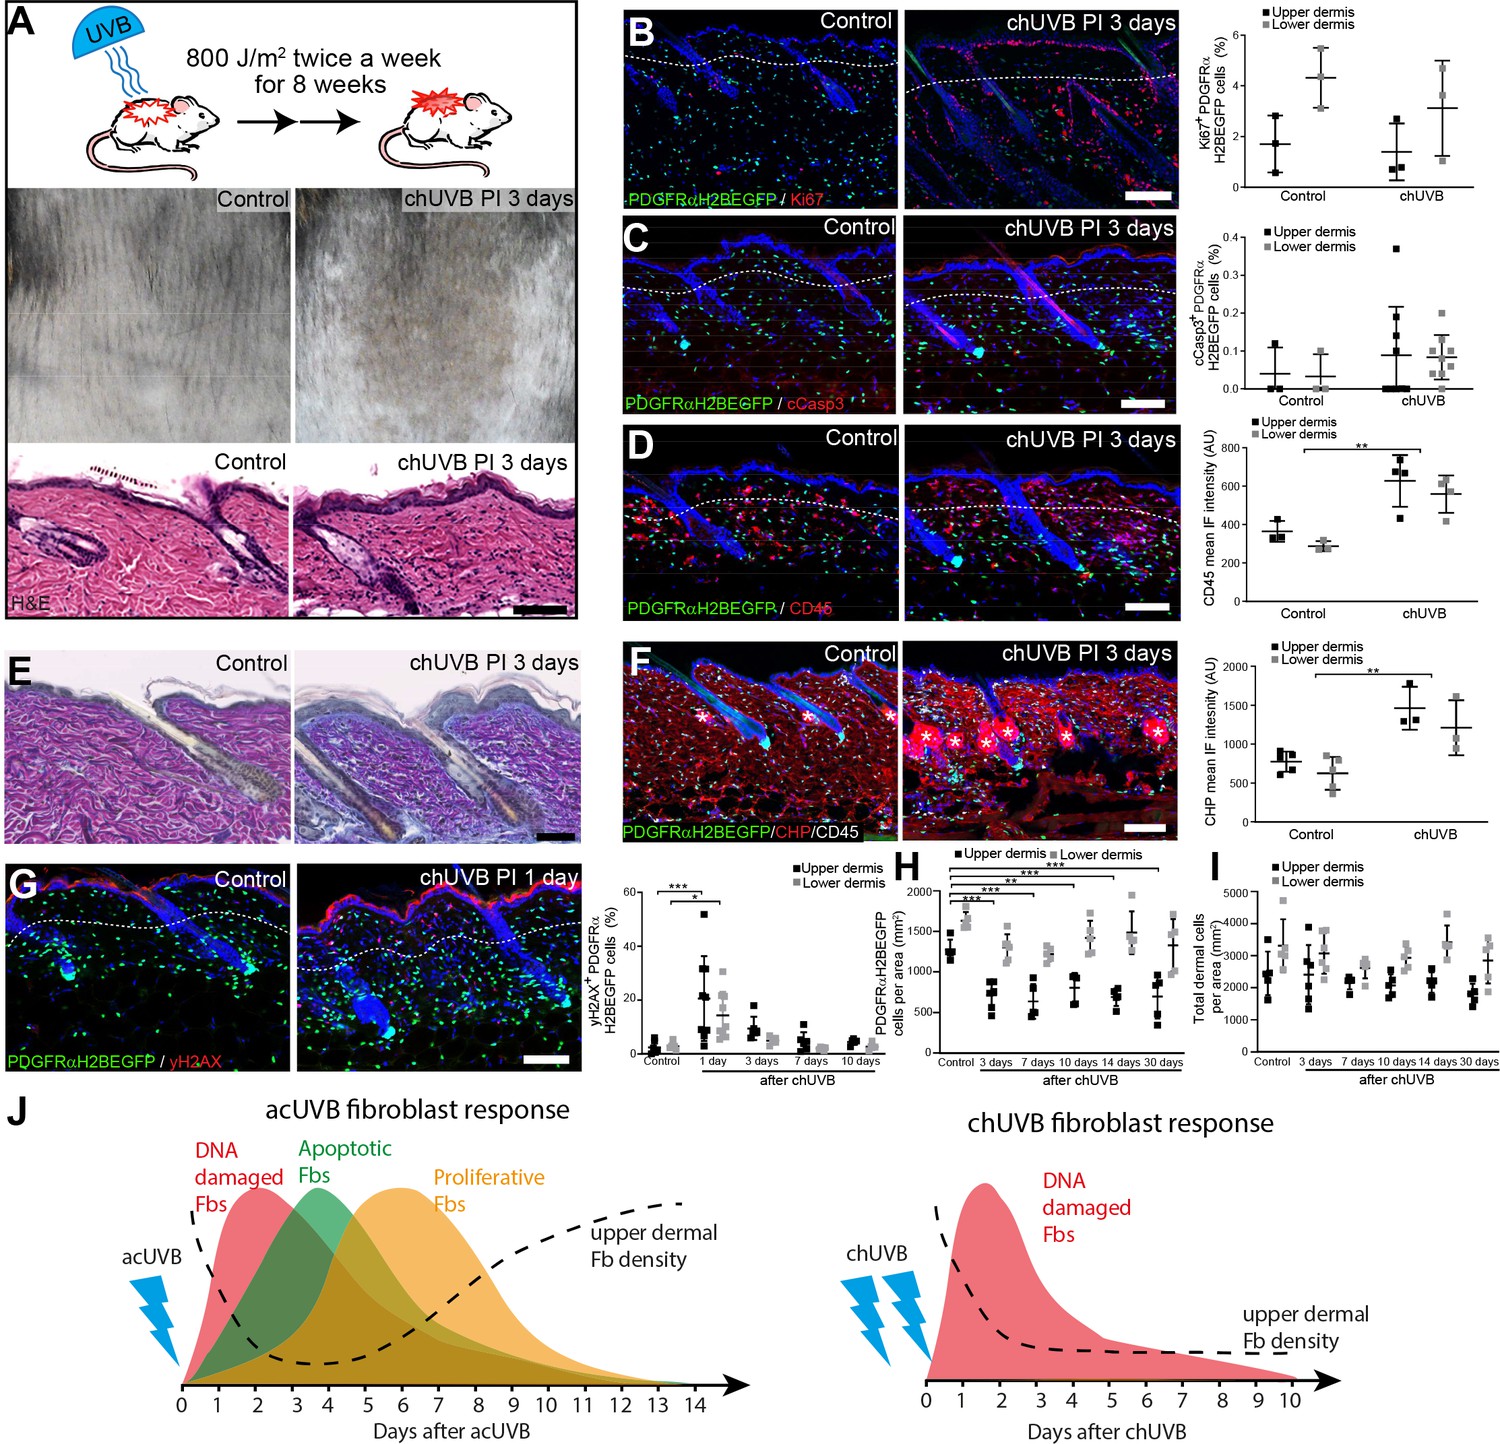
Chronic UVB irradiation leads to a permanent loss of papillary fibroblast in the upper dermis and changes in the extracellular matrix (ECM) environment.
(A) Experimental design (top panel), representative skin tanning (middle panel), and H&E section (bottom panel), showing epidermal hyperplasia, ECM changes, and increased dermal cell density after chronic UVB (chUVB). (B–D) Representative PDGFRαH2BEGFP sections (green) stained for Ki67 (B), cCasp3 (C), and CD45 (D) (red) of control and treated skin and quantification of either double-positive cells (Ki67 and cCasp3) or mean fluorescence intensity (CD45). While lymphocytes (CD45+ cells) are increased in the dermis, pronounced proliferation (Ki67+) and apoptosis (cCasp3+) are only observed in the epidermis after chUVB. (E) Herovici staining of control and chUVB-exposed skin sections. Note that pink/purple staining indicates mature collagen, whereas light blue-stained collagen in chUVB skin below the basement membrane is immature and actively remodelled. (F) Immunofluorescence staining of control and chUVB PDGFRαH2BEGFP skin (green) for CD45 (white) and collagen (red) using the collagen hybridising peptide (CHP)-biotin probe. Mean CHP fluorescence signal was quantified, and increased CHP signal in chUVB skin indicates a more fibrillar, open, and/or damaged collagen structure. White asterisks indicate unspecific CHP staining in sebaceous glands. (G) Immunostaining of control and chUVR-exposed PDGFRαH2BEGFP back skin (green) for yH2AX (red) and quantification of double-positive cells at indicated time points. Note that the epidermis and dermis show pronounced DNA damage (yH2AX+) at 24 hr after ultraviolet radiation (UVR) which is repaired over time. (H, I) Quantification of dermal fibroblast (PDGFRαH2BEGFP+) (H) and total dermal cell density (DAPI+) (I) after chUVB. (J) Comparison of acute UVR (acUVR) and chUVR fibroblast tissue damage repair response. While acUVR induced a transient fibroblast depletion caused by DNA damage, fibroblast apoptosis, and following proliferation, chUVR led to a persistent loss of fibroblasts in the papillary dermis. Nuclei were labelled with DAPI (blue), and dashed white line delineates upper and lower dermis. Scale bars, 50 μm. Data are mean ± SD. *p<0.05, **p<0.01, ***p<0.001. Source data of shown quantifications are summarised in Figure 2—source data 1.
-
Figure 2—source data 1
Source data of quantifications represented as graphs in Figure 2.
- https://cdn.elifesciences.org/articles/71052/elife-71052-fig2-data1-v2.xlsx
Figure 2—figure supplement 1
Dermal changes after chronic ultraviolet radiation (UVR) exposure.
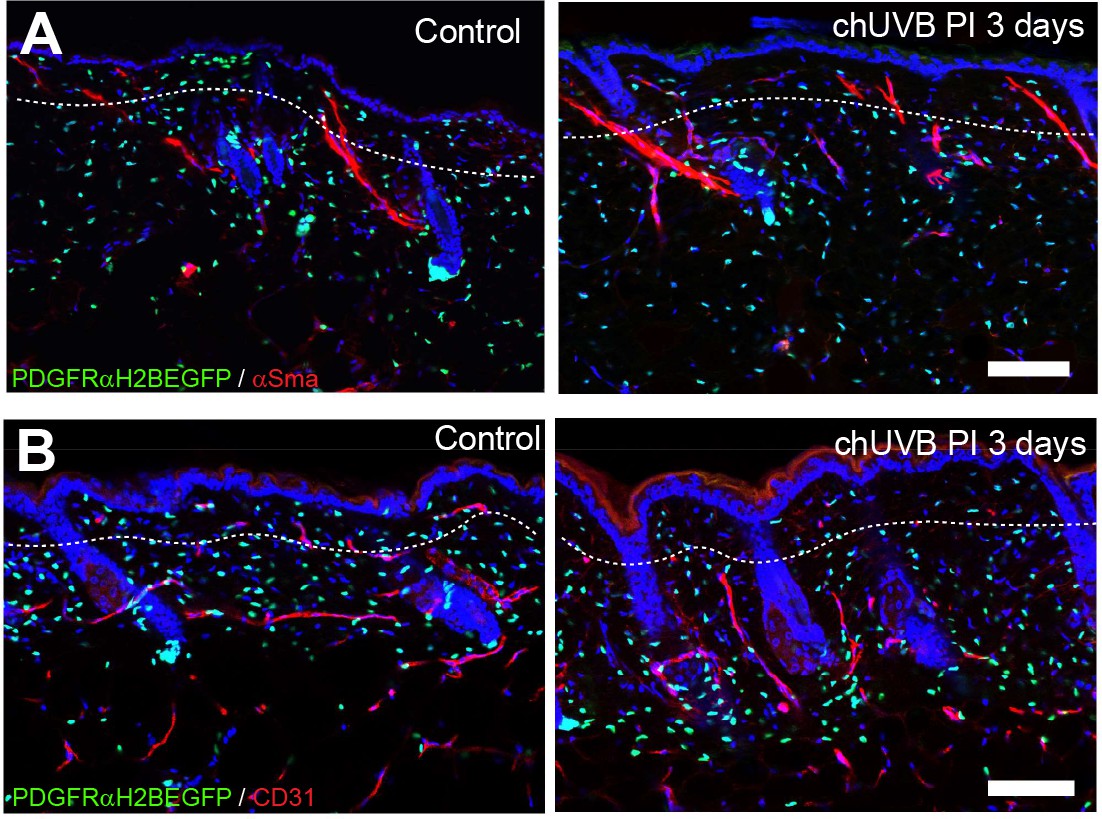
(A, B) Immunostaining of control and chronic UVR (chUVR)-exposed PDGFRαH2BEGFP back skin (green) for αSma (red) (A) and blood vessels (CD31; red) after chUVB exposure (B). Nuclei were labelled with DAPI (blue), and dashed white line delineates upper and lower dermis. Scale bars, 50 μm.
Figure 3 with 1 supplement
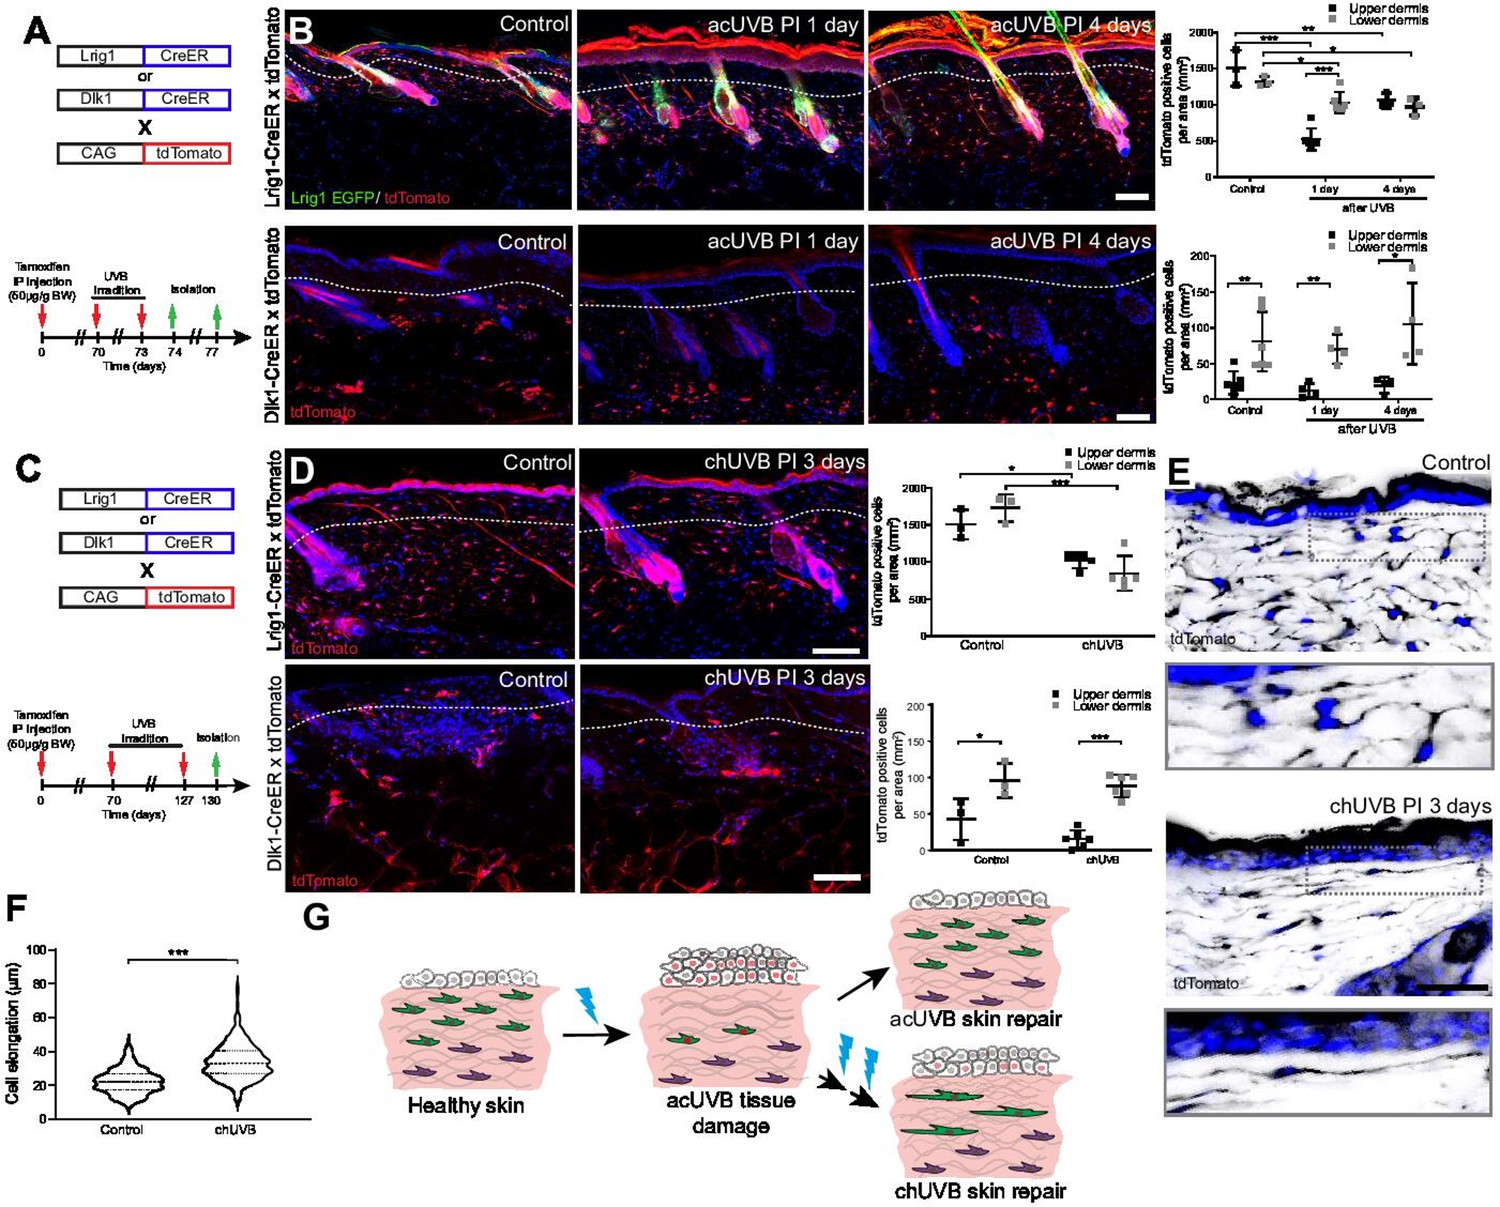
Only fibroblast lineages of the papillary dermis contribute to ultraviolet radiation (UVR)-induced tissue repair and fibroblasts in chronic UVR-exposed skin are more elongated.
(A, B) In vivo lineage tracing of distinct dermal fibroblast populations during tissue damage repair after acute UVB (acUVB). (A) Experimental design shows breeding strategy and skin isolation time points to follow fibroblast lineages during tissue repair. (B) Representative immunofluorescence image and quantification of Lrig1-CreER × tdTomato (top panels) and Dlk1-CreER × tdTomato (lower panels) back skin of control and acUVB-exposed skin after 1 and 4 days. Quantification shows labelled cells in the upper and lower dermis at indicated time points. (C, D) In vivo lineage tracing of distinct dermal fibroblast populations during chUVR. (C) Experimental design shows breeding and lineage-tracing strategy for chronic UVB (chUVB)-exposed skin. (D) Immunofluorescence image and quantification of Lrig1-CreER × tdTomato (top panels) and Dlk1-CreER × tdTomato (lower panels) back skin of control and chUVB-exposed skin 3 days after last UVR exposure. Quantification shows labelled tdTomato+ cells in the upper and lower dermis. (E, F) Closeup of Lrig1-CreER × tdTomato lineage-traced skin section showing cytoplasmic tdTomato signal (black) (E) and quantification of papillary fibroblast elongation in control and chUVB-exposed skin (F) (n = 300 cells from four biological replicates). Boxed areas in (E) indicate magnified fibroblasts shown below. Note that although fibroblast density in chUVB skin is reduced (D), fibroblast membrane protrusions are increased. (G) Summary of UVR-induced tissue damage and skin regeneration after acute and prolonged (chronic) UVB exposure. In healthy skin, papillary (green) and reticular (violet) fibroblasts are quiescent. After acUVR exposure, papillary fibroblasts are depleted and epidermal and dermal cells start proliferating (red nucleus) during the tissue repair response. While fibroblast density and skin homeostasis are restored after acUVB tissue damage, repeated UVB exposure leads to a permanent loss and elongation of papillary fibroblasts and changes in the extracellular matrix (ECM) structure characteristic of aged skin. Nuclei were labelled with DAPI (blue), and dashed white line delineates upper and lower dermis. Scale bars, 50 μm. Data are mean ± SD. *p<0.05, **p<0.01, ***p<0.001. Source data of shown quantifications are summarised in Figure 3—source data 1.
-
Figure 3—source data 1
Source data of quantifications represented as graphs in Figure 3.
- https://cdn.elifesciences.org/articles/71052/elife-71052-fig3-data1-v2.xlsx
Figure 3—figure supplement 1
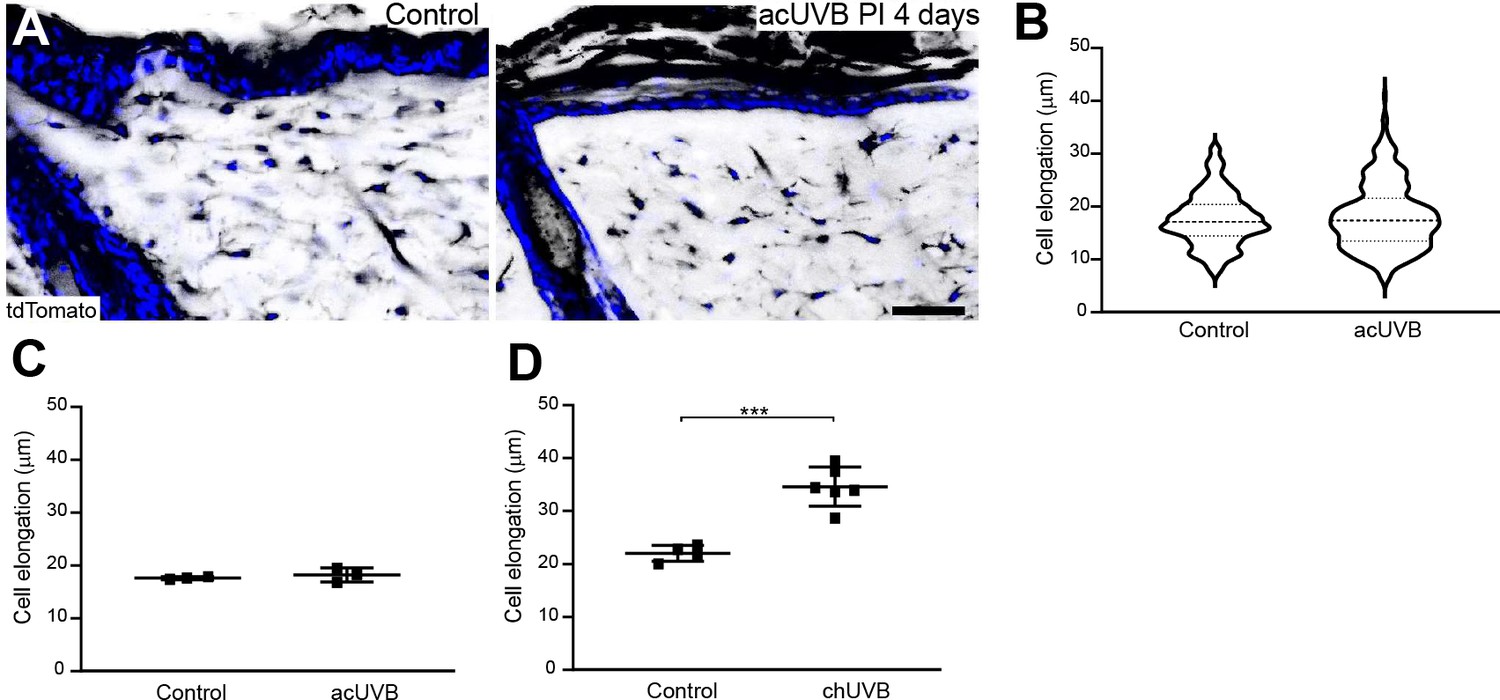
Fibroblast shape and size at 4 days after acute UVB (acUVB) exposure in the papillary dermis.
(A, B) Lrig1-CreER × tdTomato lineage-traced skin sections at 4 days post-acUVB or control, showing cytoplasmic tdTomato signal (black) (A) and quantification of papillary fibroblast elongation in control and acUVB-exposed skin (n = 300 cells from three biological replicates) (B). Note that in contrast to chronic UVB (chUVB) (Figure 3E and F), acUVB did not induce significant changes in papillary fibroblast cell shape. Nuclei were labelled with DAPI (blue) Scale bars, 50 μm. Data are mean ± SD. ***p<0.001. Source data of shown quantifications are summarised in Figure 3—figure supplement 1—source data 1.
-
Figure 3—figure supplement 1—source data 1
Source data of quantifications represented as graphs in Figure 3—figure supplement 1.
- https://cdn.elifesciences.org/articles/71052/elife-71052-fig3-figsupp1-data1-v2.xlsx
Figure 4 with 4 supplements
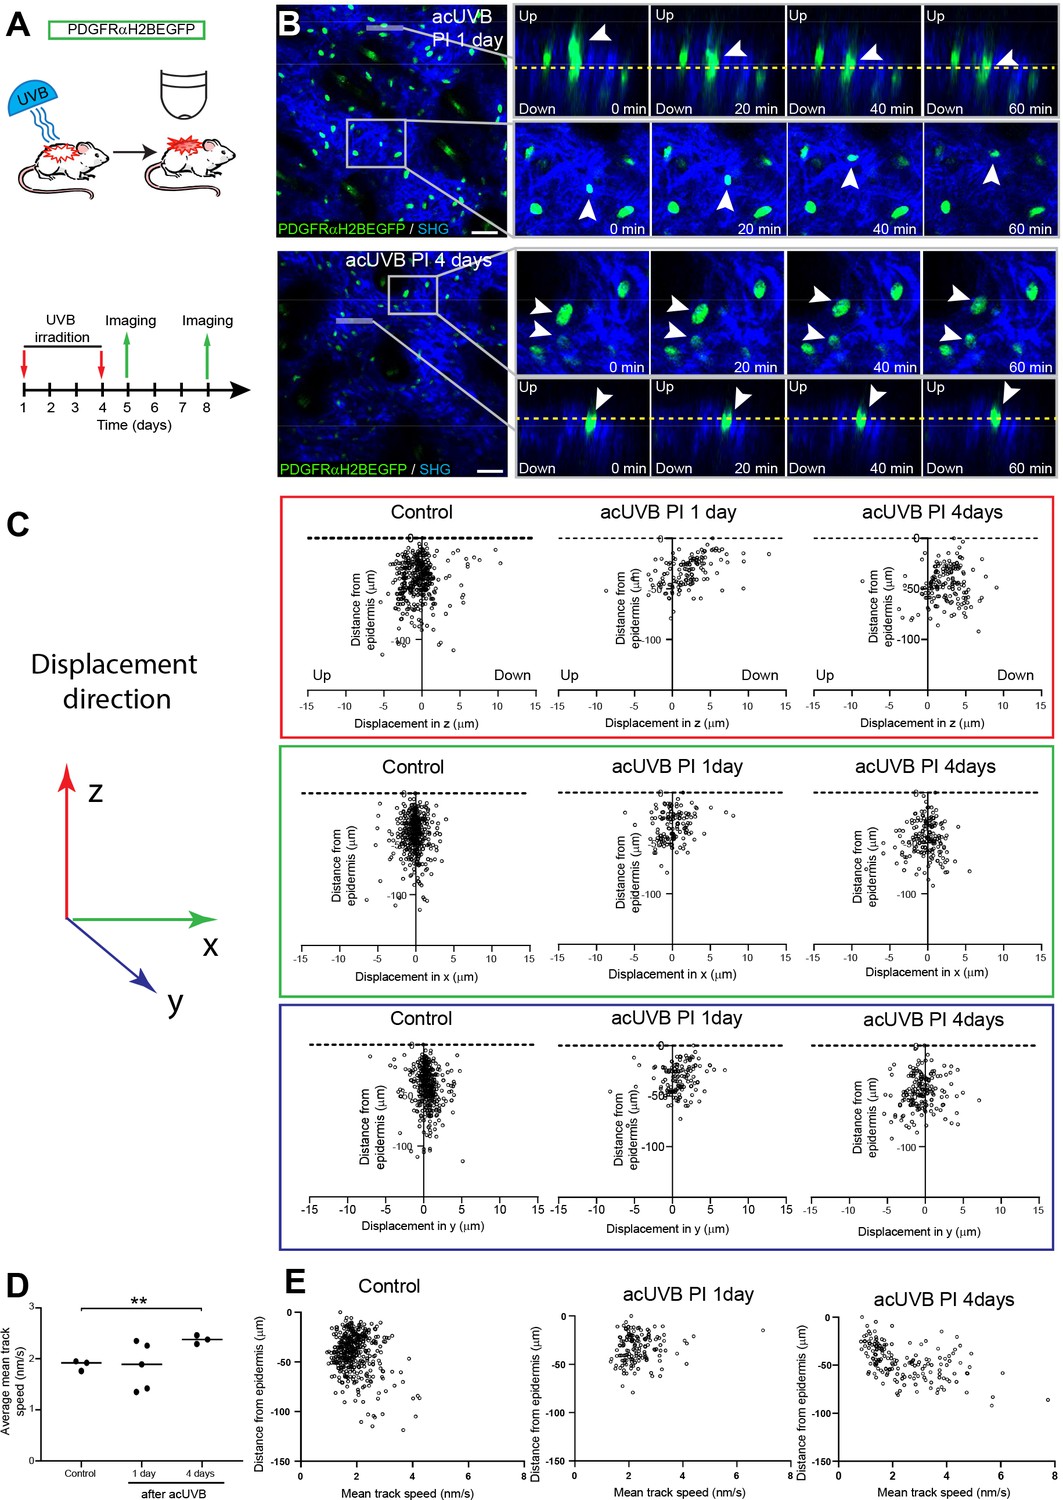
Fibroblasts in the papillary dermis become more motile during the ultraviolet radiation (UVR) tissue repair response.
(A) Experimental design for live imaging of adult PDGFRαH2BEGFP back skin during acute UVB (acUVB)-induced tissue damage repair. (B) Representative time-lapse images of adult PDGFRαH2BEGFP (green) dermis 1 day (upper panel, relates to Figure 4—video 2) and 4 days (lower panel, relates to Figure 4—video 3) post-acUVB with collagen shown as second harmonic generation (SHG) in blue at indicated imaging time points. Line indicates orthogonal closeup to follow vertical cell displacement, and box shows fibroblast movement in the horizontal plane. Arrowheads in closeups indicate cells migrating, and dashed line is for orientation. (C) Scatter plots of the displacement along the indicated axis (z-, red; x-, green; y-axis, blue) of individual control and acUVB-treated cells in their relative z-location (distance from epidermis). (D) Average mean cell displacement speed of imaged control and acUVB-exposed back skin after 1 and 4 days. (E) Scatter plots of mean velocity of individual cells in their relative z-location from representative control and acUVB-treated animals after 1 and 4 days post-UVB. Scale bars, 50 μm. *p<0.05. Source data of quantifications are summarised in Figure 4—source data 1.
-
Figure 4—source data 1
Source data of quantifications represented as graphs in Figure 4.
- https://cdn.elifesciences.org/articles/71052/elife-71052-fig4-data1-v2.xlsx
Figure 4—figure supplement 1
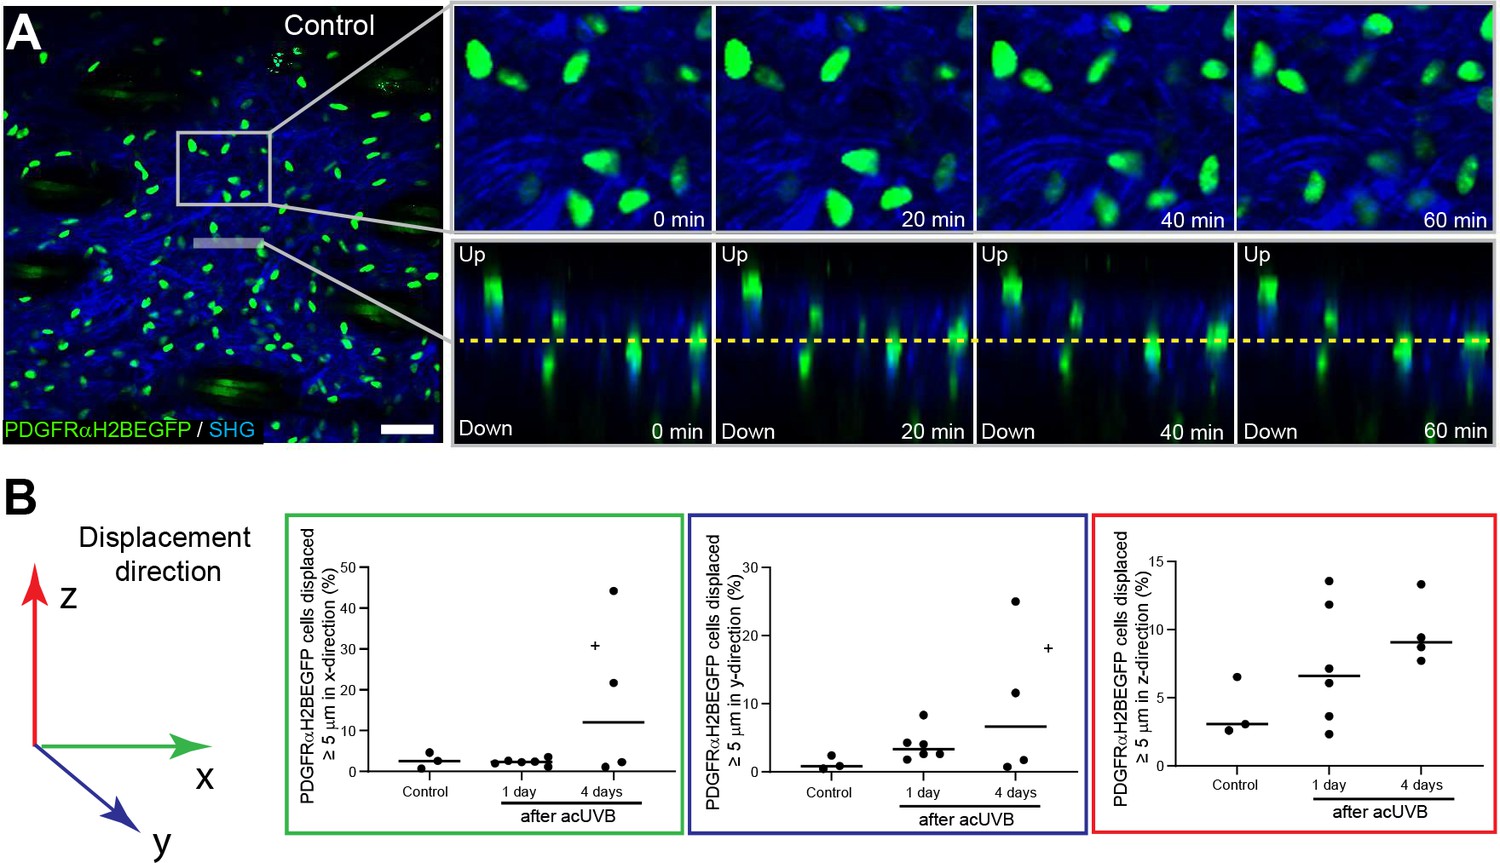
Live imaging of control skin and fibroblast displacement direction.
(A) Representative time-lapse images with selected closeups of adult PDGFRαH2BEGFP (green) dermis non-irradiated (control) with collagen shown as second harmonic generation (SHG) in blue at indicated imaging time points. Line indicates orthogonal closeup to follow vertical cell displacement, and box shows fibroblast movement in the horizontal plane (relates to Figure 4—video 1). Note that in control skin the cell displacement is minimal. Scale bar, 50 μm. (B) Percentage of cells with a displacement of ≥5 µm in x- (green box), y- (blue box), and z-direction (red box) in control and acute UVB (acUVB)-exposed back skin after 1 and 4 days. Source data of quantifications are summarised in Figure 4—figure supplement 1—source data 1.
-
Figure 4—figure supplement 1—source data 1
Source data of quantifications represented as graphs in Figure 4—figure supplement 1.
- https://cdn.elifesciences.org/articles/71052/elife-71052-fig4-figsupp1-data1-v2.xlsx
Figure 4—video 1
In vivo live imaging of sham-exposed back skin (control).
Figure 4—video 2
In vivo live imaging of acute UVB (acUVB)-exposed back skin after 1 day (acUVB PI 1 day).
Figure 4—video 3
In vivo live imaging of acute UVB (acUVB)-exposed back skin after 4 days (acUVB PI 4 days).
Figure 5 with 1 supplement
Induction of fibroblast proliferation is not sufficient to restore dermal homeostasis after ultraviolet radiation (UVR) exposure.
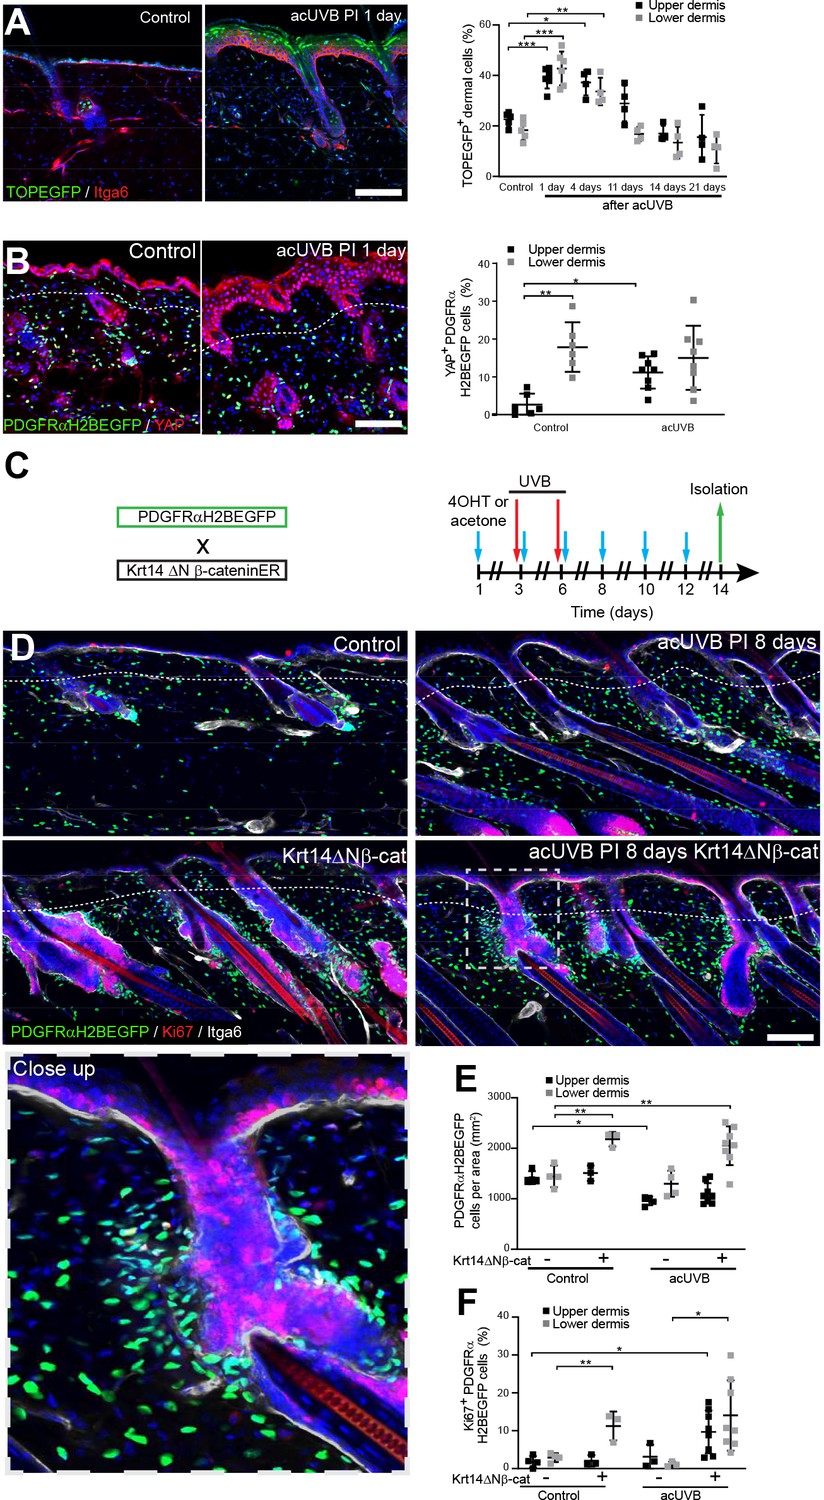
(A) Representative Wnt signalling reporter (TOPEGFP) sections of control and treated skin stained for Itga6 (red). H2BEGFP (green) is expressed under the control of multiple Lef1/TCF binding sites reporting active Wnt/β-catenin signalling (Ferrer-Vaquer et al., 2010).Quantification of TOPEGFP-positive dermal cells in control and UVR-treated skin is shown. Note that Wnt/β-catenin signalling is increased in the epidermis as well as in the dermis. (B) Representative PDGFRαH2BEGFP back skin sections (green) stained for YAP (red) 1 day after acute UVB (acUVB) exposure. Quantification of PDGFRαH2BEGFP-positive cells with nuclear YAP in the upper and lower dermis is shown. Nuclear YAP is increased in the papillary dermis and IFE after acUVB exposure. (C) Experimental strategy for increasing fibroblast proliferation during acUVB damage tissue repair by stabilising epidermal β-catenin (Krt14ΔNβ-cat transgenic). (D) Representative PDGFRαH2BEGFP back skin sections (green) of indicated transgenics stained for Ki67 (red) 8 days post-UVR. Dashed box indicates closeup area shown in the lower panel. (E, F) Quantification of dermal fibroblast density (PDGFRαH2BEGFP+) (E) and proliferation (Ki67+ PDGFRαH2BEGFP cells) (F) in the indicated treatment conditions. Nuclei were labelled with DAPI (blue), and dashed white line delineates upper and lower dermis. Scale bars, 50 μm. Data are mean ± SD. *p<0.05, **p<0.01, ***p<0.001. Source data of quantifications shown are summarised in Figure 5—source data 1.
-
Figure 5—source data 1
Source data of quantifications represented as graphs in Figure 5.
- https://cdn.elifesciences.org/articles/71052/elife-71052-fig5-data1-v2.xlsx
Figure 5—figure supplement 1
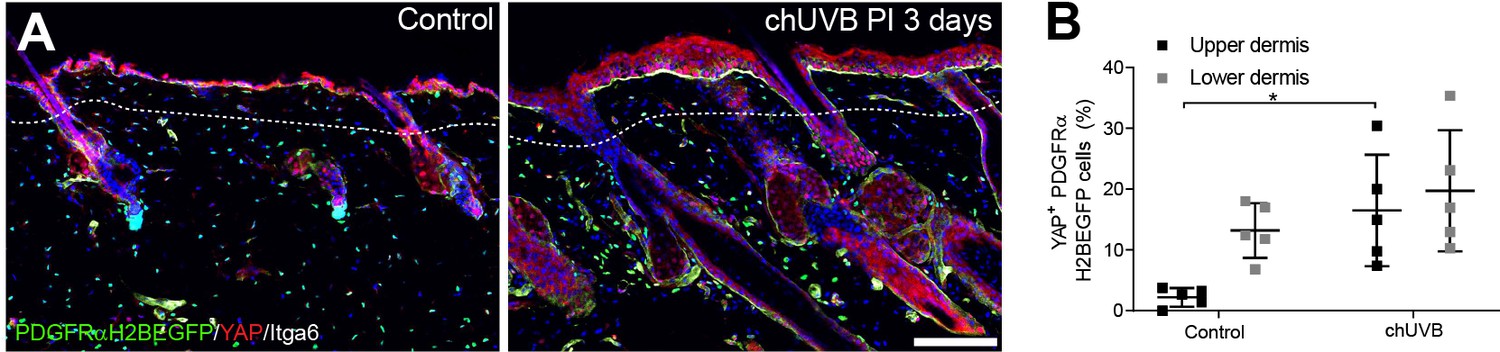
YAP localisation in chronic UVB (chUVB)-treated skin.
(A, B) Immunofluorescence staining of control and chUVB-exposed PDGFRαH2BEGFP skin (green) for YAP (red) (A) and quantification of fibroblast with nuclear YAP in the upper and lower dermis (B). Nuclei were labelled with DAPI (blue), and dashed white line delineates upper and lower dermis. Scale bar, 50 μm. Data are mean ± SD. *p<0.05. Source data of quantification are summarised in Figure 5—figure supplement 1—source data 1.
-
Figure 5—figure supplement 1—source data 1
Source data of quantification represented as graph in Figure 5—figure supplement 1.
- https://cdn.elifesciences.org/articles/71052/elife-71052-fig5-figsupp1-data1-v2.xlsx
Figure 6 with 1 supplement

Cutaneous T cells redistribute in response to acute UVB (acUVB) exposure and influence dermal fibroblast survival.
(A–C) Immunostaining of CD3 (CD3+ T cells) (A), CD8 (cytotoxic T cells) (B), and FoxP3+ (Tregs) (C), in red. Note the pronounced depletion of CD3+ T cells in the epidermis and redistribution of activated Tregs (white arrow heads) and cytotoxic T cells in the interfollicular dermis 3 days after acute ultraviolet radiation (acUVR). (D–I) CD4- and CD8-positive cell depletion increased fibroblast loss in the upper dermis after acUVB. (D) Experimental strategy for antibody-based immune cell depletion during acUVB (blue arrow, antibody injection; red arrow, UVB; green arrow, skin isolation) (top panel). Antibody depletion was assessed by FACS analysis of cutaneous CD4- and CD8-positive cells. Absolute number quantifications are for 6 cm2 (bottom panels). (E) Representative immunostaining of PDGFRαH2BEGFP back skin (green) for Ki67 (red) and αSma (white). (F–I) Quantification of dermal fibroblast density (PDGFRαH2BEGFP+) (F), DNA damage (yH2AX + PDGFRαH2BEGFP cells) (G), apoptosis (cCasp3 + PDGFRαH2BEGFP cells) (H), and proliferation (Ki67+ PDGFRαH2BEGFP cells) (I) after acUVB and indicated treatment conditions. Nuclei were labelled with DAPI (blue), and dashed white line delineates upper and lower dermis. Scale bar, 50 μm. IP, intraperitoneal injection. Data are mean ± SD. *p<0.05, **p<0.01, ***p<0.001. Source data of quantifications are summarised in Figure 6—source data 1.
-
Figure 6—source data 1
Source data of quantifications represented as graphs in Figure 6.
- https://cdn.elifesciences.org/articles/71052/elife-71052-fig6-data1-v2.xlsx
Figure 6—figure supplement 1
Immune cell infiltration after acute UVB (acUVB) exposure and during tissue repair.
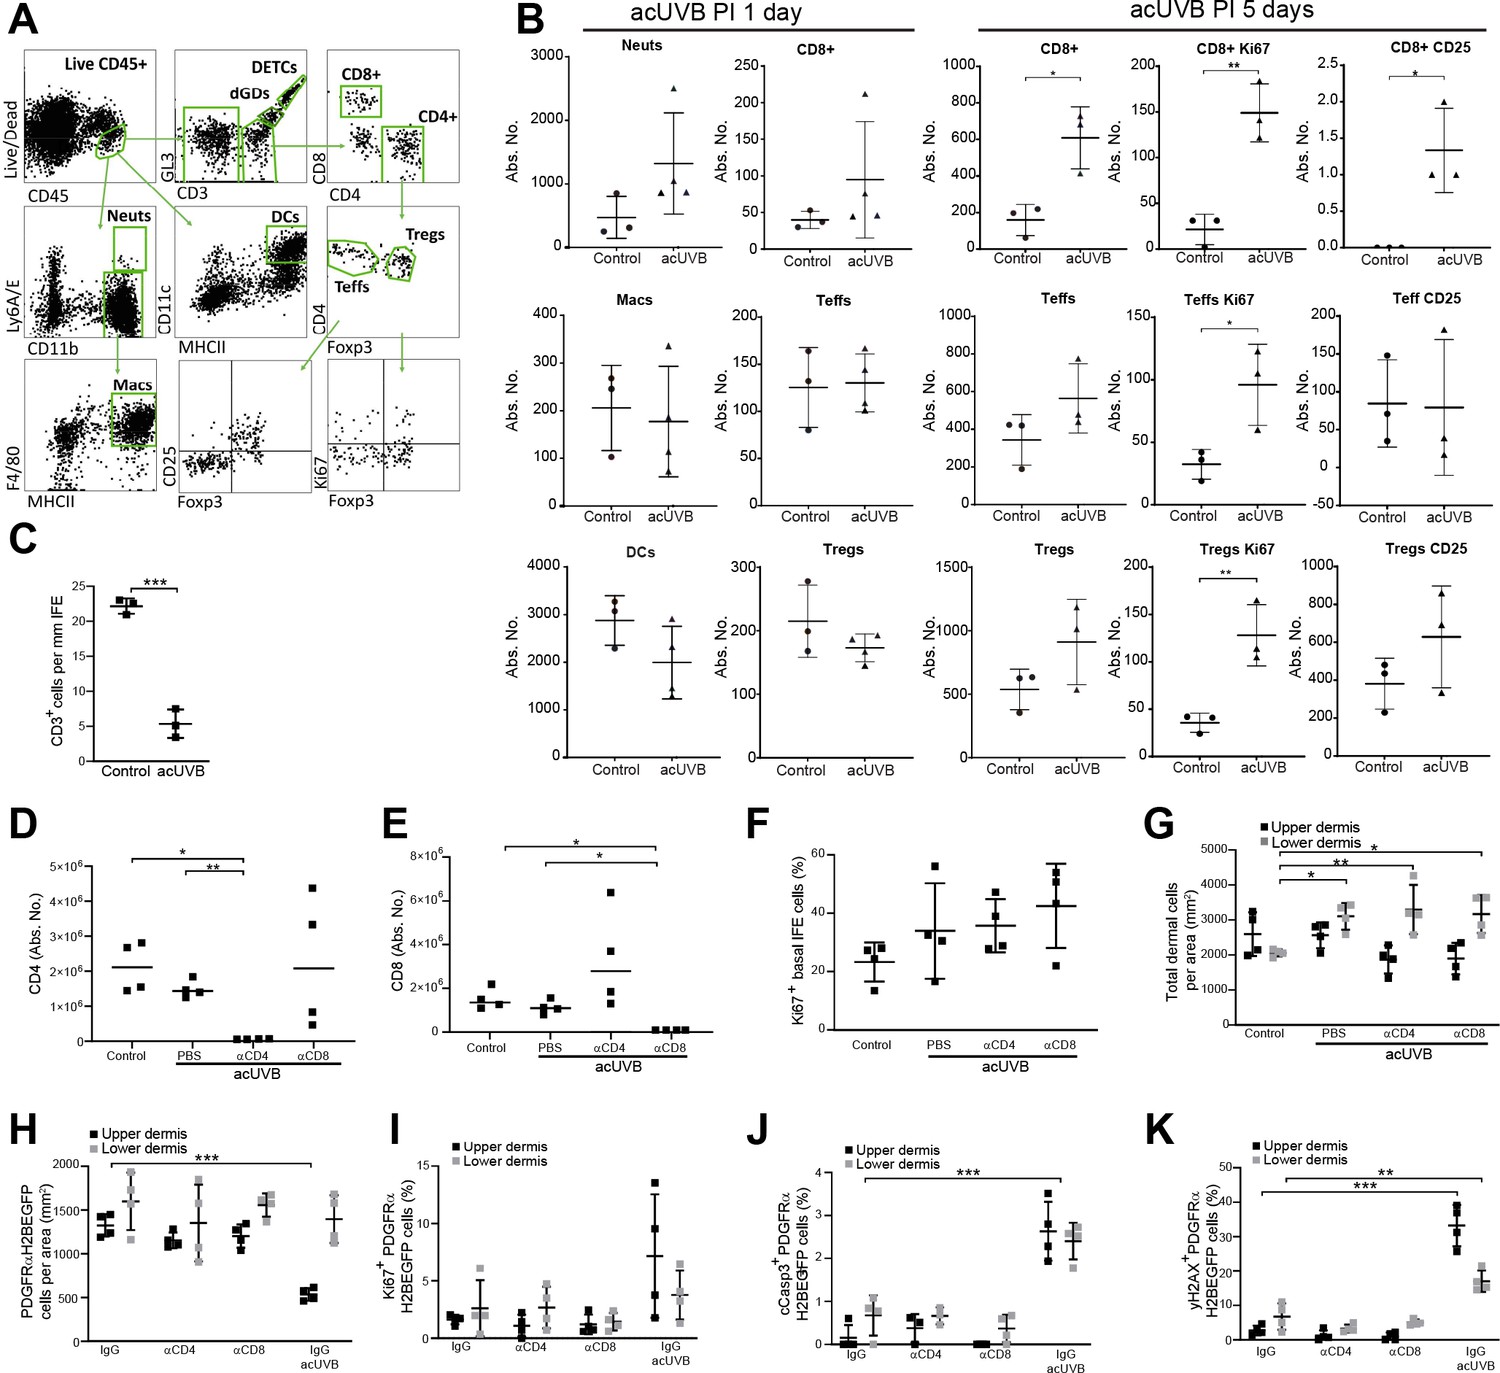
(A) FACS gating strategy for identifying innate and adaptive immune cell populations. After exclusion of doublets and dead cells, all hematopoietic cells were pre-gated as CD45+. Next lymphoid cells were gated as γδ-TCR+ CD3+ dermal γδ T cells (dGD), γδ-TCRhiCD3hi dendritic epidermal T cells (DETCs), CD3+ CD8+ T cells (CD8), CD3+ CD4+ Foxp3– T effector cells (Teff), and CD3+ CD4+ Foxp3+ regulatory T cells (Treg). Myeloid cells were all pre-gated as γδ-TCR–CD3– double negative and then gated as CD11c + MHC-Class II + dendritic cells (DCs), Ly-6A/E + CD11b + neutrophils (Neuts), and Ly-6A/E–CD11b + ClassII + F4/80+ macrophages (Macs). (B) FACS analysis of indicated immune cells 1 and 5 days post-acUVB. Beside abundance, proliferation (Ki67) and activation (CD25) of indicated T cell populations are shown. Absolute number quantifications of cutaneous T cells are for 6 cm2. (C) Quantification of CD3+ cells in the epidermis visualised in Figure 6A. (D, E) FACS analysis of lymph node tissue for CD4+ (D) and CD8+ cells (E) at indicated treatment conditions; absolute numbers were quantified. Note that the respective blocking antibody efficiently depleted CD8+ and CD4+ cells in the circulation and led to an increase of other T cell subsets after acUVB. (F, G) Quantification of basal IFE keratinocyte proliferation (Ki67+) (F) and total dermal density (DAPI+) (G) 24 hr after acUVB and indicated treatment condition. (H–K) Quantification of dermal fibroblast density (PDGFRαH2BEGFP+) (H), proliferation (Ki67+ PDGFRαH2BEGFP+) (I), apoptosis (cCasp3+ PDGFRαH2BEGFP+) (J), and DNA damage (yH2AX+ PDGFRαH2BEGFP+) (K) after acUVB and indicated treatment condition. Data are mean ± SD. *p<0.05, **p<0.01, ***p<0.001. Source data of quantifications shown are summarised in Figure 6—figure supplement 1—source data 1.
-
Figure 6—figure supplement 1—source data 1
Source data of quantifications represented as graphs in Figure 6—figure supplement 1.
- https://cdn.elifesciences.org/articles/71052/elife-71052-fig6-figsupp1-data1-v2.xlsx
Figure 7
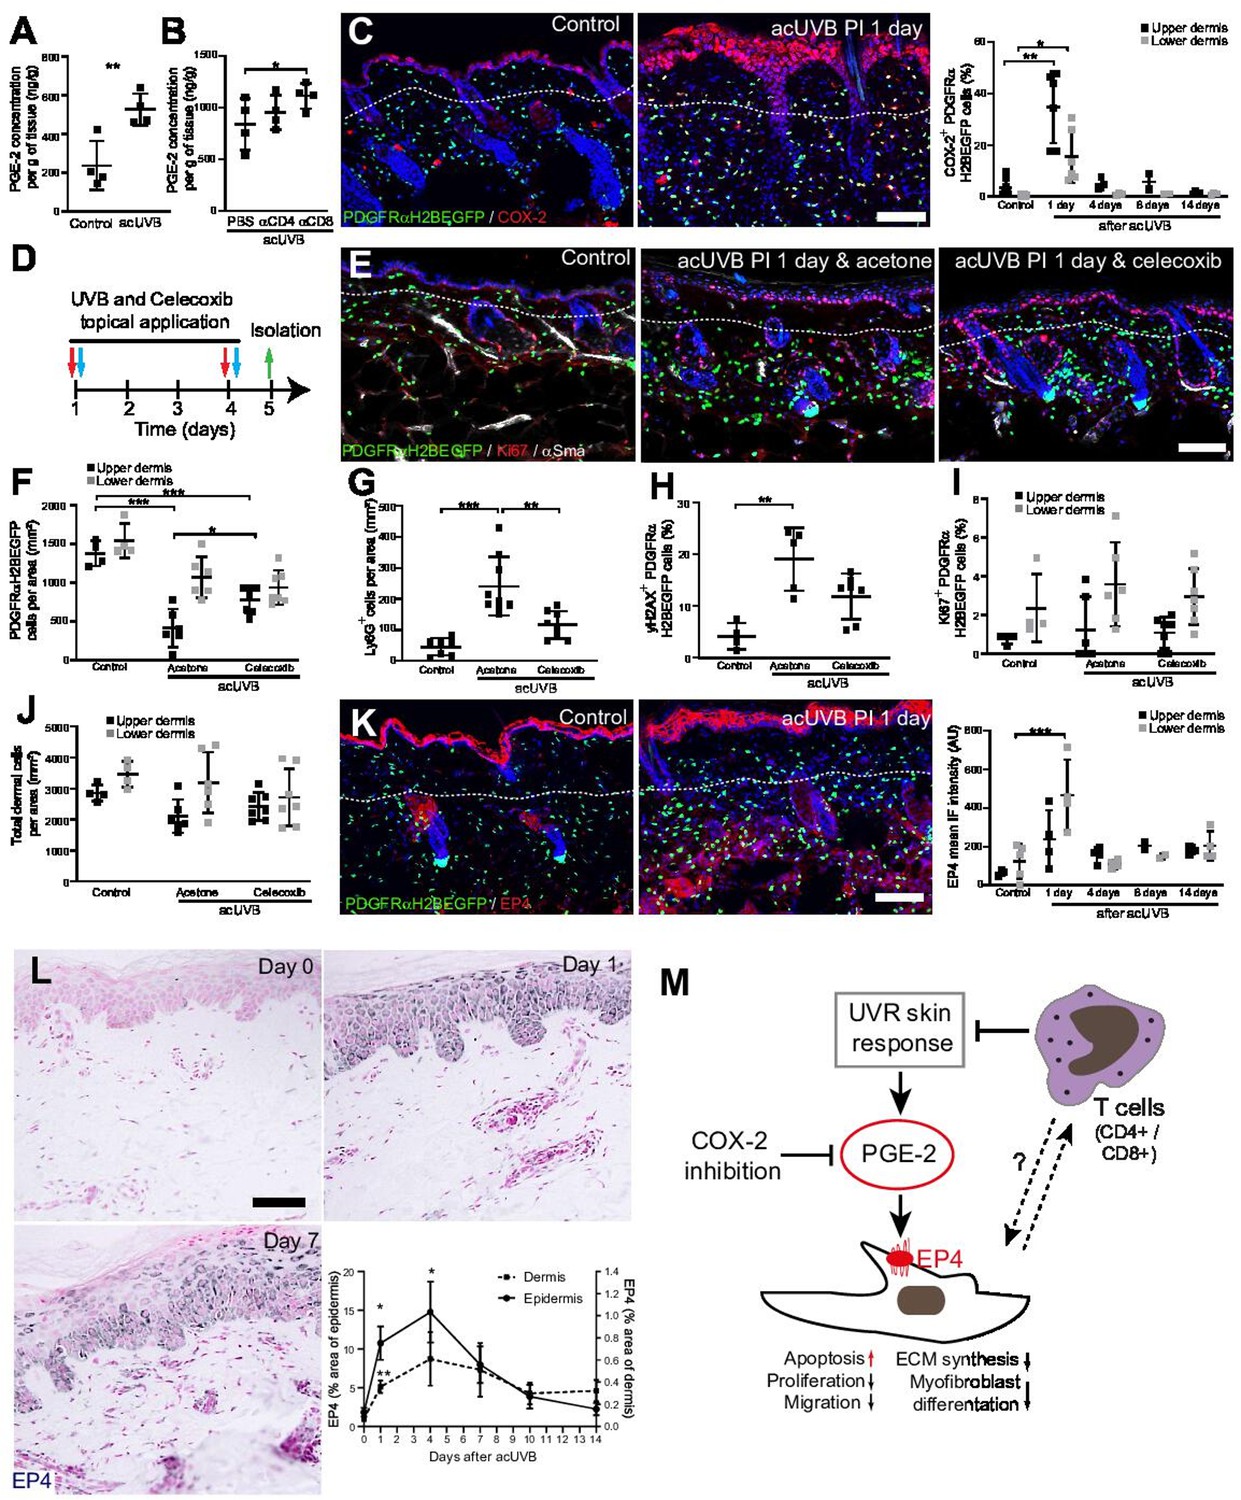
Inhibition of ultraviolet radiation (UVR)-induced inflammation increases fibroblast survival in the skin.
(A, B) Prostaglandin E2 (PGE-2) skin concentration 24 hr after acute UVB (acUVB) exposure (A) and in combination with CD4+ and CD8+ cell depletion (B). Note that antibody depletion of CD4+ and CD8+ cells further increases the PGE-2 concentration in acUVB-treated skin. (C) Representative PDGFRαH2BEGFP sections (green) stained for COX-2 (red) of control and treated skin and quantification of double-positive cells at the indicated time points post-acUVR. Note that the epidermis and dermis show pronounced increase in COX-2 expression 24 hr after acUVB exposure. (D–J) COX-2 inhibition decreased fibroblast loss. (D) Experimental design for topical treatment with celecoxib (COX-2 inhibition) immediately after acUVB exposure. (E) Representative immunostaining of PDGFRαH2BEGFP back skin (green) for Ki67 (red) and αSma (white) under the indicated treatment conditions. (F–J) Quantification of dermal fibroblast density (PDGFRαH2BEGFP+) (F), neutrophil infiltration (Ly6G+) (G), DNA damage (yH2AX+ PDGFRαH2BEGFP cells) (H), fibroblast proliferation (Ki67+ PDGFRαH2BEGFP) (I), and total dermal cells (DAPI+) (J) under the indicated experimental conditions. (K) Representative PDGFRαH2BEGFP sections (green) stained for EP4 (red) and quantification of the EP4 mean fluorescence intensity at the indicated time points post-UVR. (L) Immunostaining of human skin for EP4 receptor and quantification of EP4 in the epidermal and dermal areas per field of view at the indicated time points after acUVB exposure (n = 13 biological replicates). (M) Model of PGE-2-EP4 signalling in dermal fibroblasts after UVR exposure showing the influence on tissue damage response and survival in concert with T cells. Data are mean ± SD except (L), is ± SEM. *p<0.05, **p<0.01, ***p<0.001. Nuclei were labelled with DAPI (blue), and dashed white line delineates upper and lower dermis. Scale bars, 50 μm. Source data of quantifications are summarised in Figure 7—source data 1.
-
Figure 7—source data 1
Source data of quantifications represented as graphs in Figure 7.
- https://cdn.elifesciences.org/articles/71052/elife-71052-fig7-data1-v2.xlsx
Tables
Appendix 1—key resources table
| Reagent type (species) or resource | Designation | Source or reference | Identifiers | Additional information |
|---|---|---|---|---|
| Strain, strain background (Mus musculus) | PDGFRα H2BEGFP, C57Bl6/BalbC | PMID:12748302 | RRID:MGI:2663656 | |
| Strain, strain background (M. musculus) | Lrig1-CreERt2-IRES-GFP, C57Bl6/BalbC | PMID:23954751 | RRID:MGI:5520983 | |
| Strain, strain background (M. musculus) | Dlk1-CreERt2, C57Bl6/BalbC | PMID:24336287 | RRID:MGI:5555961 | |
| Strain, strain background (M. musculus) | ROSAfl-stopfl-tdTomato, C57Bl6/BalbC | Jackson Laboratories | Stock no.:007905 | |
| Strain, strain background (M. musculus) | Krt14ΔNβ-cateninER, C57Bl6/BalbC | PMID:15084463 | RRID:MGI:6315261 | |
| Strain, strain background (M. musculus) | TCF/Lef:H2B-GFP, C57Bl6/BalbC | PMID:21176145 | RRID:MGI:4881498 | |
| Antibody | Anti-vimentin (rabbit polyclonal) | Cell Signaling | Cat# 5741 | IF (1:500) |
| Antibody | Anti-Ly6G (rat monoclonal) | eBioscience | Clone 1A8 | IF (1:200) |
| Antibody | Anti-FoxP3 (rat monoclonal) | eBioscience | Clone FJK-16s | IF (1:200) |
| Antibody | Anti-CD8 (rat monoclonal) | BioLegend | Clone 53-6.7 | IF (1:200) |
| Antibody | Anti-CD3 (rat monoclonal) | BioLegend | Clone 17A2 | IF (1:200) |
| Antibody | Anti-CD49f (rat monoclonal) | BioLegend | Clone GoH3 | IF (1:500) |
| Antibody | Anti-CD45 (rat monoclonal) | eBioscience | Clone 30-F11 | IF: (1:200) |
| Antibody | Anti-CD31 (rat monoclonal) | eBioscience | Clone 390 | IF: (1:200) |
| Antibody | Anti-COX-2 (rabbit polyclonal) | Abcam | Cat# ab15191 | IF (1:500) |
| Antibody | Anti-cCasp3 (rabbit polyclonal) | Cell Signaling | Cat# 9661 | IF (1:500) |
| Antibody | Anti-YAP (rabbit polyclonal) | Cell Signaling | Cat# 14074 | IF (1:500) |
| Antibody | Anti-EP4 (rabbit polyclonal) | Bioss | Cat# BS-8538R | IF (1:200) |
| Antibody | Anti-EP4 (rabbit polyclonal) | Cayman | Cat# 101775 | IF (1:50) |
| Antibody | Anti-Ki67 (rabbit polyclonal) | Abcam | Cat# ab16667 | IF (1:500) |
| Antibody | Anti-Ki67 (rat monoclonal) | Invitrogen | Clone SolA15 | IF (1:500) |
| Antibody | Anti-yH2AX (rabbit polyclonal) | Abcam | Cat# ab81299 | IF (1:500) |
| Antibody | Anti-αSma (rabbit polyclonal) | Abcam | Cat# ab5694 | IF (1:500) |
| Antibody | Anti-human CD39 (mouse monoclonal) | eBioscience | Clone eBioA1 (A1) | IF (1:200) |
| Antibody | Anti-mouse CD4 (rat monoclonal) | BioXCell | Clone GK1.5 | For immune cell depletion |
| Antibody | Anti-mouse CD8 (rat monoclonal) | BioXCell | Clone 2.43 | For immune cell depletion |
| Antibody | Anti-IgG (rat monoclonal) | BioXCell | Clone LTF-2 | For immune cell depletion |
| Antibody | Anti-rat AlexaFluor488 (donkey polyclonal) | Thermo Fisher | Cat# A-21208 | IF (1:1000) |
| Antibody | Anti-rabbit AlexaFluor555 (donkey polyclonal) | Thermo Fisher | Cat# A-31572 | IF (1:1000) |
| Antibody | Anti-rat AlexaFluor555 (goat polyclonal) | Thermo Fisher | Cat# A-21434 | IF (1:1000) |
| Antibody | Anti-rat AlexaFluor647 (goat polyclonal) | Thermo Fisher | Cat# A-21247 | IF (1:1000) |
| Antibody | Anti-mouse/rat Foxp3 eFluor450 (rat monoclonal) | eBioscience | Clone FJK-16s | FACS (1:100) |
| Antibody | Anti-mouse CD152 (CTLA4), PE (rat monoclonal) | BD | Clone UC10-4F10-11 | FACS (1:100) |
| Antibody | Anti-human Ki67, PE-Cy7 (mouse monoclonal) | BD | Clone B56 | FACS (1:100) |
| Antibody | Anti-mouse TCR gd, PerCP-Cy 5.5 (rat monoclonal) | BioLegend | Clone GL3 | FACS (1:300) |
| Antibody | Anti-mouse CD45, Alexa Fluor700 (rat monoclonal) | eBioscience | Clone 30-F11 | FACS (1:200) |
| Antibody | Anti-mouse CD25, APC-eFluor780 (rat monoclonal) | eBioscience | Clone PC61.5 | FACS (1:150) |
| Antibody | Anti-mouse CD8a, Brilliant Violet 605 (rat monoclonal) | BioLegend | Clone 53-6.7 | FACS (1:200) |
| Antibody | Anti-mouse CD4 Antibody, Brilliant Violet 650 (rat monoclonal) | BioLegend | Clone RM4-5 | FACS (1:200) |
| Antibody | Anti-mouse CD3, Brilliant Violet 711 (rat monoclonal) | BioLegend | Clone 17A2 | FACS (1:150) |
| Antibody | Anti-mouse CD11b, AlexaFluor647 (rat monoclonal) | BioLegend | Clone M1/70 | FACS (1:400) |
| Antibody | Anti-F4/80, PE-Cy5 (rat monoclonal) | eBioscience | Clone BM8 | FACS (1:400) |
| Antibody | Anti-MHC Class II (I-A) (NIMR-4), PE (rat monoclonal) | eBioscience | Clone M5/114.15.2 | FACS (1:500) |
| Antibody | Anti-mouse Ly-6A/E (Sca-1), APC/Cy7 (rat monoclonal) | BioLegend | Clone D7 | FACS (1:400) |
| Antibody | Anti-mouse CD11c, AlexaFluor488 (hamster monoclonal) | BioLegend | Clone N418 | FACS (1:400) |
| Peptide, recombinant protein | B-CHP | 3Helix | Cat# BIO300 | IF (1:100) |
| Peptide, recombinant protein | Streptavidin–AlexaFluor647 | Thermo Fisher | Cat# S32357 | IF (1:500) |
| Peptide, recombinant protein | Collagenase XI | Sigma-Aldrich | Cat# C7657 | |
| Peptide, recombinant protein | Hyaluronidase | Sigma-Aldrich | Cat# H4272 | |
| Peptide, recombinant protein | DNase I | Sigma-Aldrich | Cat# DN-25 | |
| Other | 4,6-Diamidino-2-phenylindole (DAPI) | Thermo Fisher | Cat# D1306 | IF (1 mg/ml stock solution diluted 1:50,000) |
| Other | Ghost Dye Violet 510 Live/ Dead Stain | Tonbo Biosciences | Cat# 13-0870T100 | FACS (1:500) |
| Other | UVR system (Tyler Research UV-2) | Tyler Research | Cat# UV-2 | |
| Commercial assay or kit | VectorFluor Dylight Duet kit | Vector Labs | Cat# DK-8828 | |
| Commercial assay or kit | Anti-rabbit Vector ImmPress kit | Vector Labs | Cat# MP-5401 | |
| Commercial assay or kit | Prostaglandin E2 ELISA Kit | Cayman Chemicals | Cat# 500141 | |
| Commercial assay or kit | Celecoxib | Selleckchem | Cat# S1261 | |
| Commercial assay or kit | UltraComp eBeads | Thermo Fisher | Cat# 01-2222-42 | |
| Commercial assay or kit | ArC Amine Reactive Compensation Bead Kit | Thermo Fisher | Cat# A10346 | |
| Commercial assay or kit | 4-Hydroxyt amoxifen (4OHT) | Sigma-Aldrich | Cat# H7904 | |
| Commercial assay or kit | Tamoxifen | Sigma-Aldrich | Cat# T5648 | |
| Software, algorithm | ICY | Institut Pasteur and France-BioImaging | RRID:SCR_010587 | |
| Software, algorithm | Fiji imaging software (ImageJ) | NIH | RRID:SCR_002285 | |
| Software, algorithm | Imaris | BitPlane | RRID:SCR_007370 | |
| Software, algorithm | Scanpy | Scanpy | RRID:SCR_018139 | |
| Software, algorithm | g:Profiler | g:Profiler | RRID:SCR_006809 | |
| Software, algorithm | FlowJo | FlowJo | RRID:SCR_008520 | |
| Software, algorithm | GraphPad Prism | GraphPad Prism | RRID:SCR_002798 |
Additional files
-
Supplementary file 1
Immune cell flow cytometry antibody panel for T cells and myeloid cells.
- https://cdn.elifesciences.org/articles/71052/elife-71052-supp1-v2.docx
-
Transparent reporting form
- https://cdn.elifesciences.org/articles/71052/elife-71052-transrepform1-v2.docx
Download links
A two-part list of links to download the article, or parts of the article, in various formats.
Downloads (link to download the article as PDF)
Open citations (links to open the citations from this article in various online reference manager services)
Cite this article (links to download the citations from this article in formats compatible with various reference manager tools)
Role of distinct fibroblast lineages and immune cells in dermal repair following UV radiation-induced tissue damage
eLife 10:e71052.
https://doi.org/10.7554/eLife.71052


