Members of the ELMOD protein family specify formation of distinct aperture domains on the Arabidopsis pollen surface
- Department of Molecular Genetics and Center for Applied Plant Sciences, Ohio State University, United States
Figures
Figure 1 with 2 supplements
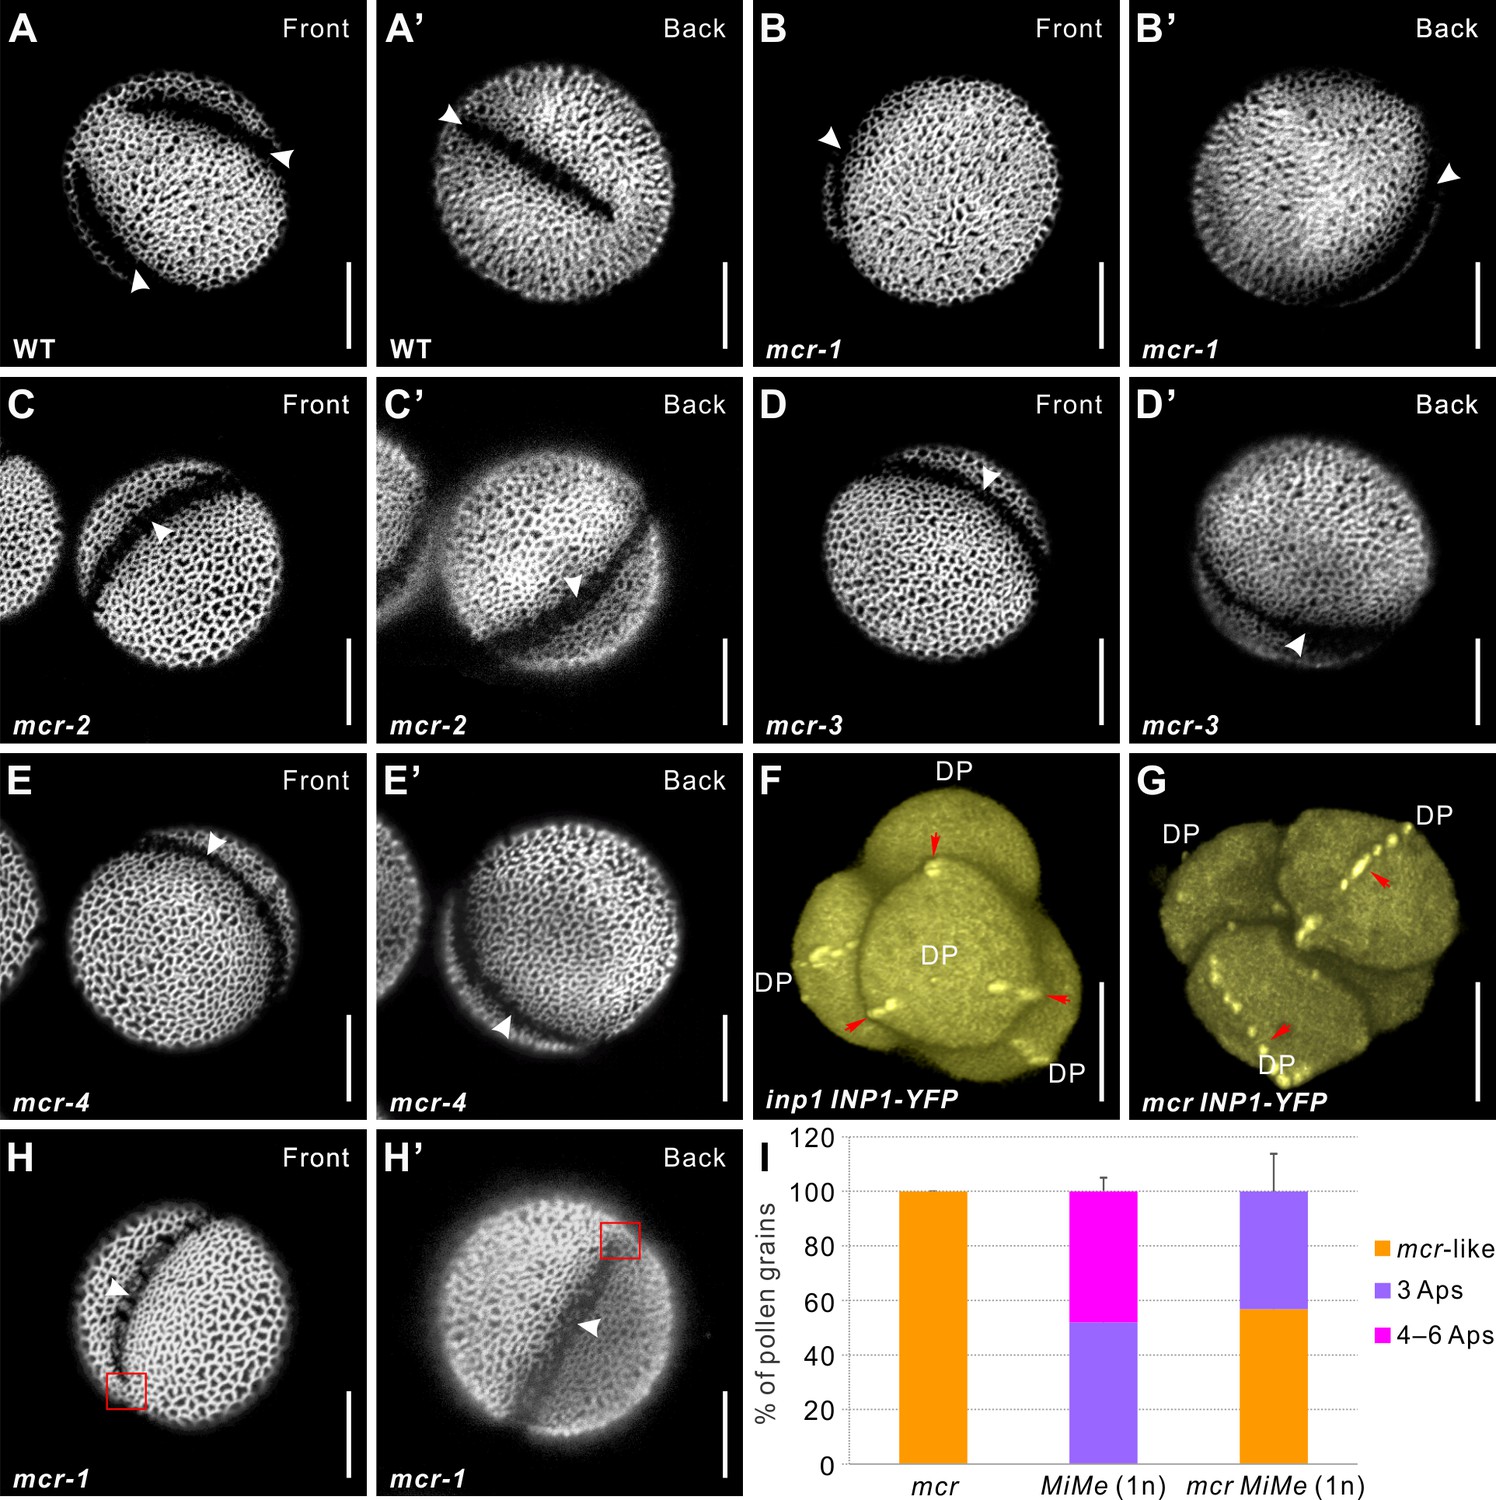
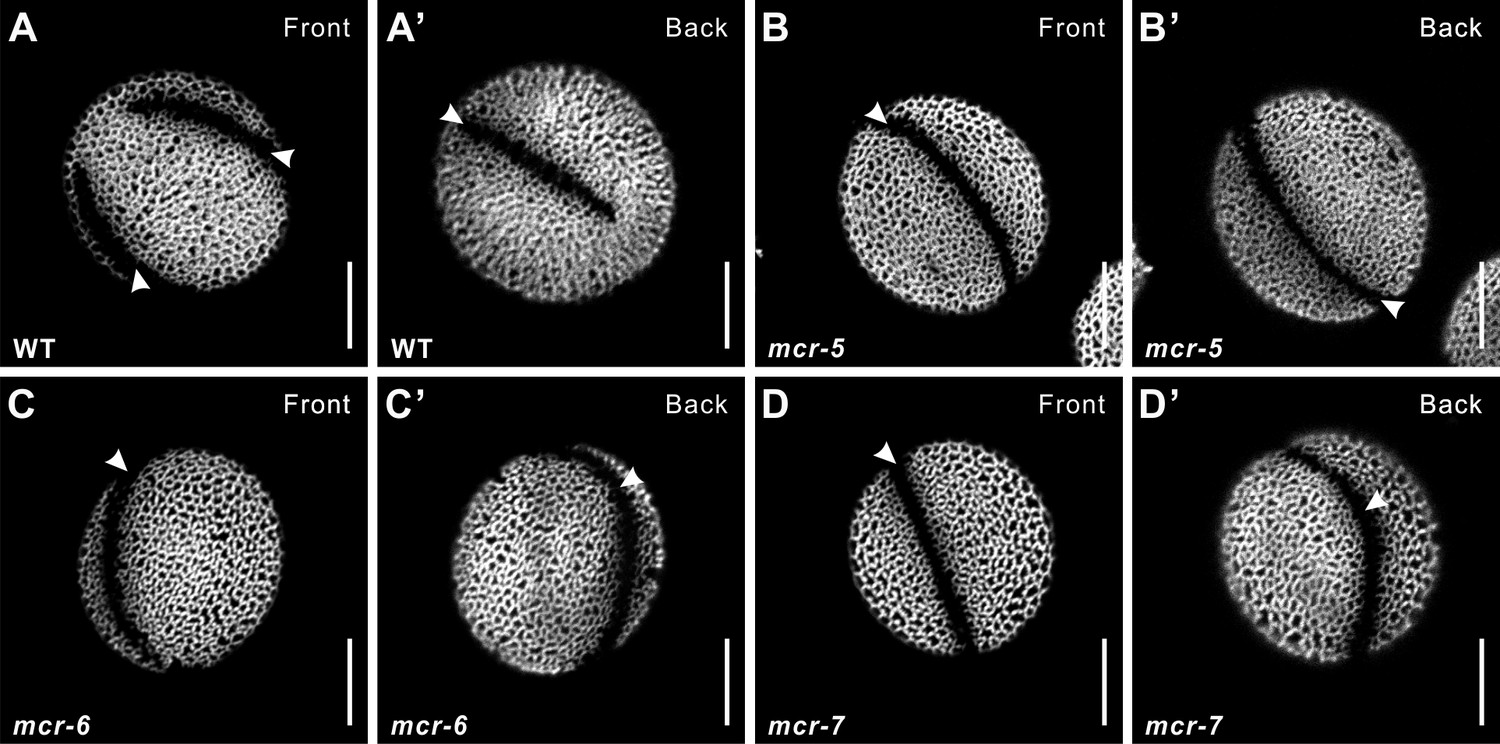
Mutations in MCR reduce aperture number.
(A–E’) Confocal images of auramine O-stained pollen grains from wild-type (Ler) and four mcr EMS mutants. Front (α) and back (α’) show the opposite views of the same pollen grain here and in other figures as indicated. (F, G) 3D reconstructions of tetrad-stage microspores showing lines of INP1-YFP (red arrows) in inp1 and mcr mutants. DP: distal pole. (H, H’) mcr pollen with two apertures. Red boxes mark the regions where apertures are not fused. (I) Percentage of pollen grains with indicated number of apertures in pollen populations from mcr, 1n MiMe, and 1n mcr MiMe plants (n = 75–500). Error bars represent SD, calculated from 4 to 6 independent biological replicates. Apertures are indicated with arrowheads in (A–E’) and (H, H’). Scale bars, 10 μm.
Figure 1—figure supplement 1
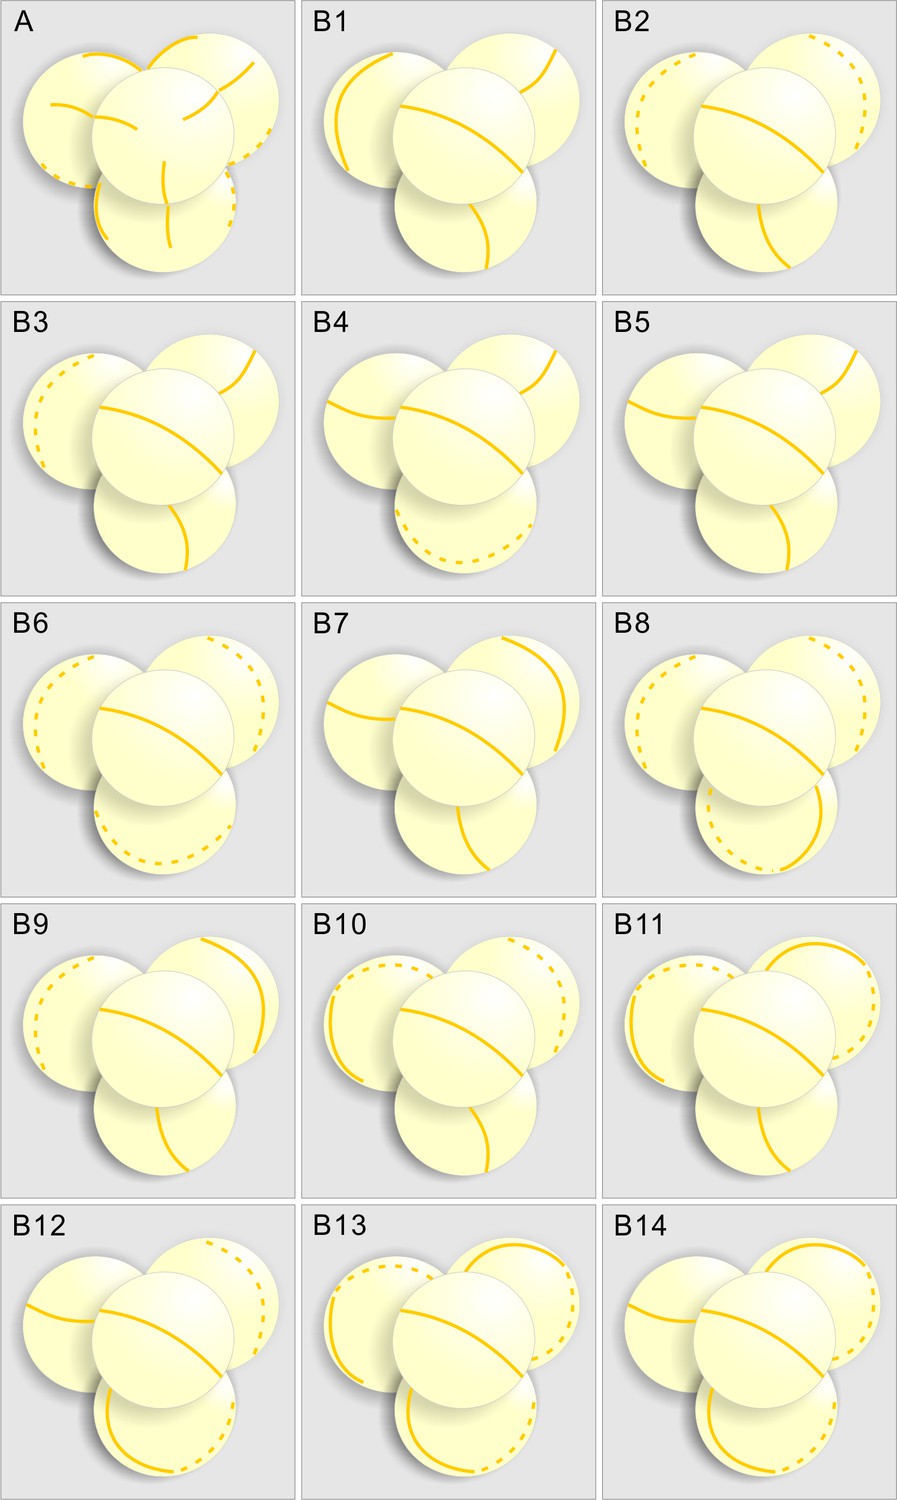
Diagrams summarizing the INP1-YFP localization in inp1 and mcr tetrads, based on confocal imaging and 3D reconstruction of DMC1pr:INP1-YFP-expressing tetrads.
(A) Positions of three equidistant lines formed by INP1-YFP in tetrad-stage inp1 microspores always appear coordinated between the sister microspores, with each line in one microspore facing a line in one of its sisters. (B1-B14) Examples of placement of INP1-YFP ring-shaped lines in 14 mcr tetrads, which suggest that the lines in sister microspores are positioned independently. In all tetrads, the INP1-YFP lines in front-facing microspores (with the polar axis perpendicular to the plane of image) were oriented the same way to compare the positioning of the lines in three sister microspores between the tetrads. Solid lines and dotted lines represent the INP1-YFP lines that are, respectively, visible and invisible in that view.
Figure 1—figure supplement 2

The reducing effect of mcr mutations on aperture number is manifested across different ploidy levels and arrangements of microspores.
(A–C’) Representative images of 1n MiMe pollen with three apertures (A, A’), four apertures (B, B’), and six apertures (C, C’). (D–E’) Representative images of 1n mcr MiMe pollen with mcr-like aperture (D, D’) and three apertures (E, E’). (F–G’) Representative images of 4n mcr tes pollen with four apertures (F, F’) and fused apertures (G, G’). Apertures are indicated with arrowheads. Scale bars, 10 μm.
Figure 2
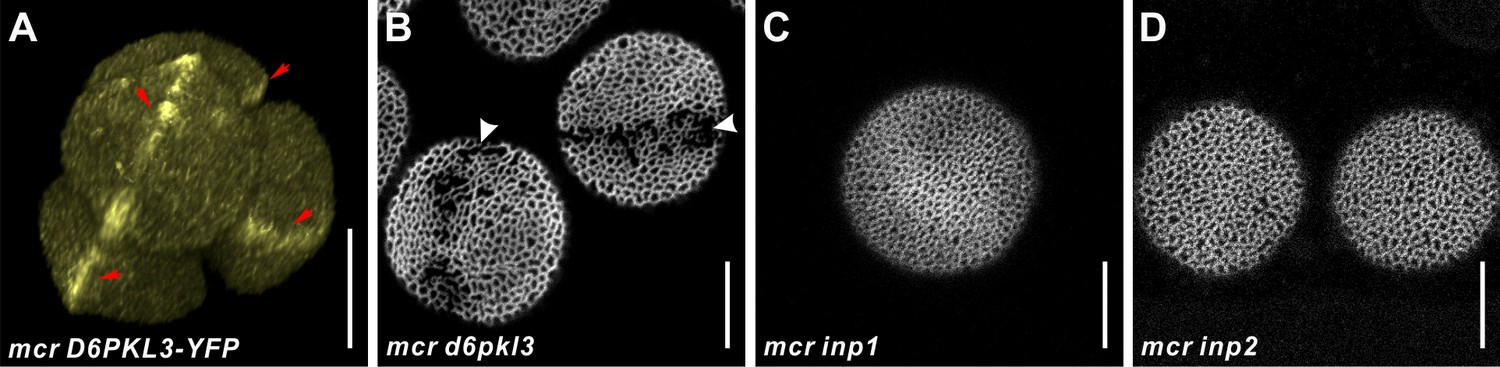
MCR acts genetically upstream of the three known aperture factors, D6PKL3, INP1, and INP2.
(A) 3D reconstruction of tetrad-stage microspores showing lines of D6PKL3-YFP in mcr tetrads. (B–D) Pollen grains of mcr d6pkl3, mcr inp1, and mcr inp2 double mutants. Apertures are indicated with arrowheads, and D6PKL3-YFP lines are indicated with red arrows. Scale bars, 10 μm.
Figure 3 with 2 supplements

MCR, a member of the ELMOD protein family, is encoded by At2g44770.
(A) Diagram of the MCR gene (At2g44770). Positions of seven mutations and several gene and protein regions are indicated. (B–D’) Pollen grains from mcr plants expressing MCRpr:gMCR, MCRpr:gMCR-YFP, and MCRpr:MCR CDS constructs. Apertures are indicated with arrowheads. Scale bars, 10 μm. (E) Phylogenetic tree of the Arabidopsis ELMOD proteins and expression patterns of the corresponding genes. Bootstrap values (%) for 1000 replicates are shown at tree nodes. RNA-seq data obtained from the TRAVA database are presented as a bubble heatmap (values indicate normalized read counts). Magenta box marks the bud stages associated with pollen aperture formation (stages follow the TRAVA nomenclature).
Figure 3—figure supplement 1
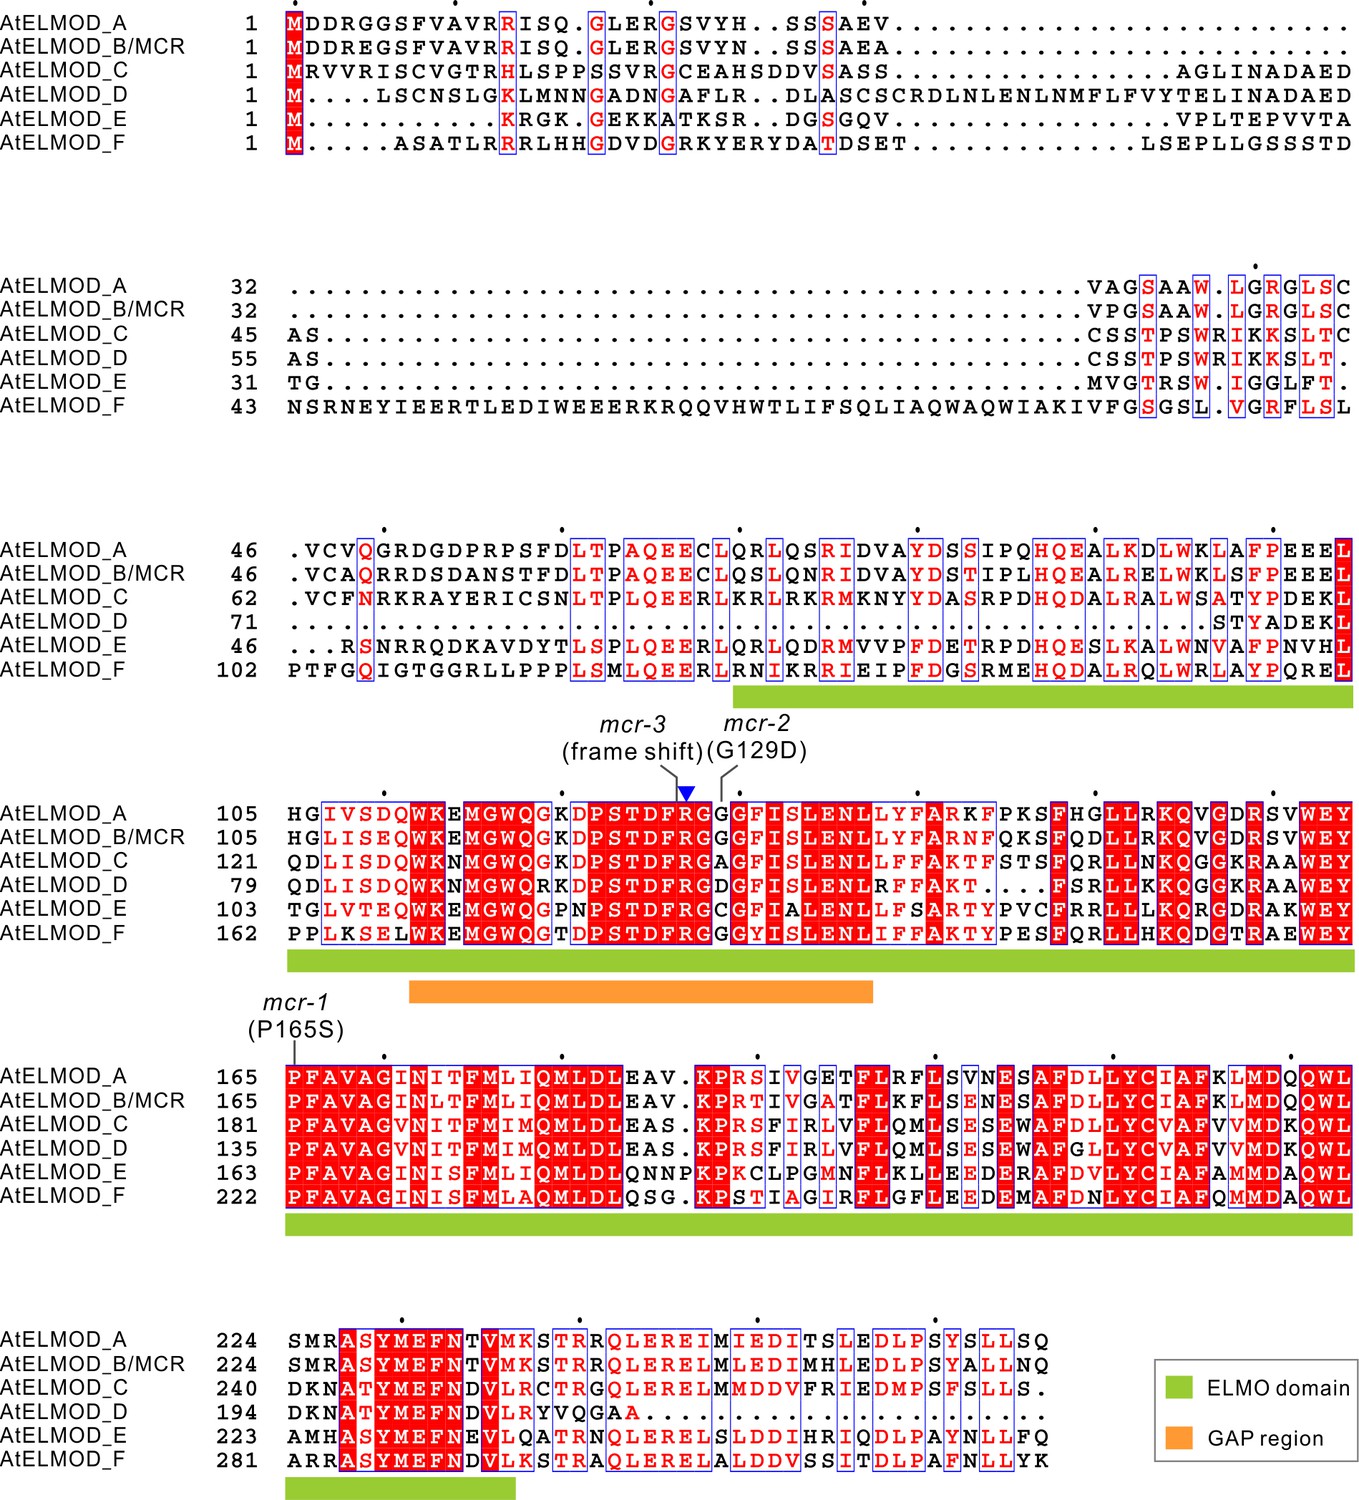
Protein sequence alignment of Arabidopsis ELMOD proteins.
Multiple sequence alignment was conducted by MAFFT and visualized by Espript3.0. Positions of ELMO domains and GAP regions in these proteins are indicated with a green box and an orange box, respectively. The mutated sites of mcr-1, mcr-2, and mcr-3 are indicated. Blue triangle indicates the highly conserved Arg (R127 of MCR and ELMOD_A) in the GAP region.
Figure 3—figure supplement 2
T-DNA insertion mutants of MCR produce pollen with a single ring-shaped aperture.
Pollen from wild type (A, A’; same pollen grain as in Figure 1A and A') and three T-DNA insertion alleles of MCR (B–D’). Apertures are indicated with arrowheads. Scale bars, 10 μm.
Figure 4
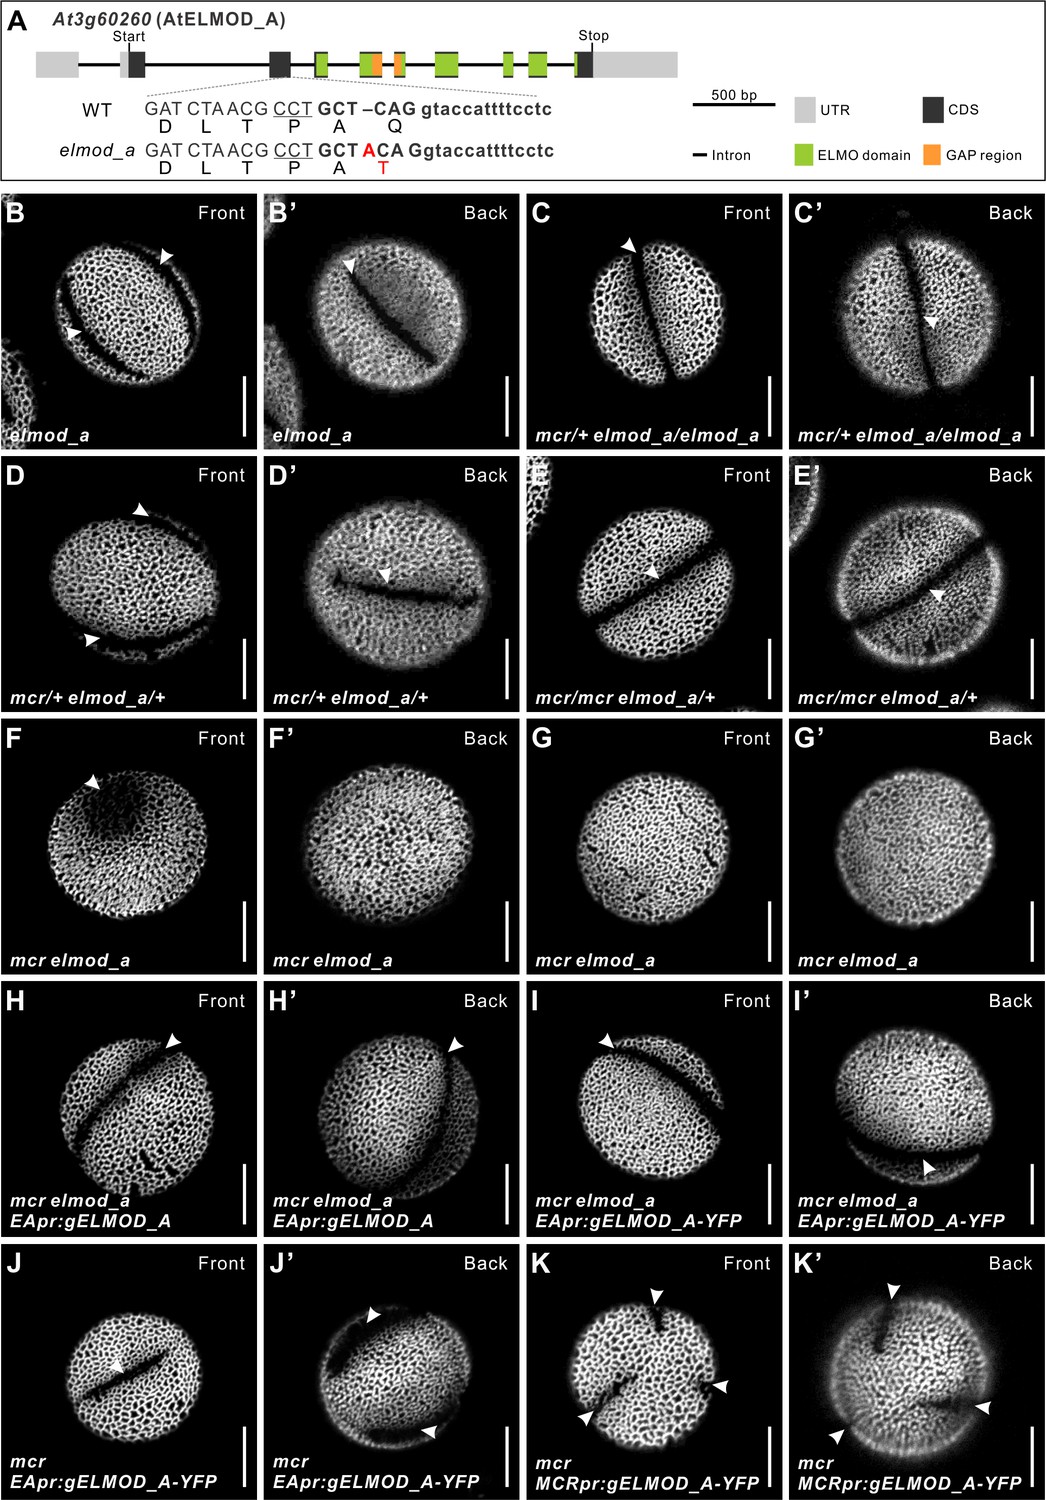
ELMOD_A is involved in aperture formation.
(A) Diagram of the ELMOD_A gene (At3g60260) and the CRISPR/Cas9-induced elmod_a mutation. Nucleotide and amino acid changes are indicated with red capital letters. 20 bp target sequence next to the underlined protospacer adjacent motif is shown in bold. Lowercase letters represent sequence of an intron. (B–G’) Pollen grains from elmod_a mutant and from the indicated homo- and heterozygous combinations of elmod_a and mcr mutations. (H–I’) Pollen grains from mcr elmod_a plants expressing EApr:gELMOD_A and EApr:gELMOD_A-YFP constructs. (J–K’) Pollen grains from mcr plants expressing EApr:gELMOD_A-YFP and MCRpr:gELMOD_A-YFP constructs. Apertures are indicated with arrowheads. Scale bars, 10 μm.
Figure 5
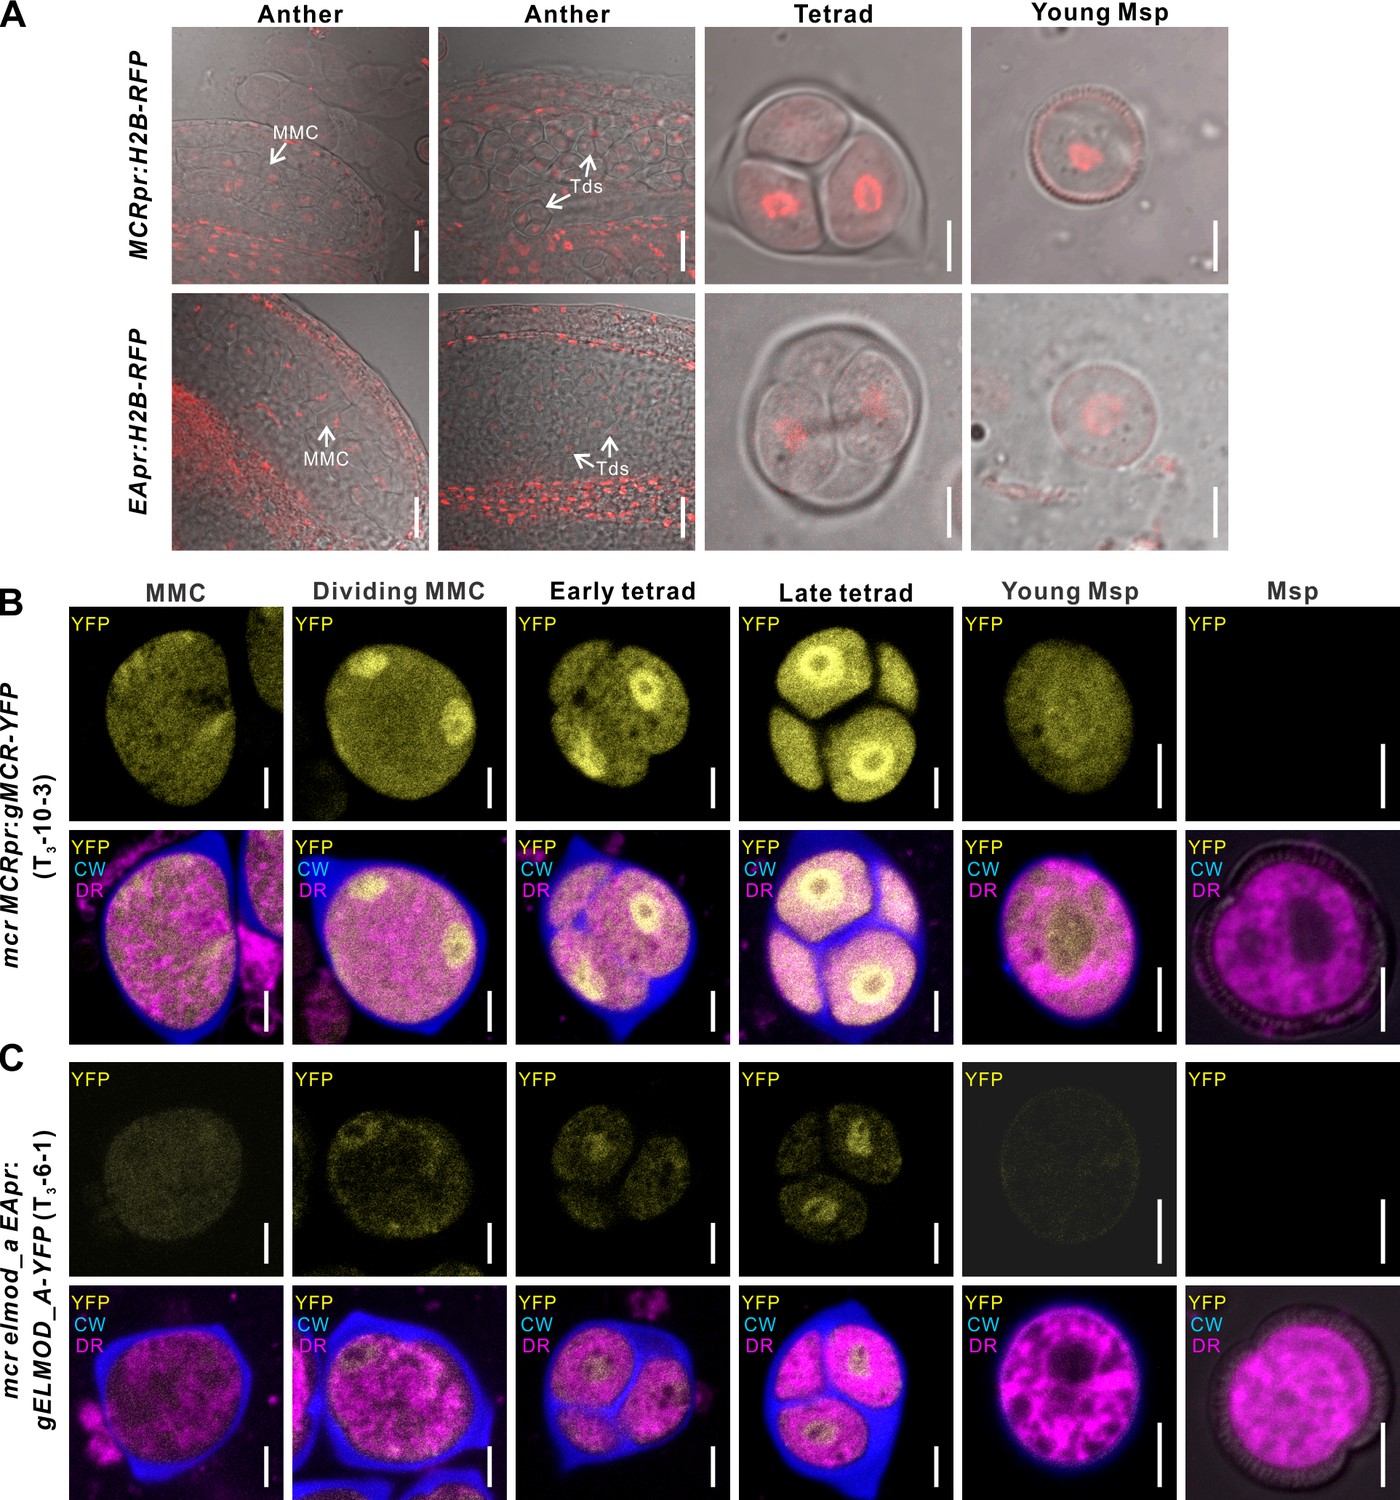
MCR and ELMOD_A do not accumulate at the aperture membrane domains.
(A) Confocal images of wild-type anthers, tetrads, and young microspores expressing MCRpr:H2B-RFP (upper panels) and EApr:H2B-RFP (lower panels). Scale bars, 20 μm for anthers and 5 μm for tetrads and young microspores. (B, C) Confocal images of cells in the developing pollen lineage from mcr MCRpr:gMCR-YFP (B) and mcr elmod_a EApr:gELMOD_A-YFP (C) plants. Upper panels: YFP signal. Lower panels: merged signal from YFP (yellow), Calcofluor White (blue, callose wall), and CellMask Deep Red (magenta, membranous structures). Scale bars, 5 μm. Identical staining and color scheme are used for similar images of tetrads in other figures. CW: Calcofluor White; DR: CellMask Deep Red; MMC: microspore mother cell; Msp: microspore; Td: tetrad.
Figure 6
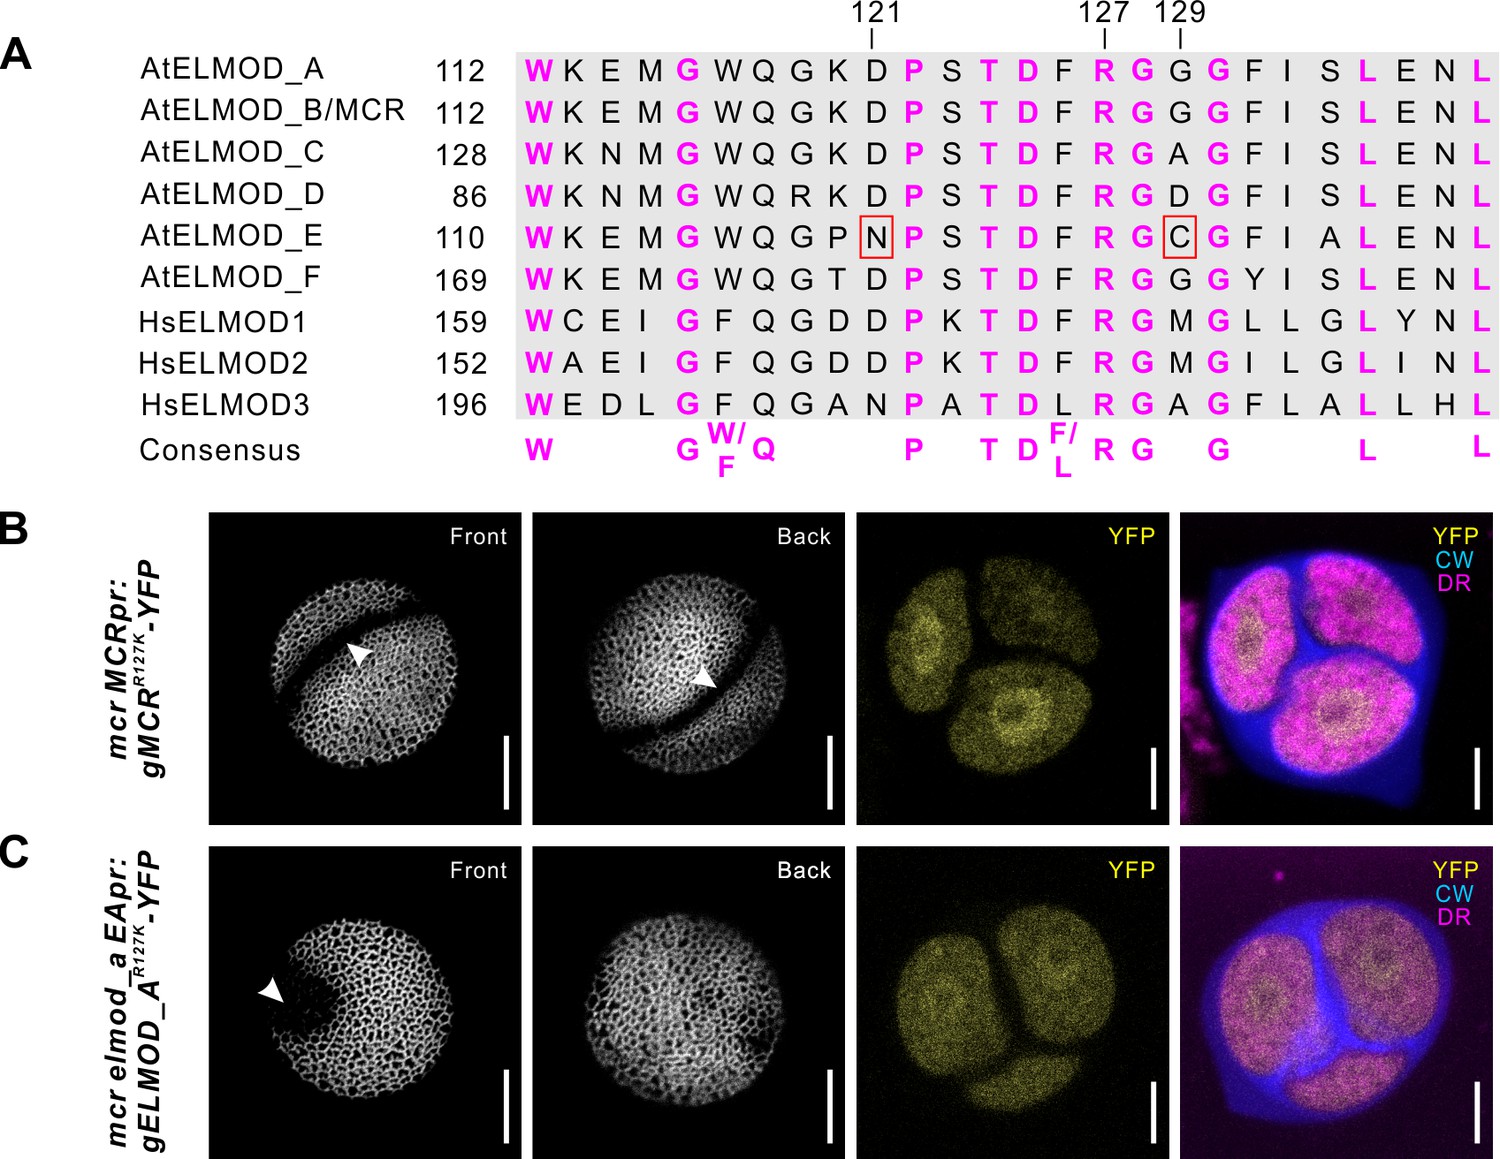
The R127 residue of MCR and ELMOD_A is essential for aperture formation.
(A) Sequence alignment of the conserved GAP regions from six Arabidopsis (At) and three human (Hs) ELMOD proteins, along with the consensus sequence. Invariant Arg residue (R127) and two other important residues (121 and 129) are indicated. N121 and C129, essential for AtELMOD_E function, are indicated by red squares. (B, C) Confocal images of pollen grains and tetrads from mcr and mcr elmod_a expressing, respectively, MCRpr:MCRR127K-YFP (B) and EApr:ELMOD_AR127K-YFP (C). Apertures are indicated with arrowheads. Scale bars, 10 μm for pollen and 5 μm for tetrads.
Figure 7 with 1 supplement
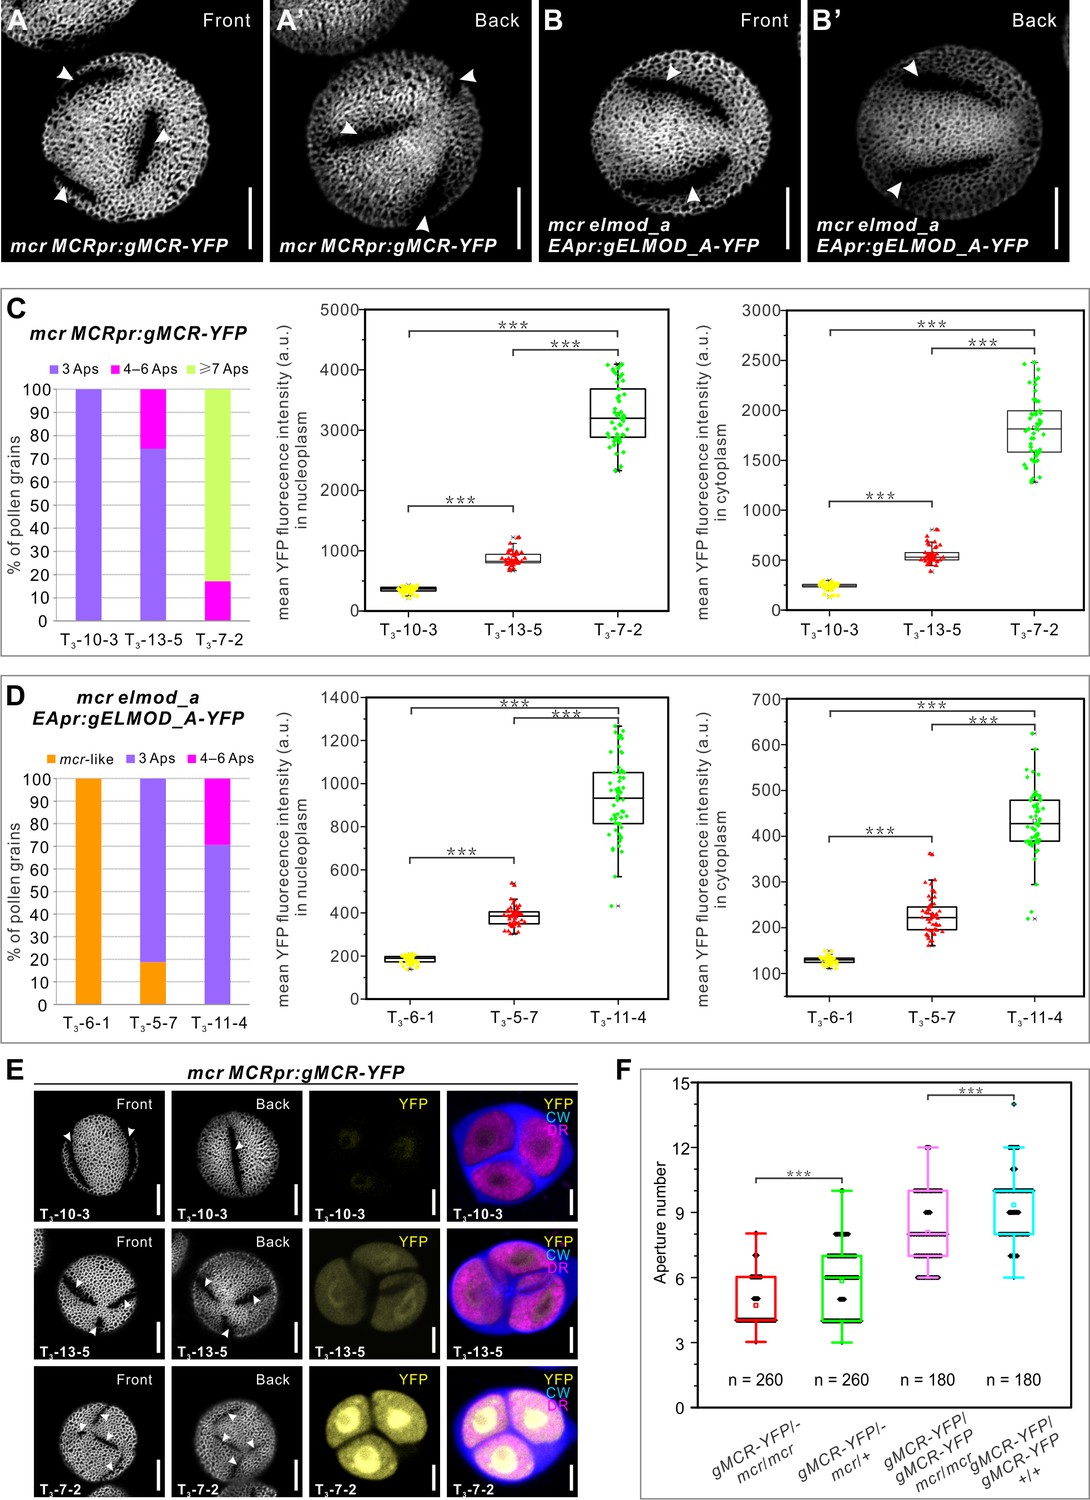
Aperture number is highly sensitive to the levels of MCR and ELMOD_A.
(A–B’) Pollen grains from the mcr MCRpr:gMCR-YFP and mcr elmod_a EApr:gELMOD_A-YFP transgenic lines, respectively, with six and four apertures. (C, D) Quantification of aperture number and mean YFP signal in three homozygous lines of mcr MCRpr:gMCR-YFP (C) and mcr elmod_a EApr:gELMOD_A-YFP (D). Stacked bars show the percentage of pollen grains (from ≥3 individual plants) with indicated number of apertures. Boxplots show mean YFP signal in the microspore nucleoplasm and cytoplasm. a. u.: arbitrary units. (E) Representative images of pollen grains and tetrads corresponding to data in (C). (F) Boxplots showing aperture number depends on the number of functional copies of MCR. Number of analyzed pollen grains (from ≥3 individual plants) is indicated. For all boxplots, boxes represent the first and third quartiles, central lines depict the median, small squares in the boxes indicate the mean values, and small shapes show individual samples. Whiskers extend to minimum and maximum values. ***p<0.001 (two-tailed Student’s t-test). Apertures are indicated with arrowheads. Scale bars, 10 μm for pollen and 5 μm for tetrads.
Figure 7—figure supplement 1
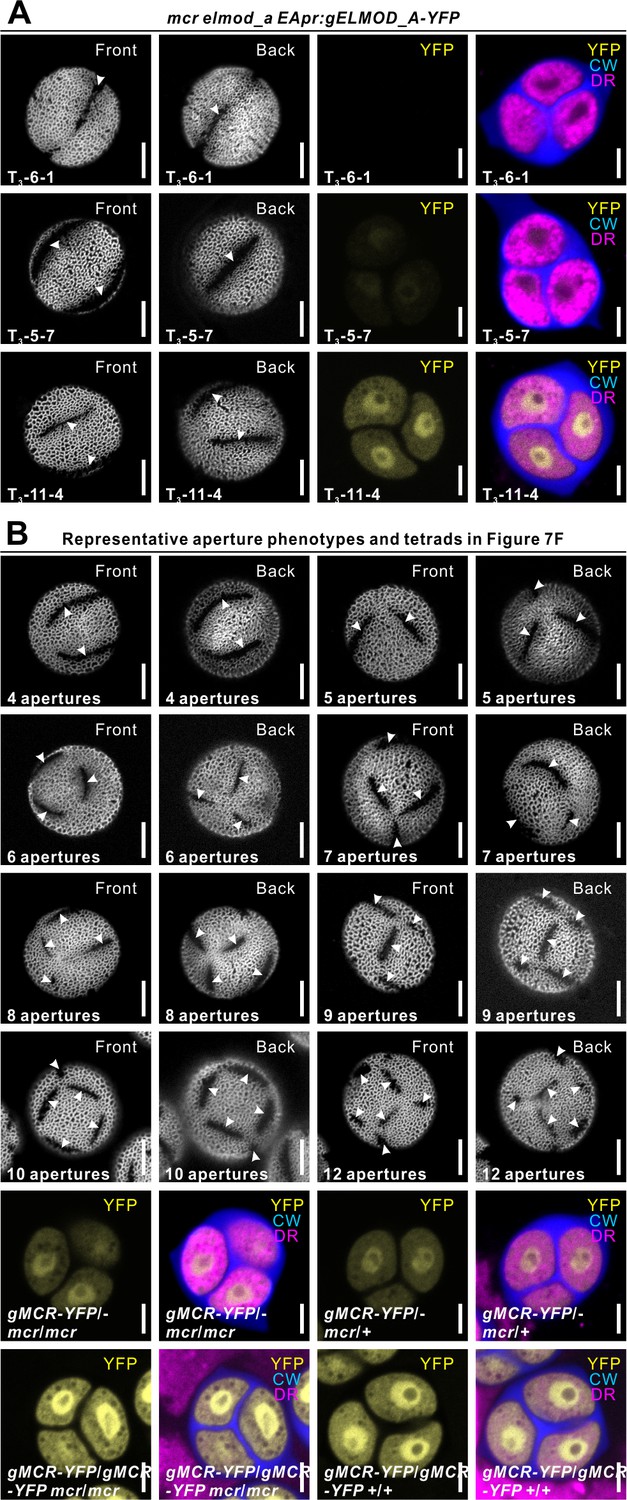
Representative aperture phenotypes and tetrads related to Figure 7.
Figure 8 with 1 supplement
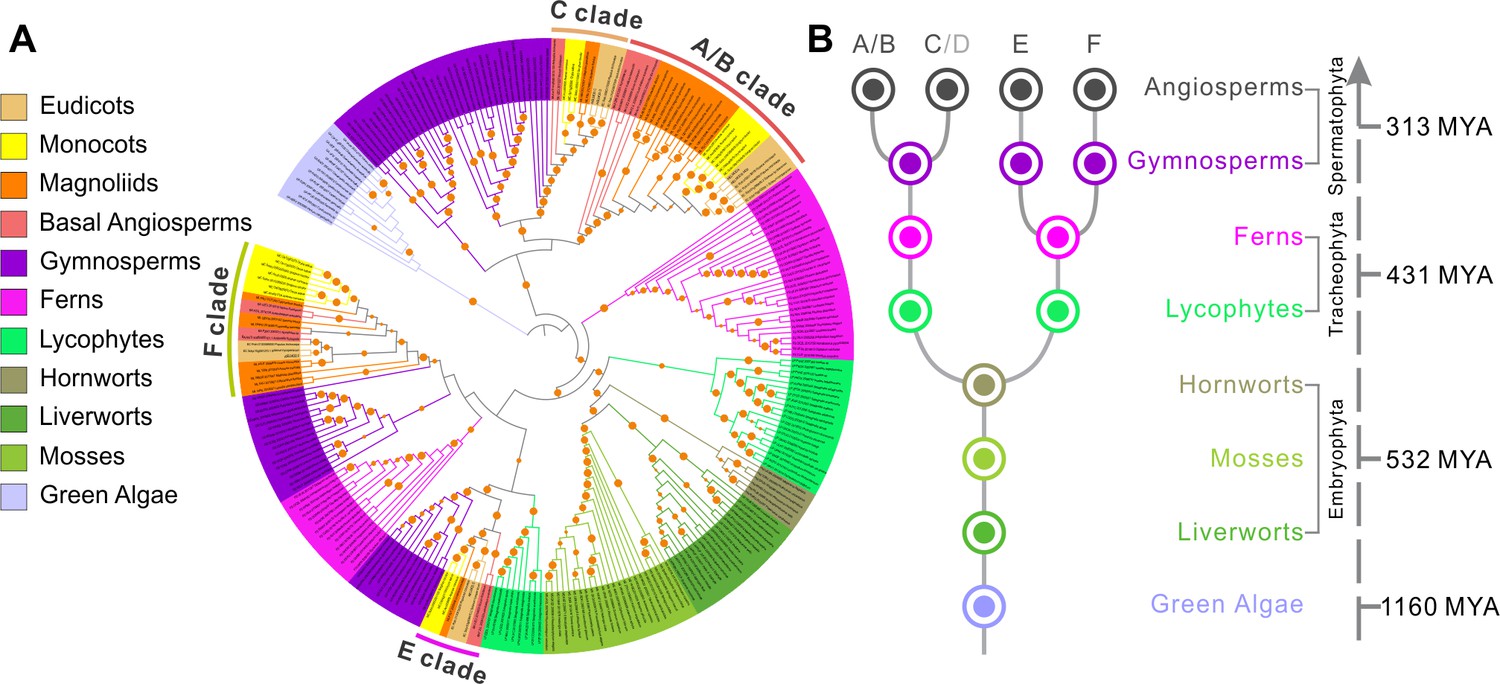
ELMOD proteins exist across the plant kingdom.
(A) Maximum likelihood phylogenetic tree of ELMOD proteins across the plant kingdom. The four clades of angiosperm ELMODs are indicated. Orange circles: bootstrap values of 70–100%. (B) Inferred evolutionary history of the ELMOD gene family. Dots: inferred ancestral gene number in different plant groups; letters on top: ELMOD clades named after the corresponding Arabidopsis proteins; gray D indicates Arabidopsis ELMOD_D is likely a pseudogene; numbers on the right: estimated time of divergence in millions of years (MYA) calculated using the TimeTree database.
Figure 8—figure supplement 1
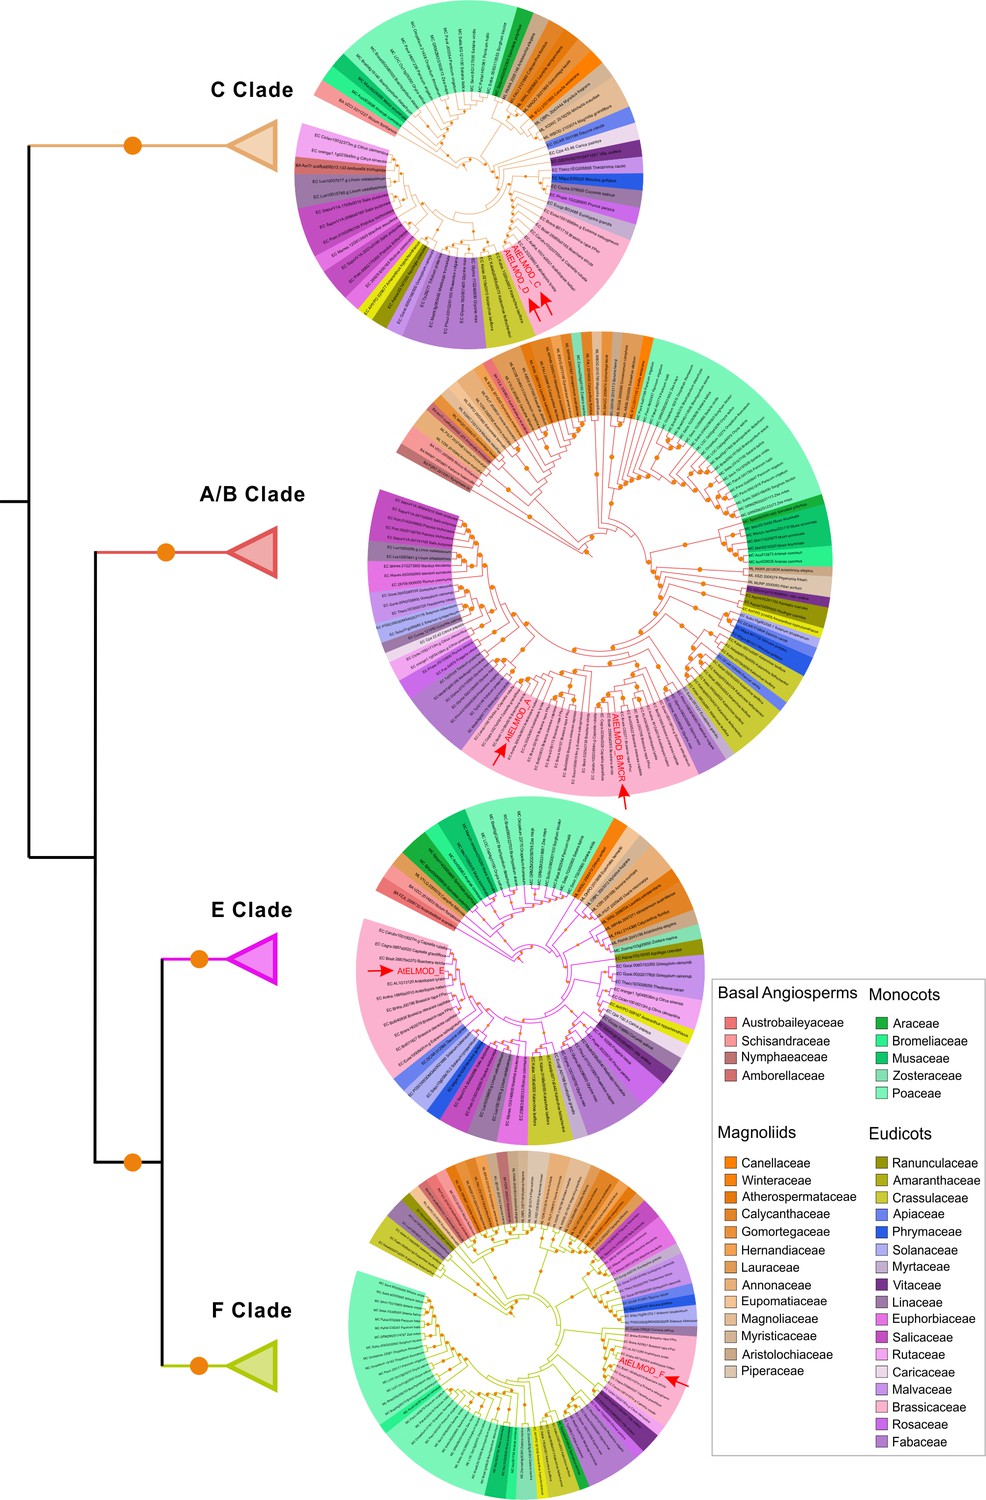
Angiosperm ELMOD proteins cluster into four clades.
Maximum likelihood phylogenetic tree of ELMOD proteins from angiosperms. The four distinct clades have been collapsed and details of each clade are presented as the pruned circular tree on the right. Label color shows the taxonomic group of each protein as indicated on the right. Orange circles indicate bootstrap values higher than 70%. Red arrowheads indicate the Arabidopsis ELMOD proteins. The complete tree can be accessed at http://itol.embl.de/shared/Zhou3117.
Figure 9 with 2 supplements
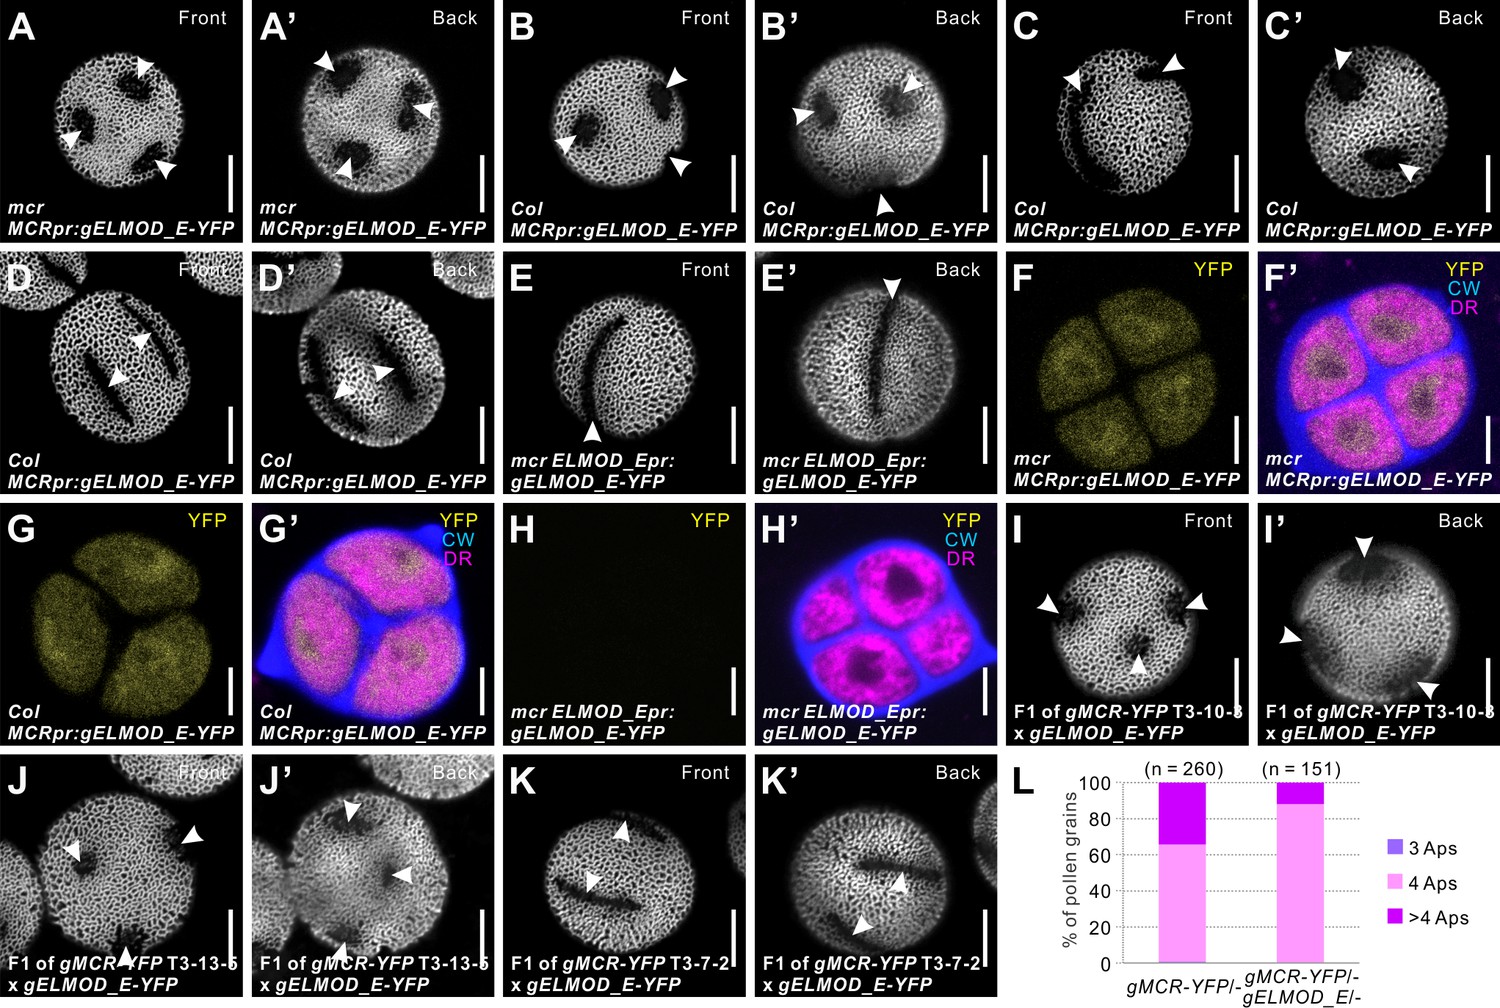
Arabidopsis ELMOD_E can affect aperture patterns.
(A–D’) Pollen grains from mcr (A, A’) and Col-0 (B–D’) plants expressing MCRpr:gELMOD_E-YFP. (E, E’) Pollen grain from mcr plants expressing ELMOD_Epr:gELMOD_E-YFP. (F–H’) Confocal images of tetrads expressing MCRpr:gELMOD_E-YFP and ELMOD_Epr:gELMOD_E-YFP. Adjacent panels show YFP signal (α) and merged signal (α’) from YFP, Calcofluor White (CW), and CellMask Deep Red (DR). (I–K’) Pollen grains from the F1 plants produced by crossing mcr MCRpr:gELMOD_E-YFP with three T3 lines of mcr MCRpr:gMCR-YFP (with single homozygous insertions of the MCR-YFP transgene, expressed, respectively, at low, medium, and high levels). (L) Percentage of pollen grains with indicated number of apertures in the pollen populations from F1 progeny of the mcr MCRpr:gMCR-YFP T3-7-2 line crossed with mcr or with mcr MCRpr:gELMOD_E-YFP. Number of analyzed pollen grains (from at least two individual plants) is indicated. Apertures are indicated with arrowheads. Scale bars, 10 μm for pollen and 5 μm for tetrads.
Figure 9—figure supplement 1
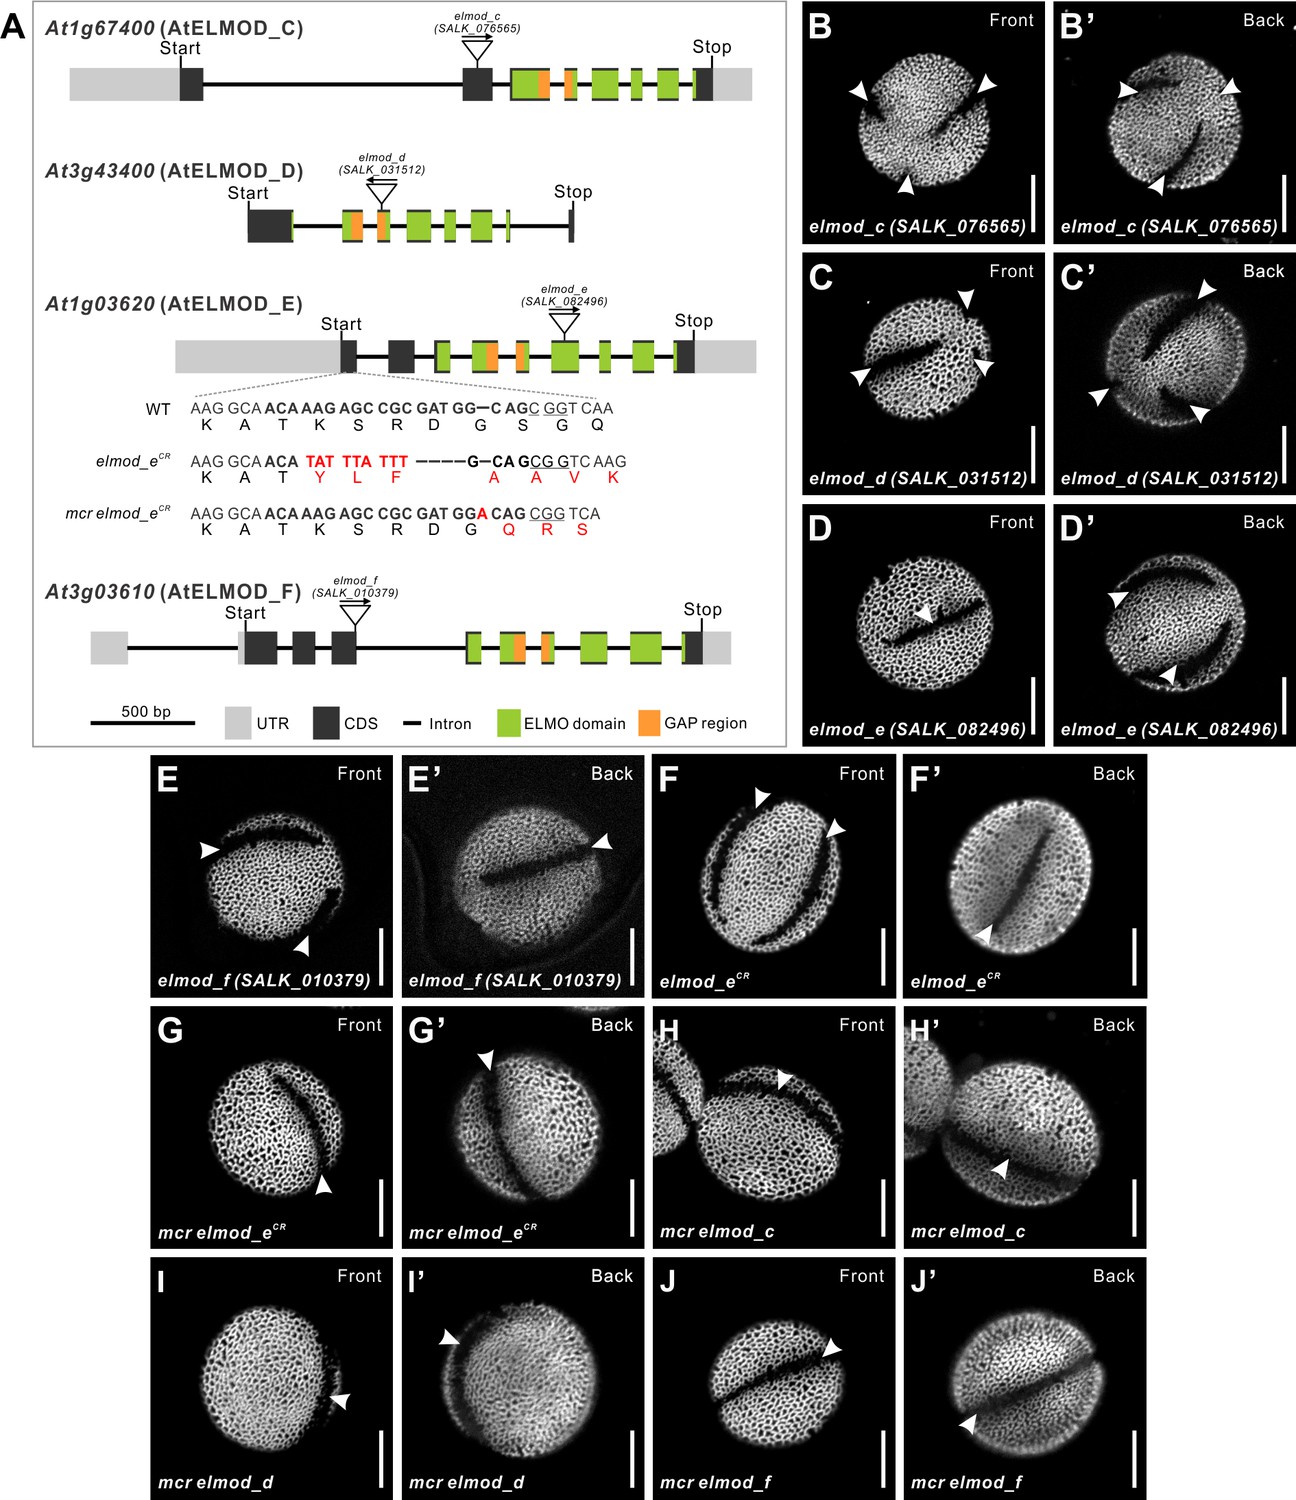
Disruptions of Arabidopsis ELMOD_C, ELMOD_D, ELMOD_E, and ELMOD_F do not affect aperture patterns.
(A) Diagram of the ELMOD_C (At1g67400), ELMOD_D (At3g43400), ELMOD_E (At1g03620), and ELMOD_F (At3g03610) genes. T-DNA insertion sites are indicated for each gene. For ELMOD_E, CRISPR alleles (elmod-eCR) were also generated in the wild-type and mcr backgrounds. Both alleles had frame shift mutations. The 20 bp target sequence next to the underlined protospacer adjacent motif is indicated in bold. Nucleotide and amino acid changes are indicated with red capital letters. (B–F’) Pollen grains of single T-DNA insertion mutants of ELMOD_C, ELMOD_D, ELMOD_E, ELMOD_F, and the CRISPR/Cas9 mutant of ELMOD_E (elmod_eCR). (G–J’) Pollen grains of the double mutants mcr elmod_eCR (G, G’), mcr elmod_c (H, H’), mcr elmod_d (I, I’), and mcr elmod_f (J, J’). Apertures are indicated with arrowheads. Scale bars, 10 μm.
Figure 9—figure supplement 2
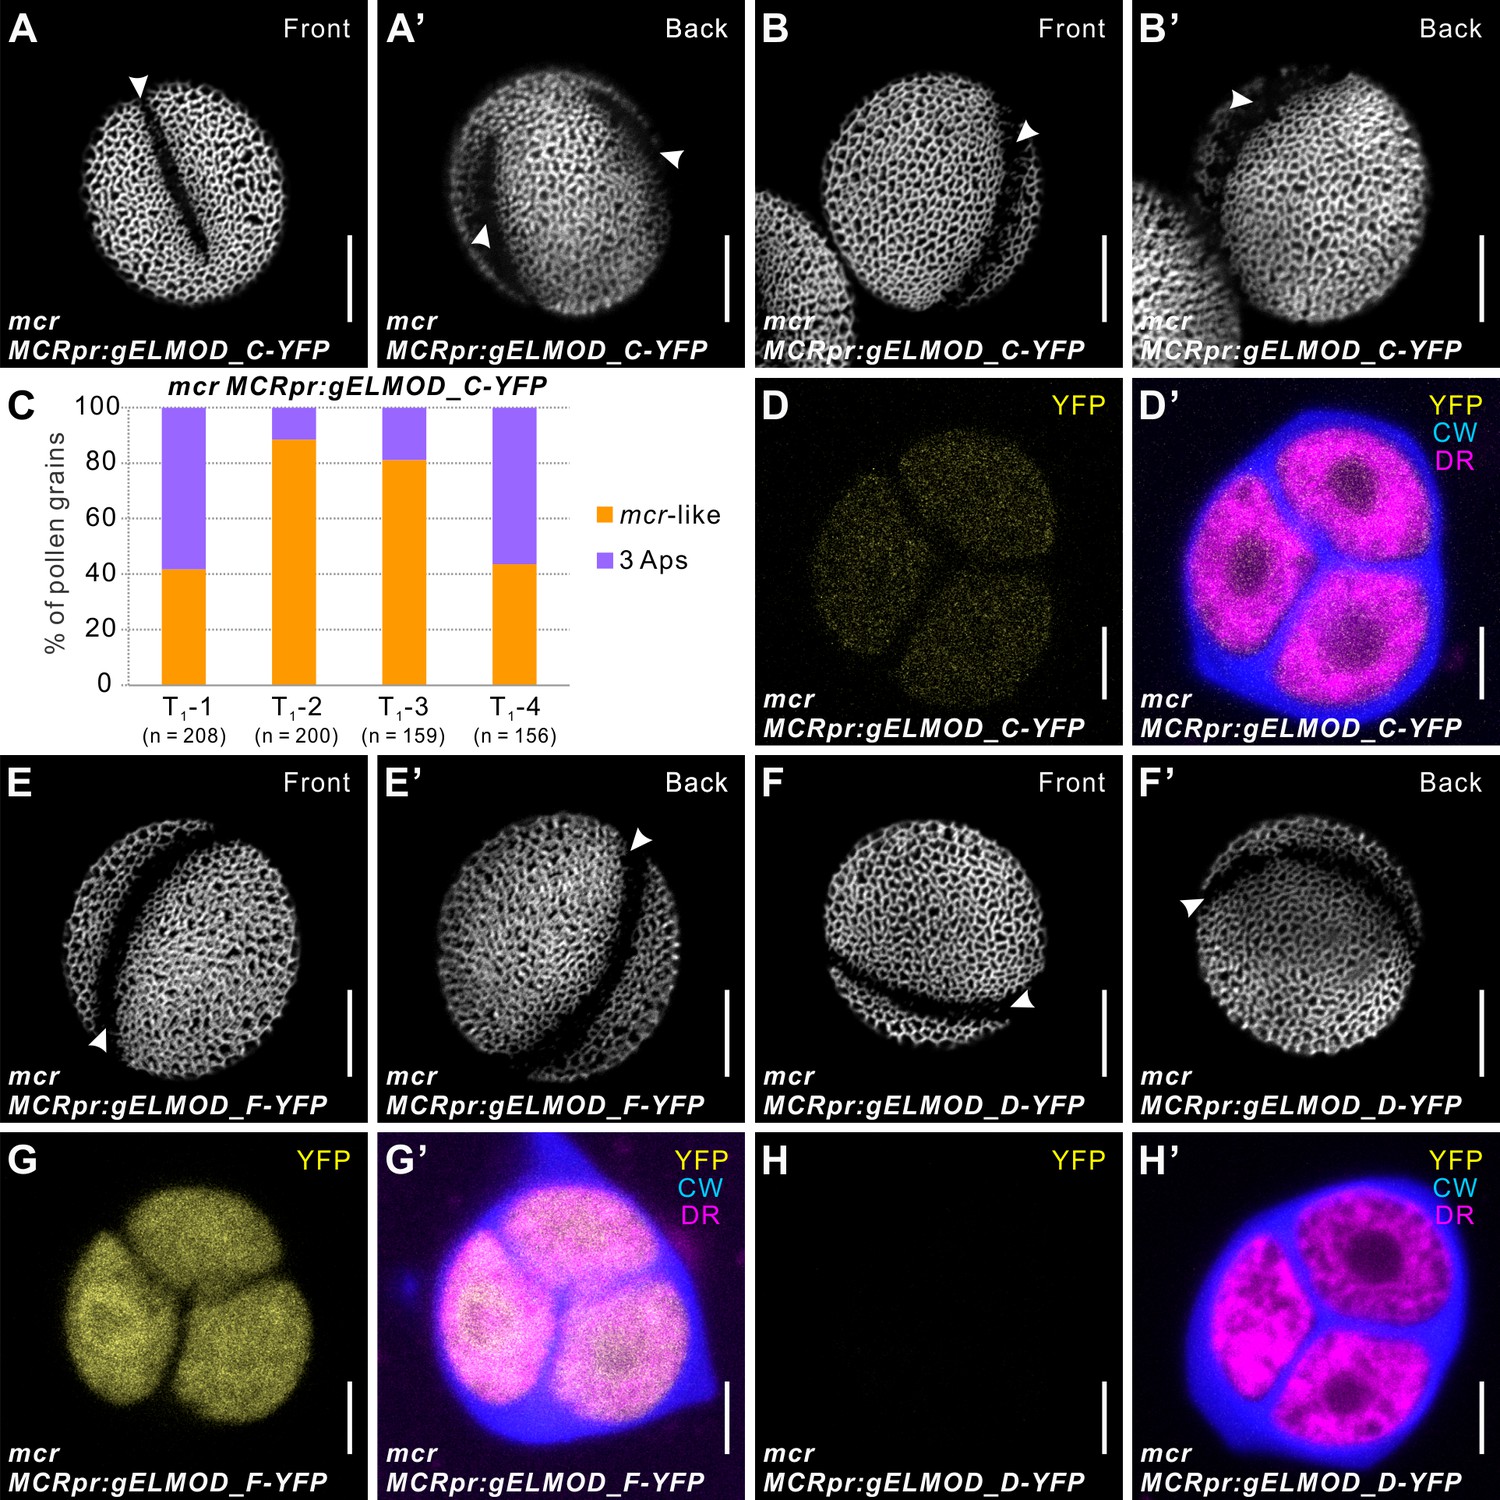
ELMOD_C, but not ELMOD_D and ELMOD_F, can partially substitute for MCR in aperture formation.
(A–B’, E–F’) Pollen grains from mcr MCRpr:gELMOD_C-YFP (A–B’), mcr MCRpr:gELMOD_F-YFP (E, E’), and mcr MCRpr:gELMOD_D-YFP (F, F’). Apertures are indicated with arrowheads. (D, D’ and G–H’) Confocal images of mcr tetrads expressing YFP fusions of ELMOD_C, ELMOD_F, and ELMOD_D. (D, D’) mcr tetrads expressing MCRpr:gELMOD_C-YFP have detectable YFP fluorescence. (G, G’) mcr tetrads expressing MCRpr:gELMOD_F-YFP show strong YFP fluorescence. (H, H’) There is no observable YFP fluorescence in the mcr tetrads expressing MCRpr:gELMOD_D-YFP. Adjacent panels show YFP fluorescence (α) and merged fluorescent signal (α’) from YFP, Calcofluor White (CW), and CellMask Deep Red (DR). Scale bars, 10 μm for pollen and 5 μm for tetrads. (C, C’) Percentage of pollen grains with indicated number of apertures in pollen populations from the T1 plants of mcr MCRpr:gELMOD_C-YFP. Number of analyzed pollen grains is indicated.
Figure 10 with 1 supplement
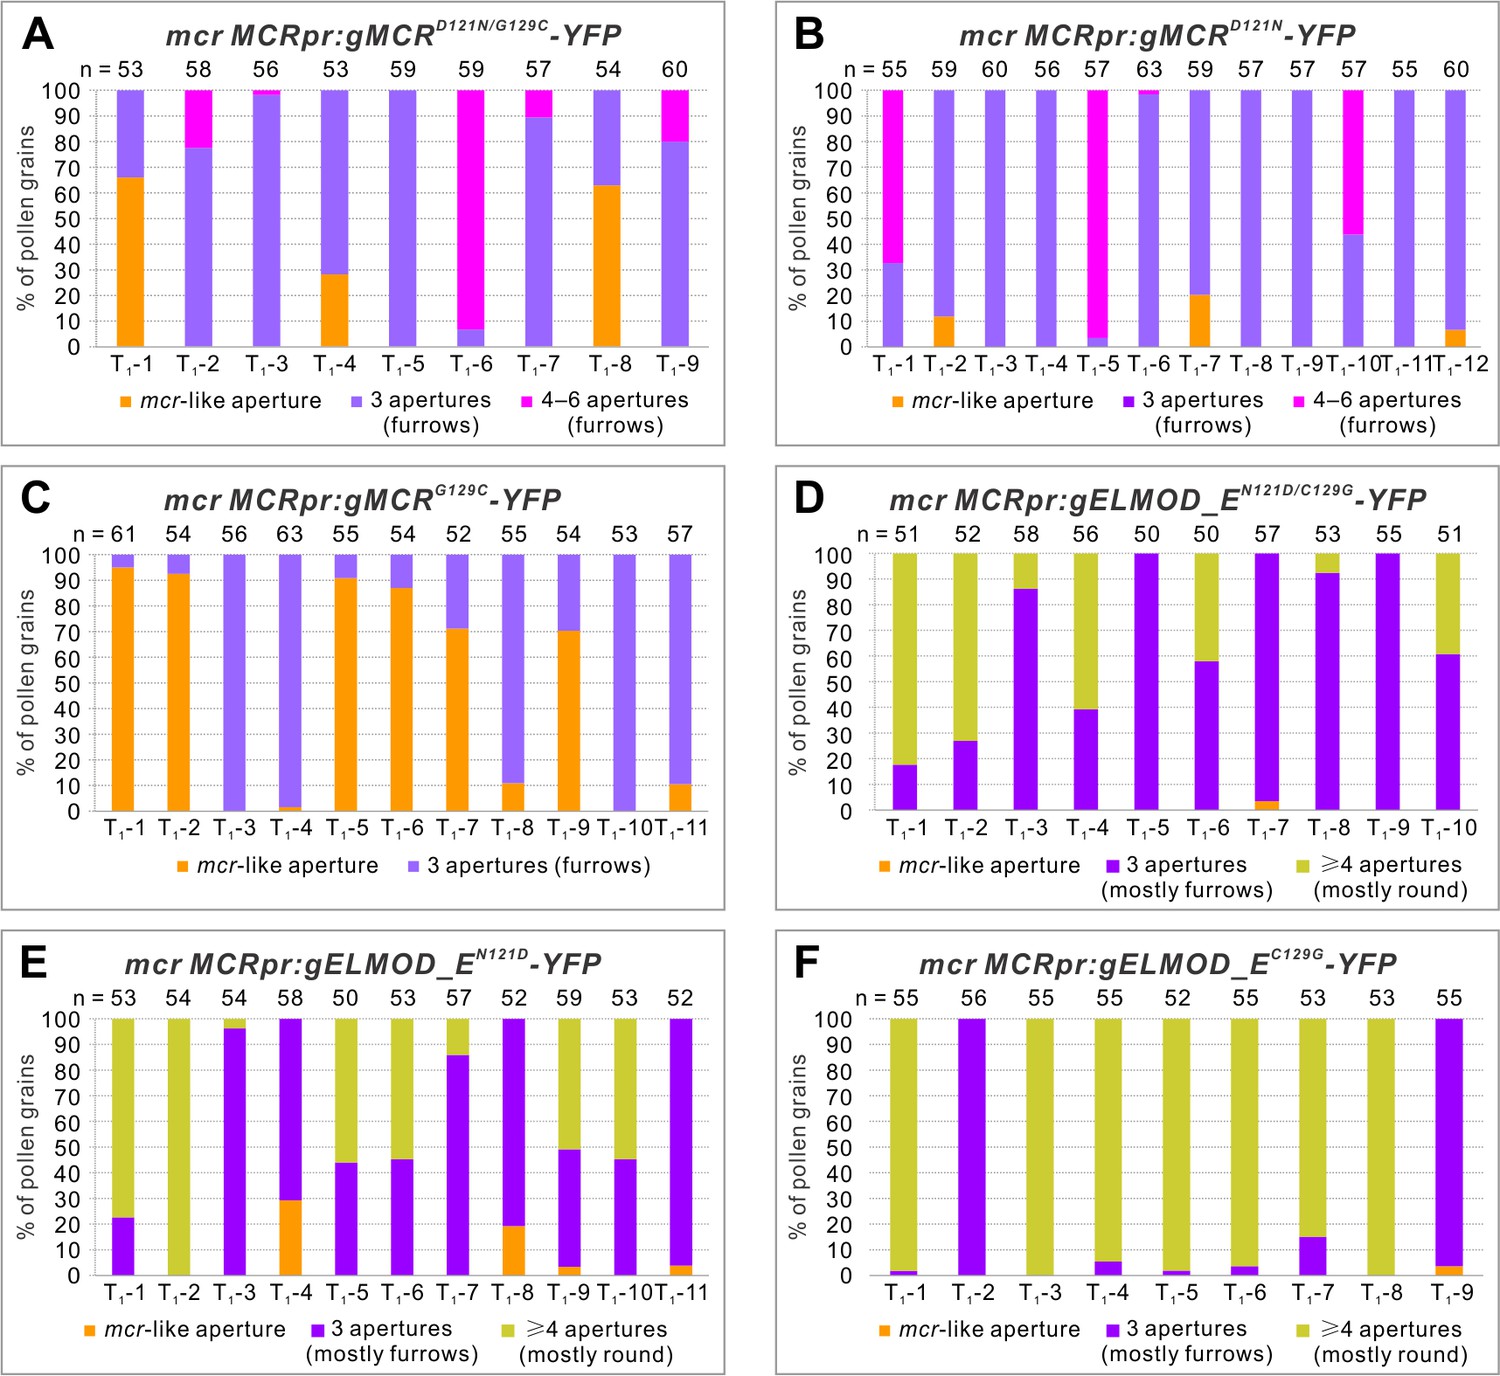
Residues 121 and 129 in the GAP region are important for MCR- and ELMOD_E-specific functions in aperture formation.
Percentage of pollen grains with indicated number of apertures in the pollen populations from independent T1 mcr plants expressing variants of MCRpr:gMCR-YFP (A–C) or MCRpr:ELMOD_A-YFP (D–F) with residues 121 and/or 129 mutated. Number of analyzed pollen grains is indicated above the bars.
Figure 10—figure supplement 1
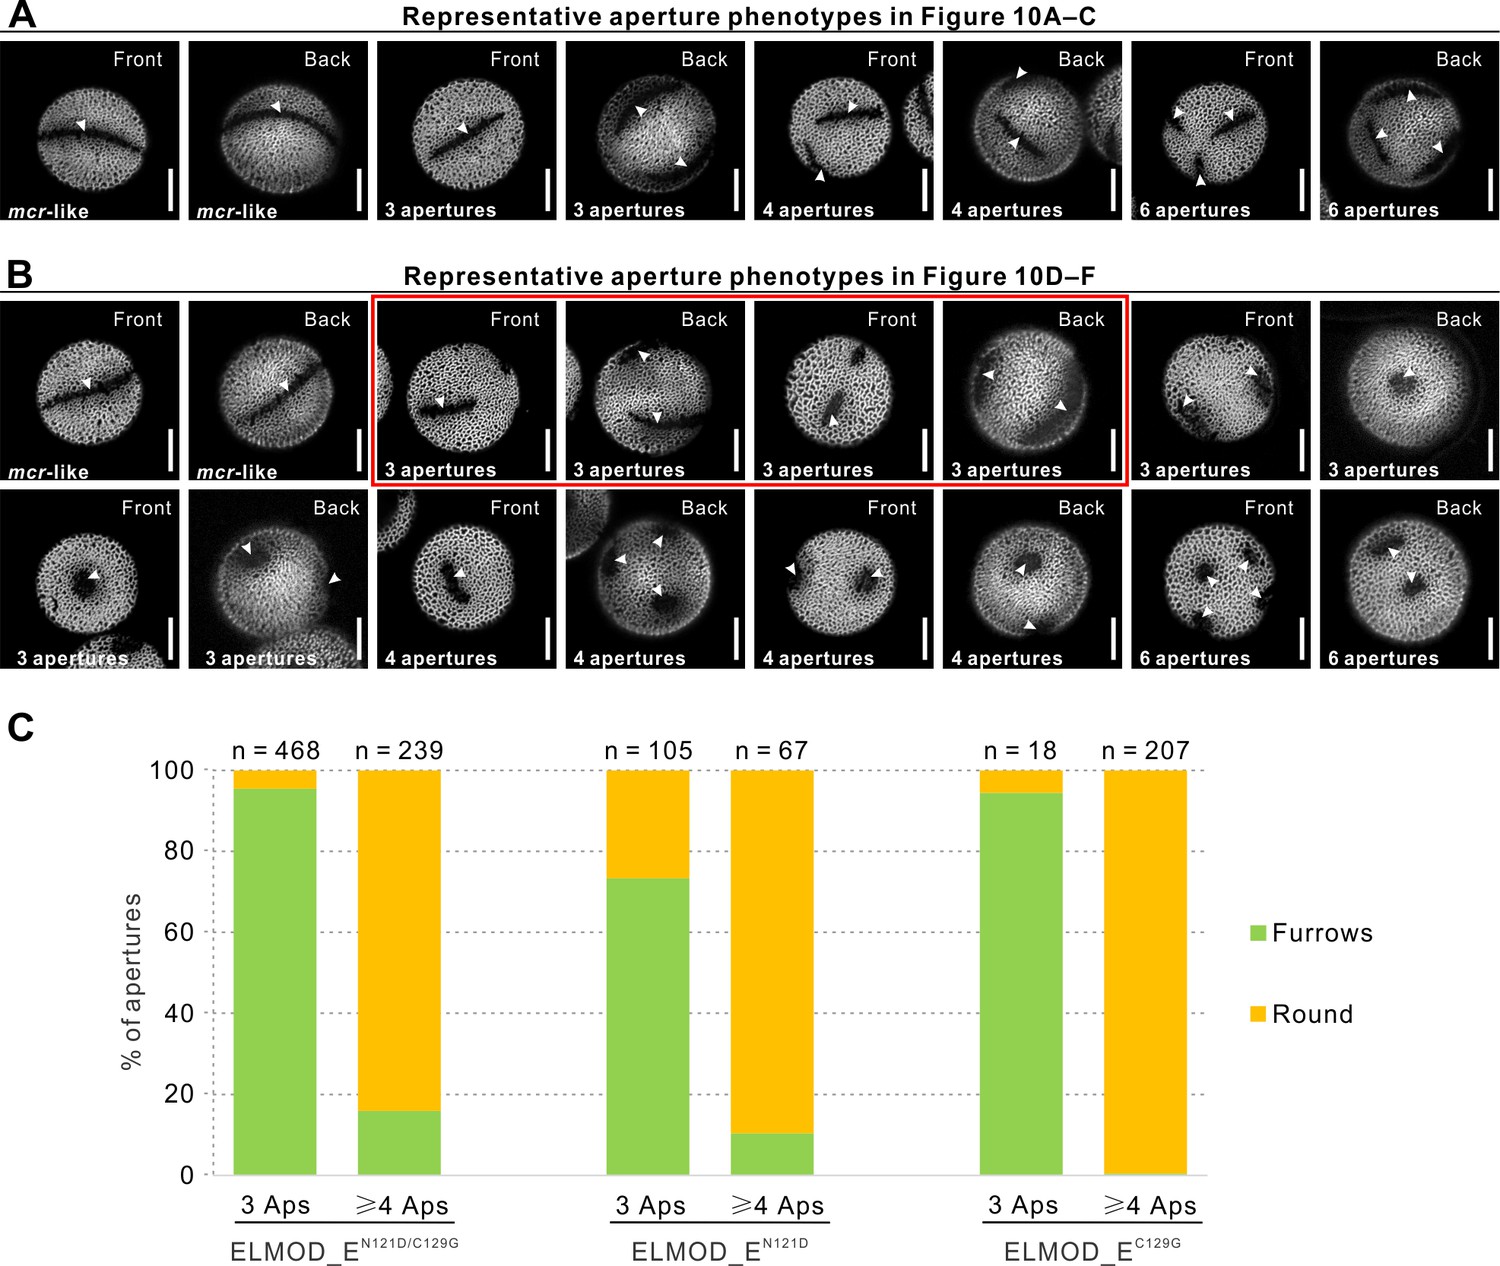
Representative aperture phenotypes observed in T1 plants related to Figure 10.
(A) Representative aperture phenotypes (all furrows) observed in T1 plants related to Figure 10A–C. (B) More diverse aperture phenotypes observed in T1 plants related to Figure 10D–F. Red box highlights the most common aperture morphologies of three normal or, sometimes, disconnected furrows observed in the T1 plants related to Figure 10D. Three round apertures were only found in the T1 plants related to Figure 10E and F. ≥4 apertures were mostly round. Apertures are indicated with arrowheads. Scale bars, 10 μm. (C) Quantification of aperture morphologies (furrows vs. round) in pollen with 3 apertures and ≥4 apertures in T1 plants expressing MCRpr:gELMOD_E-YFP with MCR-like mutations at positions 121 and 129 (related to Figure 10D–F). Total number of apertures analyzed for each aperture pattern across different T1 plants expressing the same transgenic construct is indicated. Pollen with three apertures had predominantly furrows and pollen with ≥4 apertures had mostly round apertures.
Tables
Key resources table
| Reagent type (species) or resource | Designation | Source or reference | Identifiers | Additional information |
|---|---|---|---|---|
| Gene (Arabidopsis thaliana) | ELMOD_A | https://www.arabidopsis.org/ | AT3G60260 | N/A |
| Gene (Arabidopsis thaliana) | MCR/ELMOD_B | https://www.arabidopsis.org/ | AT2G44770 | N/A |
| Gene (Arabidopsis thaliana) | ELMOD_C | https://www.arabidopsis.org/ | AT1G67400 | N/A |
| Gene (Arabidopsis thaliana) | ELMOD_D | https://www.arabidopsis.org/ | AT3G43400 | N/A |
| Gene (Arabidopsis thaliana) | ELMOD_E | https://www.arabidopsis.org/ | AT1G03620 | N/A |
| Gene (Arabidopsis thaliana) | ELMOD_F | https://www.arabidopsis.org/ | AT3G03610 | N/A |
| Strain, strain background(Agrobacterium tumefaciens) | GV3101 | Widely distributed | N/A | Competent cells |
| Genetic reagent(Arabidopsis thaliana) | mcr-1 | This study, EMS mutagenesis | N/A | See Supplementary file 1 for all other genetic reagents |
| Chemical compound, drug | Auramine O | Thermo Fisher Scientific | A96825 | N/A |
| Chemical compound, drug | Vectashield antifade solution | Vector Labs | H-1000-10 | N/A |
| Chemical compound, drug | Calcofluor White | PhytoTechnology Laboratories | C1933 | N/A |
| Chemical compound, drug | CellMask Deep Red | Thermo Fisher Scientific | C10046 | N/A |
| Software, algorithm | NIS Elements v.4.20 | Nikon Microscopy | N/A | N/A |
| Software, algorithm | MAFFT version 7 | Katoh and Standley, 2013; Katoh et al., 2002 | https://mafft.cbrc.jp/alignment/software/ | N/A |
| Software, algorithm | TrimAl | Capella-Gutiérrez et al., 2009 | https://vicfero.github.io/trimal/ | N/A |
| Software, algorithm | IQ-TREE | Nguyen et al., 2015 | http://www.iqtree.org/ | N/A |
| Software, algorithm | Origin version 2018 | OriginLab | https://www.originlab.com/ | N/A |
Additional files
-
Supplementary file 1
Primers, molecular markers, and mutants/transgenic lines used in this study.
- https://cdn.elifesciences.org/articles/71061/elife-71061-supp1-v1.docx
-
Transparent reporting form
- https://cdn.elifesciences.org/articles/71061/elife-71061-transrepform1-v1.docx
Download links
A two-part list of links to download the article, or parts of the article, in various formats.
Downloads (link to download the article as PDF)
Open citations (links to open the citations from this article in various online reference manager services)
Cite this article (links to download the citations from this article in formats compatible with various reference manager tools)
Members of the ELMOD protein family specify formation of distinct aperture domains on the Arabidopsis pollen surface
eLife 10:e71061.
https://doi.org/10.7554/eLife.71061


