Therapeutic downregulation of neuronal PAS domain 2 (Npas2) promotes surgical skin wound healing
- Regenerative Bioengineering and Repair Laboratory, Division of Plastic and Reconstructive Surgery, Department of Surgery, David Geffen School of Medicine, United States
- Weintraub Center for Reconstructive Biotechnology, United States
- Department of Plastic and Reconstructive Surgery, Faculty of Medicine, University of Tsukuba, Japan
- Division of Molecular and Regenerative Prosthodontics, Tohoku University Graduate School of Dentistry, Japan
Figures
Figure 1 with 1 supplement

Linear wound/scar model of murine dorsal skin.
(a) Schematic of the animal model. Vertical wounds (10 × 1.5 mm2) on both the left and right sides were made with a double-bladed scalpel. One 5–0 nylon suture was placed at the center of the wound. (b) The visual analog scale (VAS) was scored every postoperative day until postoperative day 7 using gross images of the wounds (n = 5 per group). (c) Postoperative gross images of the wounds/scars with a ruler in units of mm. (d) Histological images of the center (left) and periphery (right) of wounds/scars on postoperative day 7. The upper two were stained with hematoxylin-eosin (HE). The lower two were stained with Masson’s trichrome (MT). Yellow dotted lines indicate granulation tissue. Scale bar is 1000 μm. (e) The scar index was evaluated using HE-stained slices, and a significantly higher scar index was obtained in peripheral sections than in center sections (n = 5 per group). (f) The percent area of fibrous tissue in the peripheral section was significantly higher than that in the central section (n = 5 for center sections, n = 4 for peripheral sections).
-
Figure 1—source data 1
Methods for evaluating the scar index and percent area of fibrous tissue.
- https://cdn.elifesciences.org/articles/71074/elife-71074-fig1-data1-v2.xlsx
Figure 1—figure supplement 1
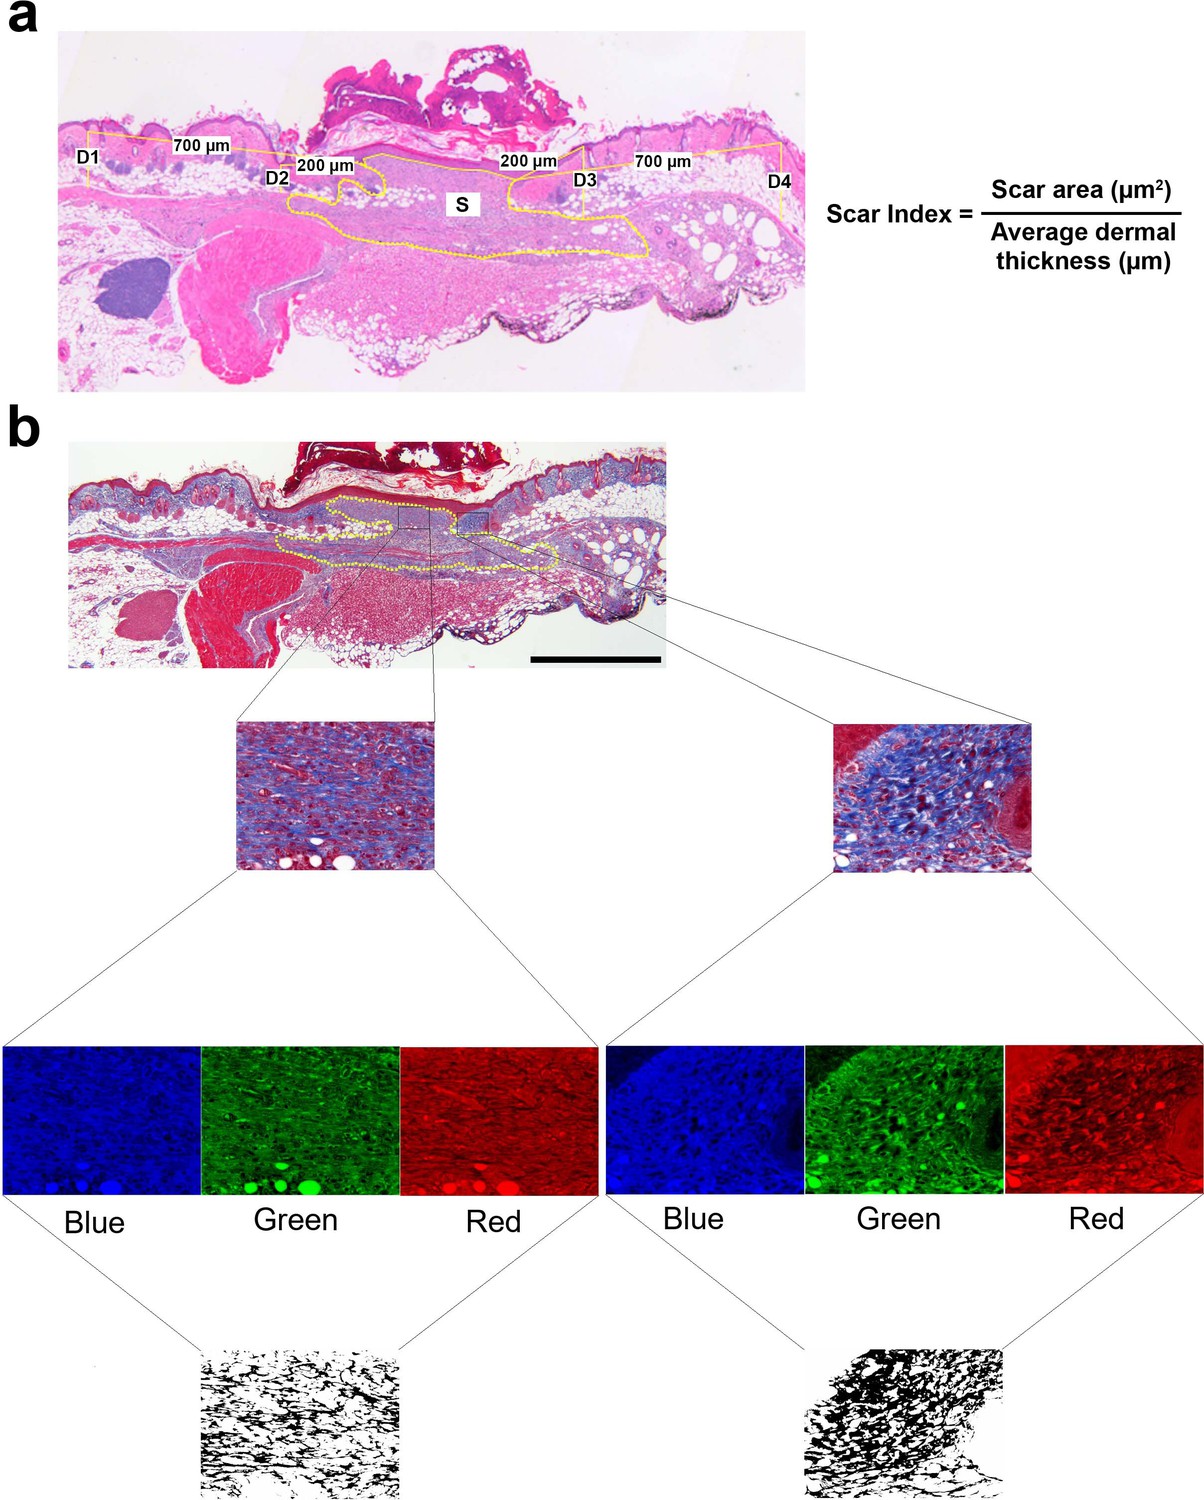
Methods for evaluating the scar index and percent area of fibrous tissue.
(a) Histological image illustrating the measurement of four points of dermal thickness (D1, D2, D3, and D4). The yellow dotted line represents the scar area (S). The scar index was calculated by dividing the scar area by the average dermal thickness. (b) The original Masson’s trichrome staining image was divided into blue, green, and red channels. The red channel image was then subtracted from the blue channel, yielding an image representing the fibrous tissues contained within the wound.
Figure 2
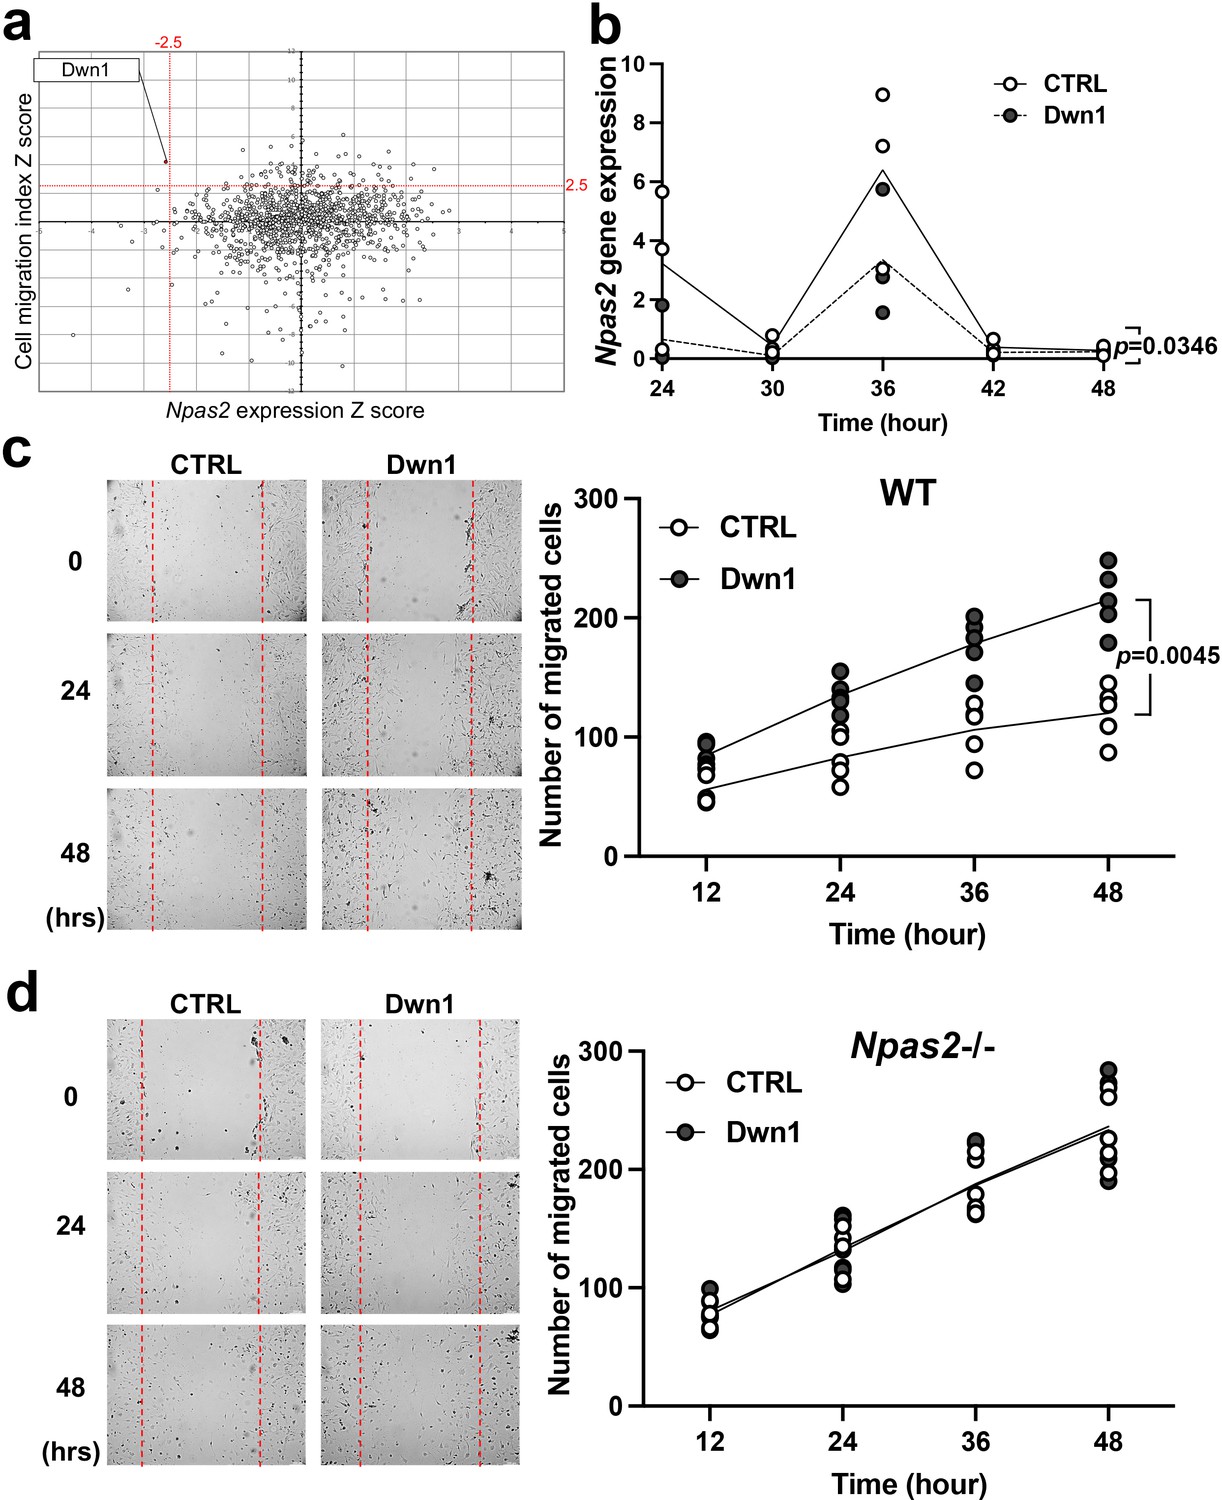
Selection and evaluation of the candidate compound Dwn1 for Npas2 suppression in dermal fibroblasts in vitro.
(a) A scatter plot of the high-throughput drug screening assay in vitro using the FDA-approved compound library at Molecular Screening Shared Resource (MSSR) at University of California Los Angeles (UCLA). A high absolute value of a negative Npas2 Z score indicates that Npas2 expression was highly downregulated (X axis). A high cell viability Z score indicates that fibroblasts had high viability (Y axis). A candidate compound (Dwn1) was selected based on the highest absolute value of the negative product of the Npas2 Z score and highest viability. (b) Circadian Npas2 expression in murine dermal fibroblasts treated with or without Dwn1 was evaluated (n = 3). The p value (0.0346) in the graph represents the subject of treatment. (c) The cell migration of murine dermal fibroblasts treated with Dwn1 was evaluated. The number of cells that migrated toward the central area was counted (n = 5). The p value (0.0045) in the graph represents the subject of treatment and time. (d) The cell migration of Npas2 knockout (KO) fibroblasts treated with Dwn1 was evaluated. The cell migration to the scratched area by Npas2 KO fibroblasts was not affected by Dwn1.
-
Figure 2—source data 1
Selection and evaluation of the candidate compound Dwn1 for Npas2 suppression in dermal fibroblasts in vitro.
- https://cdn.elifesciences.org/articles/71074/elife-71074-fig2-data1-v2.xlsx
Figure 3
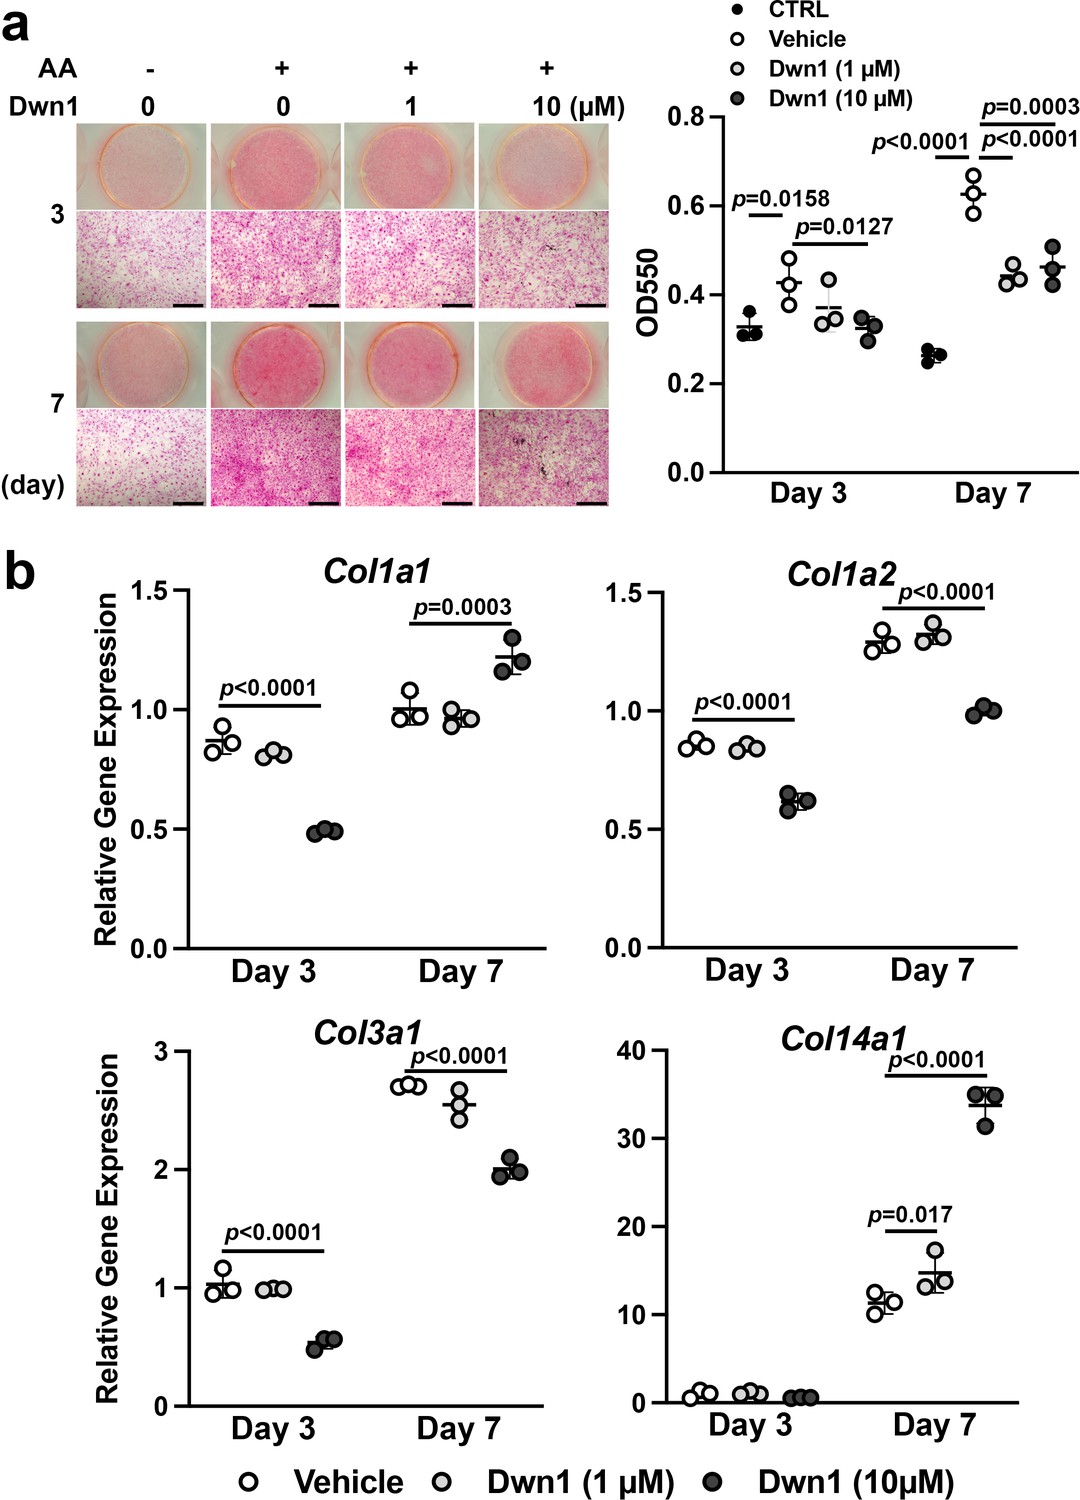
Effects of Dwn1 on collagen synthesis in murine dermal fibroblasts in vitro.
(a) Gross and microscopic images of picrosirius red staining of murine dermal fibroblasts treated with various doses of Dwn1 on days 3 and 7. The right graph represents a quantitative measurement of picrosirius red. (n = 3) AA: L-ascorbic acid. OD: optical density. CTRL: fibroblasts treated with control medium without AA. (b) Gene expression of collagen type Iα1 (Col1a1), Iα2 (Col1a2), IIIα1 (Col3a1), and XIV (Col14a1) in fibroblasts treated with various doses of Dwn1 on days 3 and 7 (n = 3).
-
Figure 3—source data 1
Effects of Dwn1 on collagen synthesis in murine dermal fibroblasts in vitro.
- https://cdn.elifesciences.org/articles/71074/elife-71074-fig3-data1-v2.xlsx
Figure 4 with 1 supplement
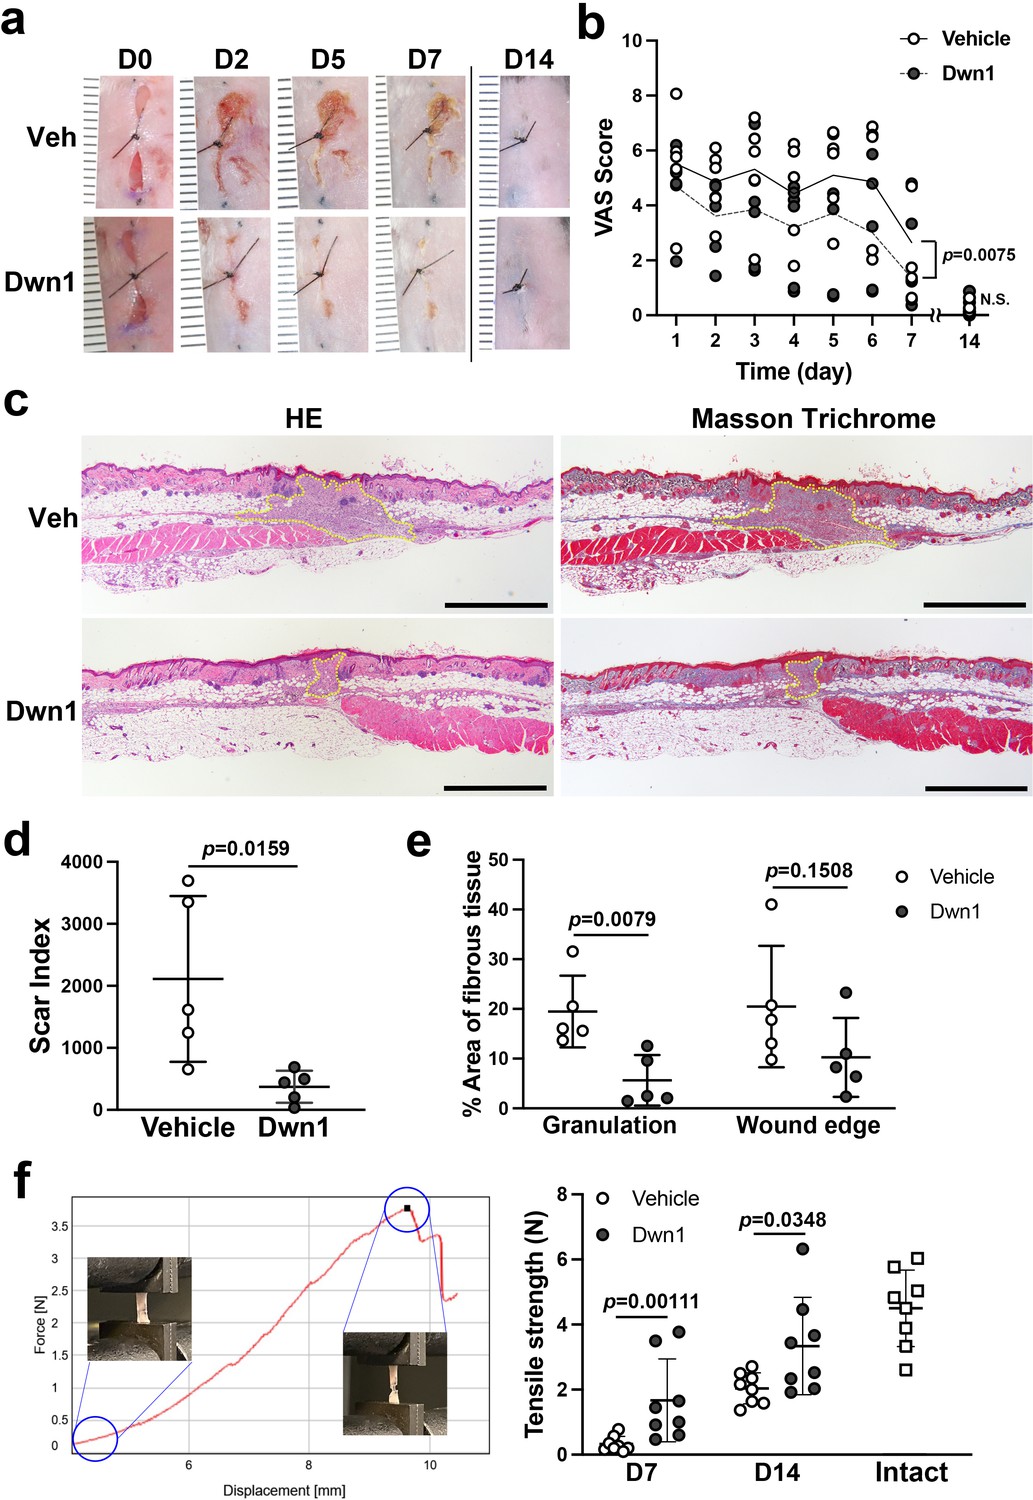
Effects of Dwn1 on the murine dorsal incisional wound model.
(a) Gross images on days 0, 2, 5, 7, and 14 (D0, D2, D5, D7, and D14, respectively) after the surgery and starting topical daily application of the vehicle (10% DMSO) or Dwn1 on the wounds. Veh: vehicle. (b) Visual analog scale (VAS) of the wounds treated with vehicle (n = 5) or Dwn1 (n = 6). During the first 7 days, the p value (0.0075) in the graph represents the subject of treatment. There was a significant effect on time (p < 0.0001). The interaction time and treatment had no significant effect (p = 0.3539). On day 14, there was no significant difference (p = 0.6889) in VAS scores between the vehicle control (n = 8) and the Dwn1-treated group (n = 4). (c) Histological images of peripheral wounds treated with vehicle or Dwn1 on day 7 postoperatively. Yellow dotted lines indicate granulation tissue. Left images were stained with hematoxylin-eosin (HE), and right images were stained with Masson’s trichrome (MT). Scale bar is 1000 μm. (d) The scar index of wounds treated with vehicle or Dwn1 was evaluated (n = 5). (e) The percentage area of fibrous tissue was evaluated using MT-stained slices (n = 5). (f) (Left) Representative force-displacement curve of a dermal strip. Inserted images represented the dermal strips at the beginning and termination of the tensile strength test. (Right) The maximum load to tear the dermal strip including the incisional wound at the center treated with vehicle or Dwn1. The tensile strength of Dwn1-treated dermal strips (n = 8) were significantly larger than vehicle-treated dermal strips on both 7 and 14 days after wounding.
-
Figure 4—source data 1
The tensile strength in the vehicle control dermal wound on day 21.
- https://cdn.elifesciences.org/articles/71074/elife-71074-fig4-data1-v2.xlsx
Figure 4—figure supplement 1

The tensile strength in the vehicle control dermal wound on day 21.
There was a significant difference between vehicle and intact skin (t-test, p = 0.0048), and the tensile strength in the vehicle control dermal wound (2.61 ± 0.91) was not significantly increased (t-test, p = 0.1418) from that on day 14 (2.04 ± 0.48) (Figure 4f).
Figure 5
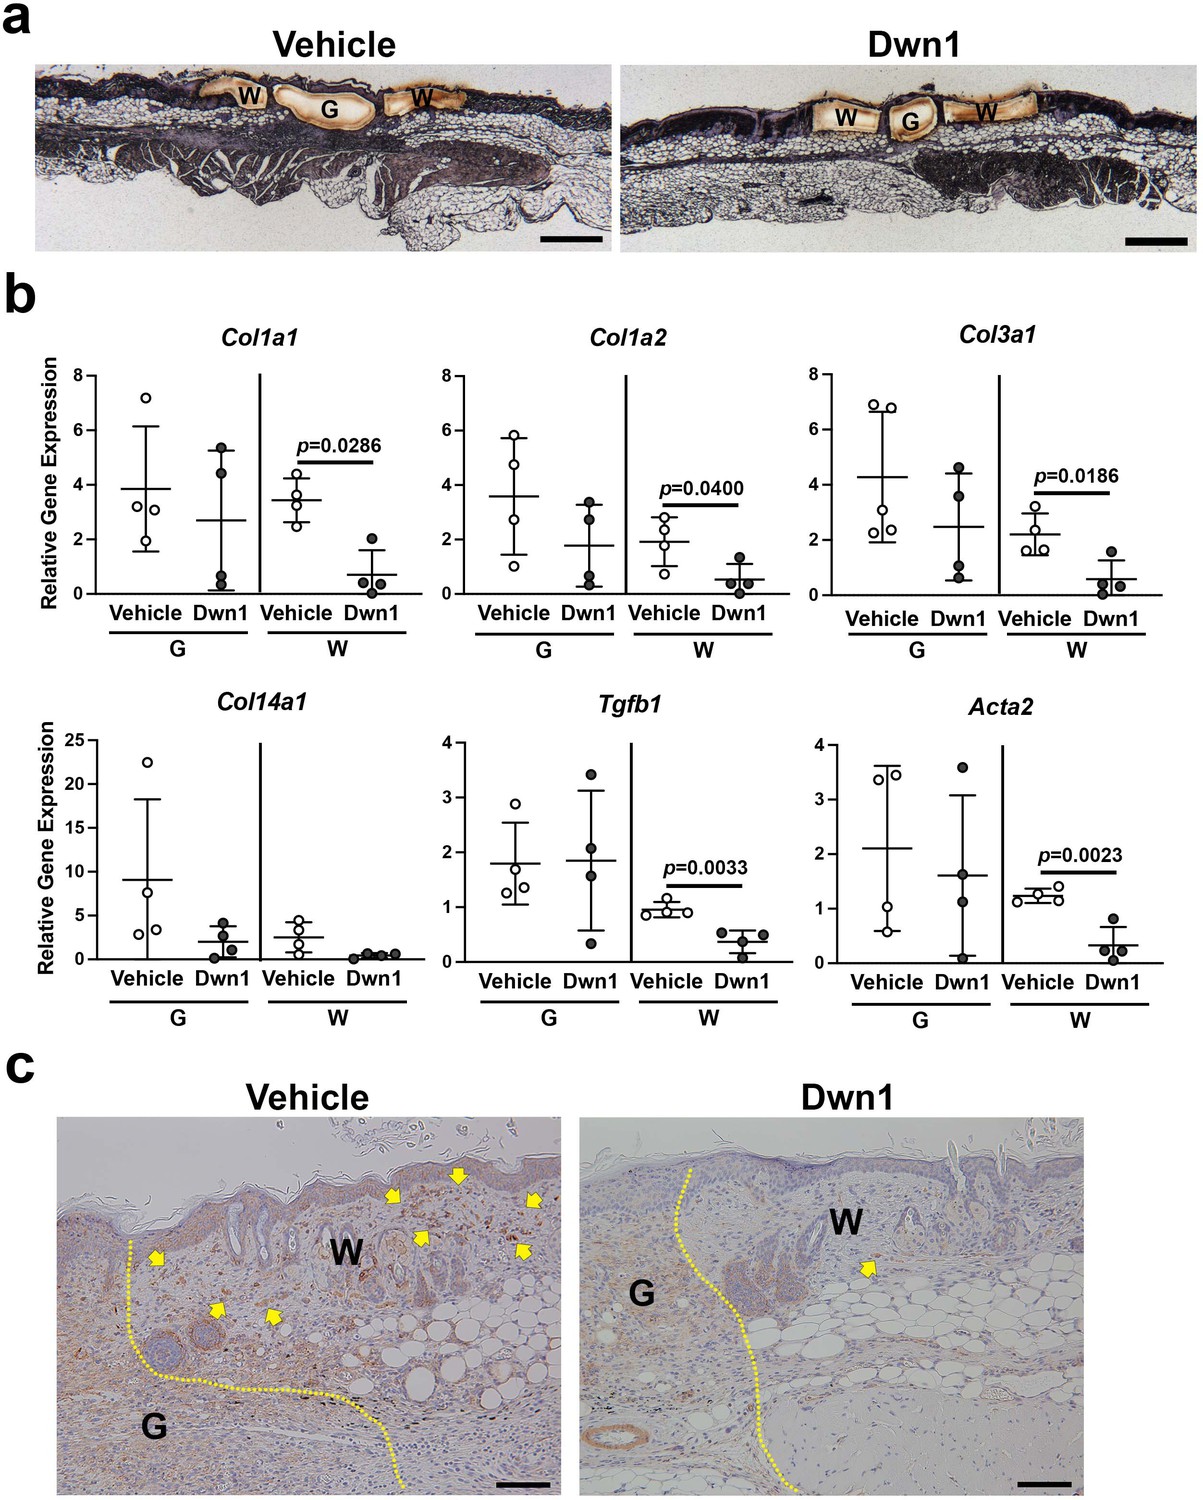
Molecular biological effects of Dwn1 on the murine dorsal incisional wound model.
(a) A typical post-laser capture microdissection (LCM) image. Slides were briefly stained with hematoxylin and eosin before LCM. G: granulation tissue, W: wounded tissue. (b) Gene expression of collagen type Iα1 (Col1a1), Iα2 (Col1a2), IIIα1 (Col3a1), XIV (Col14a1), Tgfβ1, and α-SMA (Acta2) in granulation tissue (G) and wounded tissue (W) on day 7 postoperatively. Gapdh was used as an internal control. Gene expression of collagen type Iα1, Iα2, IIIα1, Tgfβ1, and α-SMA in the wounded tissue treated with Dwn1 was significantly increased versus those treated with the vehicle (n = 5 per group). (c) Immunohistochemical staining of α-SMA in wounds treated with vehicle or Dwn1 on postoperative day 7. Yellow dotted lines indicate granulation tissue. Scale bar is 100 μm.
-
Figure 5—source data 1
Molecular biological effects of Dwn1 on the murine dorsal incisional wound model.
- https://cdn.elifesciences.org/articles/71074/elife-71074-fig5-data1-v2.xlsx
Tables
Key resources table
| Reagent type (species) or resource | Designation | Source or reference | Identifiers | Additional information |
|---|---|---|---|---|
| Cell line (Homo sapiens) | Dermal fibroblast (normal, Adult) | ATCC | CCD-1122Sk | RRID: CVCL_2360 |
| Antibody | Rabbit anti-α-SMA | Abcam | ab32575 | 1/500 |
| Other | Oris Pro Cell Migration Assay 384-well plate | Platypus Technologies | PRO384CMA1 | |
| Other | Masson’s trichrome | Polysciences, Inc | 25088–1 | |
| Other | Picrosirius red staining kit | Polysciences, Inc | 24901 | |
| Other | Taqman Gene Expression Assays | Thermo Fisher Scientific | Mm00801666_g1 | Col1a1 |
| Other | Taqman Gene Expression Assays | Thermo Fisher Scientific | Mm00483888_m1 | Col1a2 |
| Other | Taqman Gene Expression Assays | Thermo Fisher Scientific | Mm00802300_m1 | Col3a1 |
| Other | Taqman Gene Expression Assays | Thermo Fisher Scientific | Mm00805269_m1 | Col14a1 |
| Other | Taqman Gene Expression Assays | Scientific | Mm01178820_m1 | Tgfb1 |
| Other | Taqman Gene Expression Assays | Scientific | Mm01546133_m1 | Acta2 |
| Software, algorithm | ImageJ | NIH | http://imagej.nih.gov/ij/ | RRID:SCR_003070 |
| Software, algorithm | GraphPad Prism | GraphPad Software | https://graphpad.com | RRID:SCR_002798 |
Additional files
Download links
A two-part list of links to download the article, or parts of the article, in various formats.
Downloads (link to download the article as PDF)
Open citations (links to open the citations from this article in various online reference manager services)
Cite this article (links to download the citations from this article in formats compatible with various reference manager tools)
Therapeutic downregulation of neuronal PAS domain 2 (Npas2) promotes surgical skin wound healing
eLife 11:e71074.
https://doi.org/10.7554/eLife.71074


