Gut bacterial aggregates as living gels
- Department of Physics, Institute of Molecular Biology, and Materials Science Institute, University of Oregon, United States
- Department of Physics and Department of Molecular and Cell Biology, University of California, Berkeley, United States
Figures
Figure 1

Overview of experimental methods.
Larval zebrafish were derived germ-free and then monoassociated with single bacterial species (left). After 24 hr of colonization, images spanning the entire gut were acquired with light sheet fluorescence microscopy (middle). An example image of the anterior intestine is shown on the right, with instances of single cells and multicellular aggregates marked. The image is a maximum intensity projection of a 3D image stack. The approximate boundary of the gut is outlined in orange. Sizes of bacterial clusters were estimated with image analysis by separately identifying single cells and multicellular aggregates, and then normalizing the fluorescence intensity of aggregates by the mean single cell fluorescence.
Figure 2 with 2 supplements
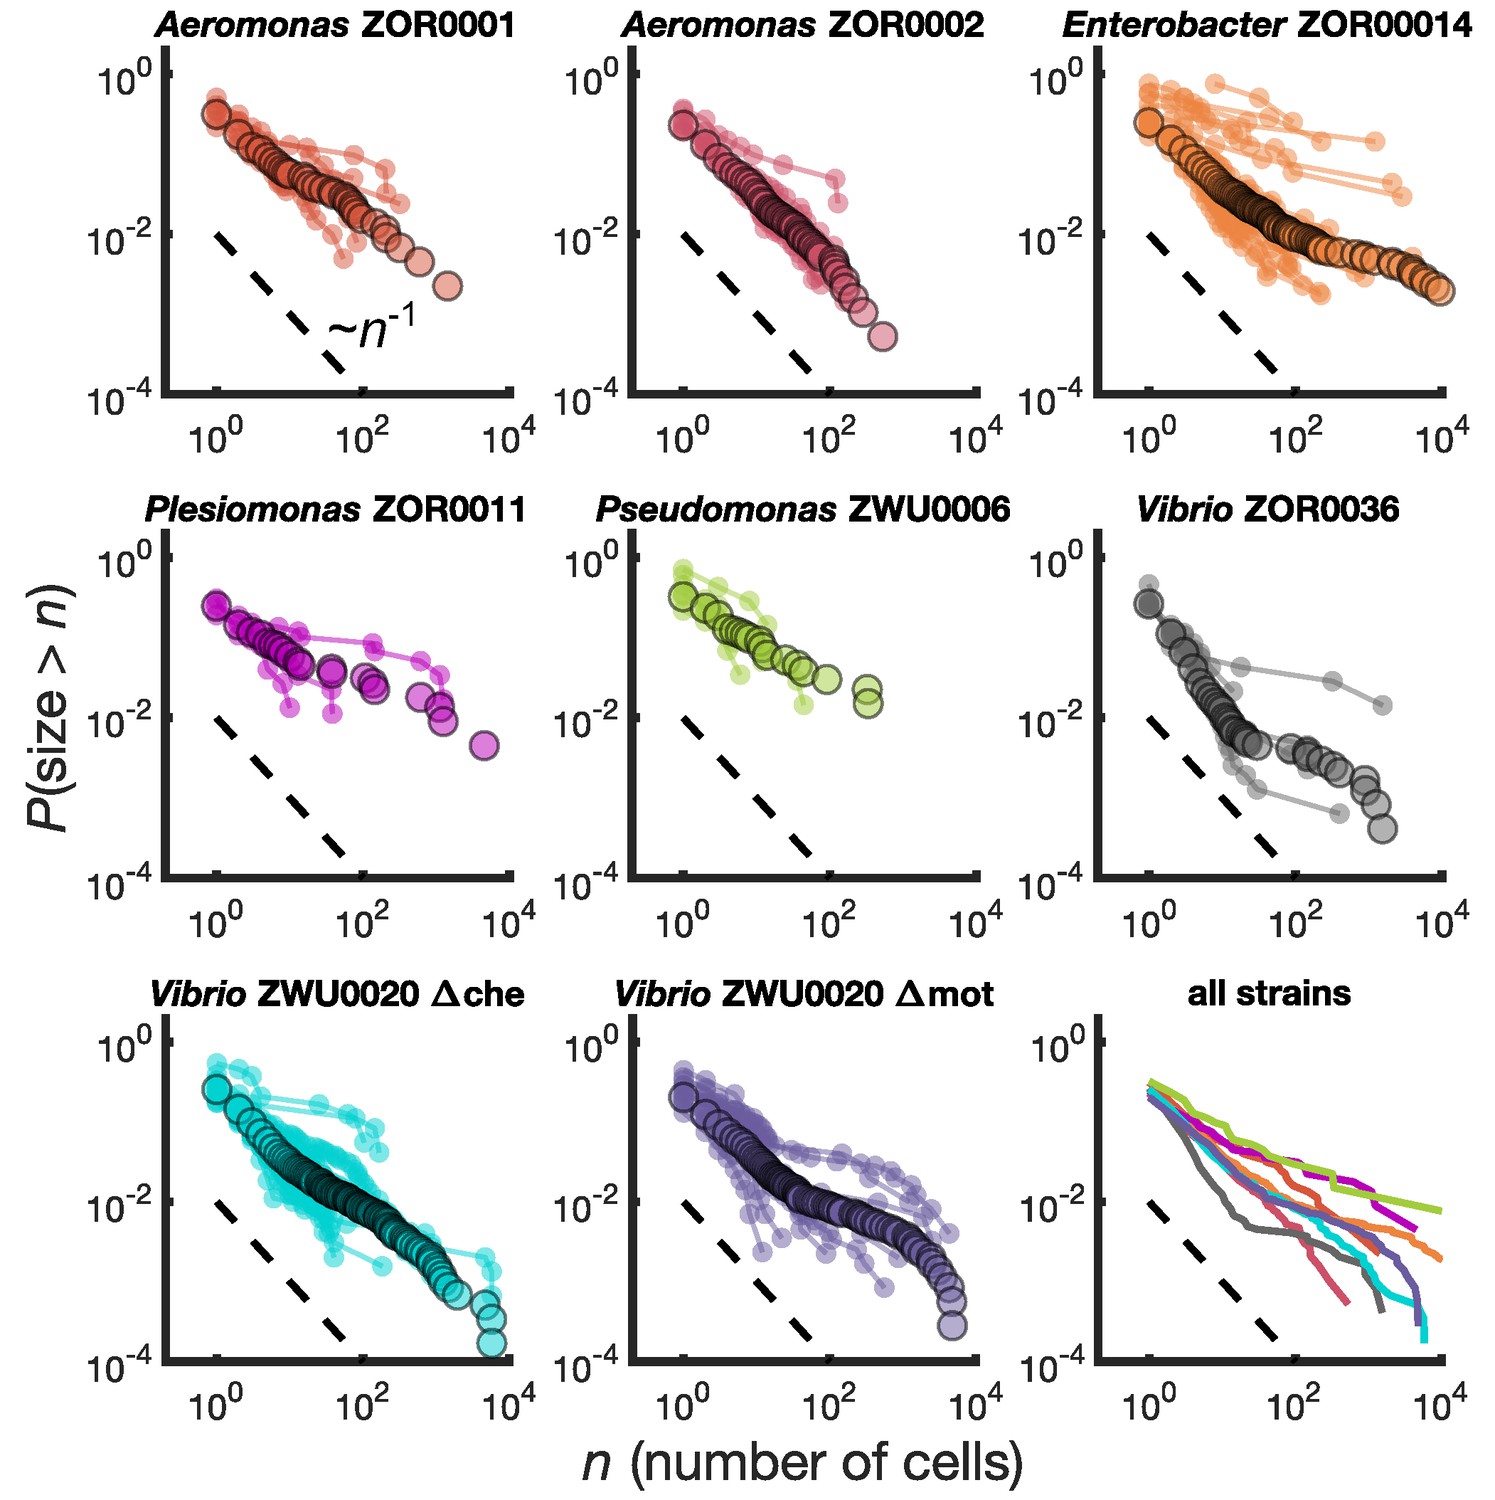
Different bacterial species exhibit similar cluster size distributions.
Reverse cumulative distributions, the probability that the cluster size is greater than as a function of , for eight bacterial strains in larval zebrafish intestines. Small circles connected by lines represent the distributions constructed from individual fish. Large circles are from pooled data from all fish. The dashed line represents and is a guide to the eye. Bottom right panel shows the pooled distributions for each strain as solid lines.
-
Figure 2—source data 1
Spreadsheet with all cluster sizes by strain.
- https://cdn.elifesciences.org/articles/71105/elife-71105-fig2-data1-v2.xlsx
Figure 2—figure supplement 1
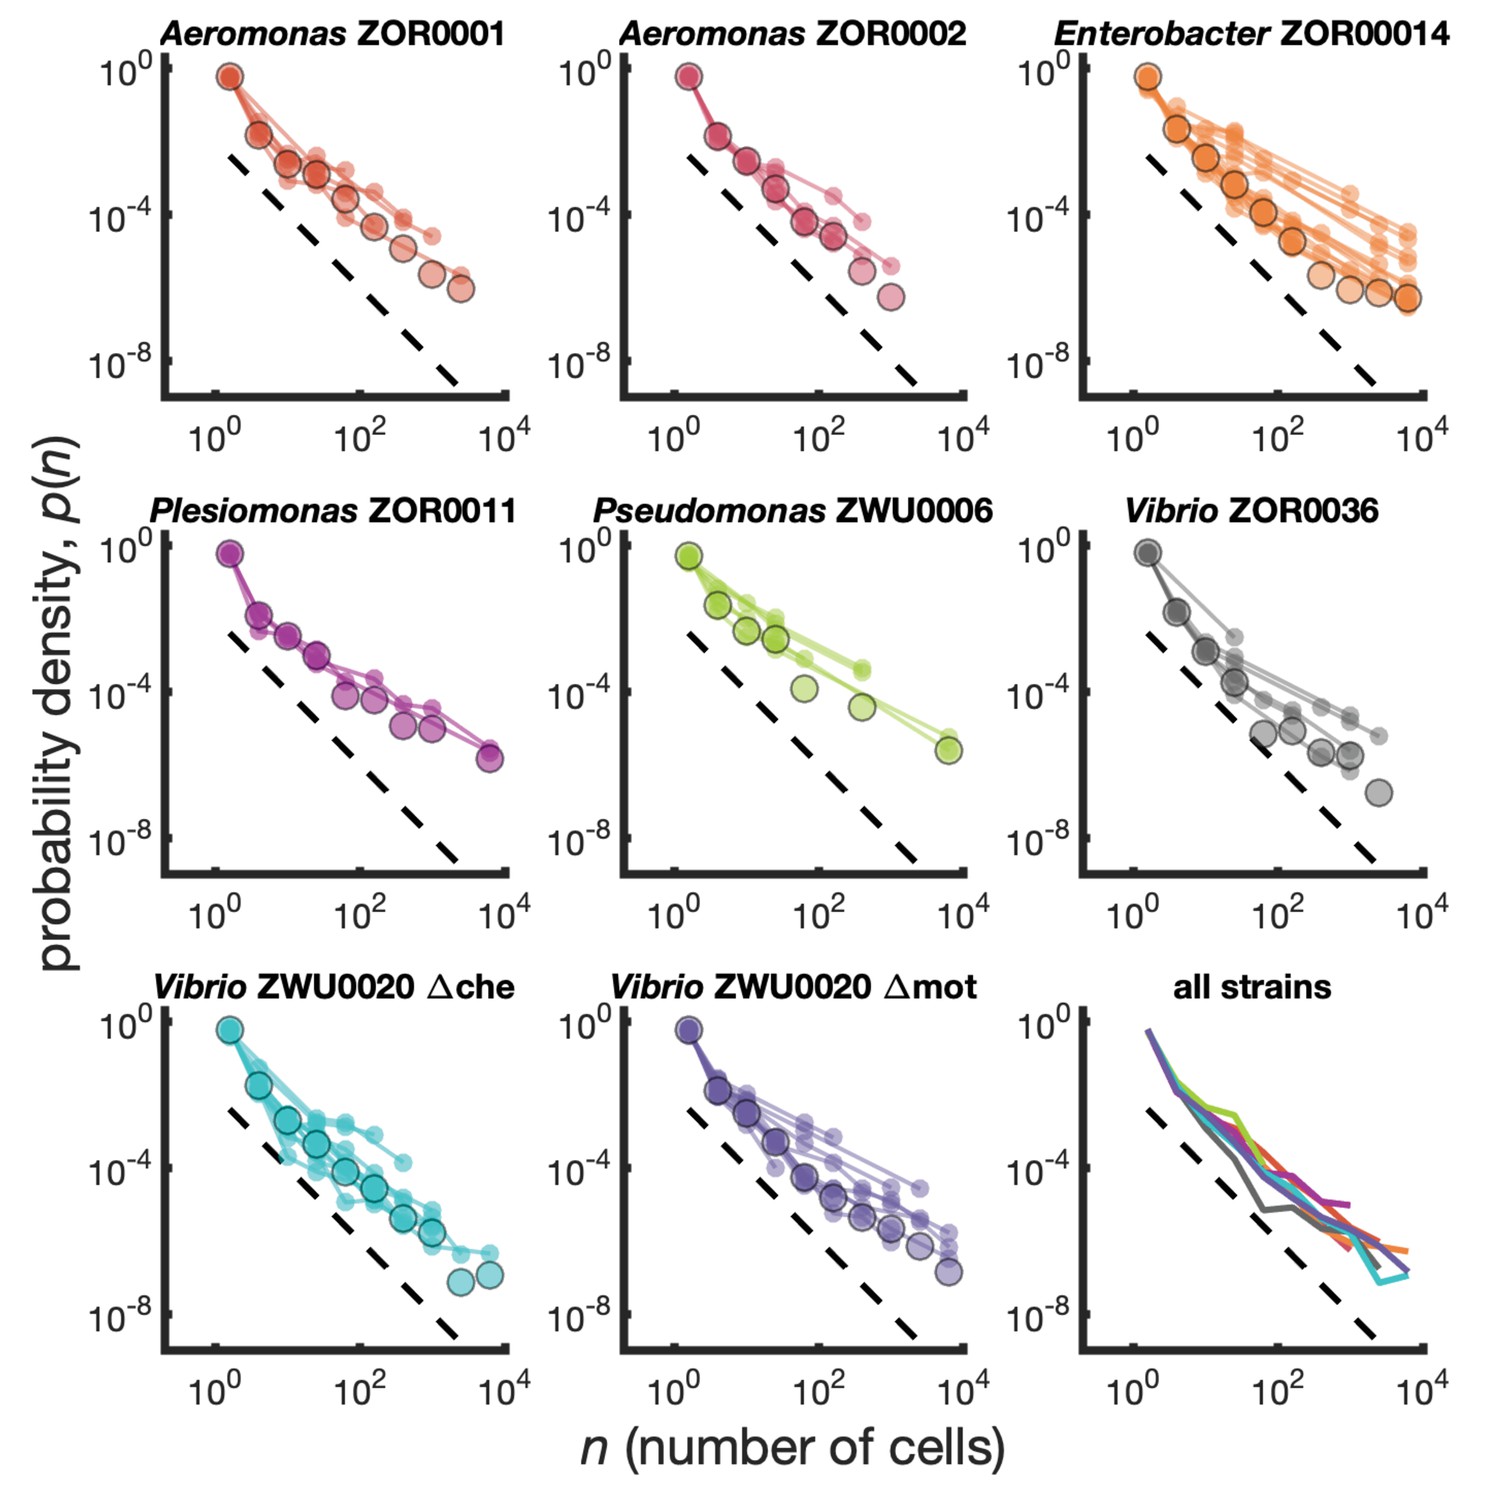
Cluster size distributions as probability densities.
Different bacterial species exhibit similar cluster size distributions. Probability densities for eight bacterial strains monoassociated in larval zebrafish intestines. Small circles connected by lines represent the distributions constructed for each fish. Large circles are the result of pooling together sizes from all fish. Dashed line represents and is a guide to the eye. Bottom right panel shows the pooled distributions for each strain as solid lines. Summary of data is given in Table 1.
Figure 2—figure supplement 2
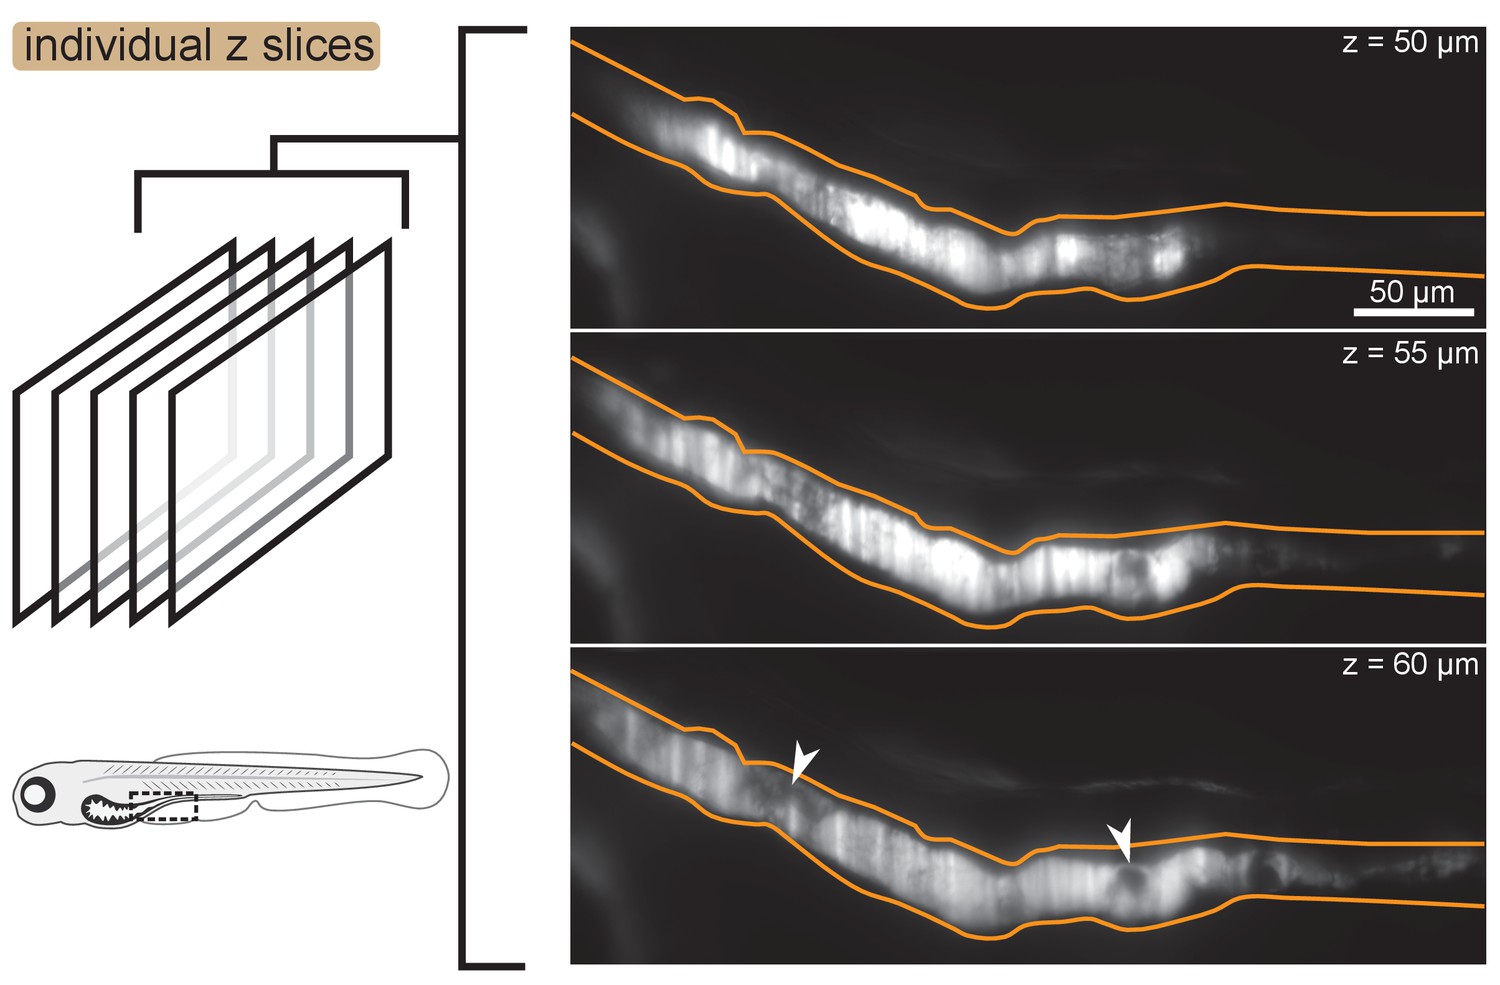
Images of individual -slices showing mild heterogeneity of fluorescence intensity within aggregates.
Fluorescence intensity is mostly homogeneous within clusters, although small dark regions do occur. Three individual z slices of a fish colonized with Enterobacter are shown. The approximate gut boundary is outlined in orange. Dark regions within the cluster are noted with white arrows. The approximate location of the field of view within the animal is noted with a dashed black box on the fish cartoon.
Figure 3
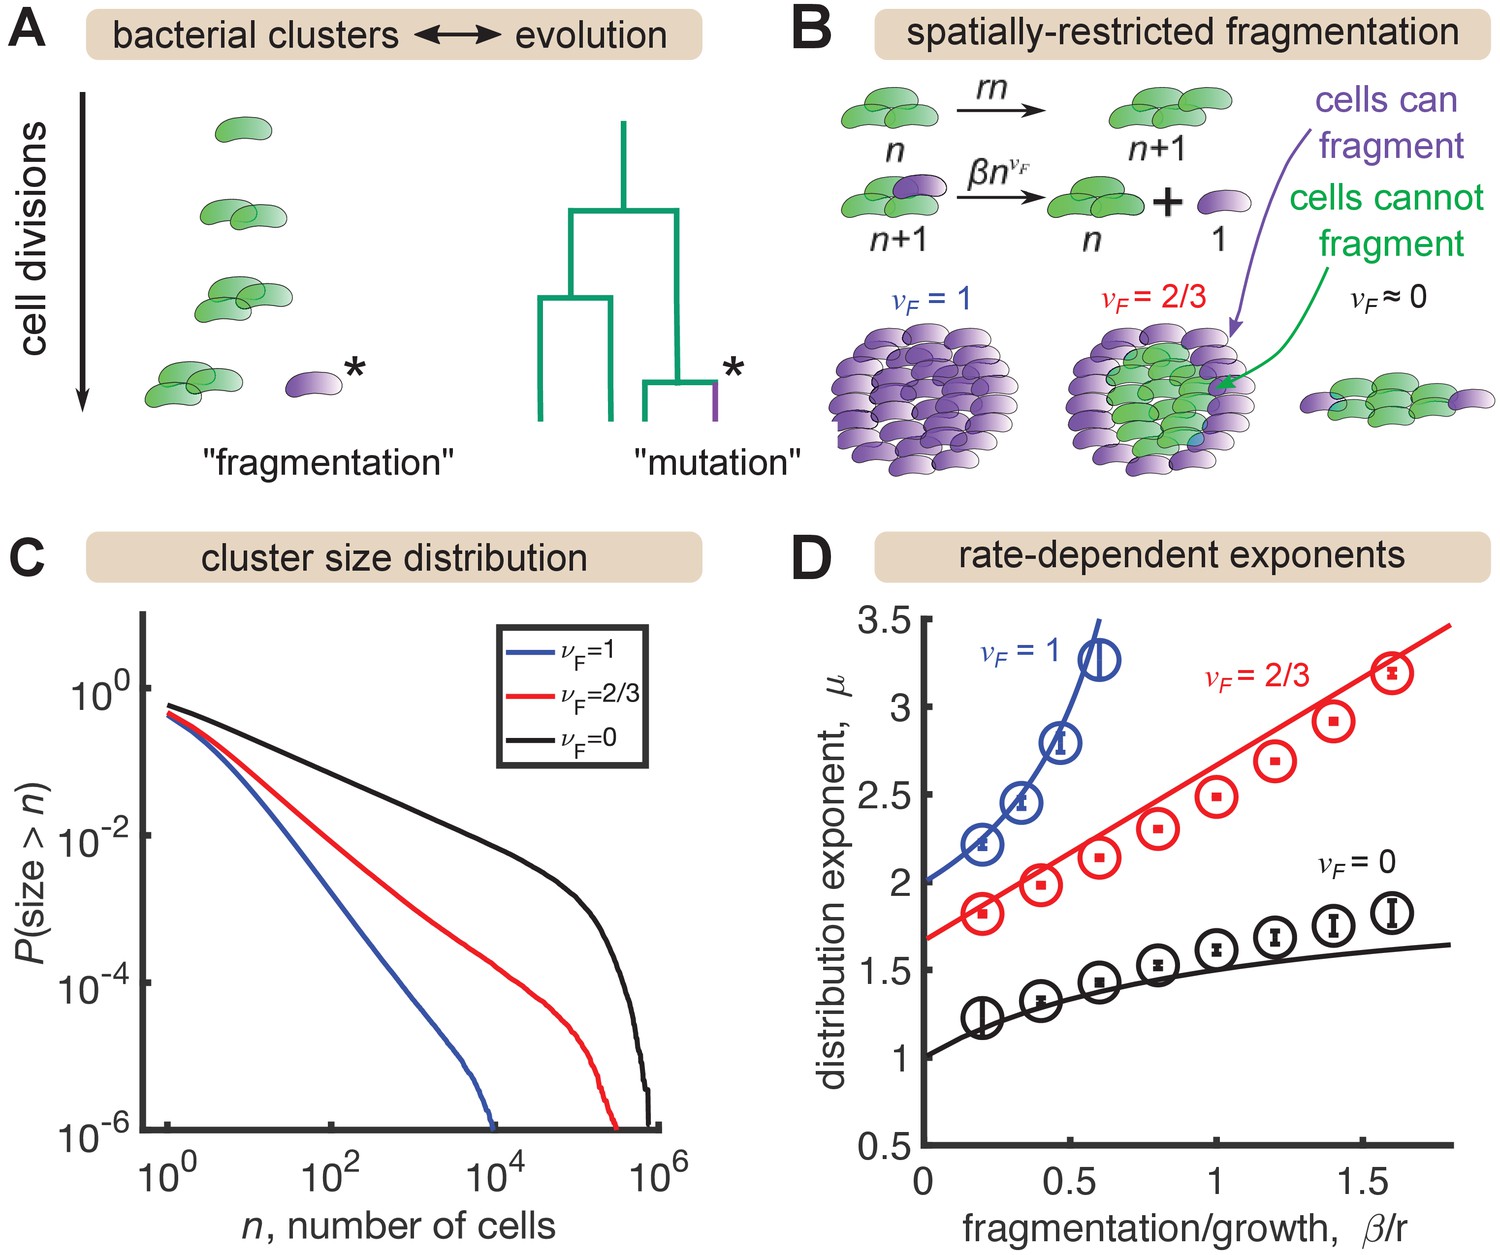
A minimal model inspired by evolutionary dynamics generates power law distributions.
(A) Fragmentation is analogous to mutation and we can construct a genealogy that mirrors the physical structure of the clusters. (B) Summary of a growth/fragmentation process that includes the effect of spatially confined clusters. (C) Examples of reverse cumulative size distributions obtained from stochastic simulations of the model for different values of the fragmentation exponent, . The tails of the distribution are approximately power laws, defined as . Parameters: = 0.5 hr-1, hr-1, for 0, 2/3, 1, respectively, time hr, and the system was initialized with 10 single cells. (D) Dependence of the resulting distribution exponent, μ, on ratio of fragmentation to aggregation rate () and fragmentation exponent (). Markers show mean and standard deviation across 100 simulations. Solid lines are approximate analytic results (Table 2). Parameters: same as (C) with β varying.
-
Figure 3—source data 1
Results of power-law fits to simulated distributions.
- https://cdn.elifesciences.org/articles/71105/elife-71105-fig3-data1-v2.xlsx
Figure 4 with 3 supplements
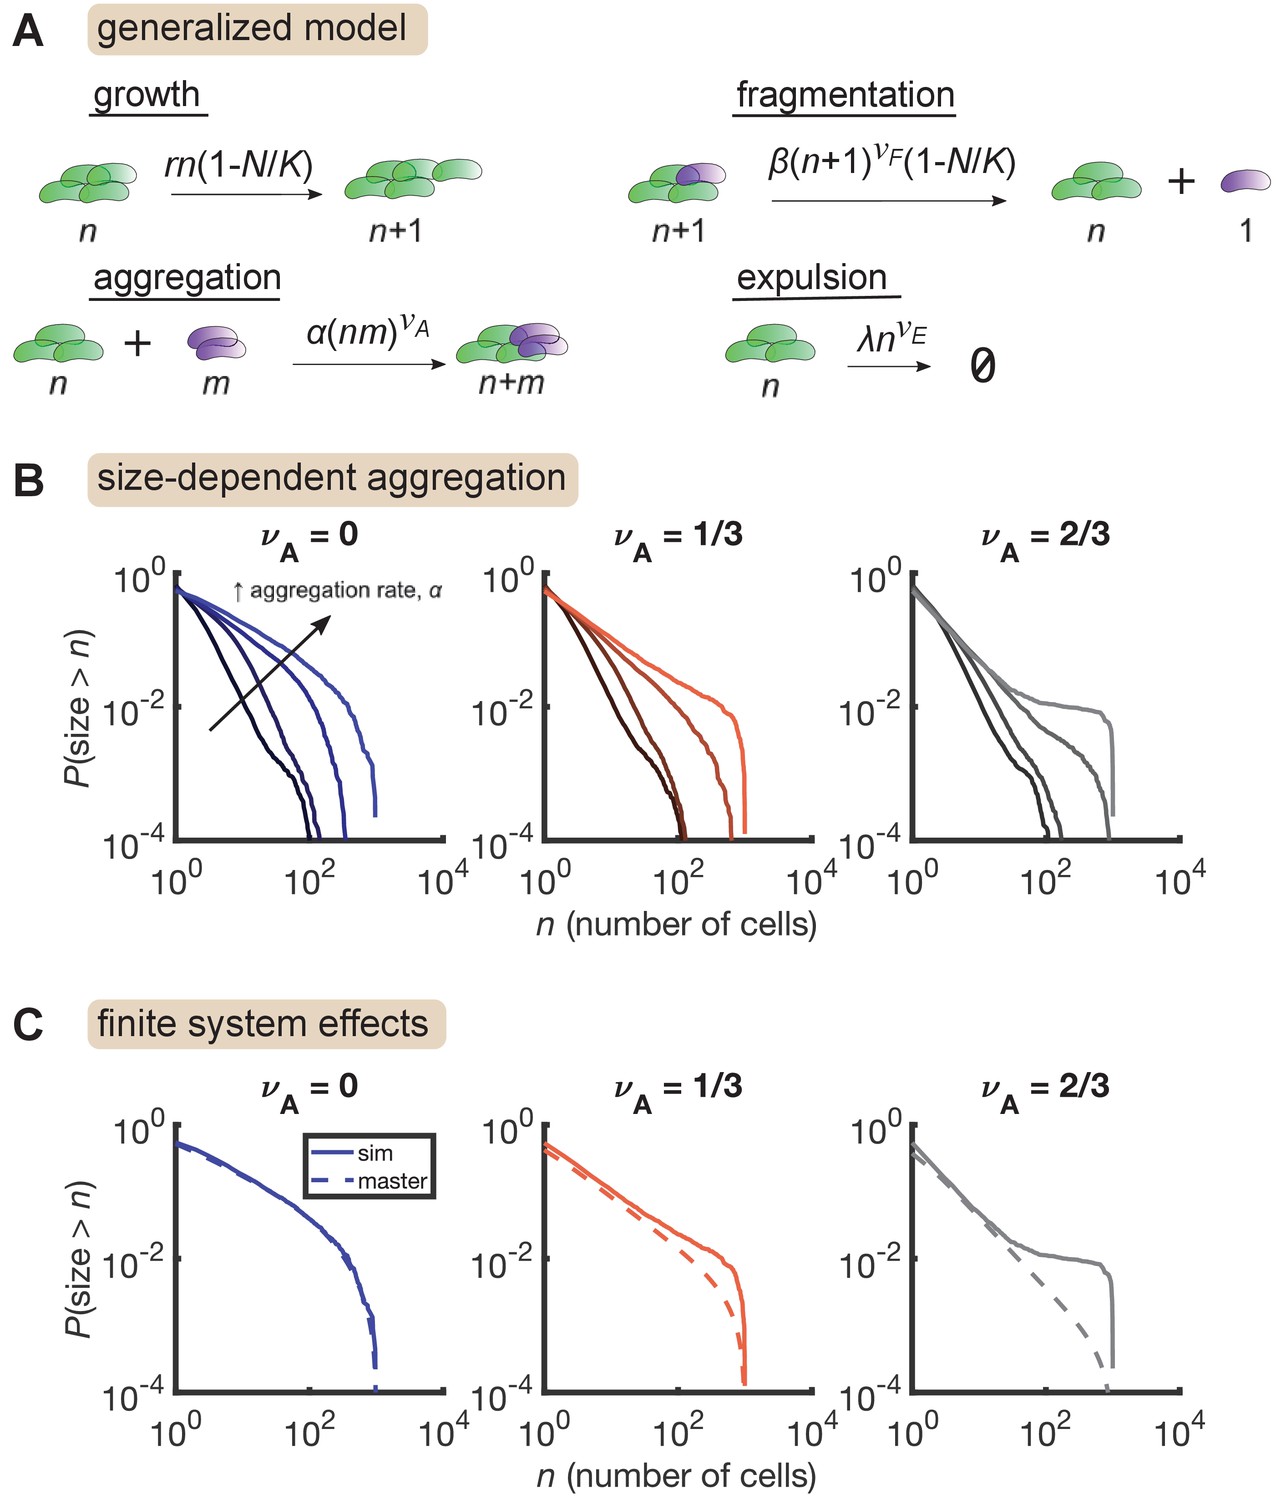
Size-dependent aggregation introduces a plateau in the size distribution.
(A) Schematic of the generalized model. Parameters summarized in Table 3. (B) Reverse cumulative distributions obtained from simulations for different values of (left, middle, right) and (different colored lines within each panel). Increasing aggregation produces a plateau if the aggregation depends strongly enough on cluster size. (C) The plateau arises only in stochastic simulation of finite systems with size-dependent aggregation. Solid lines are stochastic simulations, dashed lines are the result of numerically integrating the master equation. Parameters: = 0.5 hr-1, , hr-1, , hr-1, , and the number of simulation was replicates = 150 per parameter set. For each value of , we considered values of 0 (no aggregation) and then varied α logarithmically, with the following (min, max) values for : (−4,–2) for , (−4.5,–2.5) for , and (−5,–3) for .
Figure 4—figure supplement 1
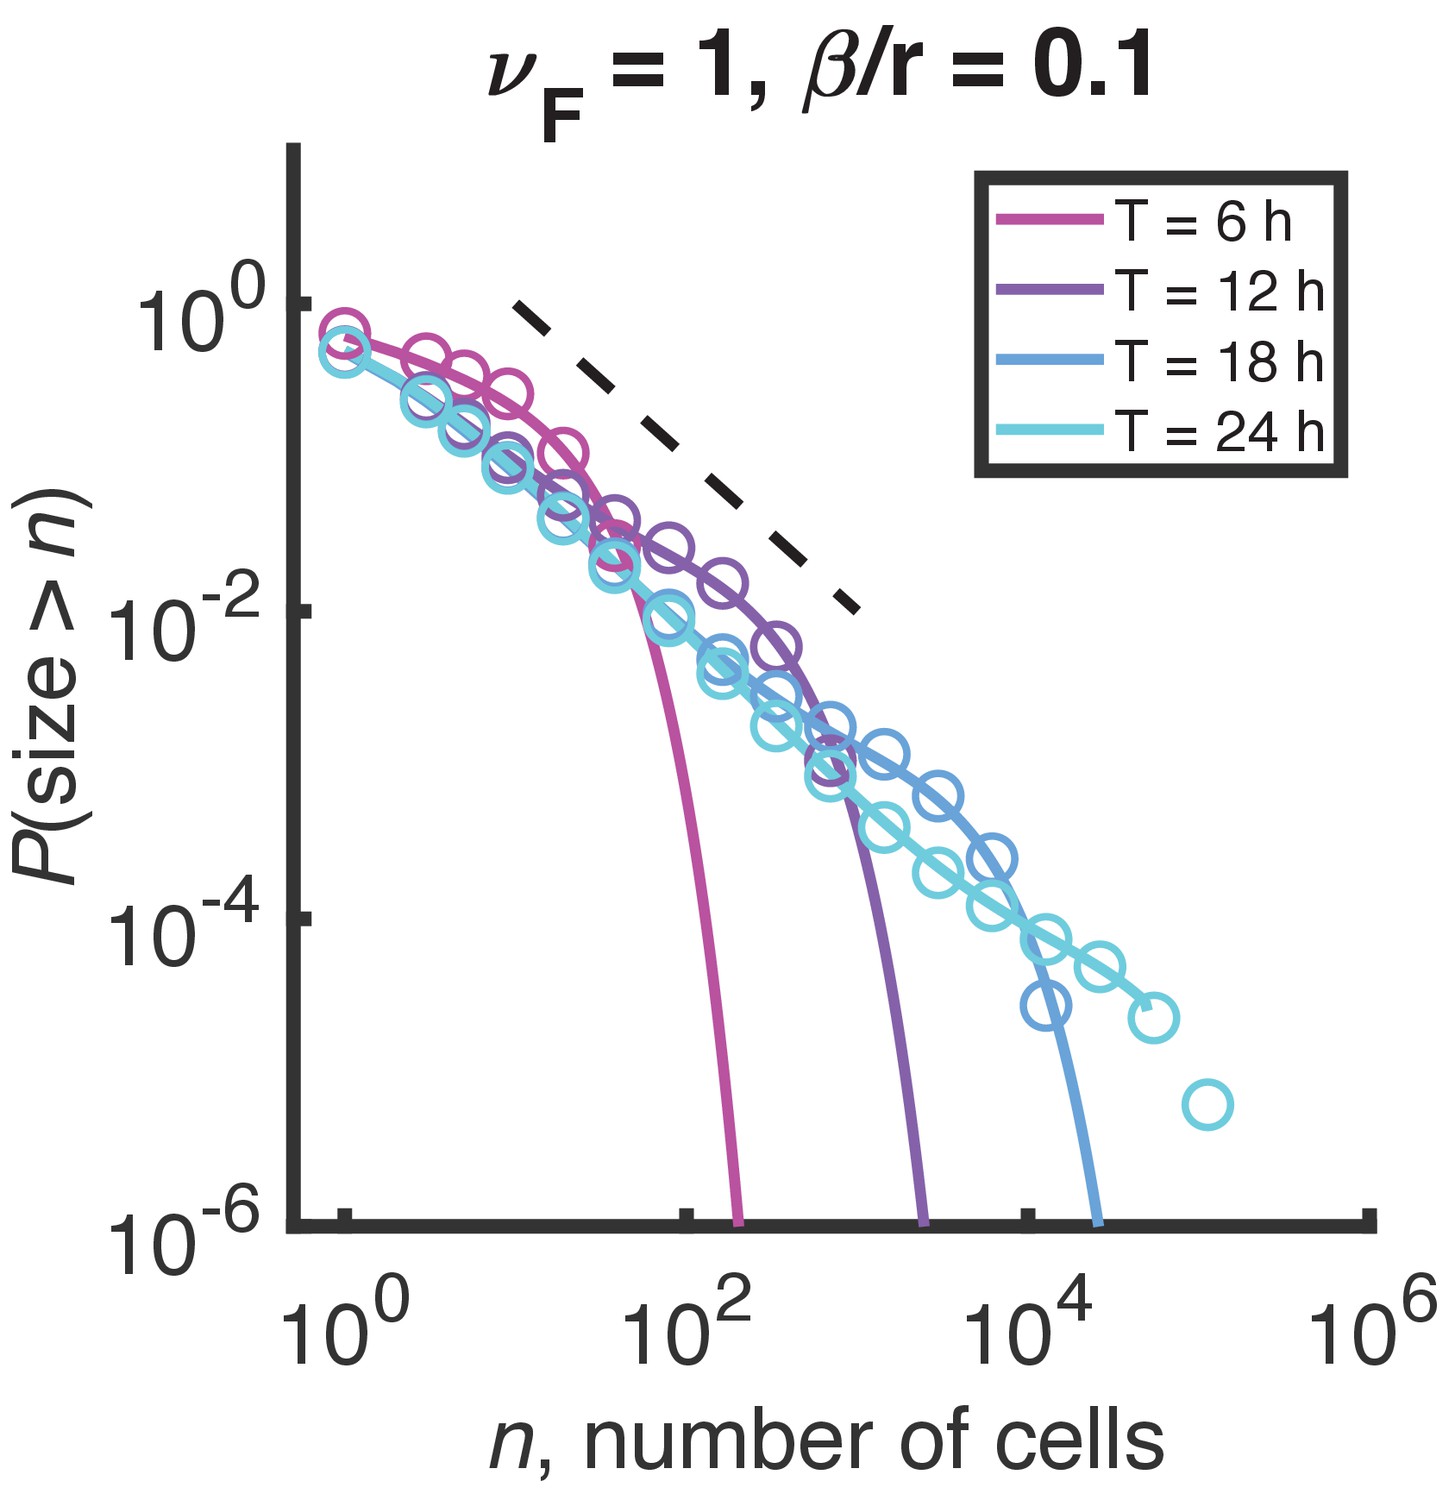
Distributions of growth/fragmentation process at short times.
Mild curvature appears in the minimal growth/fragmentation process distribution at finite time, but the result is inconsistent with experimental data. Circles are the result of stochastic simulation, solid lines are the result of numerical integration of the master equation. Color denotes simulation time. Dashed black line indicates and is a guide to the eye.
Figure 4—figure supplement 2
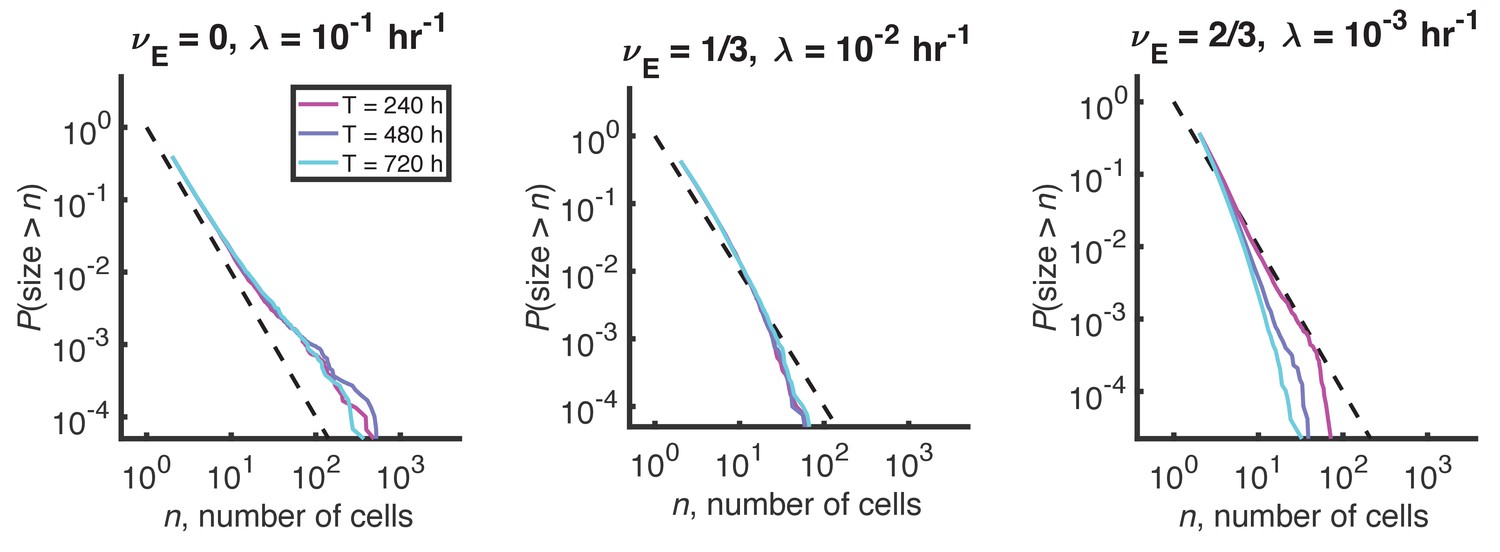
Distributions for a process with density-dependent growth, fragmentation, and expulsion.
A modified process with carrying capacity and expulsion does not produce a plateau in the stationary size distribution. Reverse cumulative distributions computed from stochastic simulations with different values of the expulsion exponent, . For each value of , the expulsion rate, , was chosen such that for clusters of size cells, hr-1, consistent with experimental data. Three different simulation times are shown in each panel in differently colored solid lines. Long simulation times are required to approach steady state when becomes small, and the steady state is not quite reached in the right panel even after 720 hr. Dashed line indicates and is a guide to the eye. Other parameters: hr-1, , hr-1, and the number of simulations = 100.
Figure 4—figure supplement 3
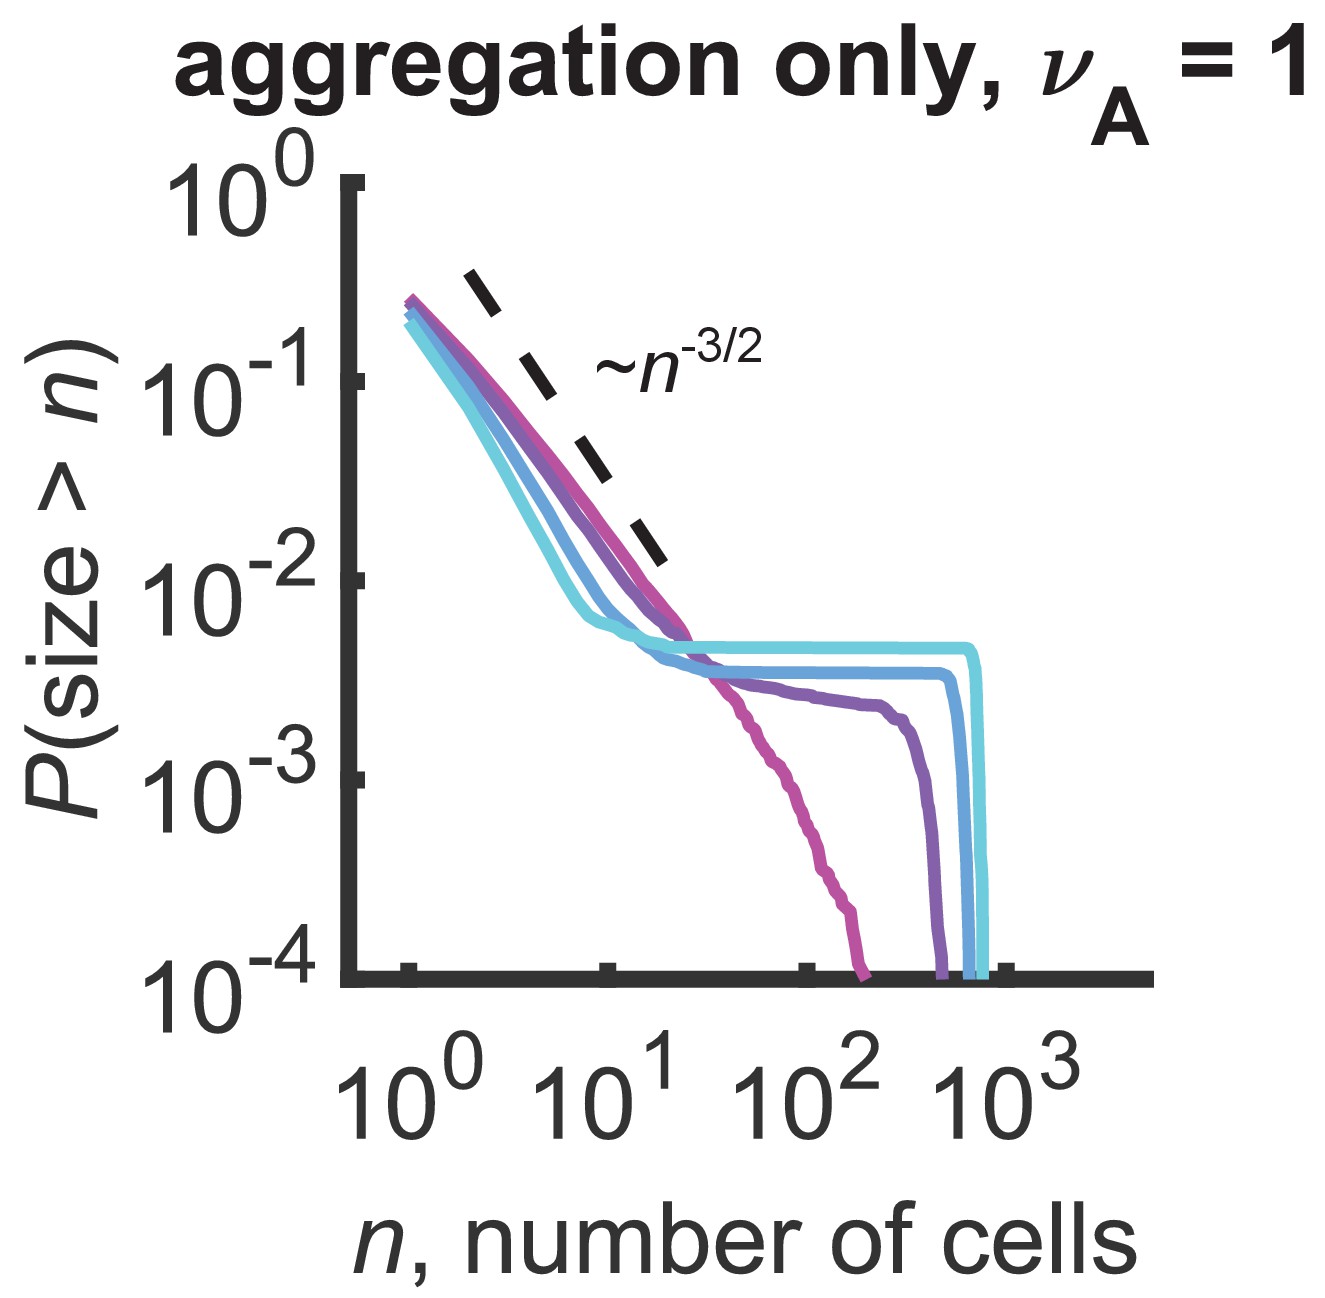
Distributions for a model with only aggregation and .
Plateaus arise at the gelation transition of purely aggregating systems. Reverse cumulative distributions computed from stochastic simulations are shown. Different curves represent different simulation times, ranging linearly from 0.1 to 0.175 hr (magenta to cyan). Dashed line represents an approximate analytic prediction of in the sol phase at the transition point and is a guide to the eye. Parameters: hr-1, number of cells = 103, number of simulations = 100.
Tables
Table 1
Summary of cluster data by bacterial strain.
Each row corresponds to one of the bacterial strains included in this study. Entries include strain name, total number of fish colonized with that strain, total number of clusters identified across all fish, and the original publication that the data was pulled from.
| Bacterial strain | Number of fish | Number of clusters | Source publication |
|---|---|---|---|
| Aeromonas ZOR0001 | 6 | 445 | Schlomann et al., 2018 |
| Aeromonas ZOR0002 | 6 | 1901 | Schlomann et al., 2018 |
| Enterobacter ZOR0014 | 18 | 3597 | Schlomann et al., 2018; Schlomann et al., 2019 |
| Plesiomonas ZOR0011 | 3 | 223 | Schlomann et al., 2018 |
| Pseudomonas ZWU0006 | 6 | 133 | Schlomann et al., 2018 |
| Vibrio ZOR0036 | 6 | 2430 | Schlomann et al., 2018 |
| Vibrio ZWU0020 Δmot | 11 | 5888 | Wiles et al., 2020 |
| Vibrio ZWU0020 Δche | 11 | 3551 | Wiles et al., 2020 |
Table 2
Analytic results for the minimal growth-fragmentation process.
Distribution exponent, μ, as a function of fragmentation exponent, , fragmentation rate, β, and growth rate, r, as plotted in Figure 3D. Results are expected to be valid for long times (), large sizes (), and slow fragmentation (). See Appendix for details.
| distribution exponent, μ |
Table 3
Summary of model variables and parameters.
| Variable/parameter | Description |
|---|---|
| Cluster size (number of cells) | |
| Probability of cluster size, | |
| Cumulative probability; probability of size being larger than | |
| μ | Exponent of power law; , |
| Cell division rate | |
| Carrying capacity; maximum number of cells | |
| Fragmentation rate | |
| Fragmentation exponent; clusters of size fragment with rate | |
| Aggregation rate | |
| Aggregation exponent; clusters of sizes and aggregate with rate | |
| Expulsion rate | |
| Expulsion exponent; clusters of size are expelled with rate |
Key resources table
| Reagent type (species) or resource | Designation | Source or reference | Identifiers | Additional information |
|---|---|---|---|---|
| Software, algorithm | Analysis code | This study | see Materials and methods, Simulations | |
| Other | Cluster size data | Schlomann and moments, 2018 | ||
| Other | Cluster size data | Schlomann et al., 2019 | ||
| Other | Cluster size data | Wiles et al., 2020 |
Additional files
-
Supplementary file 1
Cumulative distribution exponents of cluster size distributions by strain, with analysis of sensitivity to single-cell detection.
The small size regime of the cluster size distributions were fit to a power-law model for sizes up to 100 cells using two methods: a linear fit to and maximum likelihood estimation (Materials and methods). The fits were done for each animal and the resulting mean ± std. dev of the exponents (corresponding to , as defined in the text) are given for each strain. For each method, the fits were done twice, once including single cells, and once considering only cells of size two or greater. As discussed in the main text, the largest uncertainty in cluster size enumeration from the images occurs at small sizes. Ignoring single cells in the fit only mildly changes the average exponent, and all changes are within uncertainties. Most exponents are consistent with .
- https://cdn.elifesciences.org/articles/71105/elife-71105-supp1-v2.xlsx
-
Transparent reporting form
- https://cdn.elifesciences.org/articles/71105/elife-71105-transrepform-v2.docx
Download links
A two-part list of links to download the article, or parts of the article, in various formats.
Downloads (link to download the article as PDF)
Open citations (links to open the citations from this article in various online reference manager services)
Cite this article (links to download the citations from this article in formats compatible with various reference manager tools)
Gut bacterial aggregates as living gels
eLife 10:e71105.
https://doi.org/10.7554/eLife.71105


