Structural basis for cytoplasmic dynein-1 regulation by Lis1
- Department of Cellular and Molecular Medicine, University of California, San Diego, United States
- Department of Biological Sciences, Indian Institute of Science Education and Research Mohali, India
- Division of Biological Sciences, Molecular Biology Section, University of California, San Diego, United States
- Division of Biological Sciences, Cell and Developmental Biology Section, University of California, San Diego, United States
- Howard Hughes Medical Institute, United States
Figures
Figure 1 with 3 supplements
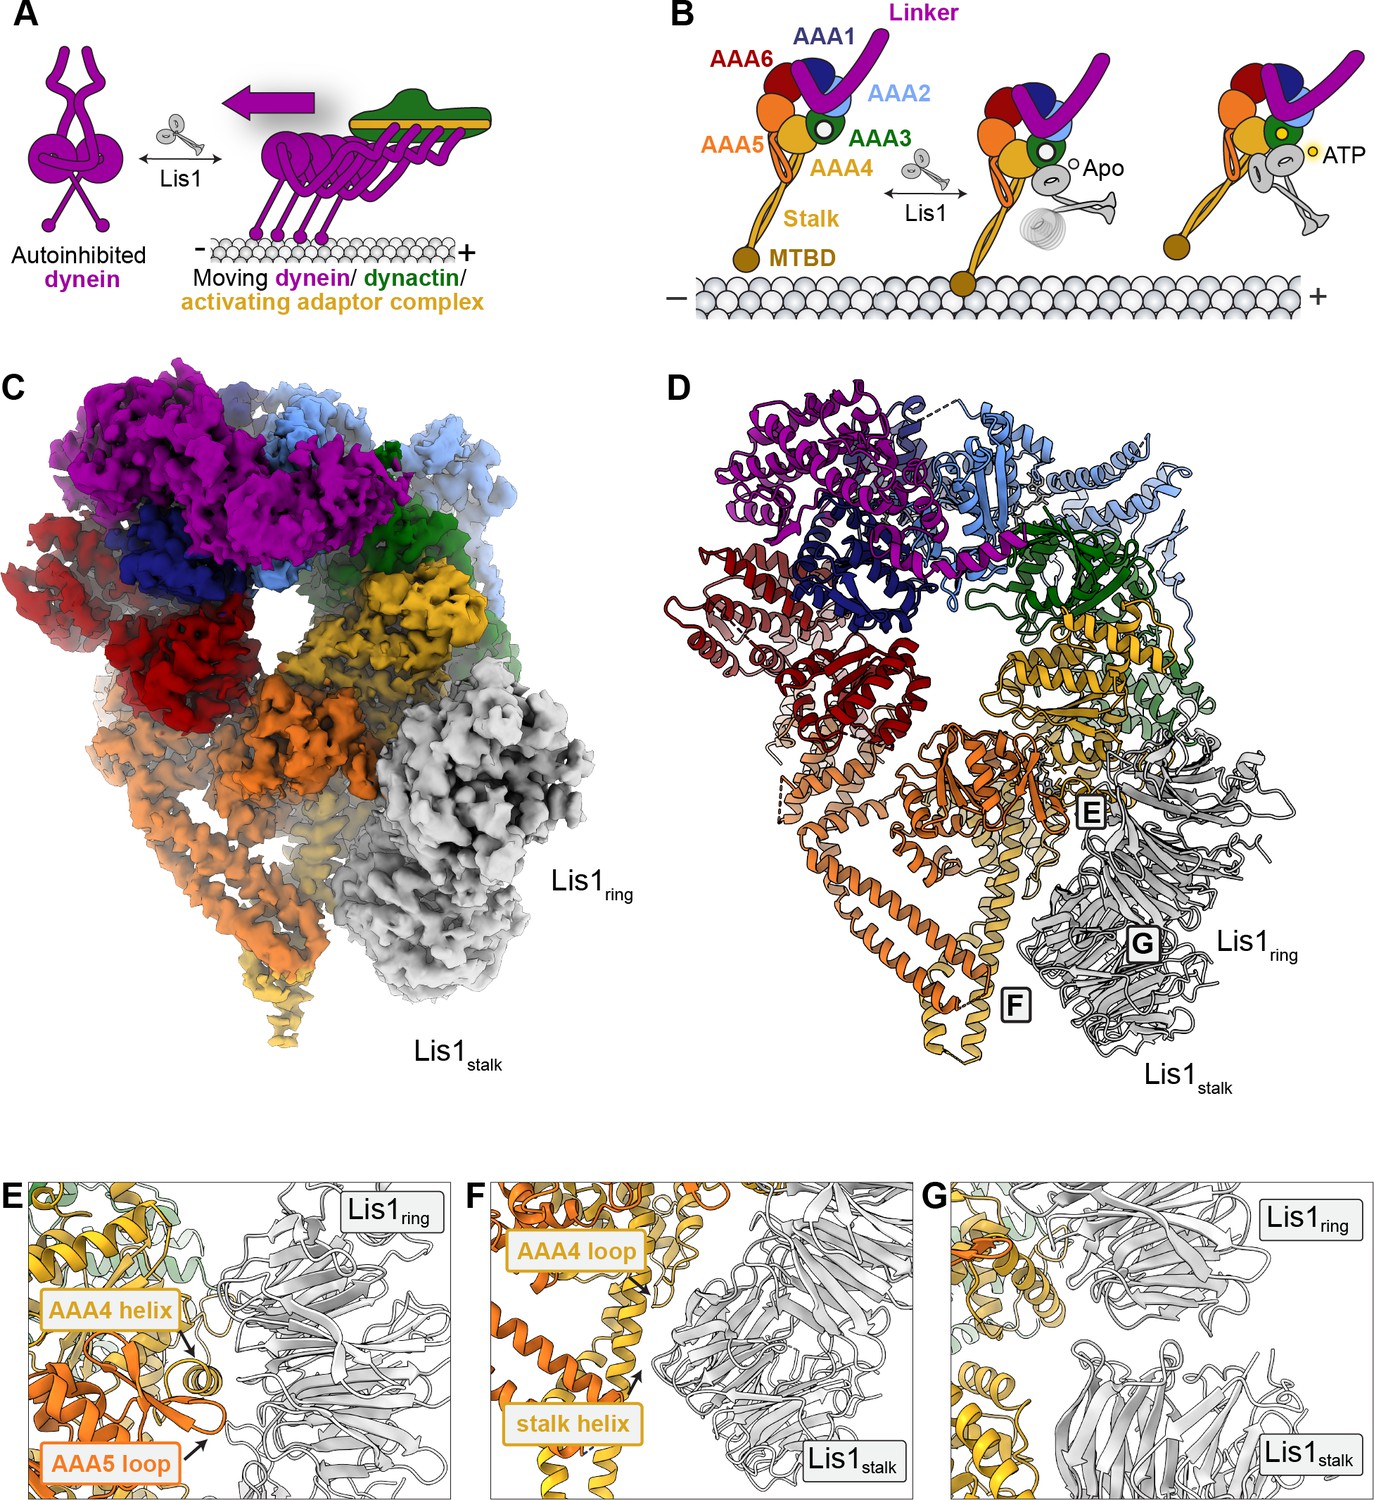
A 3.1 Å structure of the yeast dyneinE2488Q–(Lis1)2 complex.
(A) Lis1 assists in the transition from autoinhibited dynein to activated dynein complexed with dynactin and an activating adaptor protein. (B) Schematic representation of the different modes of binding of Lis1 to dynein as a function of nucleotide state at AAA3. (C, D) Cryo-EM map (C) and model (D) of the AAA3-WalkerB mutant, dyneinE2488Q, with Lis1 bound at sitering and sitestalk. (E–G) Close-up views of the interfaces between (E) dyneinE2488Q and Lis1 at sitering, (F) dyneinE2488Q and Lis1 at sitestalk, and (G) of the Lis1ring-Lis1stalk interface.
Figure 1—figure supplement 1
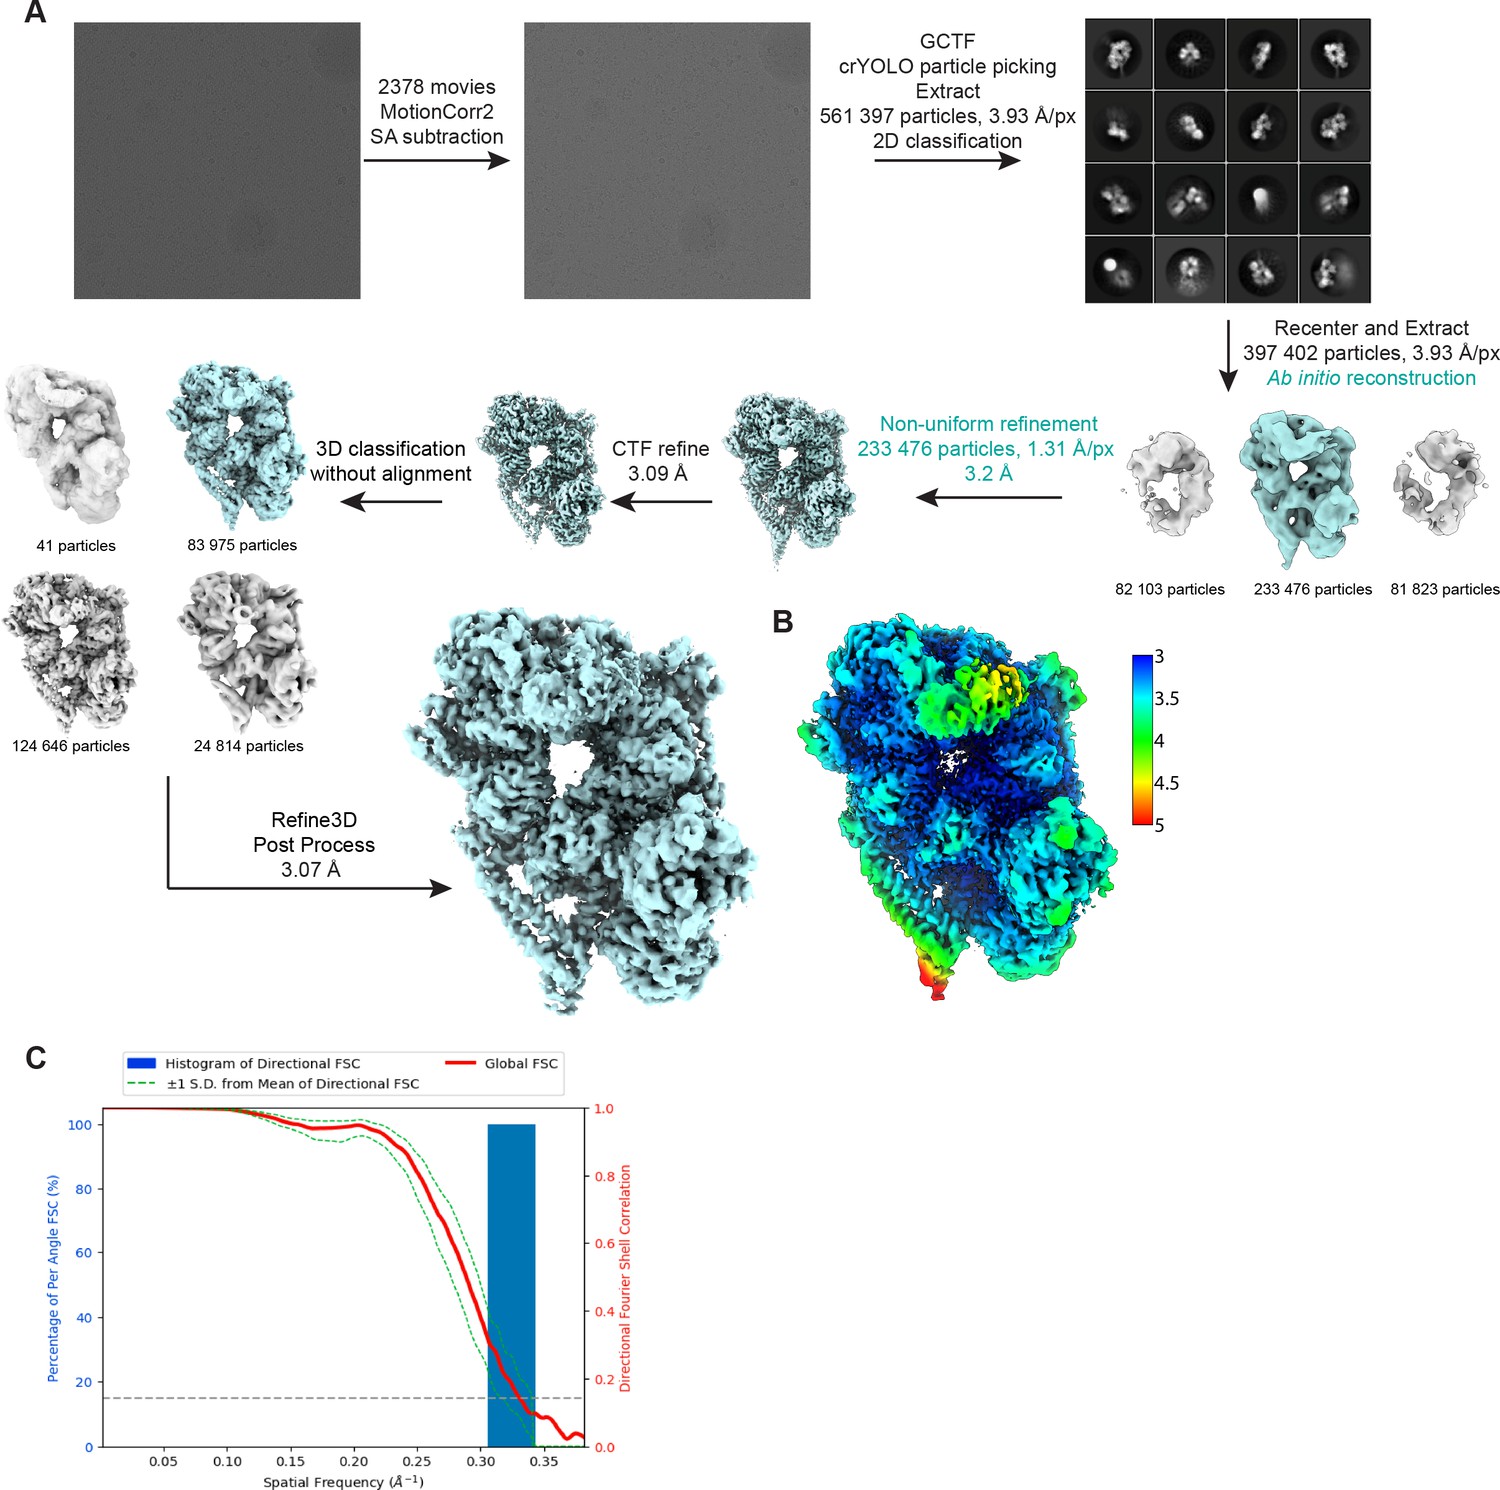
Details of cryo-EM data processing.
(A) Workflow for cryo-EM data processing. Steps highlighted in teal were implemented in cryoSPARC while all others were carried out in Relion 3.0. (B) Cryo-EM map of the dyneinE2448Q-(Lis1)2 complex colored by local resolution. (C) Fourier shell correlation (FSC) plot.
Figure 1—figure supplement 2
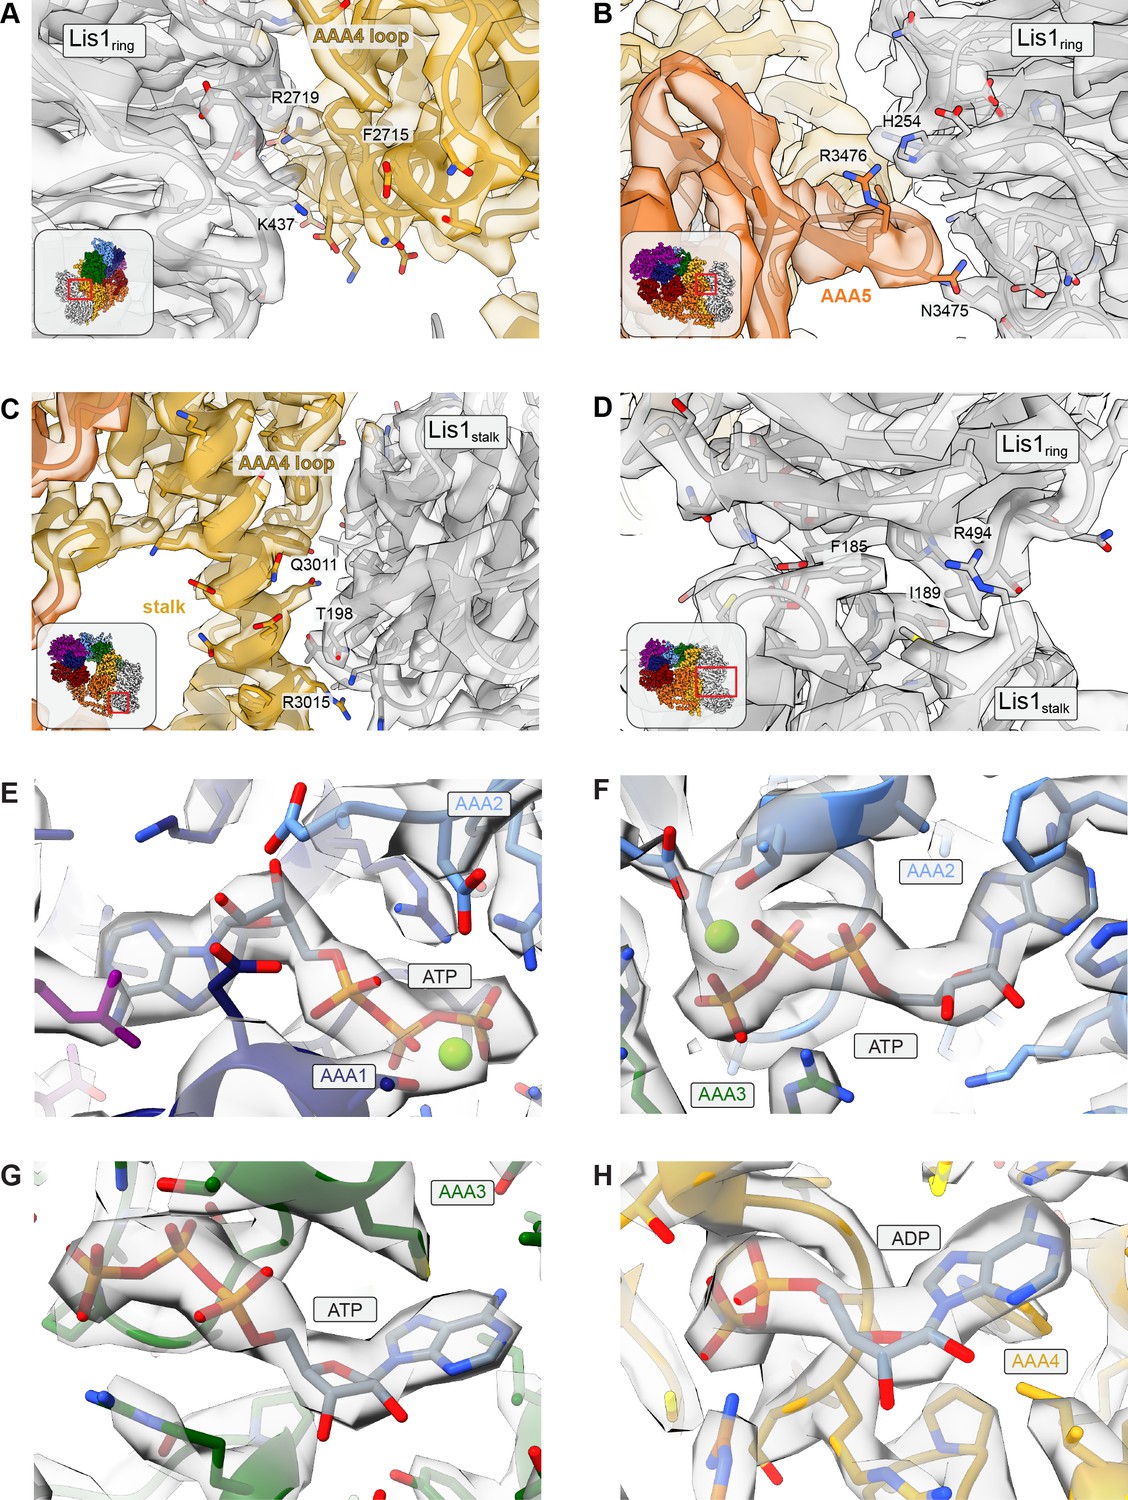
Examples of cryo-EM map quality for binding sites.
(A–D) Regions of the cryo-EM map corresponding to key residues for (A) the sitering interaction at AAA4, (B) the sitering interaction at AAA5, (C) the sitestalk interaction, and (D) the Lis1ring-Lis1stalk interface, with insets showing the location of the close-up in the full structure. (E–H) Regions of the cryo-EM map corresponding to (E) ATP in AAA1, (F) ATP in AAA2, (G) ATP in AAA3, and (H) ADP in AAA4.
Figure 1—figure supplement 3
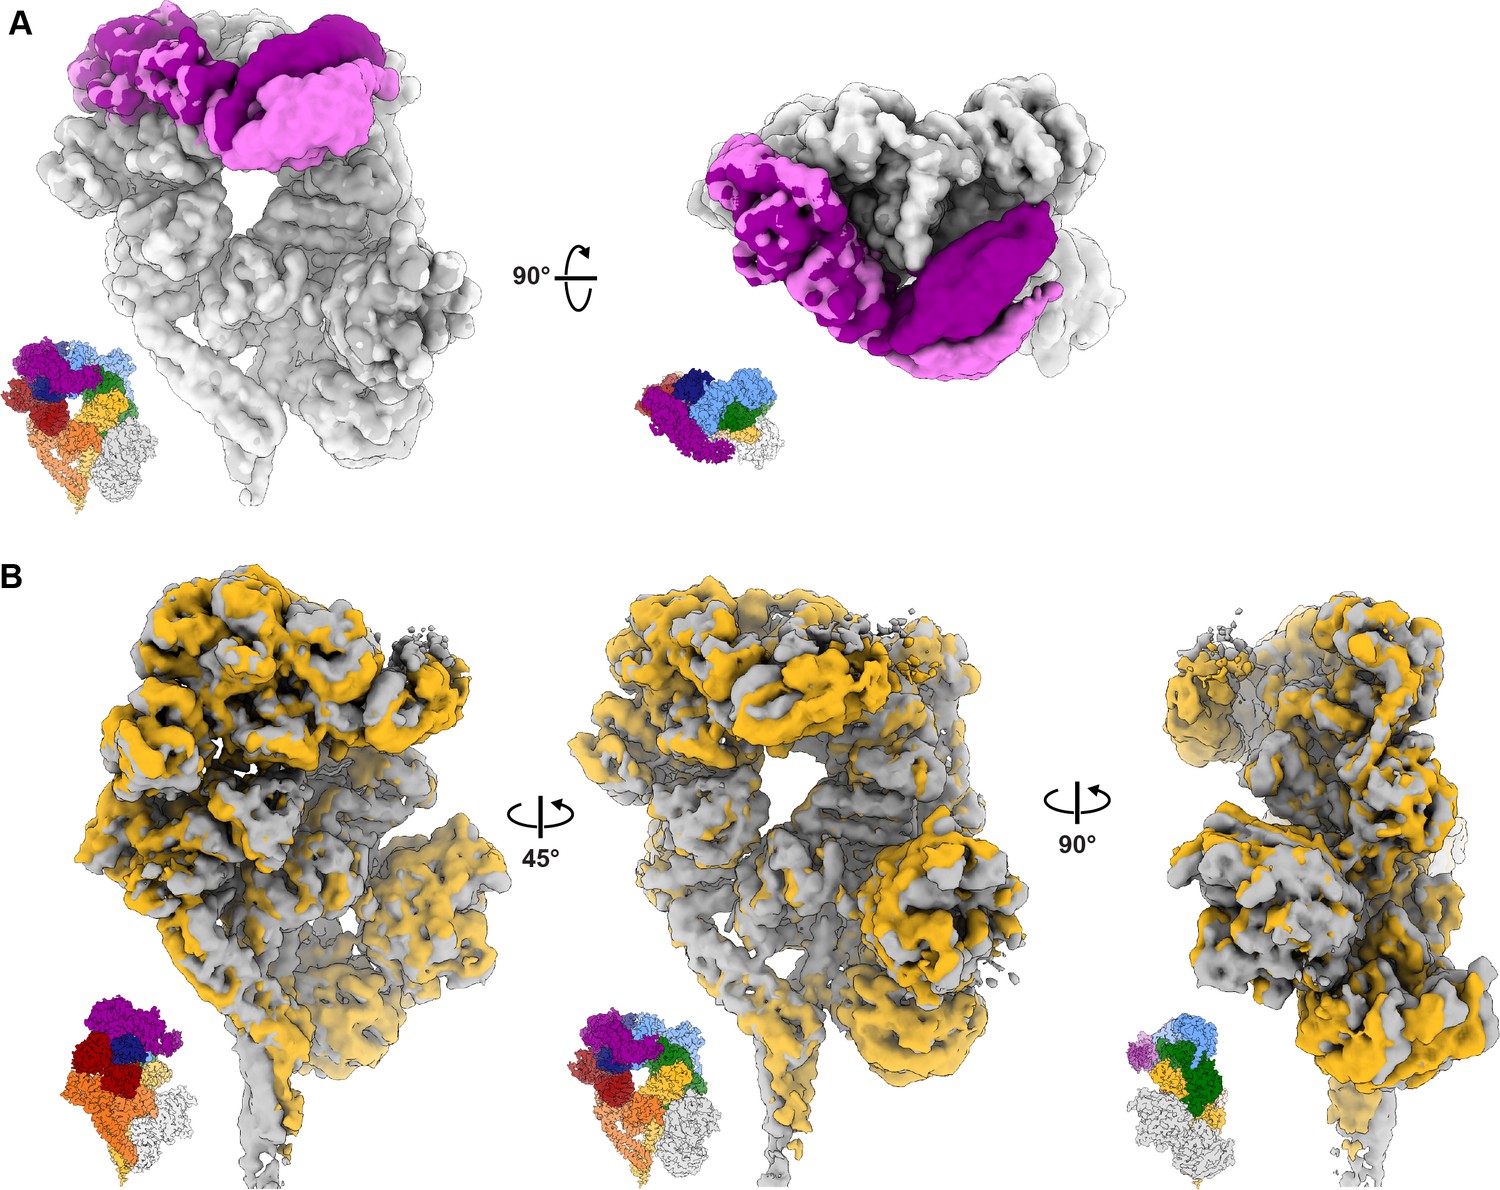
3D variability analysis of dynein–(Lis1)2.
Volumes at the start and end of variability components 1 and 2 were calculated using the 3DVA display job in cryoSPARC. (A) The first variability component describes motion observed in the linker domain. The first and last volumes were colored light gray/light purple and dark gray/dark purple, respectively. (B) The second variability component reveals a subtle opening and closing motion in the AAA ring with associated movements in the buttress and stalk helices. See Video 2 as well.
Figure 2
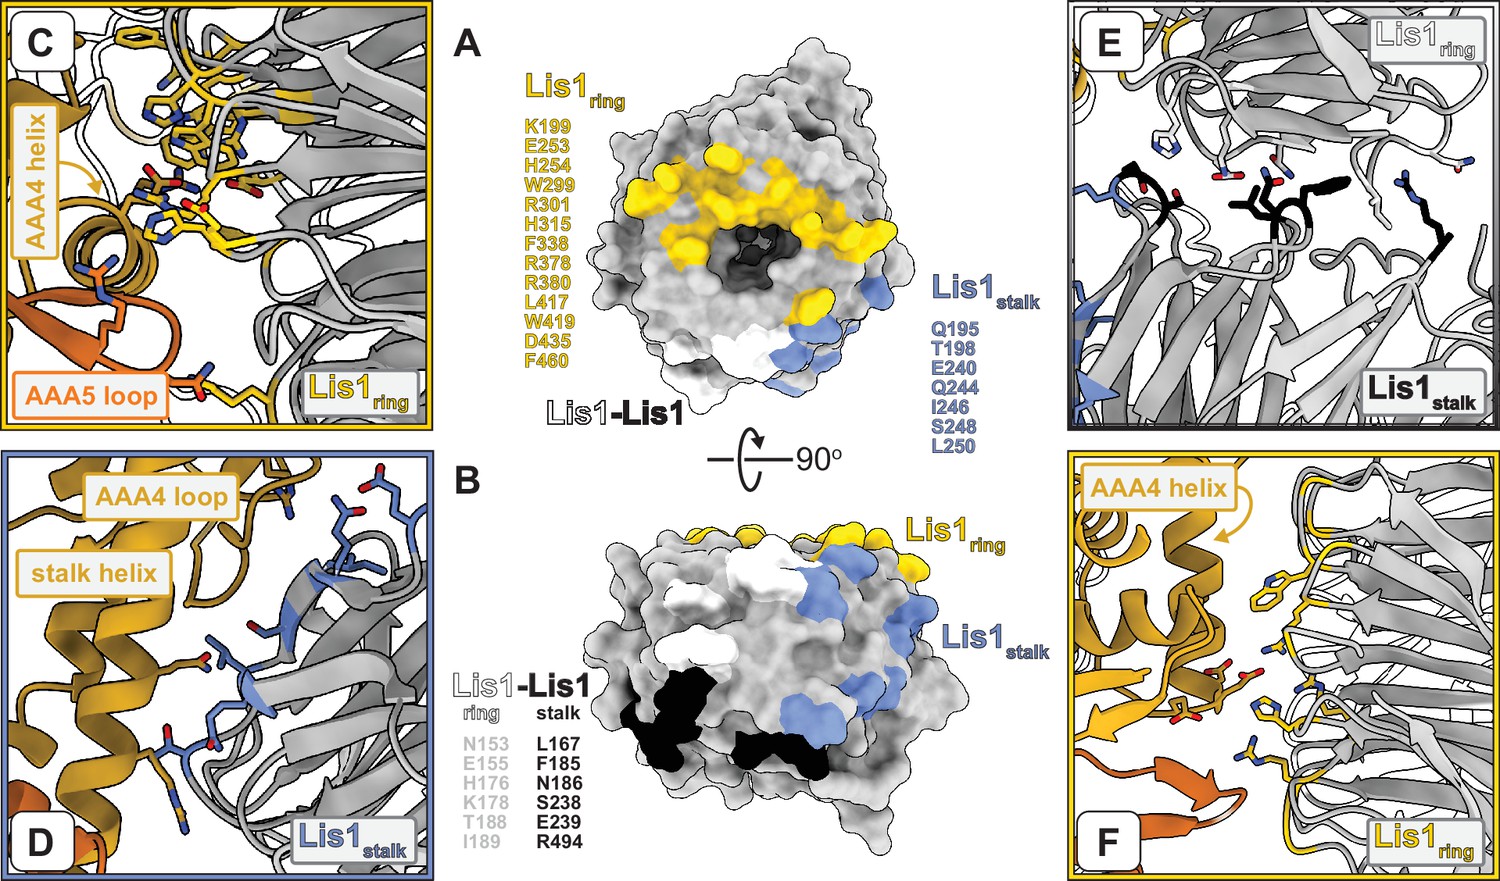
Interfaces involved in Lis1–dynein and Lis1–Lis1 interactions.
(A, B) Two views of the Lis1 structure, represented as a molecular surface. The β-propeller is viewed either from its narrow face (A) or the side (B). Residues located at the different interfaces formed by Lis1 in the dyneinE2488Q–(Lis1)2 complex are listed next to and color-coded on the molecular surfaces. We have included all residues within 4 Å of residues in the interacting partner. (C–F) Close-ups of the different interfaces highlighted in (A, B). Panels (C), (D), and (E) are closer views of panels (E), (F), and (G) in Figure 1, in that order. The Lis1 residues listed in (A, B) are shown in the panels, along with dynein residues discussed in the text (and shown again in later figures). (F) This panel shows the same dynein–Lis1ring interface shown in (C) but viewed from ‘above’ (relative to C). In this panel, we show residues we had previously mutated in dynein (Huang et al., 2012) and Lis1 (Toropova et al., 2014) to disrupt this interaction.
Figure 3 with 1 supplement
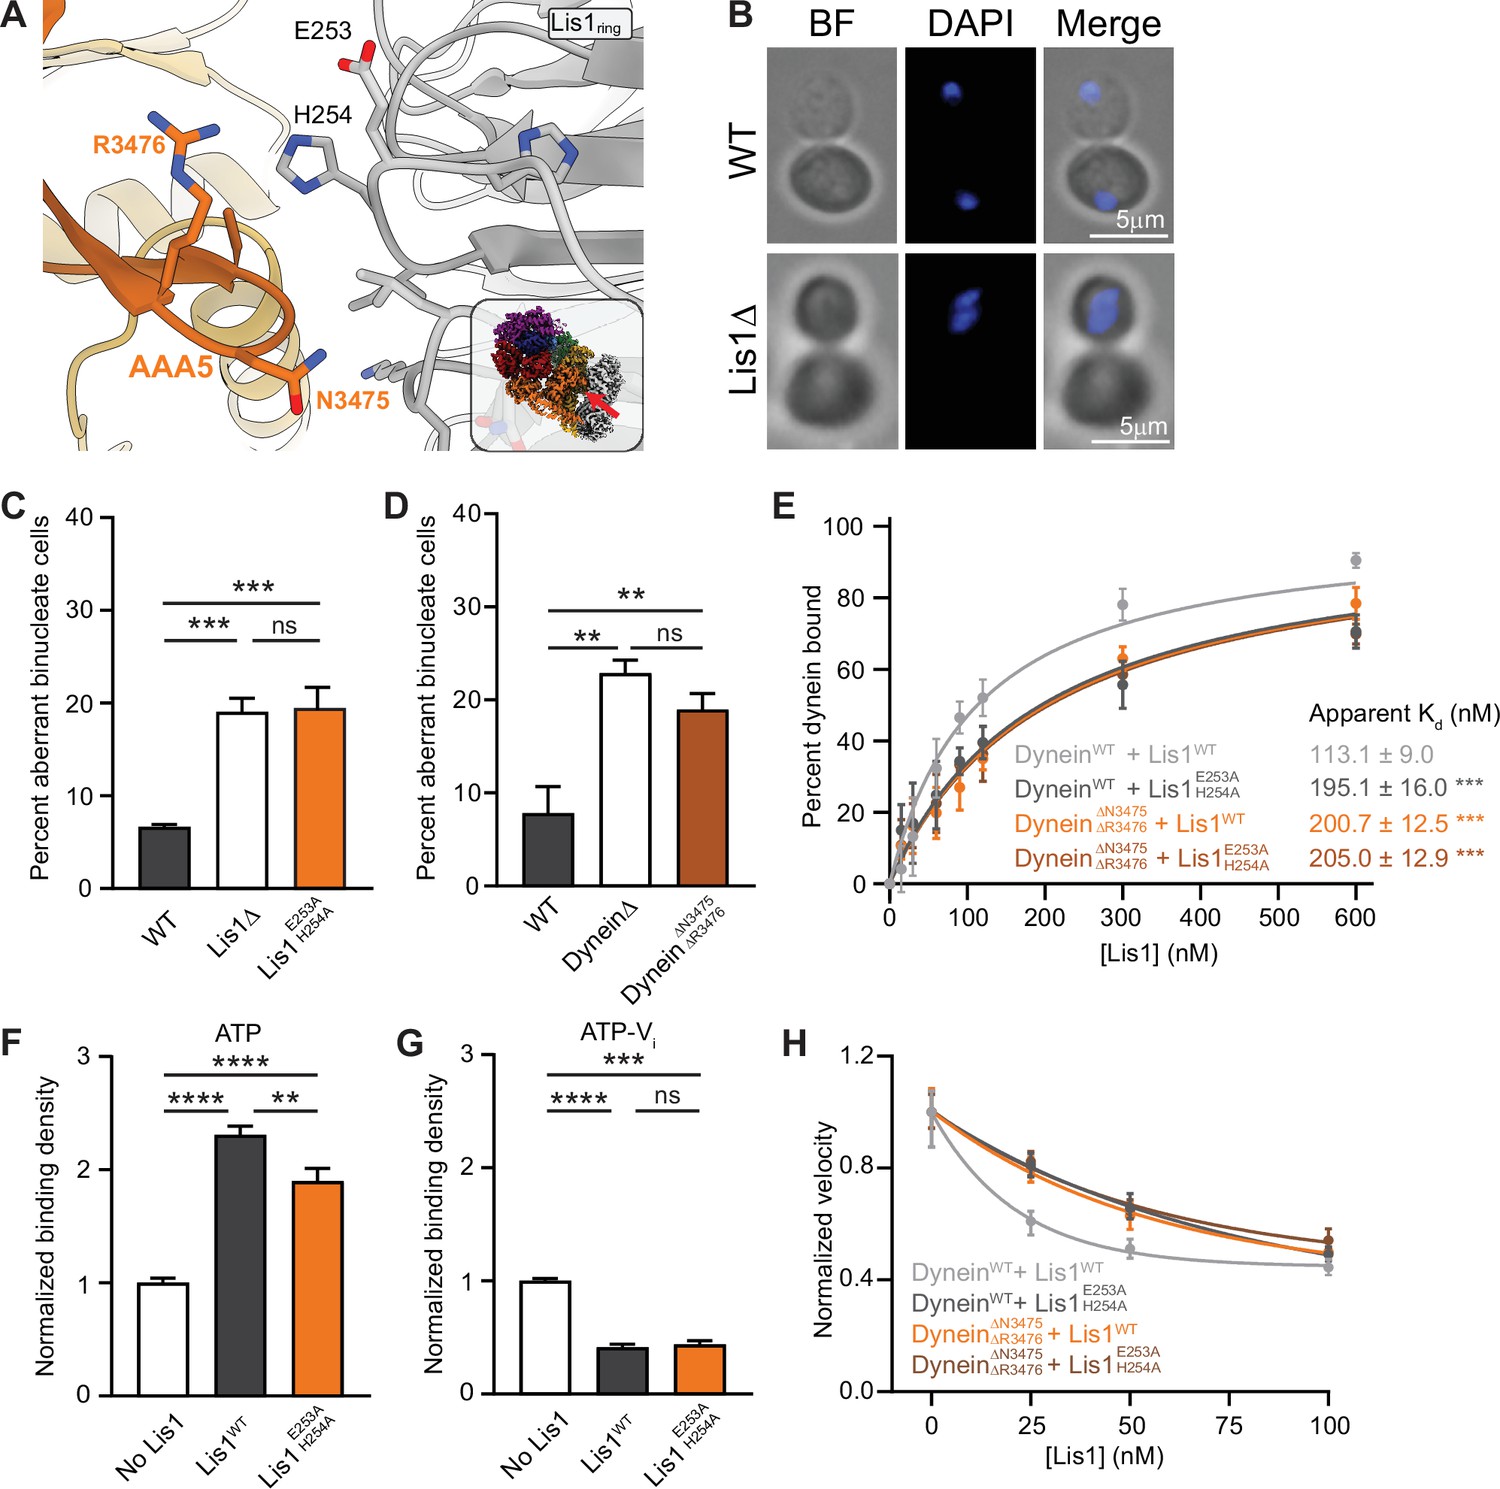
Lis1 regulation of dynein at sitering.
(A) Close-up of the interface between Lis1 and dynein AAA5 at sitering. The residues mutated in this study on Lis1 (gray type) and dynein (orange type) are indicated. The inset shows the location of the close-up in the full structure. (B) Example images of normal and binucleate cells. Scale bar, 3 μm. (C) Quantitation (mean ± s.e.m.) of the percentage of cells displaying an aberrant binucleate phenotype for WT (dark gray), Lis1 deletion (white), and Lis1 E253A, H254A (orange). n = 6 replicates with at least 200 cells per condition. Statistical analysis was performed with a one-way ANOVA with Tukey’s multiple comparison test; ***WT and ΔLis1, p=0.0009; ***WT and Lis1 E253A, H254A, p=0.0007; ns, p>0.9999. (D) Quantitation (mean ± s.e.m.) of the percentage of cells displaying an aberrant binucleate phenotype for WT (dark gray), Lis1 deletion (white), and dyneinΔN3475, R3476 (dark orange). n = 3 replicates with at least 200 cells per condition. Statistical analysis was performed with a one-way ANOVA with Tukey’s multiple comparison test; **p=0.0053; *p=0.0215; ns, p=0.4343. (E) Quantitation of the apparent binding affinity of dyneinWT for Lis1WT (dark gray; Kd = 113.1 ± 9.0) and Lis1 E253A, H254A (light gray; Kd = 195.1 ± 16.0) and dyneinΔN3475, R3476 for Lis1WT (orange; Kd = 200.7 ± 12.5) and Lis1E253A, H254A (brown; Kd = 205.0 ± 12.9). n = 3 replicates per condition. Statistical analysis was performed using an extra sum-of-squares F-test; ***p<0.0001. (F) Binding density (mean ± s.e.m.) of dynein on microtubules with ATP in the absence (dark gray) or presence of Lis1WT (white) or Lis1E253A, H254A (orange). Data was normalized to a density of 1.0 in the absence of Lis1. Statistical analysis was performed using an ANOVA; ****p<0.0001; **p=0.0029. n = 12 replicates per condition. (G) Binding density (mean ± s.e.m.) of wild-type dynein on microtubules with ATP-Vi in the absence (dark gray) or presence of Lis1WT (white) or Lis1E253A, H254A (orange). Data was normalized to a density of 1.0 in the absence of Lis1. Statistical analysis was performed using an ANOVA; ****p<0.0001; ***p=0.0001; ns = 0.9997. n = 12 replicates per condition. (H) Single-molecule velocity of dynein with increasing concentrations of Lis1. DyneinWT with Lis1WT (dark gray); dyneinWT with Lis1E253A, H254A (light gray); dyneinΔN3475, R3476 with Lis1WT (orange); dyneinΔN3475, R3476 and Lis1E253A, H254A (brown). The median and interquartile range are shown. Data was normalized to a velocity of 1.0 in the absence of Lis1. At least 400 single-molecule events were measured per condition.
Figure 3—figure supplement 1
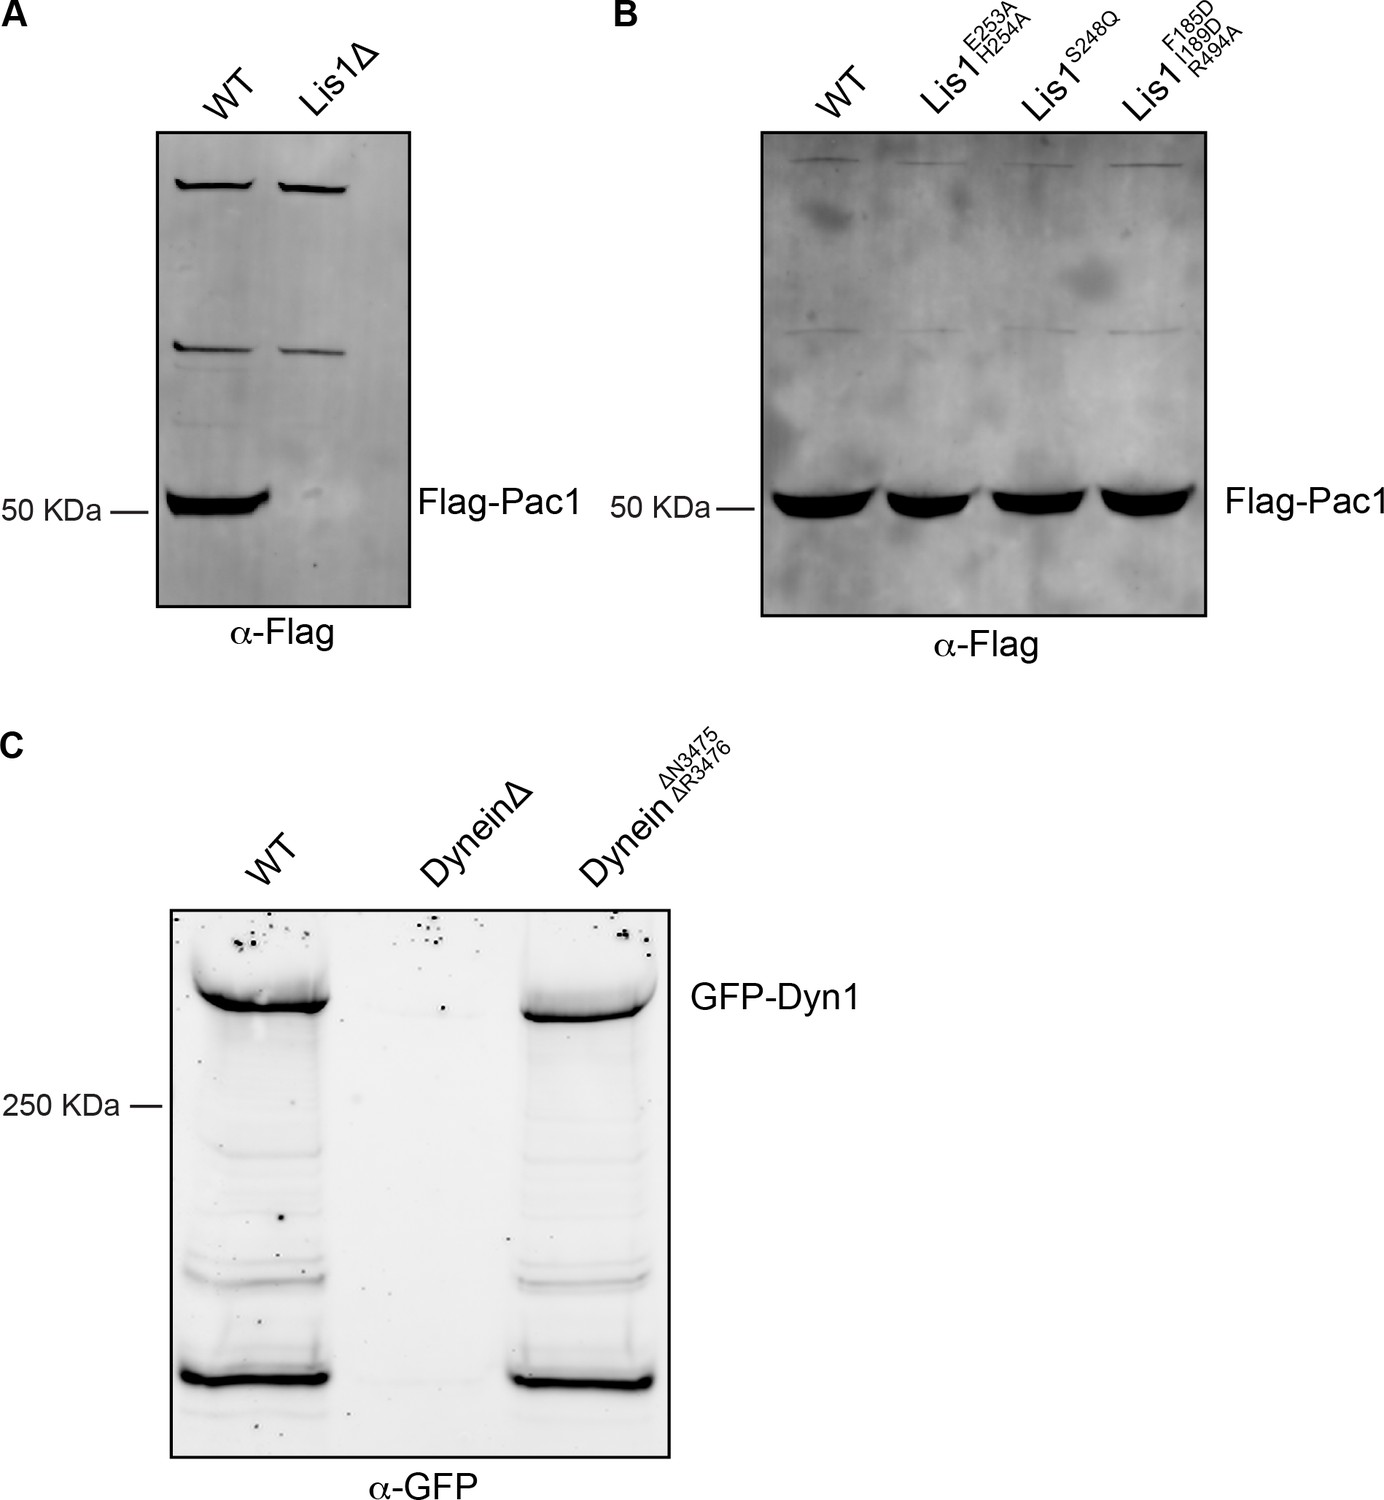
Western blot analysis of Lis1 and dynein mutant expression.
-
Figure 3—figure supplement 1—source data 1
Western blot analysis of Lis1 and dynein mutant expression.
(A) Cell lysates from wild type (WT) or Lis1Δ S. cerevisiae strains containing Flag-tagged Lis1 (Pac1) were immunoprecipitated using anti-Flag agarose beads and immunoblotted for the FLAG peptide. (B) Cell lysates from wild type (WT)WT or mutant Lis1 S. cerevisiae containing Flag-tagged Lis1 (Pac1) were immunoprecipitated using anti-FLAG agarose beads and immunoblotted for the FLAG peptide. (C) Cell lysates from wild type (WT)WT, DyneinΔ, and dyneinΔN3475, ΔR3476 S. cerevisiae strains containing GFP-dynein (Dyn1) were immunoprecipitated using anti-GFP nanobody beads and immunoblotted with an anti-GFP antibody.
- https://cdn.elifesciences.org/articles/71229/elife-71229-fig3-figsupp1-data1-v2.zip
Figure 4

Lis1 regulation of dynein at sitestalk.
(A) Close-up view of the Lis1–dynein interface at sitestalk. The residues at the interface are shown, and the S248 mutated in this study is labeled. The inset shows the location of the close-up in the full structure. (B) Quantitation of the percentage of cells (mean ± s.e.m.) displaying an aberrant binucleate phenotype for WT (dark gray), Lis1 deletion (white), and Lis1S248Q (yellow). n = 6 replicates of at least 200 cells each per condition. Statistical analysis was performed with a one-way ANOVA with Tukey’s multiple comparison test; ***p=0.0009; **p=0.0028; ns, p=0.9908. WT and ΔLis1 data repeated from Figure 2. (C) Quantitation of the apparent binding affinity of dynein for Lis1WT (dark gray; Kd = 113.1 ± 9.0) and Lis1S248Q (yellow; Kd = 162.0 ± 12.9). n = 3 replicates per condition. Statistical analysis was performed using an extra sum-of-squares F-test; p=0.0022. (D) Binding density (mean ± s.e.m.) of wild-type dynein on microtubules with ATP in the absence (white) or presence of Lis1WT (dark gray) or Lis1S248Q (yellow). Data was normalized to a density of 1.0 in the absence of Lis1. Statistical analysis was performed using an ANOVA; ****p<0.0001; ns, p=0.0614. n = 12 replicates per condition. (E) Binding density (mean ± s.e.m.) of wild-type dynein on microtubules with ATP-Vi in the absence (white) or presence of Lis1WT (dark gray) or Lis1S248Q (yellow). Data was normalized to a density of 1.0 in the absence of Lis1. Statistical analysis was performed using an ANOVA; ****p<0.0001; ns, p>0.9999. n = 12 replicates per condition.
Figure 5
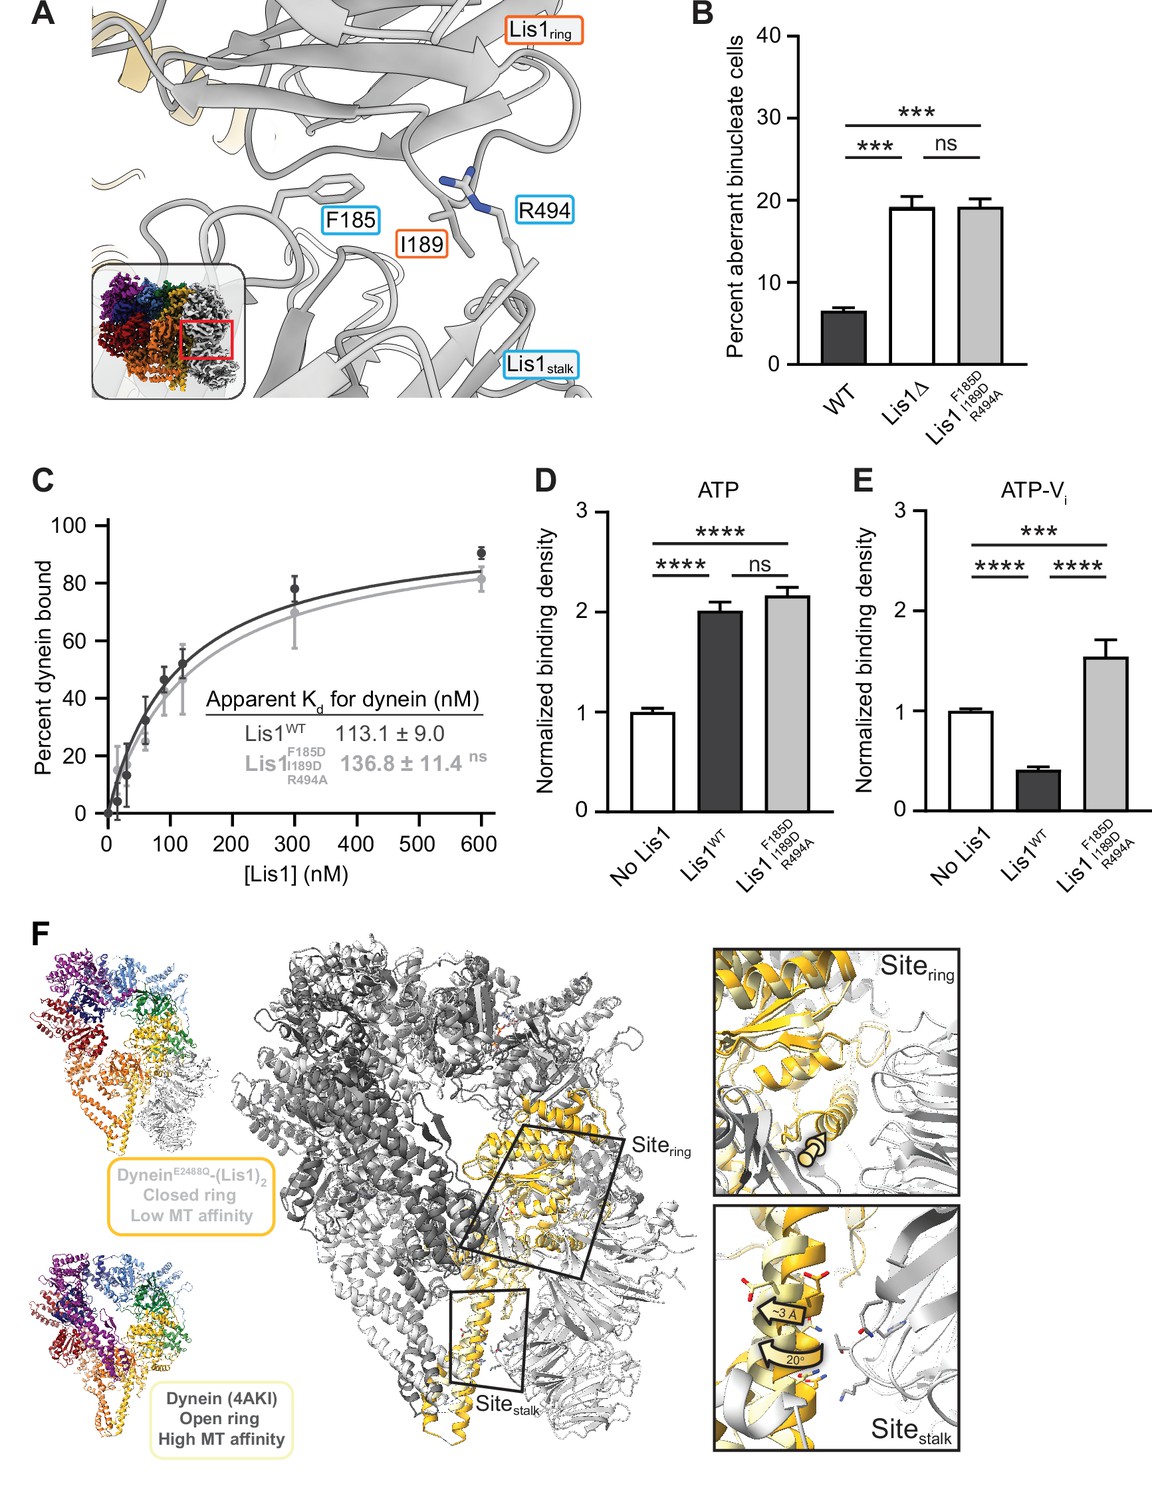
Role of the Lis1ring–Lis1stalk interaction in Lis1’s regulation of dynein.
(A) Close-up of the interface between the two Lis1 ß-propellers. The residues mutated in this study are indicated. The inset shows the location of the close-up in the full structure. (B) Quantitation (mean ± s.e.m.) of the percentage of cells displaying an aberrant binucleate phenotype for WT (dark gray), ΔLis1 (white), and Lis1F185D, I189D, R494A (light gray). n = 6 replicates of at least 200 cells each per condition. Statistical analysis was performed with a one-way ANOVA with Tukey’s multiple comparison test; *** WT and ΔLis1, p=0.0009; ***WT and Lis1 F185D, I189D, R494A, p=0.0008; ns, p>0.9999. WT and ΔLis1 data repeated from Figure 2. (C) Quantitation of the binding affinity of dynein for Lis1WT (dark gray; Kd = 113.1 ± 9.0) and Lis1F185D, I189D, R494A (light gray; Kd = 136.8 ± 11.4). n = 3 replicates per condition. Statistical analysis was performed using an extra sum-of-squares F-test; p=0.0974. Binding affinity of dynein for Lis1WT repeated from Figure 2. (D) Binding density (mean ± s.e.m.) of wild-type dynein on microtubules with ATP in the absence (white) or presence of Lis1WT (dark gray) or Lis1F185D, I189D, R494A (light gray). Data was normalized to a density of 1.0 in the absence of Lis1. Statistical analysis was performed using an ANOVA; ****p<0.0001; ns, p=0.4445. n = 12 replicates per condition. (E) Binding density (mean ± s.e.m.) of wild-type dynein on microtubules with ATP-Vi in the absence (dark gray) or presence of Lis1WT (white) or Lis1F185D, I189D, R494A (light gray). Data was normalized to a density of 1.0 in the absence of Lis1. Statistical analysis was performed using an ANOVA; ****p<0.0001; ***p=0.0002. n = 12 replicates per condition. (F) Comparison between the structures of the dynein–(Lis1)2 complex (this work; dynein colored light gray and dark yellow), where dynein’s ring is in its closed conformation (low affinity for the microtubule), and of dynein with its ring in the open conformation (high affinity for the microtubule; PDB: 4AKI; dynein colored dark gray and light yellow; Schmidt et al., 2012; left). The two structures were aligned using the globular portion of AAA4, where sitering is located, and the two Lis1 ß-propellers from the dynein–(Lis1)2 structure are shown. Close-ups of sitering and sitestalk (right) show that while the alpha helix to which Lis1 binds at sitering is in a very similar position in both structures (top, yellow arrow), sitestalk has shifted by ~3 Å and rotated by 20° away from where Lis1Stalk would be located (bottom).
Figure 6 with 1 supplement
Lis1 binding sites on dynein have different roles in the localization of active dynein complexes.
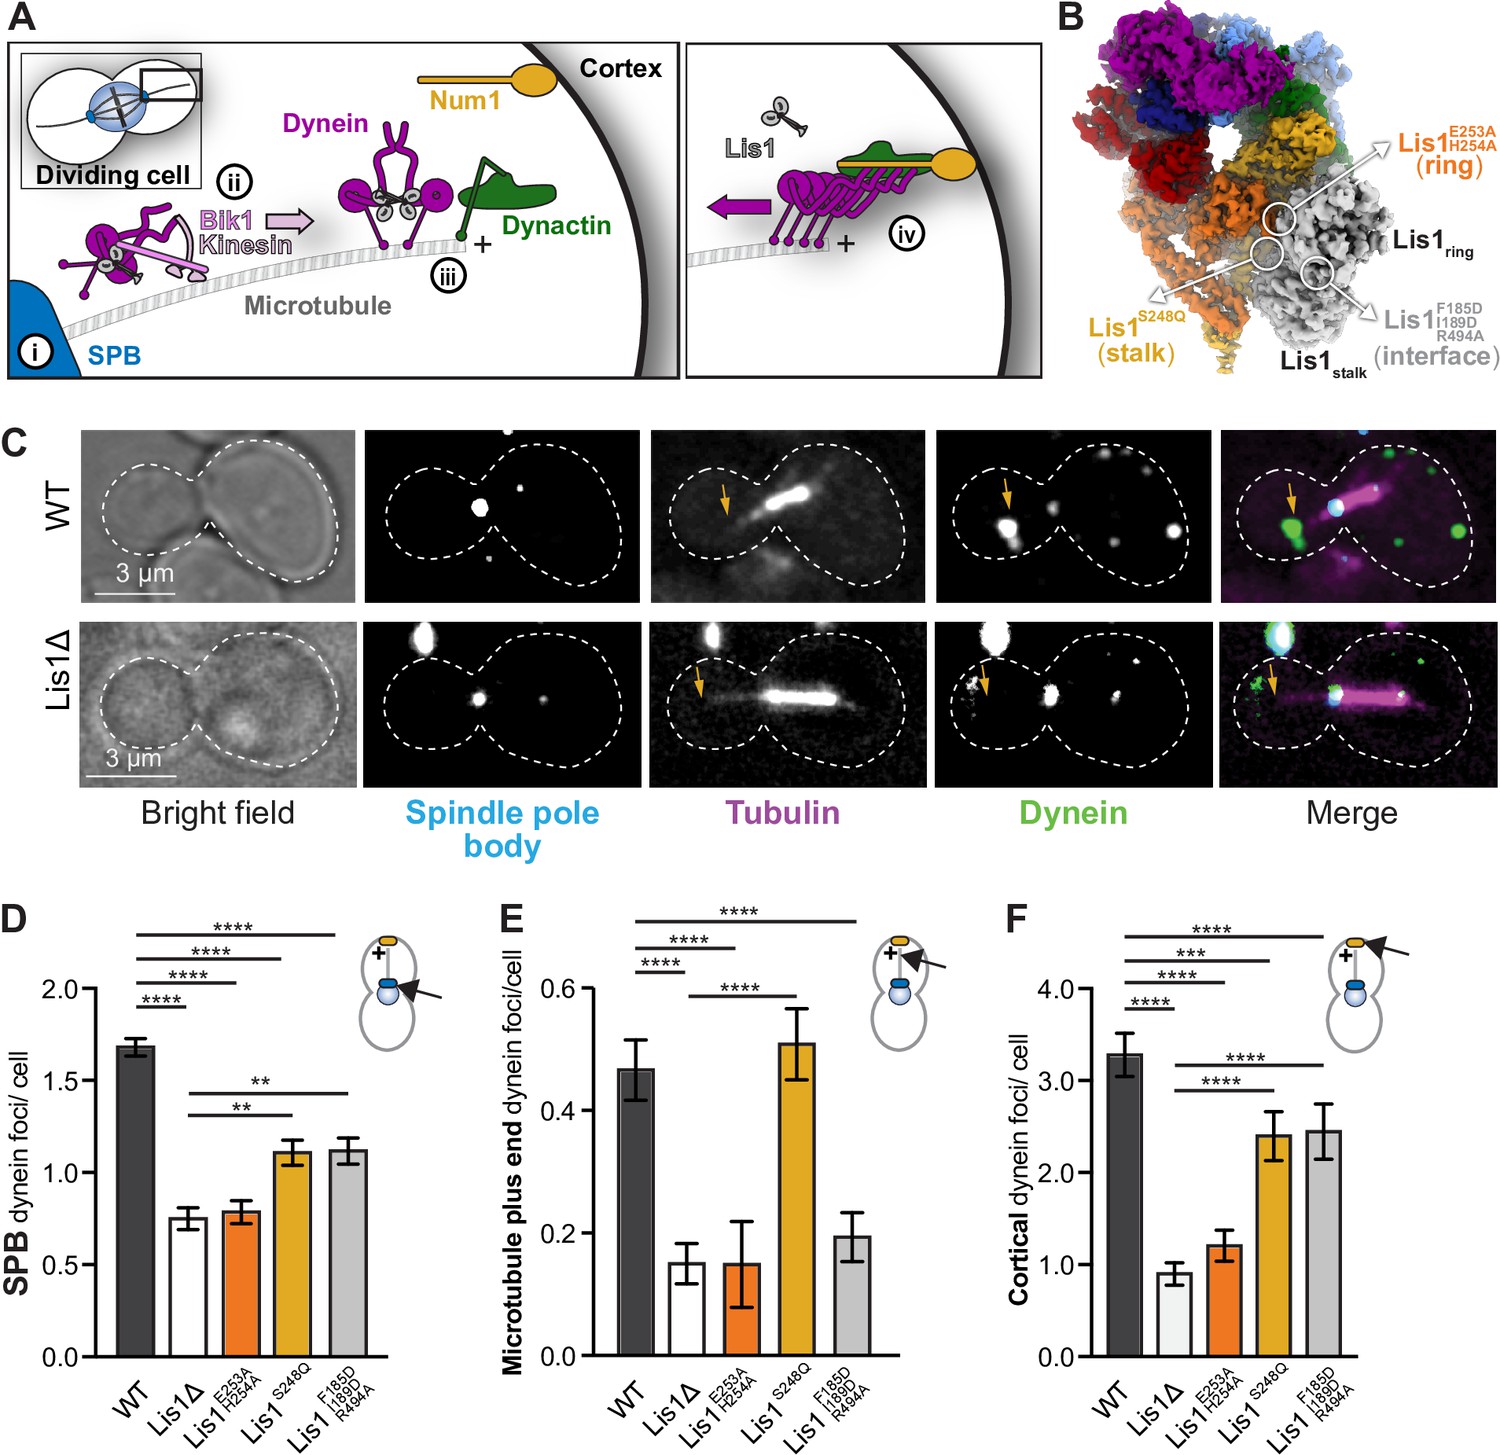
(A) Schematic showing the sites of dynein localization in dividing yeast cells. At steady state, dynein is found at the spindle pole body (SPB [i]), the microtubule plus end (ii), and the cell cortex (iii). Cortex-associated dynein, which is associated with dynactin and the putative activating adaptors Num1, is active and pulls on SPB-attached microtubules to position the mitotic spindle (iv). (B) Our structure showing the location of the mutations that disrupt Lis1 binding at sitering, sitestalk, and the Lis1:Lis1 interface. (C) Example images of dynein localization in dividing yeast cells. Orange arrowheads point to microtubule plus ends. (D–F) Quantification of dynein localization. Bar graphs show the average number of dynein foci per cell localized to the SPB (D), microtubule plus end (E), and cortex (F) in wild type, Lis1Δ, Lis1E253A, H254A, Lis1S248Q, and Lis1F185D, I189D, R494A yeast strains. Statistical analysis was performed using a Kruskal–Wallis test; ****p<0.0001; ***p=0.0001; ns, p>0.9999. n = 120 cells per condition.
Figure 6—figure supplement 1
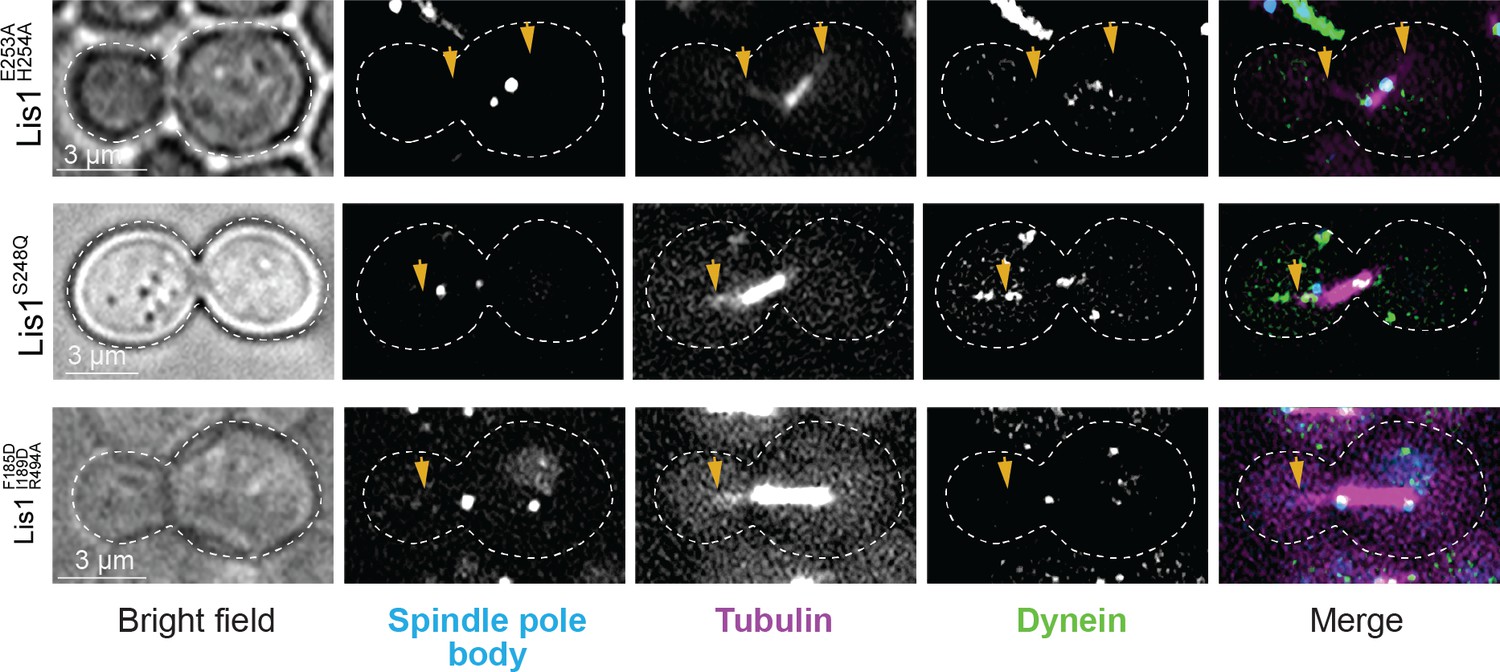
Yeast dynein–Lis1 and Lis1–Lis1 contacts are required for dynein to reach the cortex.
Example images of dynein (Dyn1-3xGFP) localization in dividing yeast cells. Cells shown were genetically modified at their endogenous loci to contain a Lis1E253A, H254A (sitering), Lis1S248Q (sitestalk), or Lis1F185D, I189D, R494A (Lis1–Lis1 interphase) mutation.
Figure 7
Yeast Lis1 regulates dynein beyond the relief of its autoinhibited state.
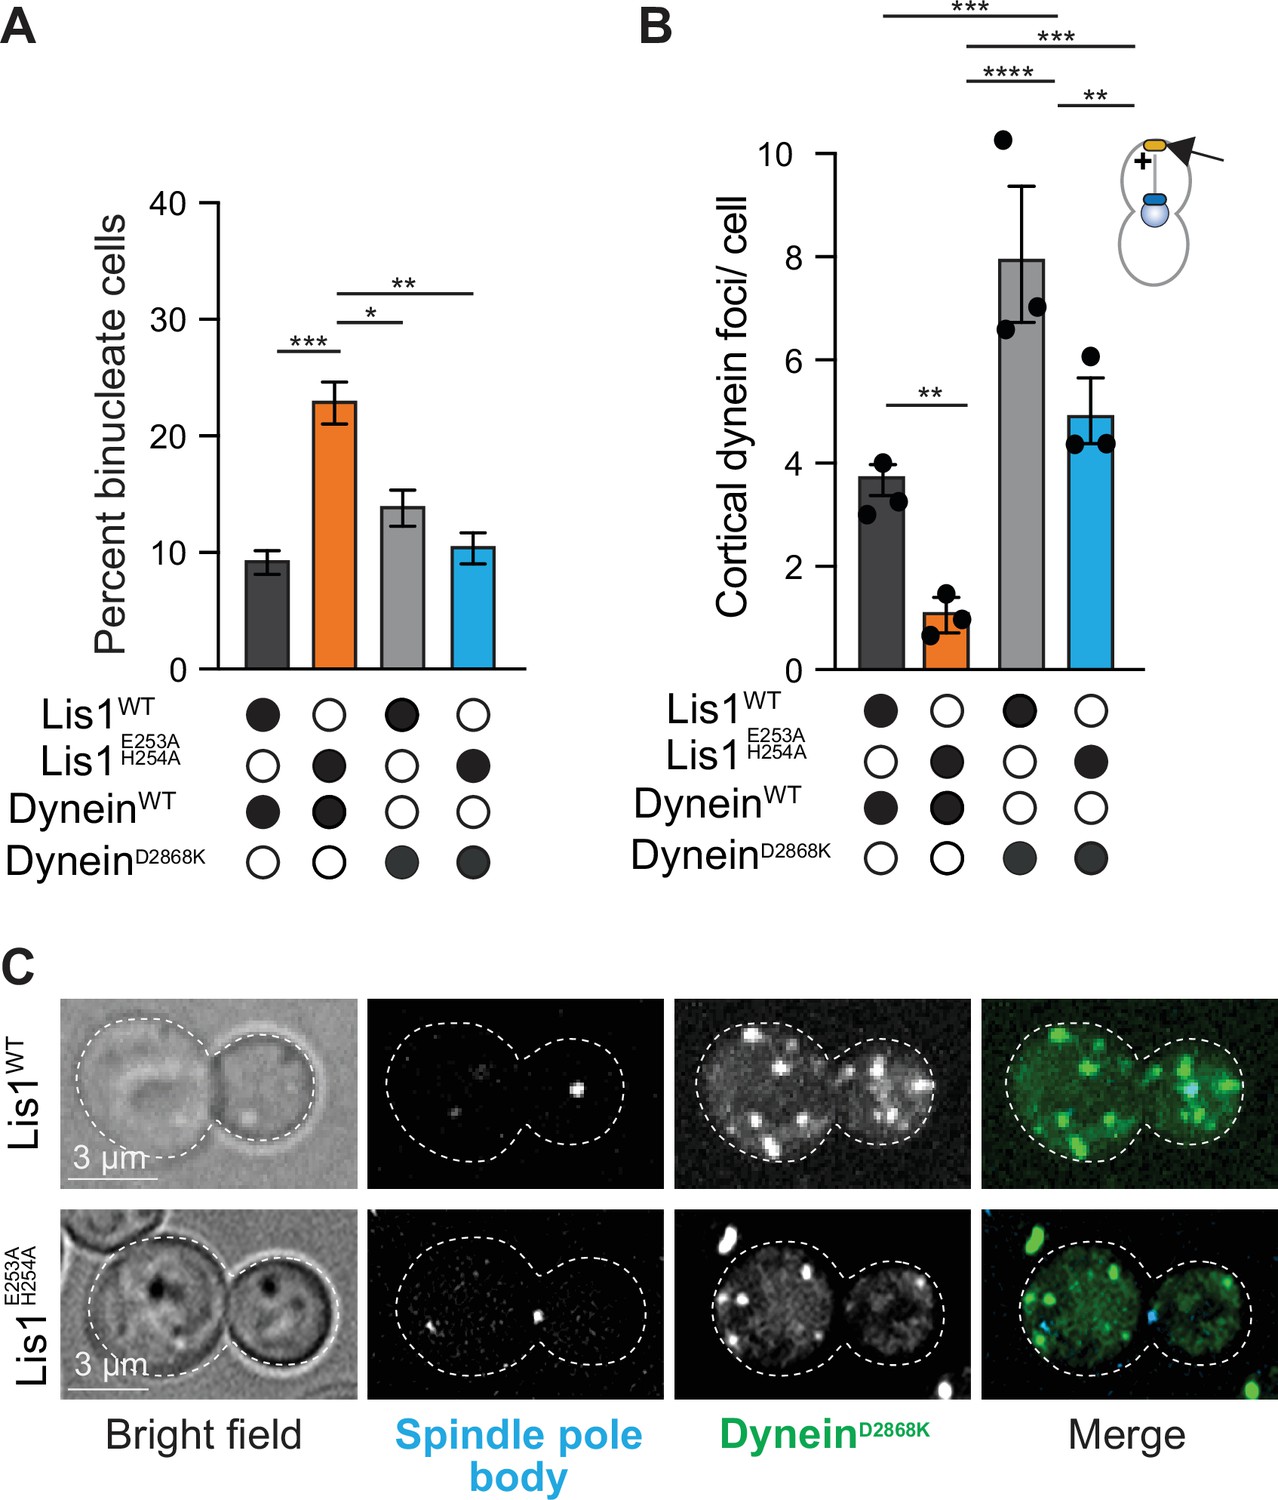
(A) Quantitation of the percentage of cells (mean ± s.e.m.) displaying an aberrant binucleate phenotype for WT dynein and Lis1 (dark gray), WT dynein and Lis1 E253A, H254A (orange), dynein mutated to relieve Phi autoinhibition (dyneinD2868K) and Lis1 (gray), and dyneinD2868K, Lis1 E253A, H254A (blue). n = 4 replicates of at least 200 cells per condition. Statistical analysis was performed with a one-way ANOVA with Tukey’s multiple comparison test; ***p=0.001; **p=0.0025; *p=0.036; all comparisons that are not labeled were not significant. (B) Quantification of dynein localization to the cortex. Bar graphs show the average number of dynein foci per cell localized to the cortex in WT dynein and Lis1 (dark gray), WT dynein and Lis1 E253A, H254A (orange), DyneinD2868K and Lis1 (gray), and DyneinD2868K and Lis1 E253A, H254A (blue). Statistical analysis was performed with a one-way ANOVA with Tukey’s multiple comparison test; ****p<0.0001; ***p=0.0002, and p=0.0003; **p=0.0028 and 0.0025; all comparisons that are not labeled were not significant. n = 120 cells per condition, three replicates. (C) Example images of dyneinD2868K-3xGFP localization in LisWT and Lis1E E253A, H254A dividing yeast cells.
Figure 8 with 1 supplement
sitering and sitestalk are important for Lis1’s ability to increase dynein velocity.
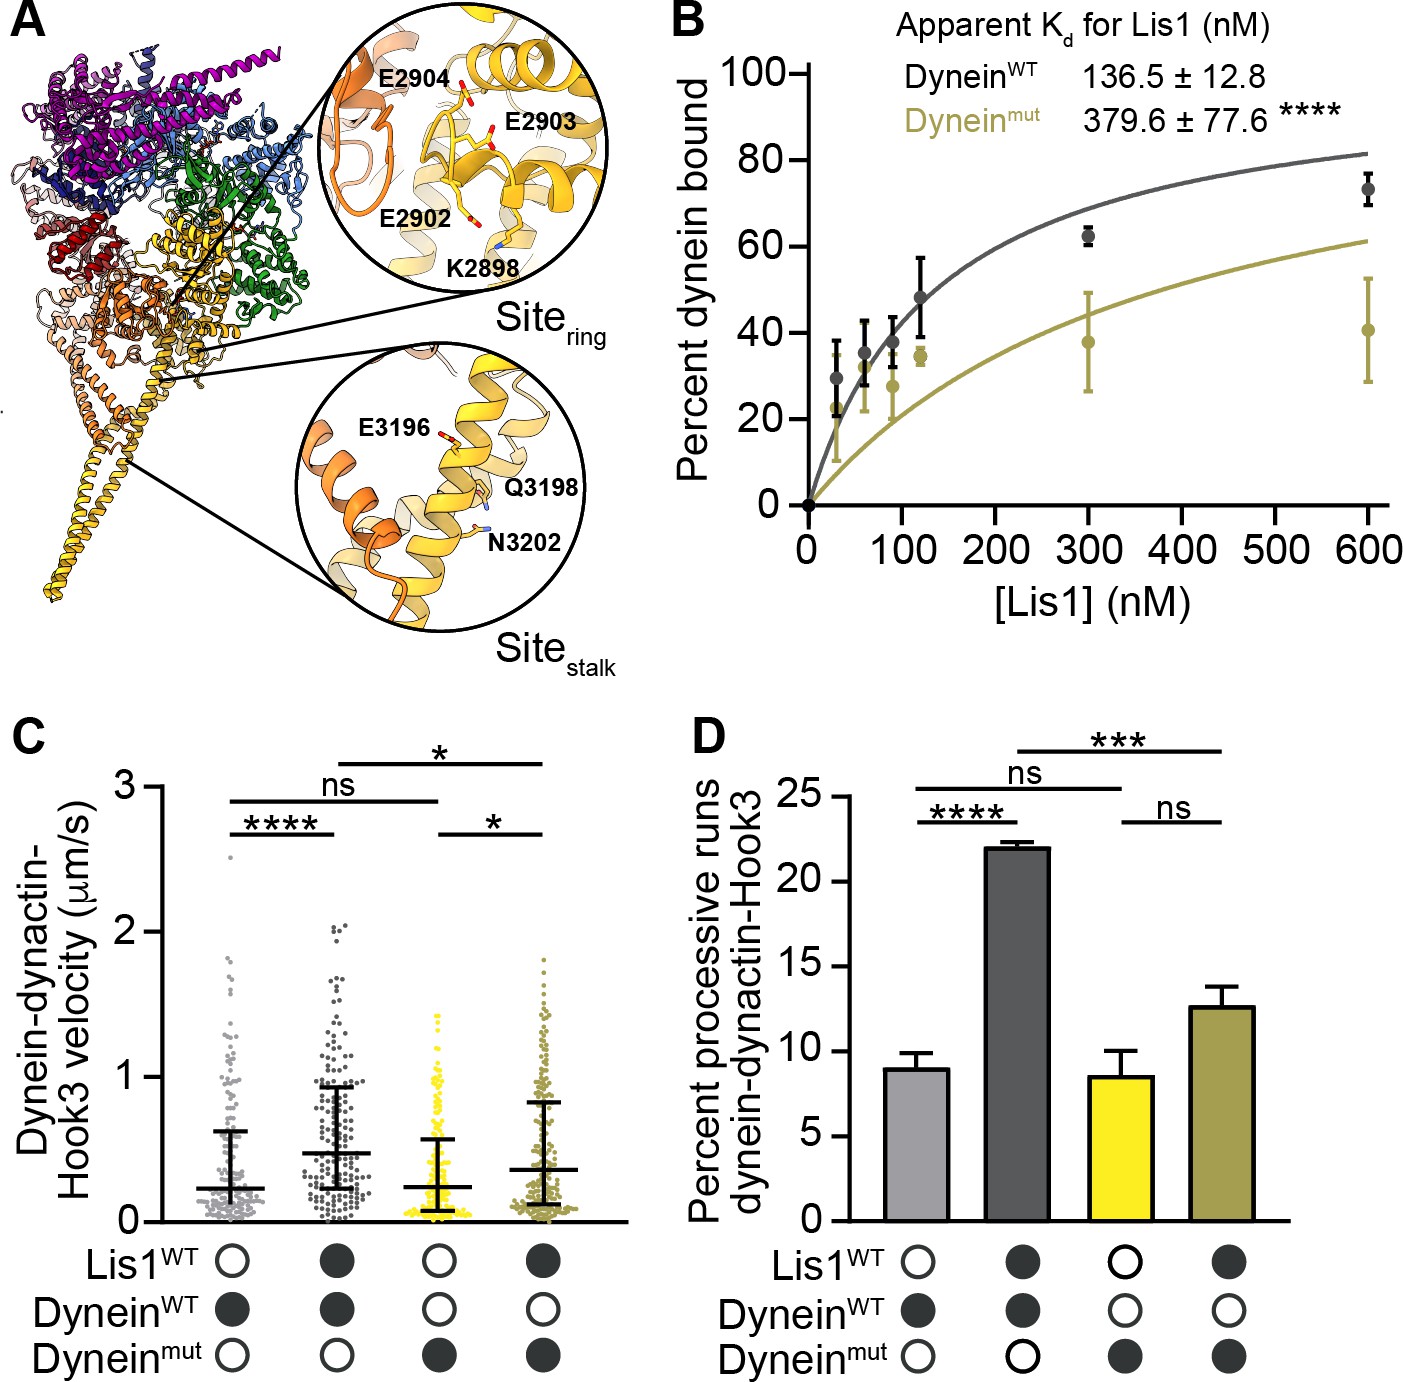
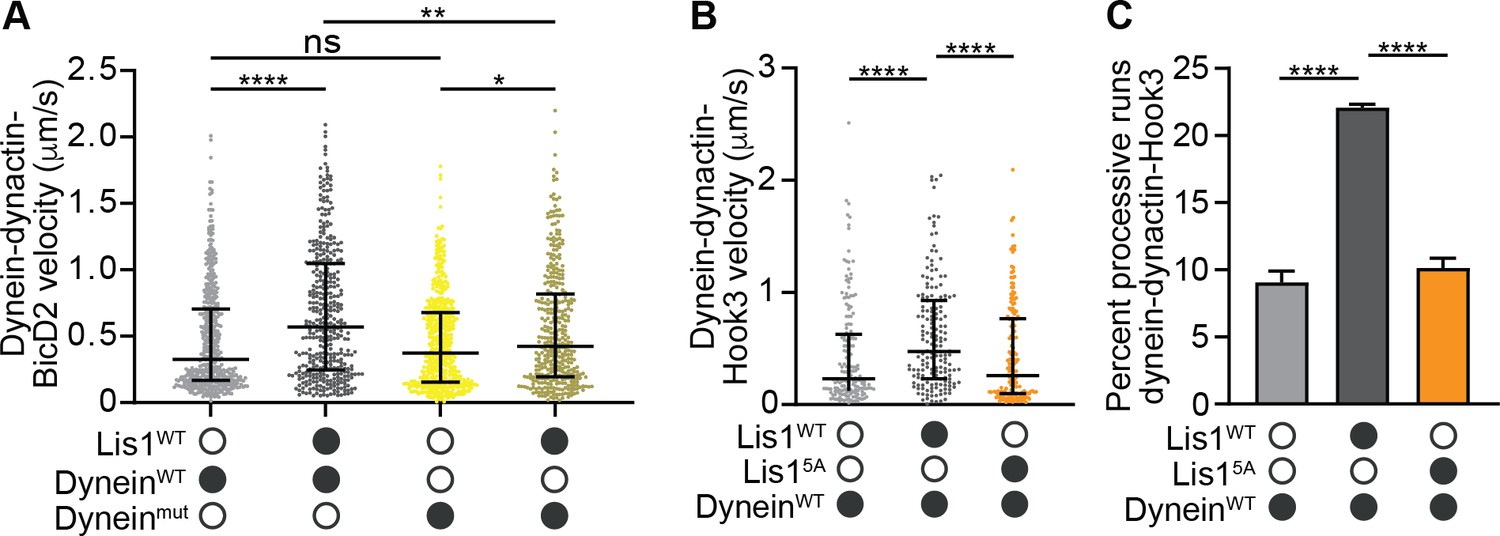
(A) Structure of the human dynein motor domain (PDB: 5NUG) (Zhang et al., 2017) highlighting residues mutated at sitering and sitestalk. (B) Quantitation of the binding affinity of human Lis1 for dyneinWT (dark gray; Kd = 136.5 ± 12.8) and Dyneinmut (dark yellow; Kd = 379.6 ± 77.6). n = 3 replicates per condition. Statistical analysis was performed using an extra sum-of-squares F-test; p=0.0001. (C) Single-molecule velocity of human dynein–dynactin–Hook3 complexes formed with dyneinWT (shades of gray) or dyneinmut (shades of yellow) in the absence or presence of 300 nM Lis1. Black circles indicate presence of a component in the assay, while white circles indicate the absence of a component. The median and interquartile range are shown. Statistical analysis was performed with a Kruskal–Wallis test; ****p<0.0001; *dyneinmut in the presence and absence of Lis1 p=0.0190; *dyneinWT and dyneinmut in the presence of Lis1, p=0.0231; ns, p>0.9999. At least 150 single-molecule events were measured per condition. (D) Percentage (mean ± s.e.m.) of processive runs of dynein–dynactin–Hook3 complexes formed with dyneinWT (shades of gray) or dyneinmut (shades of yellow) in the absence or presence of 300 nM Lis1. n = 3 replicates per condition with each replicate including at least 200 individual single-molecule events. Black circles indicate presence of a component in the assay, while white circles indicate the absence of a component. Statistical analysis was performed with an ANOVA; ****p<0.0001; ***p=0.0008; ns, dyneinmut in the presence and absence of Lis1, p=0.0755; ns, dyneinWT and dyneinmut in the absence of Lis1, p=0.9883.
Figure 8—figure supplement 1
Mutations in Lis1 reduce Lis1’s ability to increase dynein’s velocity.
(A) Single-molecule velocity of human dynein–dynactin–BicD2 complexes formed with dyneinWT (shades of gray) or dyneinmut (shades of yellow) in the absence or presence of 12.5 nM Lis1. The median and interquartile range are shown. Statistical analysis was performed with a Kruskal–Wallis test; ****p<0.0001; **p=0.0055; *p=0.0175; ns, p>0.9999. At least 350 single-molecule events were measured per condition. (B) Single-molecule velocity of dynein–dynactin–Hook3 complexes formed with dyneinWT in the absence or presence of 300 nM Lis1WT or Lis15A. The median and interquartile range are shown. Statistical analysis was performed with a Kruskal–Wallis test; ****p<0.0001. At least 150 single-molecule events were measured per condition. (C) Percentage (mean ± s.e.m.) of processive runs of dynein–dynactin–Hook3 complexes formed with dyneinWT in the absence or presence of 300 nM Lis1WT or Lis15A. n = 3 replicates per condition with each replicate including at least 200 individual single-molecule events. Statistical analysis was performed with an ANOVA; ****p<0.0001.
Figure 9

Model for Lis1 regulation of yeast dynein.
(A) Model of dynein regulation by Lis1 in S. cerevisiae. In S. cerevisiae, dynein arrives at microtubule plus ends either via transport by kinesin in a complex that contains Lis1 or by recruitment from the cytoplasm. Dynein that is recruited from the cytoplasm is most likely in a Phi conformation. Lis1 binding to dynein, either in the kinesin transport complex or at microtubule plus ends, would favor an open conformation of dynein. (B) Our mutant analysis suggests that Lis1 has an additional role in dynein regulation after it disrupts Phi autoinhibition by binding to dynein at sitering. Ultimately, dynein interacts with the candidate activating adaptor, Num1, on the cortex and Lis1 is released. We have opted to draw only a single dynein dimer in this complex as it is not known if these complexes contain one or two dynein dimers in yeast.
Author response image 1
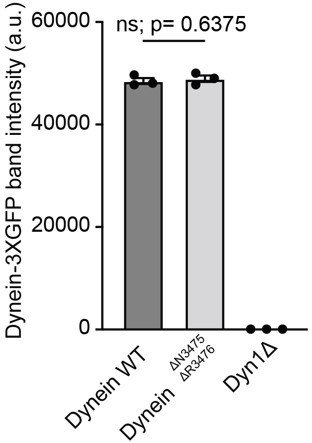
Quantification of Dynein-3XGFP band intensity +/- s.
e.m.
Author response image 2
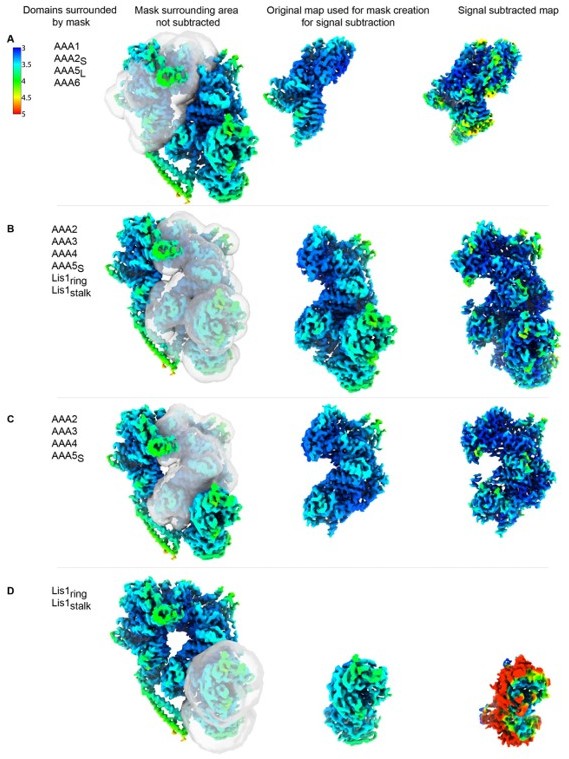
Signal-subtracted reconstructions for dyneinE2488Q-2x(Lis1).
Local resolution is shown for signal subtracted reconstructions of (A) AAA5L-6-1-2S, (B) AAA2-3-4-5S+Lis1ring+Lis1stalk, (C) AAA2-3-4-5S and (D) Lis1ring + Lis1stalk alone. The mask used for signal subtraction is shown on the original map. For comparison, the original portion of the map is displayed next to the resulting signal subtracted reconstruction.
Author response image 3
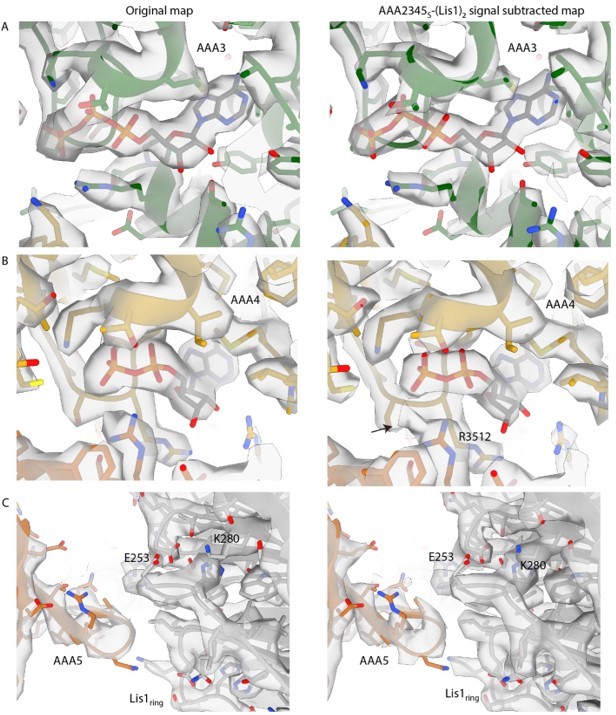
Examples of map density for signal-subtracted reconstruction of AAA2-3-4-5S+Lis1ring+Lis1stalk.
(A) The map quality for ATP at AAA3 is only nominally improved in the signal-subtracted reconstruction and remains unclear whether ATP or ADP-Vi is bound in the active site. (B) The signal-subtracted map shows additional density connected to R3512, which could correspond to a flexible phosphate group or vanadate ion. (C) Signal subtraction did not improve the resolution of the newly identified AAA5-Lis1ring interaction site. There was some resolution improvement for sidechains throughout the map (example, Lis1 K280).
Videos
Video 1
A 3.1 Å structure of the dynein–Lis1 complex.
Overview of the dynein–(Lis1)2 complex. The key interactions between dynein and Lis1 at sitering and sitestalk, as well as the Lis1–Lis1 interface, are highlighted.
Video 2
Interfaces involved in Lis1–dynein and Lis1–Lis1 interactions.
Video 3
3DVA analysis of dynein bound to Lis1.
3DVA analysis reveals conformational changes along the first two variability components. The first variability component describes motion attributed to the linker pulling away from AAA2. The second variability component describes changes in the overall motor domain as it undergoes subtle open and closing motions in the AAA ring.
Additional files
-
Supplementary file 1
S. cerevisiae strains used in this study.
A table of the S. cerevisiae strains used in this study. DHA and SNAP refer to the HaloTag (Promega) and SNAP-tag (NEB), respectively. TEV indicates a Tev protease cleavage site. PGAL1 denotes the galactose promoter, which was used for inducing strong expression of Lis1 and dynein motor domain constructs. Amino acid spacers are indicated by g (glycine) and gs (glycine-serine).
- https://cdn.elifesciences.org/articles/71229/elife-71229-supp1-v2.docx
-
Supplementary file 2
Cryo-EM data collection parameters and model refinement statistics.
Microscopy and model refinement information for dyneinE2488Q– (Lis1)2 dataset and structure.
- https://cdn.elifesciences.org/articles/71229/elife-71229-supp2-v2.docx
-
Transparent reporting form
- https://cdn.elifesciences.org/articles/71229/elife-71229-transrepform1-v2.pdf
Download links
A two-part list of links to download the article, or parts of the article, in various formats.
Downloads (link to download the article as PDF)
Open citations (links to open the citations from this article in various online reference manager services)
Cite this article (links to download the citations from this article in formats compatible with various reference manager tools)
Structural basis for cytoplasmic dynein-1 regulation by Lis1
eLife 11:e71229.
https://doi.org/10.7554/eLife.71229


