An actin-related protein that is most highly expressed in Drosophila testes is critical for embryonic development
- Division of Basic Sciences, Fred Hutchinson Cancer Research Center, United States
- Howard Hughes Medical Institute, Fred Hutchinson Cancer Research Center, United States
Figures
Figure 1 with 1 supplement
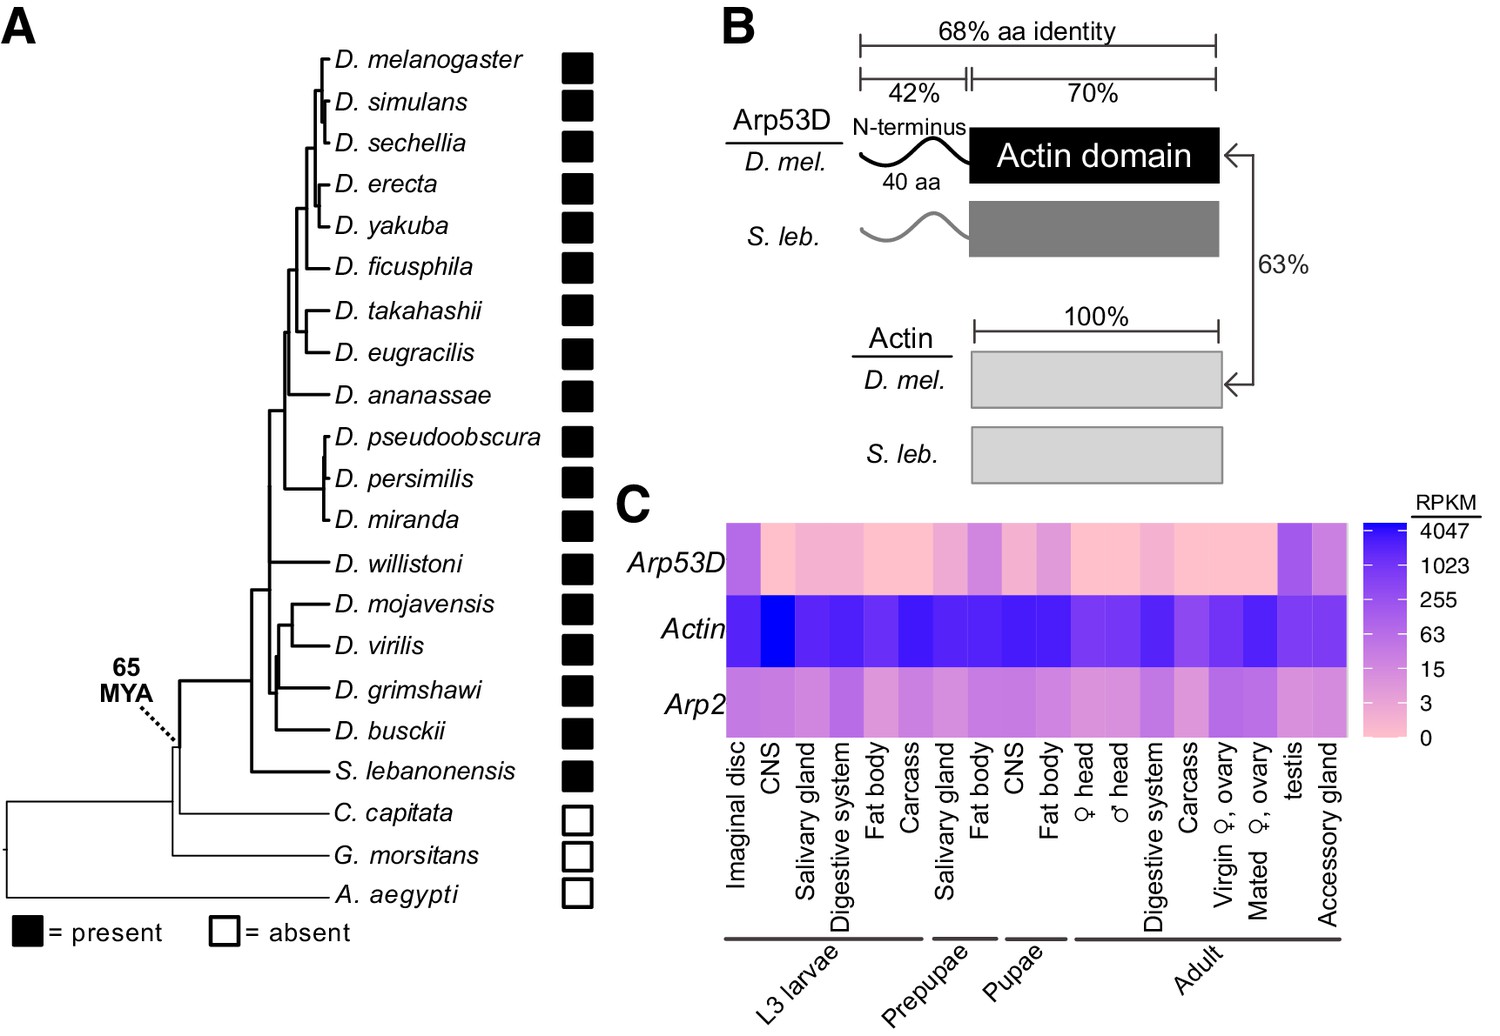
Arp53D encodes a rapidly evolving non-canonical Arp with male-enriched expression.
(A) A species tree of selected Diptera, including 18 Drosophila species, Scaptodrosophila lebanonensis, Ceratitis capitata, Glossina morsitans, and Aedes aegypti, which either encode or lack Arp53D orthologs (filled and empty boxes, respectively). Based on this, we estimate Arp53D is at least 65 million years old. (B) Arp53D domains include an extended N-terminus, which is predicted to be unstructured, as well as a canonical actin domain. The protein identities are displayed for the different domains of actin (Act5C) and Arp53D from D. melanogaster and S. lebanonensis. Arp53D’s sequence has diverged from actin and has higher between-species divergence than actin. (C) Expression levels from RNA-seq (in RPKM) are displayed for tissues at different developmental stages (wandering L3 larvae, white prepupae, pupae, and adults) (modENCODE Consortium et al., 2009; Thurmond et al., 2019), with blue indicating highest expression. Unlike actin and canonical Arps like Arp2, Arp53D expression is highly skewed towards males in adult flies.
Figure 1—figure supplement 1
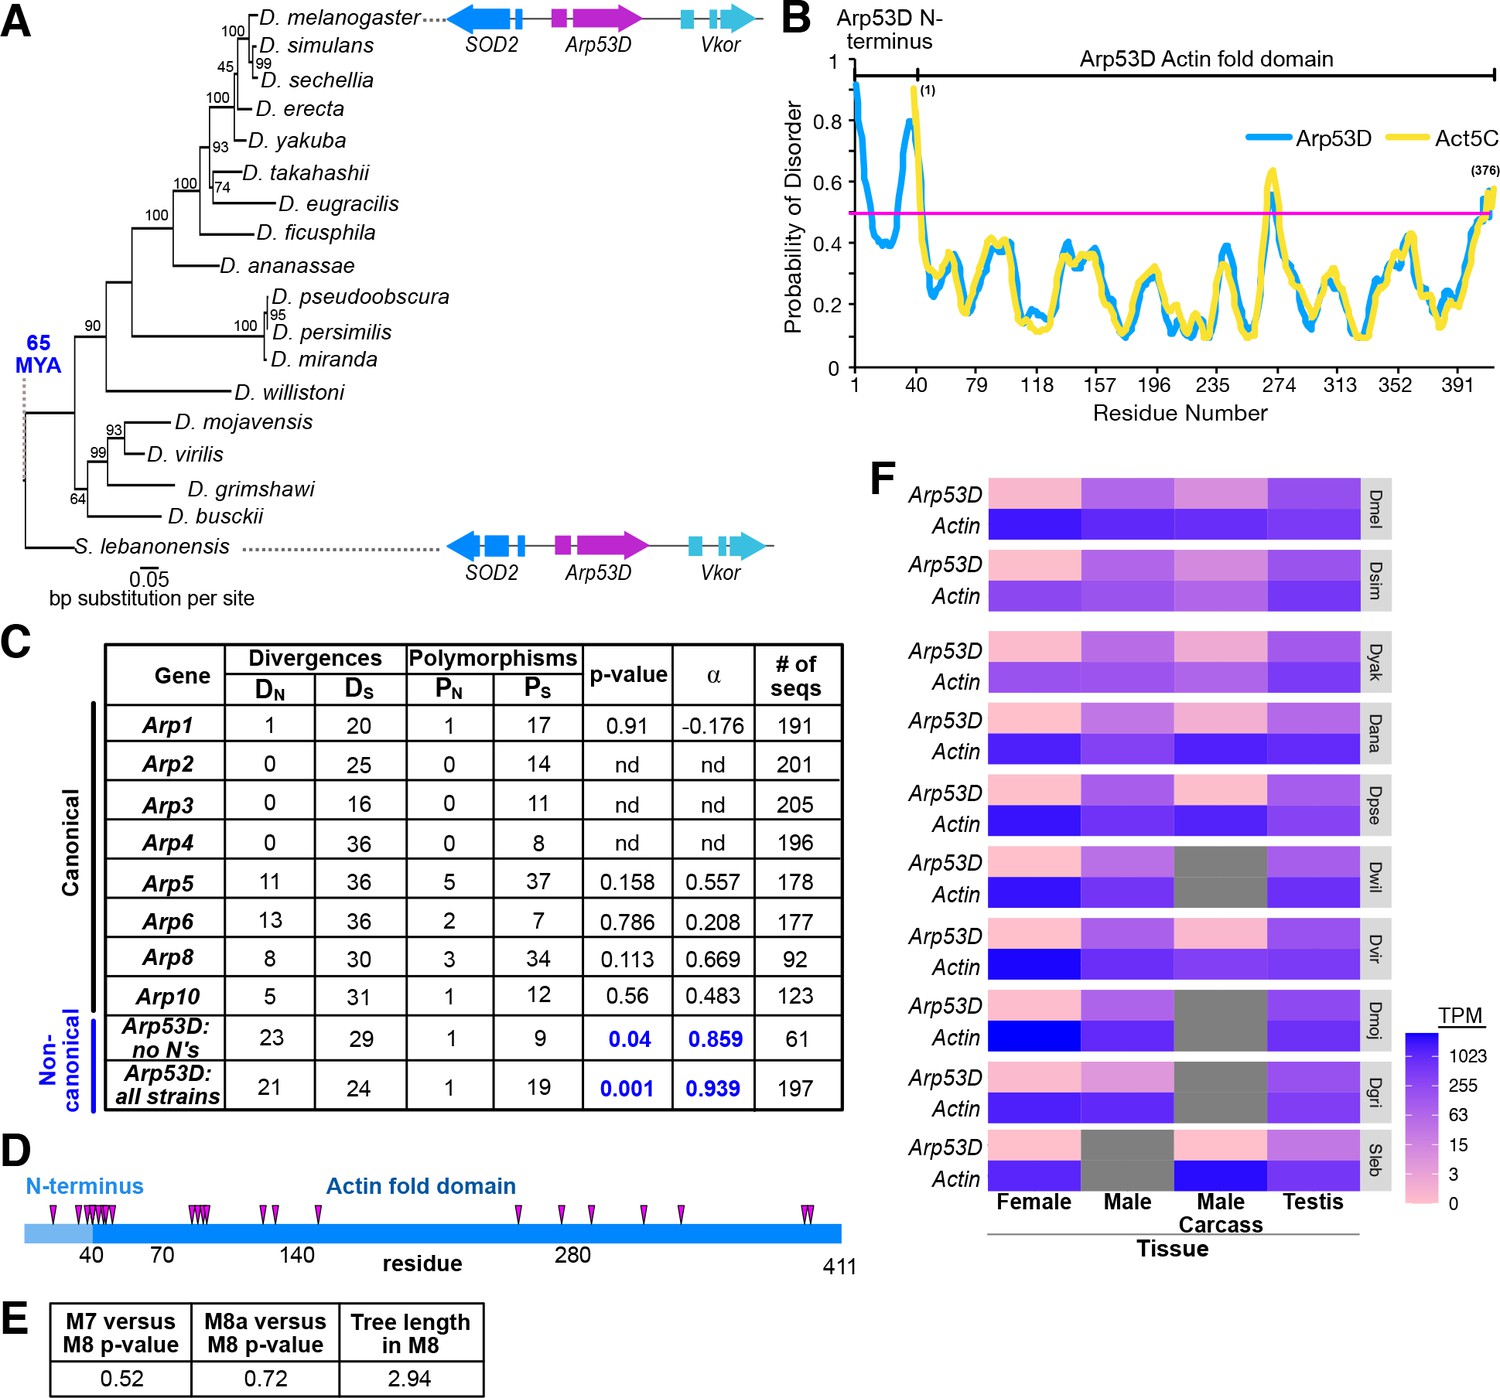
Arp53D diverged in sequence and expression from actin.
(A) Nucleotide tree with 100 bootstraps includes Arp53D orthologs from sequenced genomes of 18 Drosophila species and S. lebanonensis. The tree topology is identical to the phylogeny based on amino acid alignments (Figure 1A) and closely resembles the expected species tree in Diptera. The syntenic locus for Arp53D is represented in the two most diverged species—D. melanogaster and S. lebanonensis. Arp53D’s conserved neighboring genes are SOD2 and Vkor with exons represented by boxes and introns and intergenic regions as lines. (B) The probability of disorder of the protein sequence of D. melanogaster Arp53D (blue) and Act5C (yellow) is graphed with respect to the protein sequence. Disorder probability was determined using PrDOS (Ishida and Kinoshita, 2007). (C) Arp53D and all canonical Arps from hundreds of D. melanogaster alleles (DPGP3) (Lack et al., 2015) were aligned to their orthologous sequences in D. simulans (Hu et al., 2013) in an unpolarized McDonald–Kreitman (MK) test, which compares the ratio of non-synonymous to synonymous polymorphisms (PN and PS) among the D. melanogaster strains and the ratio of non-synonymous to synonymous fixed substitutions (DN and DS) between the D. melanogaster and D. simulans orthologs. Strains whose sequences contained one or more Ns were removed, and rare variants (<5% of sequences) were ignored; the resulting number of strains used for the MK test is listed for each gene. Arp53D shows statistically significant positive selection (blue, bold text) with an α-value (proportion of substitutions driven by positive selection) approaching 1 in an initial analysis of only 61 sequences (136 were originally excluded as they contain a 5-codon polymorphic deletion), as well as in a reanalysis of all 197 D. melanogaster strain sequences. Canonical Arps showed no positive selection. The p-value and α-value could not be determined (‘nd’) in some cases due to the absence of fixed and polymorphic non-synonymous changes. (D) Locations of non-synonymous fixed changes (arrowheads) between D. melanogaster and D. simulans in a schematic representing Arp53D’s protein sequence (411 aa). Four changes lie within the N-terminus. (E) Site-specific positive selection was tested with PAML including 10 species: D. takahashii, D. suzukii, D. erecta, D. yakuba, D. simulans, D. sechellia, D. melanogaster, D. elegans, D. ficusphila, and D. eugracilis. Starting omega 0.4 with the 3 × 4 codon table was used for the statistics shown. Lack of statistical significance indicates no site-specific positive selection was observed. (F) Expression levels in RNA-seq data (TPM) from females, males, male carcass, and testis are displayed for 10 Drosophila species with lowest values shown in pink and highest values in blue. Gray boxes indicate no RNA-seq data available. See Table 2 for accession numbers of the datasets used. Unlike actin, Arp53D is male-enriched in expression with high levels in the testis.
Figure 2 with 1 supplement
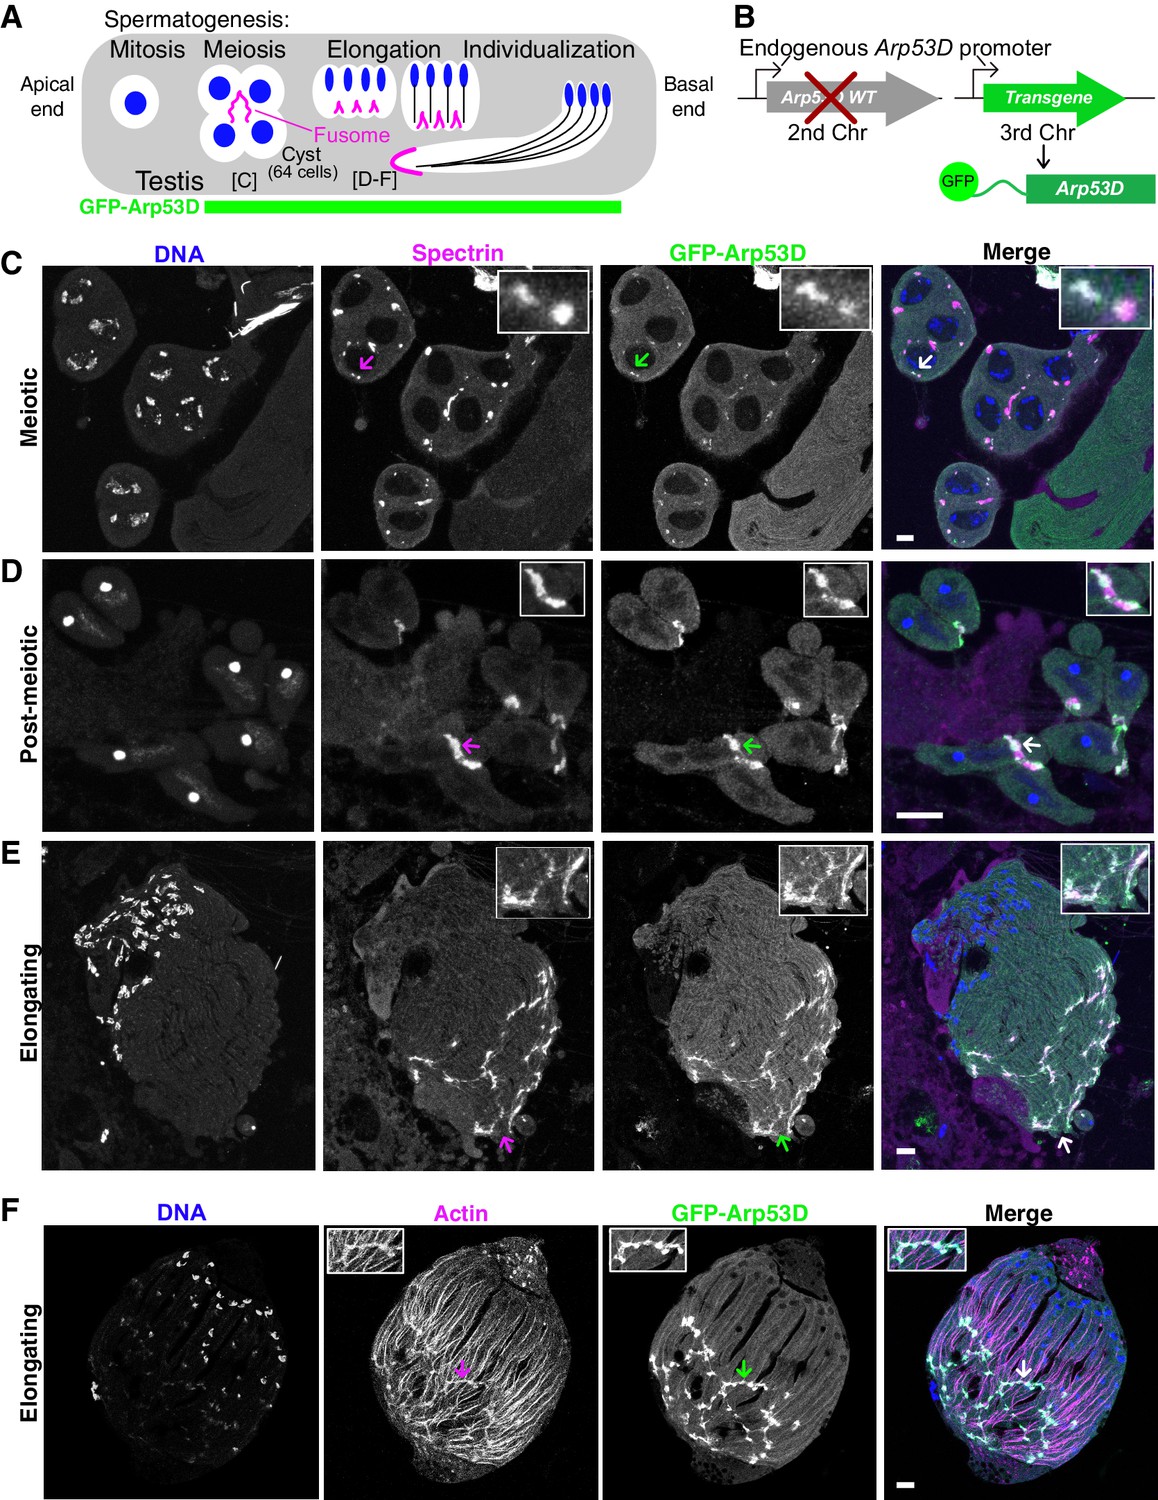
Arp53D localizes to specific actin structures late in sperm development.
(A) A schematic shows spermatogenesis progression from the apical end to the basal end of the testis; green indicates stages where GFP fluorescence is visible in transgenic flies (B). Labels for the meiotic and elongating stages refer to panels (C–F). (B) To localize Arp53D in the testis, a transgene encoding Arp53D with an N-terminal superfolder GFP (sfGFP) tag was inserted on the third chromosome. The transgenic fly line was then crossed into the Arp53D-KO background so that transgene and knockout (KO) alleles are both homozygous; thus, all Arp53D molecules are fluorescently tagged. (C–E) Cysts from transgenic fly testes are from meiotic (C), post-meiotic (D), or elongating stages (E) of spermatogenesis. The fusome-localizing protein α-spectrin (magenta), DNA (blue), and Arp53D (green, anti-GFP) were probed. The merge of α-spectrin and Arp53D appears as white, indicating that Arp53D co-localizes with α-spectrin and thus appears at the fusome. Arrows correspond to the enlarged insets. (F) Cysts from transgenic fly testes (B) were fixed and probed for filamentous actin, indicating Arp53D co-localizes with actin only at the fusome and not throughout the cyst. All scale bars are 10 µm.
Figure 2—figure supplement 1
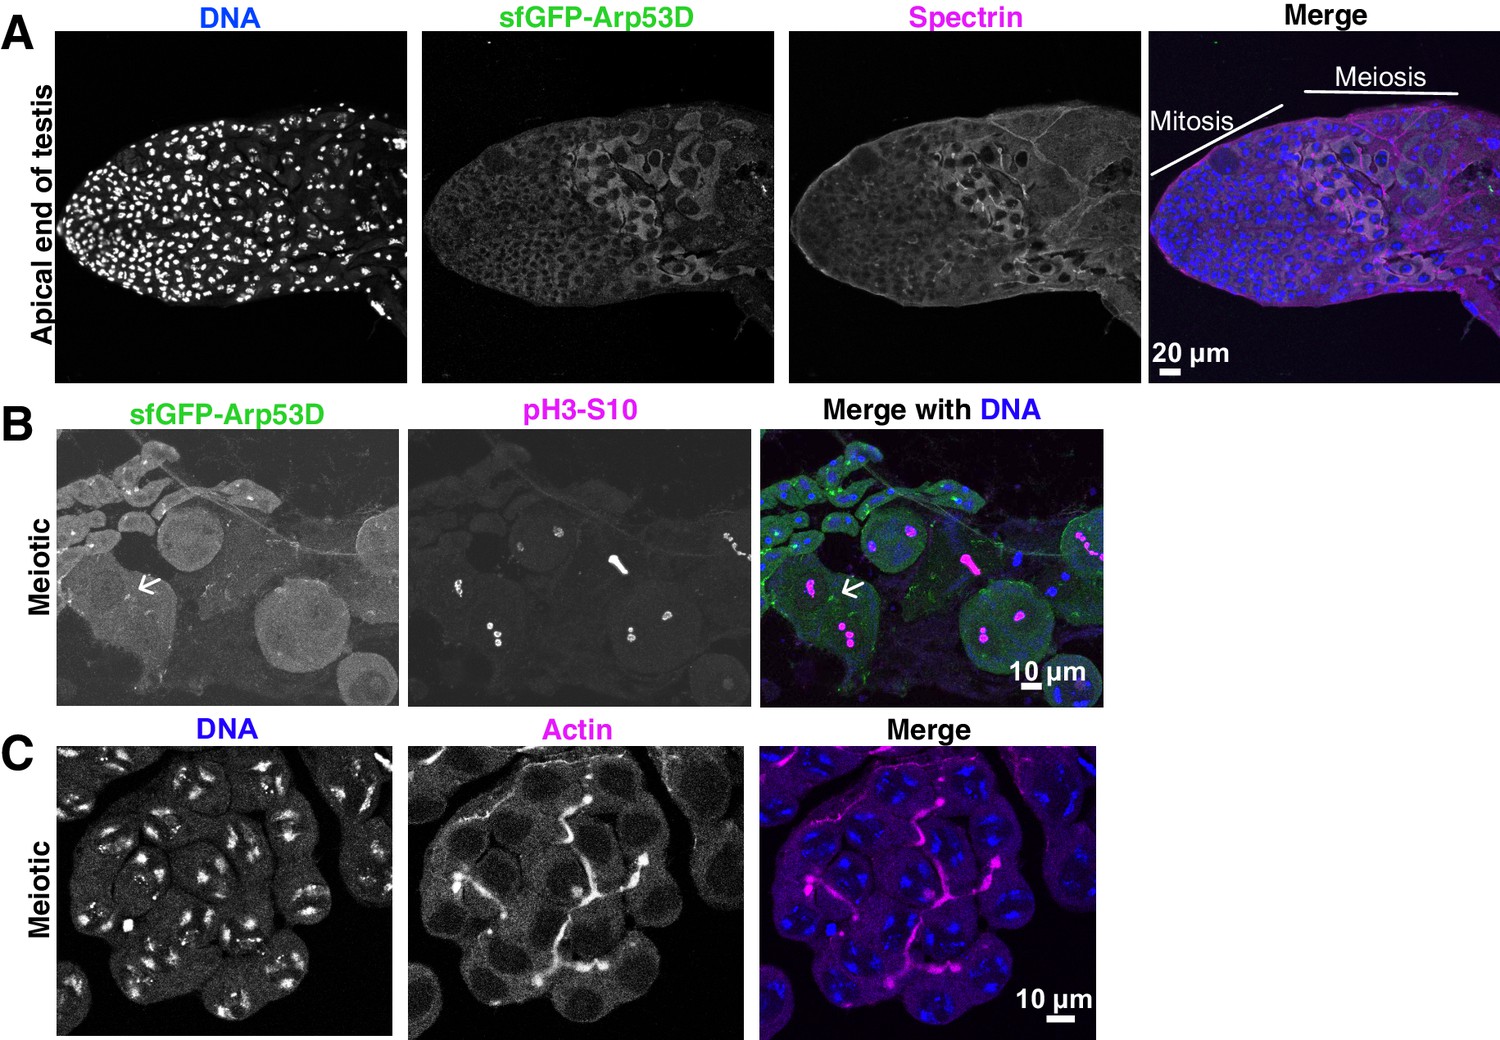
Arp53D is expressed in meiosis.
(A) Testes expressing sfGFP-Arp53D were fixed and probed with anti-GFP and anti-α-spectrin. GFP signal is detected first in meiotic cells (identified by DNA staining pattern) but not mitotic cells, which lie only at the apical tip of the testis. (B) Testes expressing sfGFP-Arp53D were fixed and probed with anti-GFP and anti-phosphorylated (S10) histone H3 (pH3-S10), a marker for meiosis. sfGFP-Arp53D (indicated by arrow) is detected in cells that are meiotic (positive for pH3-S10). (C) Meiotic cells in testes were probed for DNA and filamentous actin (phalloidin probe) to show actin localization to the male fusome.
Figure 3 with 1 supplement
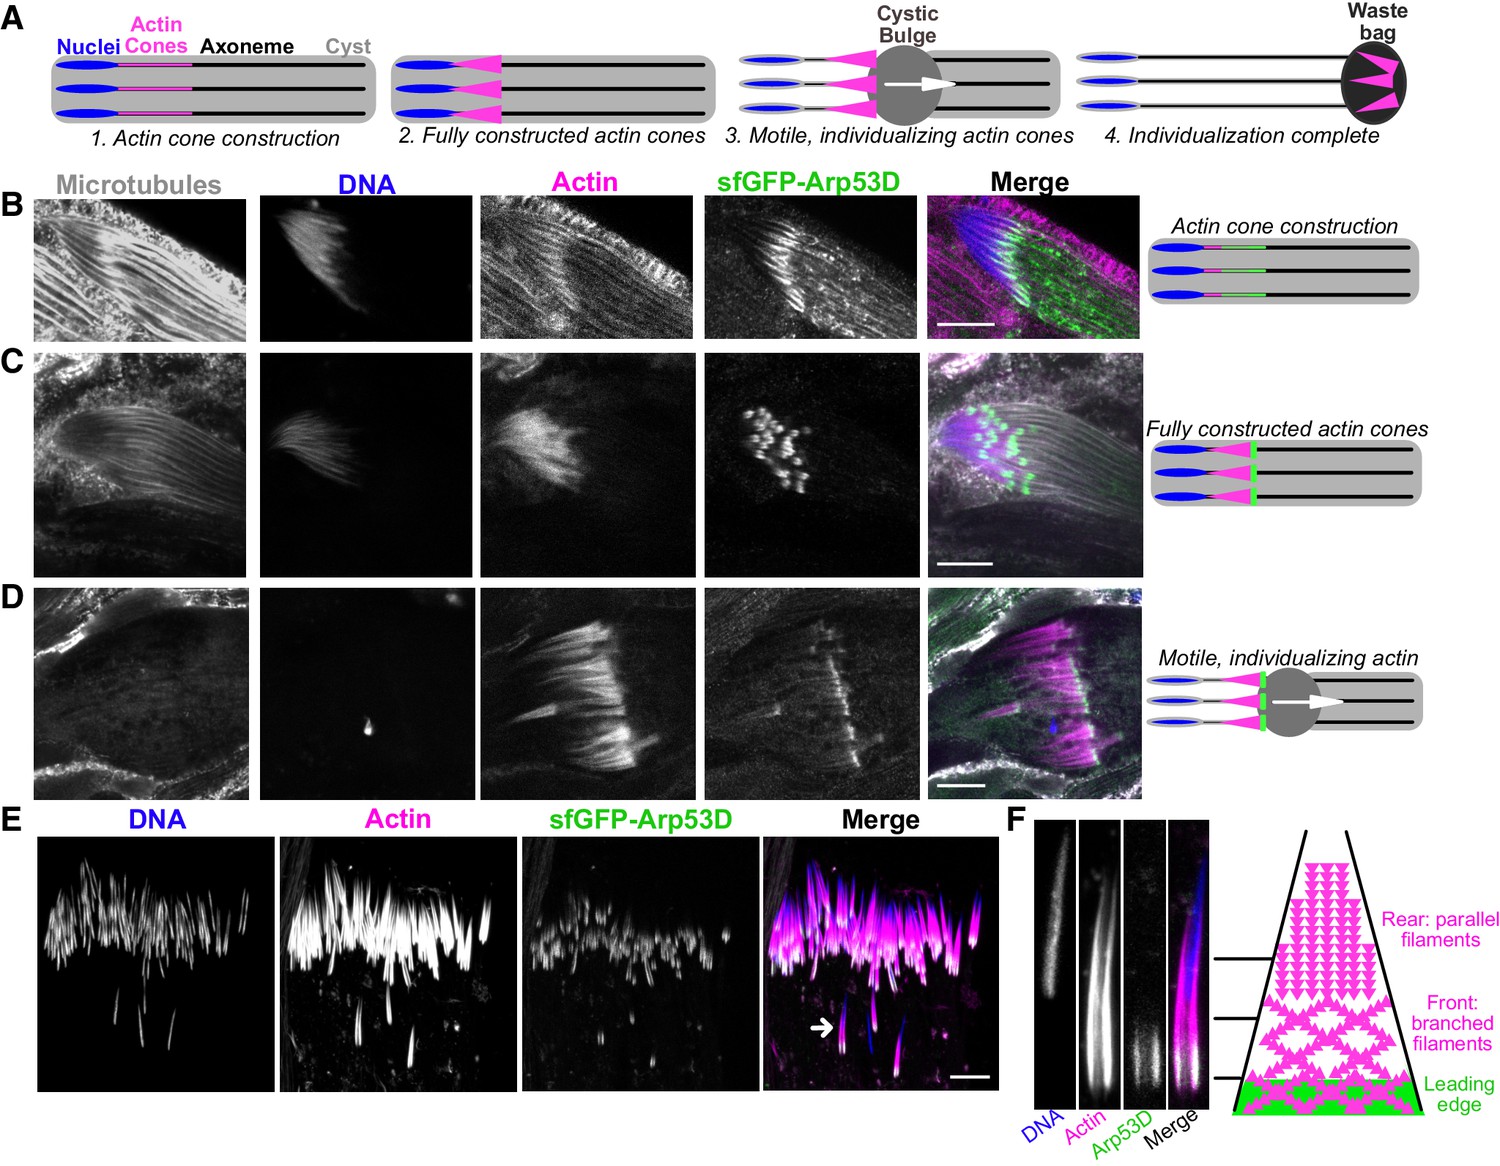
Arp53D localizes to the leading edge of actin cones during sperm individualization.
(A) A schematic depicts the different stages of sperm individualization. Once actin cones are fully assembled at mature sperm nuclei, the cones translocate along the axoneme (a microtubule structure), pushing excess cytoplasm (the ‘cystic bulge’) to the end of the cyst. The cystic bulge undergoes autophagy and becomes known as the ‘waste bag.’ (B–D) Testes expressing sfGFP-Arp53D (Figure 2B) were dissected and fixed. Axonemal microtubules (gray, anti-tubulin), DNA (blue, DAPI), actin (magenta, phalloidin), and sfGFP-Arp53D (green, anti-GFP) were visualized. Each row shows a cyst at a different stage of individualization, which is depicted with a schematic to the right. Arp53D colocalizes with actin during cone polymerization and then coalesces at the leading edge of the cone, once the actin cone is fully constructed. Arp53D remains at the leading edge throughout translocation. (E) SfGFP-Arp53D-expressing testes (Figure 2B) were imaged live and probed for filamentous actin (SiR-actin probe; Lukinavičius et al., 2014) and DNA. The arrow indicates the actin cone shown in panel (F). (F) A mature sperm nucleus and its corresponding actin cone is shown in cross-section with Arp53D localizing only at the leading edge. On the right is a schematic that delineates the types of actin networks found in the cone (Noguchi et al., 2008) (not drawn to scale). The green filaments indicate Arp53D localization. All scale bars are 10 µm.
Figure 3—figure supplement 1
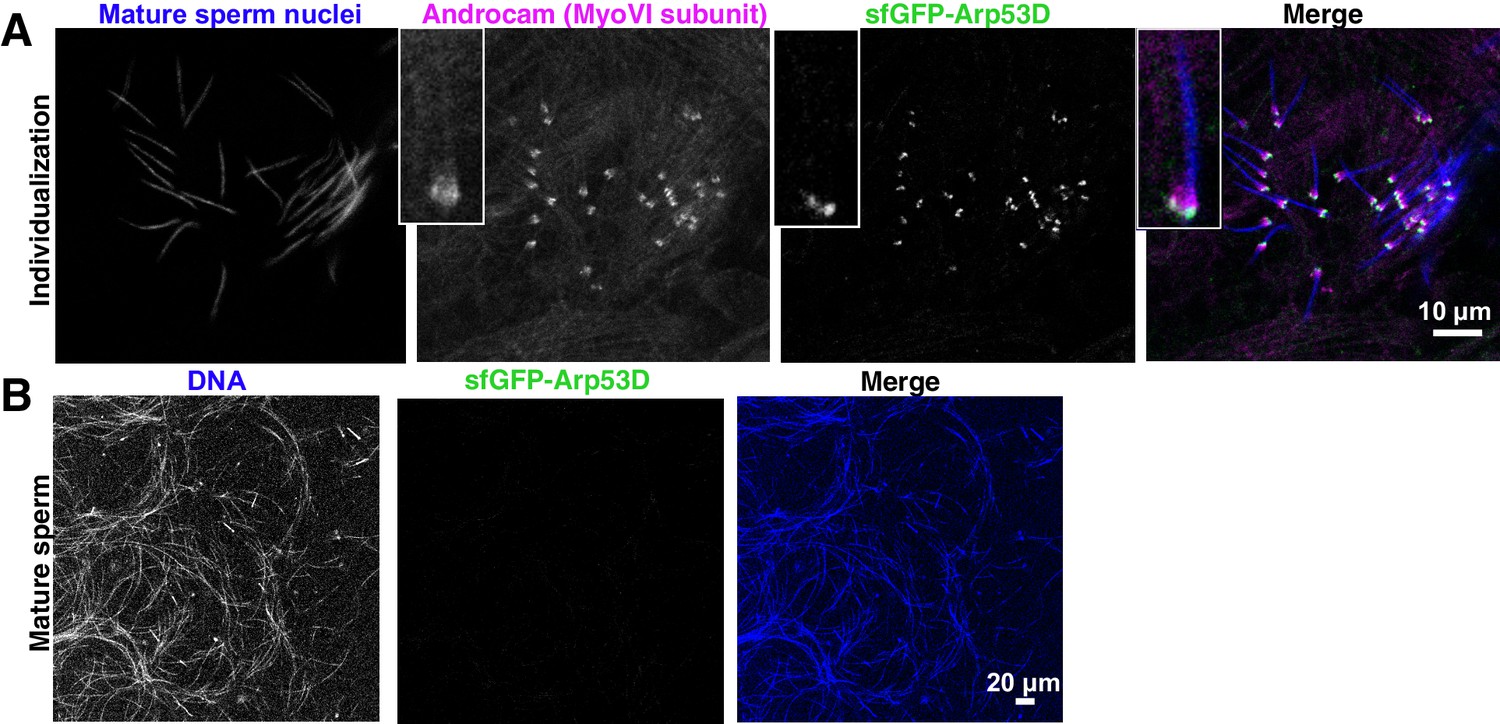
Arp53D localizes proximally to a testis-specific myosin VI subunit.
(A) Testes expressing sfGFP-Arp53D were fixed and probed with anti-GFP and anti-Androcam, the testis-specific light chain of myosin VI (Frank et al., 2006). Arp53D and Androcam are both concentrated toward the leading edge of actin cones at mature sperm nuclei, shown in blue (DAPI). (B) No GFP signal was detected in mature sperm (denoted by condensed DNA, blue) dissected from the seminal vesicle of sfGFP-Arp53D-expressing flies.
Figure 4 with 1 supplement
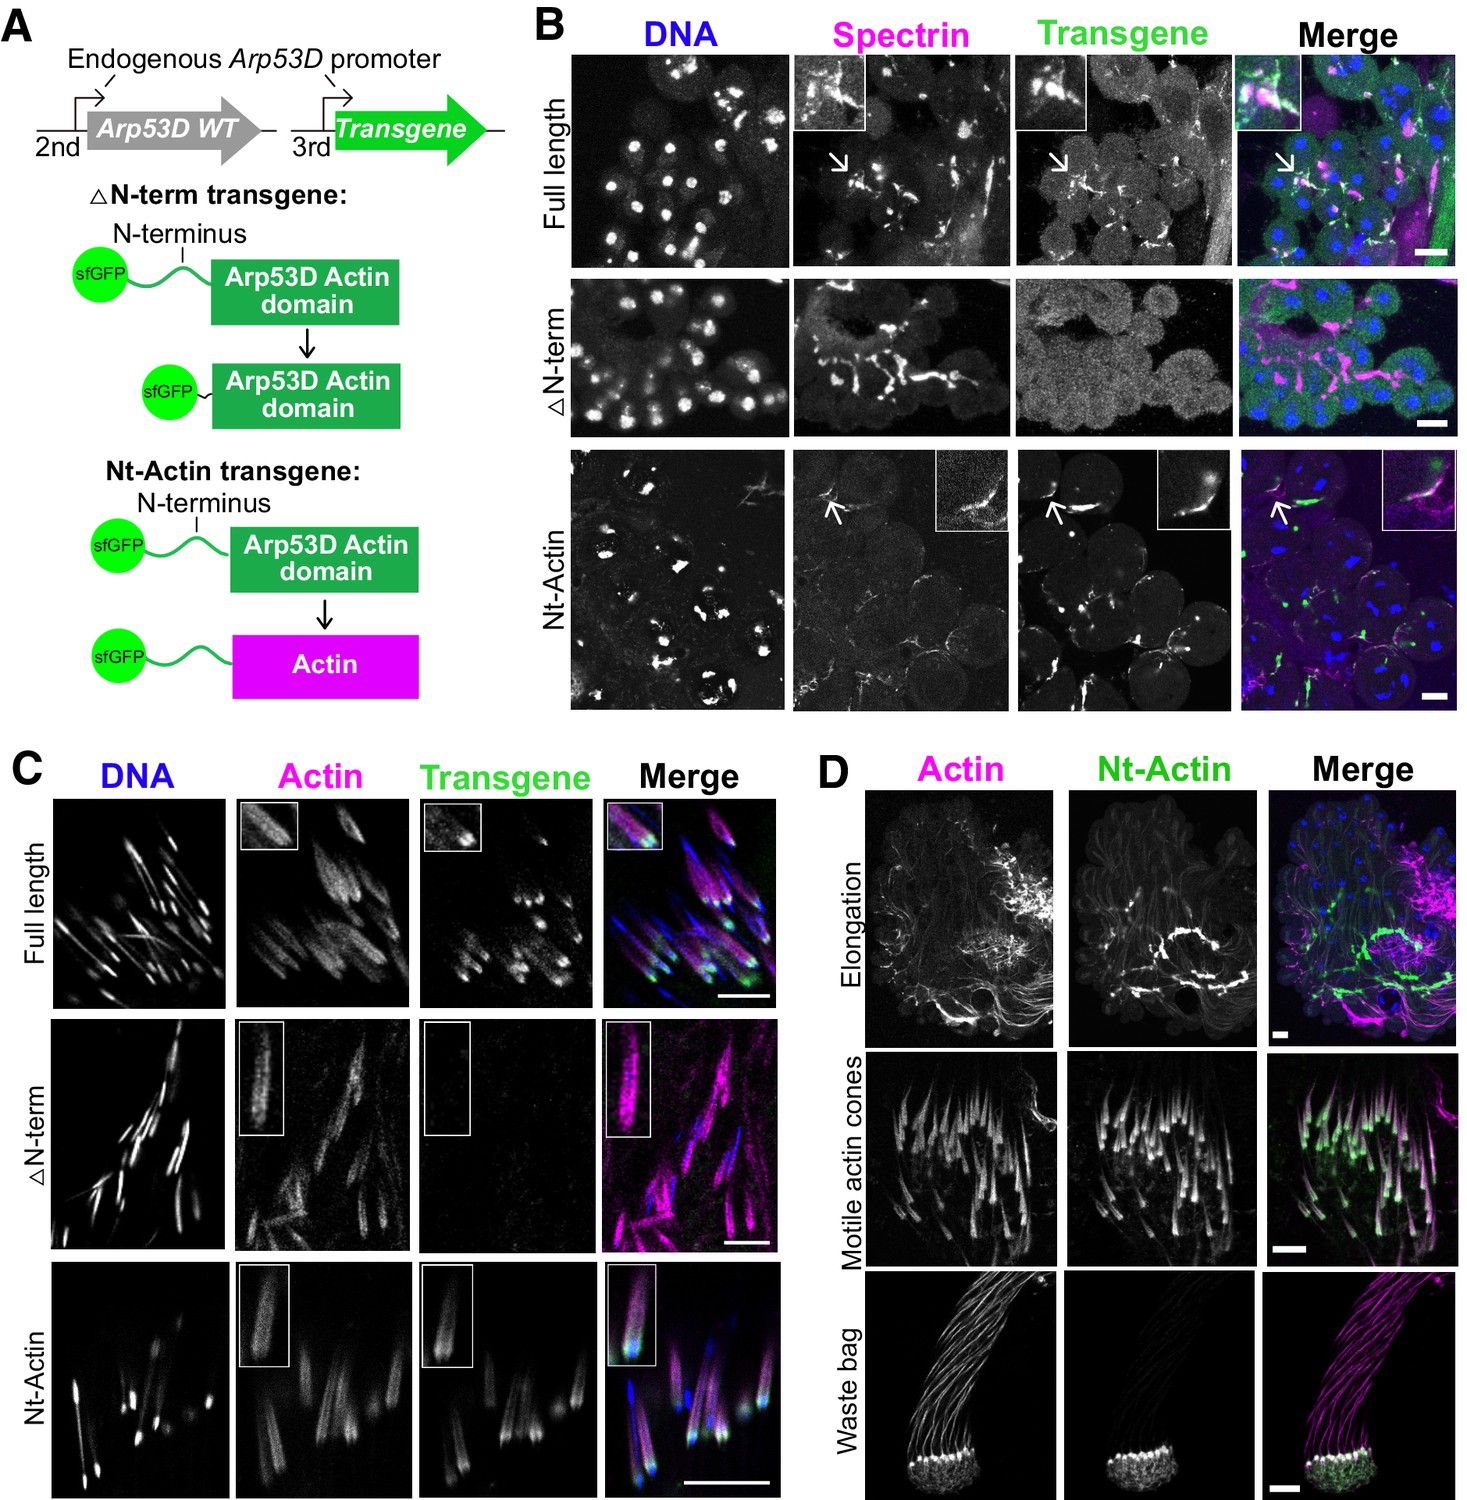
N-terminal domain of Arp53D is necessary and sufficient for localization.
(A) Two additional transgenic fly lines were generated with the transgene on the third chromosome in the wildtype background. In the ‘△N-term’ transgene, 35 aa of the N-terminus of Arp53D were removed and the remaining actin fold was N-terminally tagged with sfGFP. In the ‘Nt-Actin’ transgene, the actin domain of Arp53D was replaced with canonical actin (Act5C). Both transgenes are under the control of Arp53D’s endogenous promoter. (B) Cysts from transgenic fly testes were fixed and probed with anti-GFP (green), anti-α-spectrin (magenta), and Hoechst (blue). Cysts shown are in meiotic or post-meiotic stages and indicate that Arp53D without the N-terminus can no longer localize to the fusome (α-spectrin staining), yet the Nt-Actin chimera is sufficient for localization. Arrows correspond to the enlarged insets, and all scale bars are 10 µm. (C) Cysts undergoing individualization were imaged live, and filamentous actin (SiR-actin probe; Lukinavičius et al., 2014) and DNA were labeled. Only Nt-Actin can localize to the leading edge of actin cones. (D) Testes from the Nt-Actin transgenic fly line were dissected and imaged live. Similar to full-length sfGFP-Arp53D, sfGFP-Nt-Actin localizes to the fusome of elongating spermatids, motile actin cones (no longer co-localizing with mature sperm nuclei), and the waste bag. All scale bars are 10 µm.
Figure 4—figure supplement 1
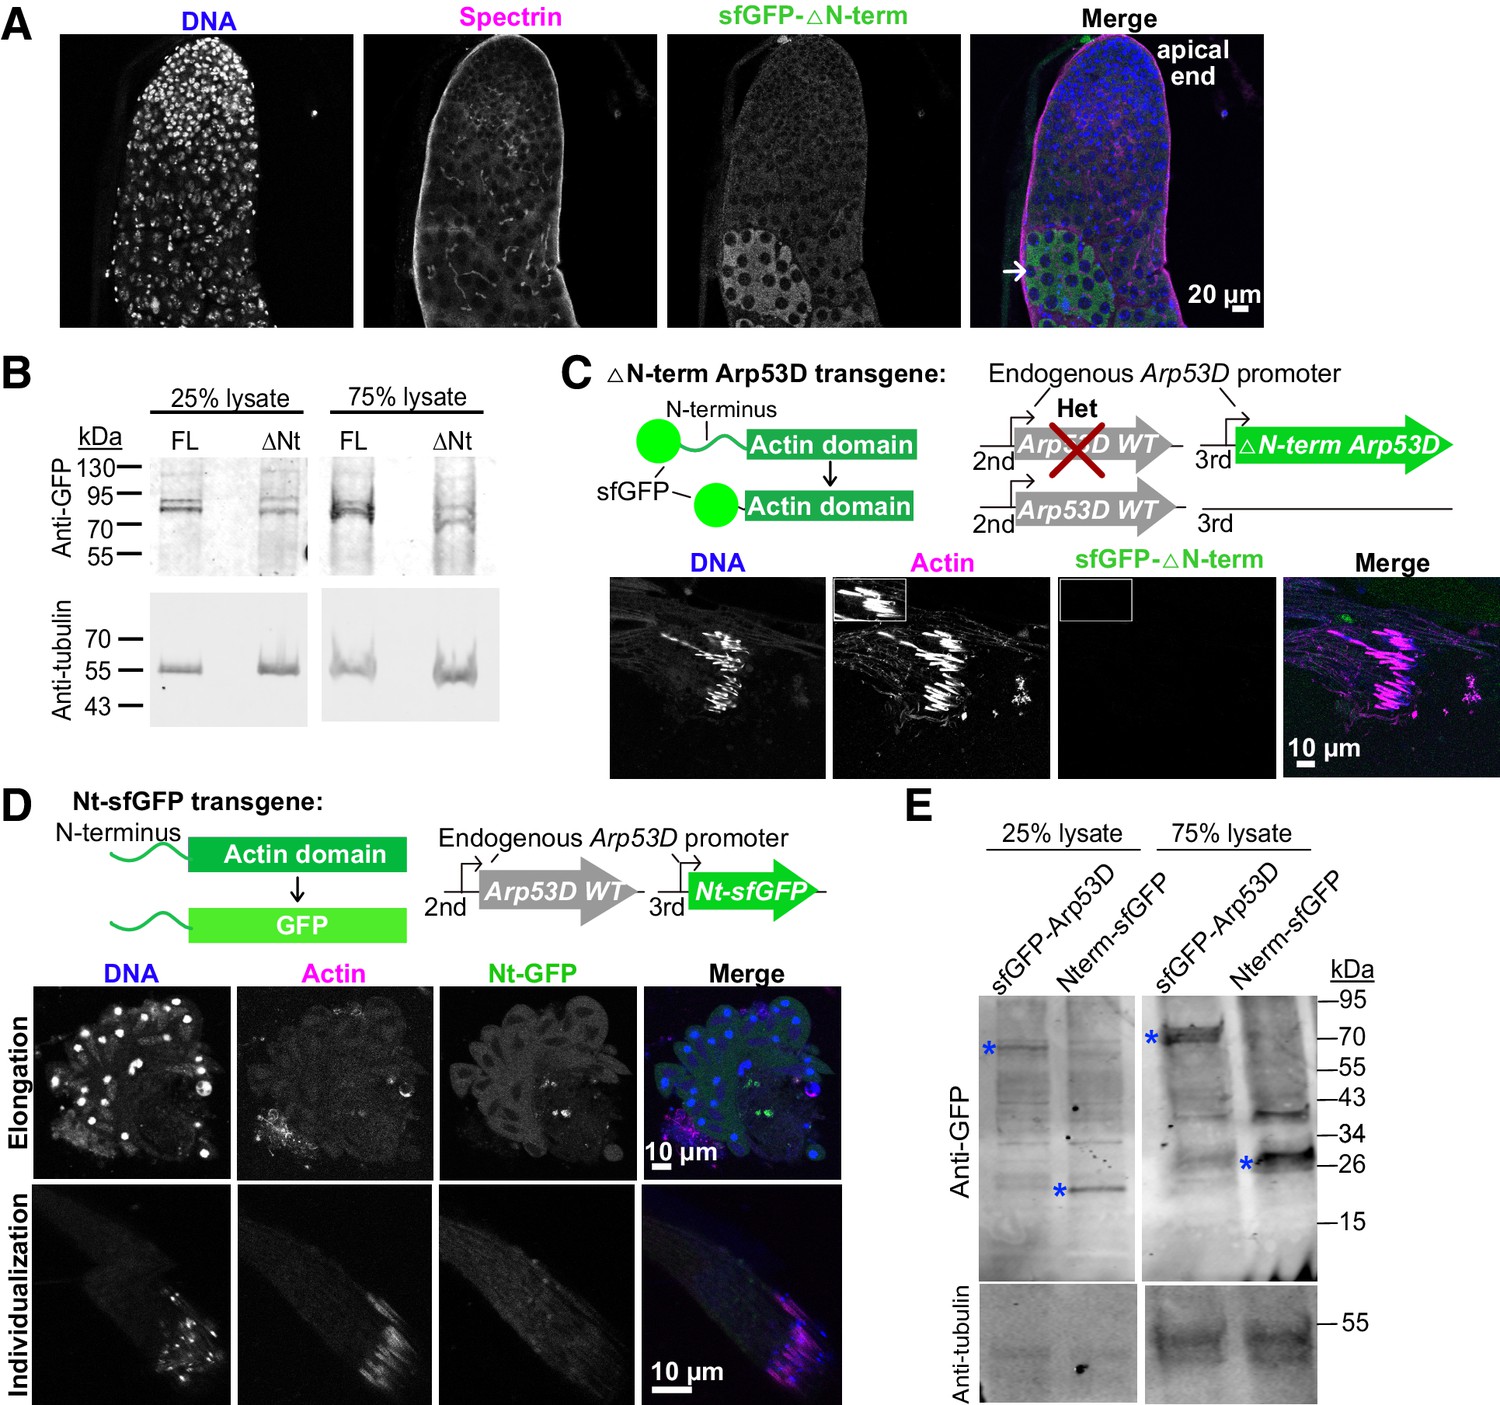
Chimeric proteins reveal Arp53D’s unique N-terminus is required for localization to germline actin structures.
(A) Whole testes expressing sfGFP-△N-term-Arp53D were dissected, fixed, and probed with anti-spectrin (magenta), anti-GFP (green), and DAPI (blue). GFP is first detected in meiosis (indicated by arrow) similar to full-length Arp53D (Figure 2—figure supplement 1A), indicating the transgene is expressed yet fails to localize to actin. (B) The expression of sfGFP-△N-term-Arp53D was compared to that of sfGFP-tagged full-length Arp53D by denaturing 15 pairs of dissected testes from each fly line and conducting SDS-PAGE analysis. Immunoblots were probed with anti-GFP and anti-tubulin (loading control). Amounts loaded are displayed as a percentage of total lysate. The expression of sfGFP-△N-term-Arp53D is slightly weaker than that of full-length Arp53D, and both proteins appear to exhibit some degradation (two bands present), though this may also be the result of post-translational modifications. (C) Flies homozygous for sfGFP-△N-term Arp53D on the third chromosome were crossed to Arp53D-KO flies to obtain males with only one endogenous copy of wildtype Arp53D on chromosome 2, to avoid competition between endogenous Arp53D and sfGFP-△N-term Arp53D for localization to actin cones. Testes were dissected and imaged live. SfGFP-△N-term Arp53D still did not localize to the leading edge of actin cones. (D) The actin domain of Arp53D was replaced with sfGFP, and the transgene (‘Nt-sfGFP’) was targeted to the third chromosome. Testes were dissected and imaged live with Hoechst (DNA, blue) and SiR-actin (Lukinavičius et al., 2014) (actin, magenta). No GFP signal co-localized with the fusome in elongating cells or to actin cones during individualization, showing that an actin fold domain is necessary for localization to male germline-specific actin structures. (E) The expression of Nt-sfGFP in (D) was compared to that of sfGFP-tagged full-length Arp53D as done in (B). Amounts loaded are displayed as a percentage of total lysate (25% or 75% of sample), and the bands corresponding to the proteins of interest are denoted with asterisks. The bands are brighter in the lanes with 75% lysate than 25% lysate as expected, and bands in the lanes with 75% lysate ran slightly higher due to the amount of lysate present. The samples were loaded on the same gel, but the image was cropped for easier visualization.
-
Figure 4—figure supplement 1—source data 1
Uncropped gel images corresponding to Figure 4—figure supplement 1B, E.
- https://cdn.elifesciences.org/articles/71279/elife-71279-fig4-figsupp1-data1-v1.pdf
Figure 5 with 2 supplements

Loss of Arp53D does not impair male fertility.
(A) Male fertility assays at 25°C and 29°C were conducted using wildtype (WT) females mated to either WT males or knockout (KO) males (all crosses are reported as female × male). All crosses were conducted in the D. melanogaster Oregon-R strain background, into which Arp53D-KO alleles were isogenized. Embryos were laid for 9 days and adult progeny were counted. KO males appeared more fertile than WT even when stressed at high temperature. For all graphs, the lines indicate the mean and standard deviation. Progeny genotypes are distinguished by color, and a t-test was used to determine all p-values that are reported. (B) For male competition assays, 10 WT females were mated to 2 WT males and 2 KO males at 25°C. Progeny of KO and WT males were identified with the presence or lack of DsRed fluorescence, respectively, and progeny genotypes are displayed as a percentage of the total population. More progeny were fathered by the KO males than the WT males. To test statistical significance, the number of progeny of each genotype was summed across the replicates and compared using a chi-squared test versus the expected 50:50 proportion (dotted line) if the competing males had equal fitness. (C) Testes from WT and Arp53D-KO virgin males that were aged 3 days at 29°C were dissected, fixed, and probed for actin. Cones and waste bags, which exhibit degrading actin cones, are noted. No gross differences were visible in the actin cones from Arp53D-KO testes. Scale bars are 80 µm. (D) The number of cysts with actin cones in each testis was quantified. More individualizing cysts were found in testes from KO compared to WT males, suggesting accelerated sperm development. (E) To test for rescue of Arp53D-KO phenotypes, WT Arp53D and 0.5 kbp of the upstream intergenic region (including its endogenous promoter) was inserted into the attP site of the Arp53D-KO alleles previously generated (see Figure 5—figure supplement 1A). The WT transgene was tracked with sfGFP under the control of an eye-specific promoter, while the KO allele was tracked with DsRed. (F) Rescue transgene-bearing male KO flies were crossed to WT Oregon-R females. Embryos were laid for 9 days, and the progeny count was compared to that from male KO flies without the transgene. The average progeny was slightly reduced but not to statistically significant levels.
Figure 5—figure supplement 1
Characterization of isogenized Arp53D-KO flies verifies CRISPR-Cas9 deletion.
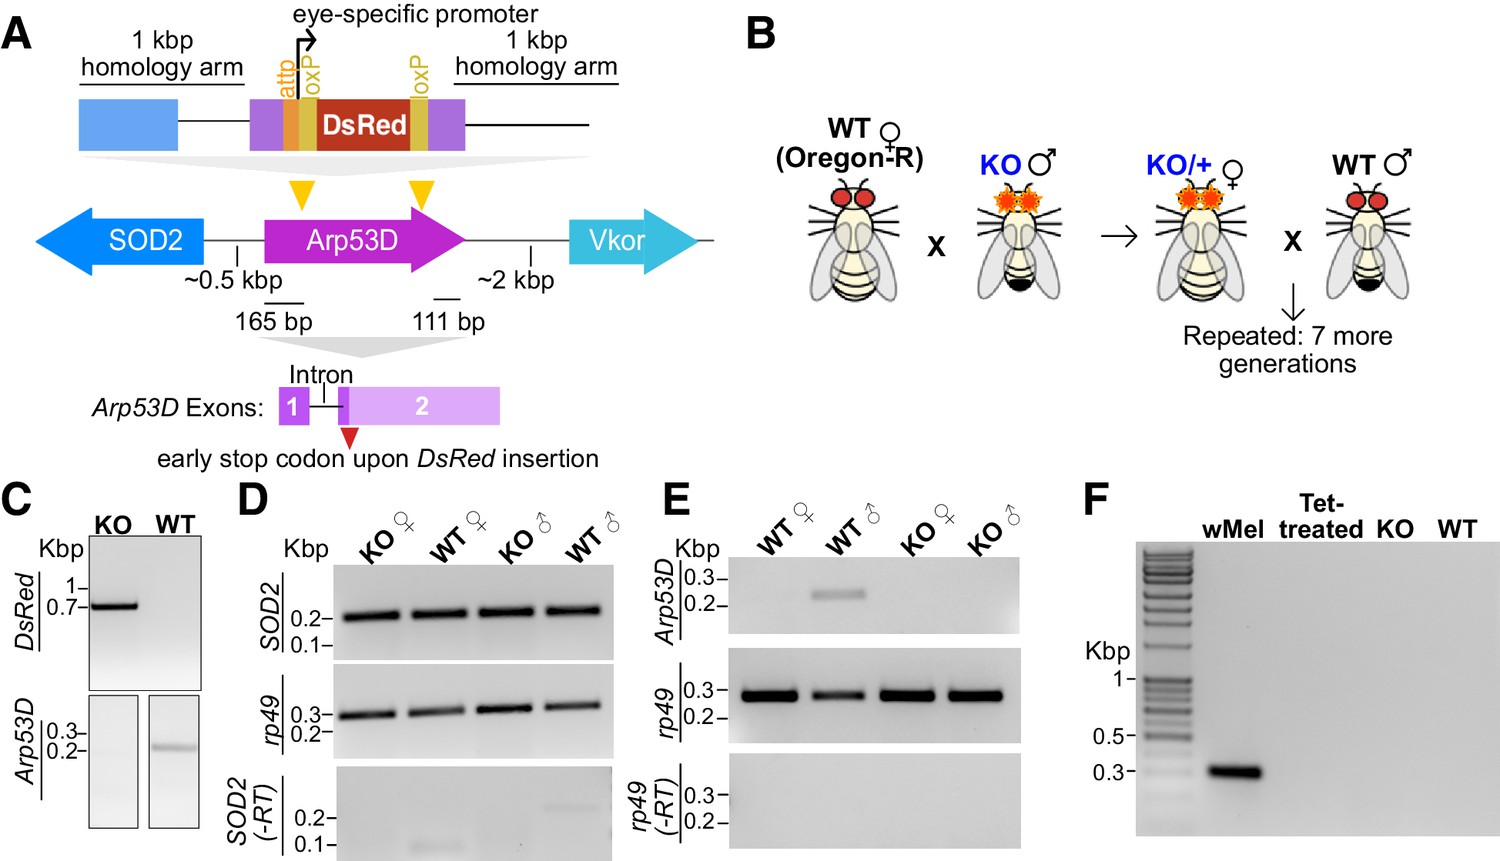
(A) The Arp53D gene was targeted using CRISPR/Cas9 with PAM sites internal to Arp53D. A gene encoding the fluorescent protein DsRed was knocked into the locus, creating an early stop codon. DsRed is under the control of an eye-specific promoter (3xP3) and is flanked by an attP site and loxP sites. The CRISPR/Cas9 cut sites yielded an early stop codon with only 37 aa of Arp53D remaining. (B) The Arp53D knockout (KO) was backcrossed to the wildtype (WT) Oregon-R D. melanogaster strain to isogenize the genetic background. Male KOs were crossed to female Oregon-R, and female progeny heterozygous for the KO allele were collected and crossed to Oregon-R males. Heterozygous females were selected because unlike males, meiotic recombination takes place and facilitates isogenization. Backcrosses were repeated for a total of eight generations, and then the KO allele was homozygosed. (C) To sequence-verify the Arp53D-KO genomic locus, a PCR was conducted with genomic DNA and primers upstream from Arp53D and within the gene encoding DsRed, yielding an ~700 bp product. The WT line used indicated no presence of DsRed in the Arp53D locus (‘DsRed,’ top row). A PCR with primers targeting the actin fold domain of Arp53D showed a band in the WT line and not the KO as expected (‘Arp53D,’ bottom row). (D) RNA was extracted from Oregon-R and isogenized Arp53D-KO female and male adults. RNA was reverse transcribed and RT-PCRs (25 cycles) were done to assess expression of the essential gene SOD2, which is upstream from Arp53D. Rp49 was used to compare amounts between samples, and template without reverse transcriptase was used to verify absence of genomic DNA. No difference in SOD2 expression was apparent between KO and WT flies. (E) RT-PCRs were done as in (D) to detect expression of Arp53D except with 30 cycles (25 cycles for rp49). Arp53D was only detected in whole males at this level of stringency (but see Figure 7—figure supplement 1A). (F) The Oregon-R and isogenized Arp53D-KO lines were tested for the presence of Wolbachia with primers targeting the ARM locus (Schneider et al., 2014). The KO, WT, and tetracycline-treated Bloomington Drosophila Stock Center (BDSC) line #145 (‘Tet-treated’) yielded no PCR product, thus indicating no Wolbachia presence in these flies, unlike Wolbachia-infected flies (‘wMel’), which yielded the expected 300 bp amplicon.
-
Figure 5—figure supplement 1—source data 1
Uncropped gel images corresponding to Figure 5—figure supplement 1C–E.
- https://cdn.elifesciences.org/articles/71279/elife-71279-fig5-figsupp1-data1-v1.pdf
-
Figure 5—figure supplement 1—source data 2
Uncropped gel image corresponding to Figure 5—figure supplement 1F.
- https://cdn.elifesciences.org/articles/71279/elife-71279-fig5-figsupp1-data2-v1.pdf
Figure 5—figure supplement 2
Analysis of Arp53D’s impact on male fertility.
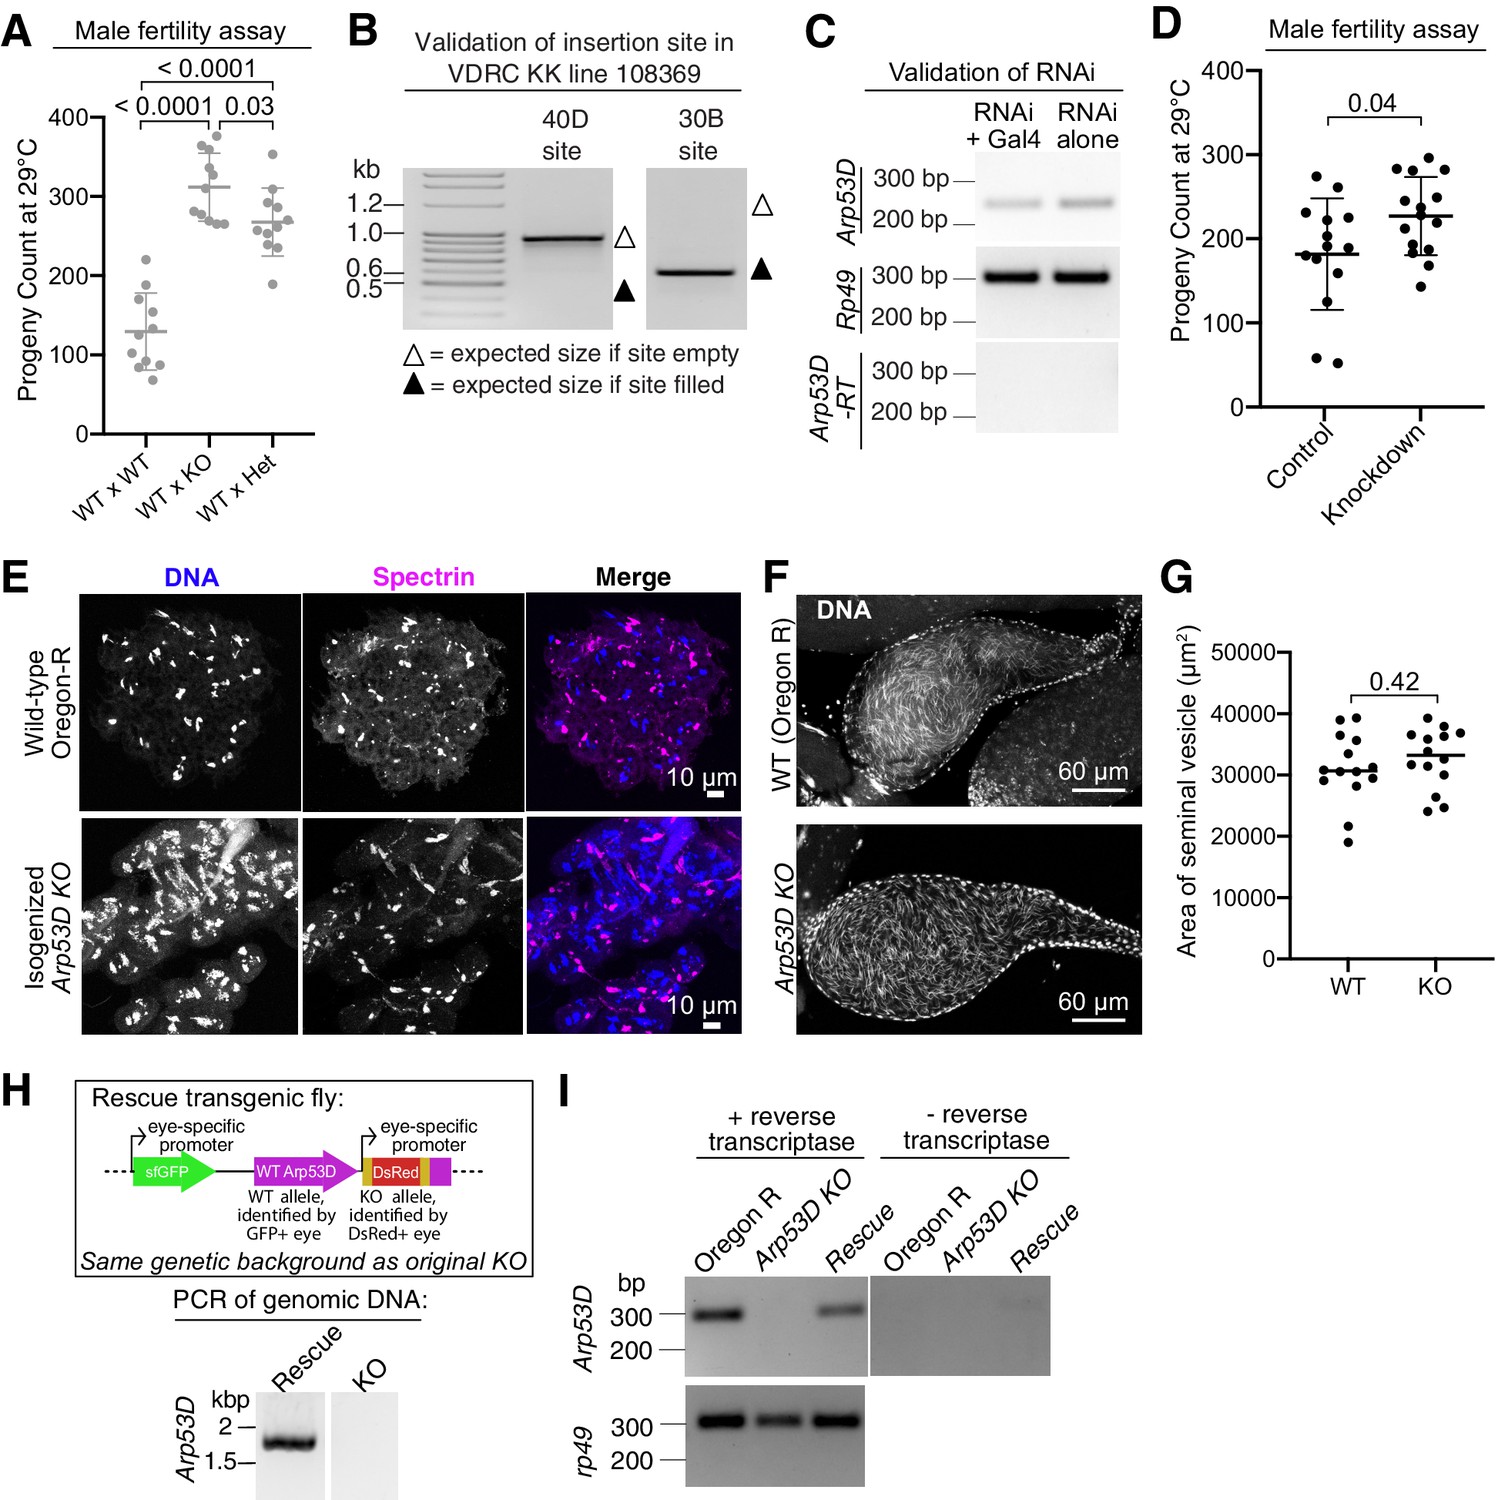
(A) A male fertility assay was conducted at 29°C using wildtype (WT) females crossed to WT, knockout (KO), or heterozygous (‘Het’) Arp53D KO males (eight females to two males) and adult progeny were counted. We find that homozygous male KOs have much higher fertility than WT males, and that heterozygotes have lower fertility than homozygous KOs. We conclude that the presence of WT Arp53D may have a dosage-dependent detrimental effect on male fertility. (B) Targeted sequencing of two possible integration sites (chromosomal sites 30B and 40D) of an RNAi hairpin in the VDRC RNAi KK stock (Dietzl et al., 2007) I.D. 108369. The 30B site is preferable as the 40D site gives non-specific phenotypes (Green et al., 2014). The actual and expected PCR product sizes with the diagnostic method used in Green et al., 2014 are denoted with triangles. The sizes of the PCR products indicate the RNAi hairpin integrated at the 30B site, whereas the 40D site is empty. (C) Flies encoding the RNAi hairpin targeting Arp53D (VDRC KK line 108369 in B) were crossed to flies encoding the RNAi inducer topi-Gal4 (Raychaudhuri et al., 2012), which is expressed late in spermatogenesis. Flies were maintained at 25°C. RNA was extracted from males encoding both the RNAi hairpin and topi-Gal4, and males encoding only the RNAi hairpin were used as a control. RNA was reverse transcribed, and RT-PCRs (25 cycles) were done to assess expression of Arp53D. Rp49 was used to compare amounts between samples, and template without reverse transcriptase was used to verify absence of genomic DNA. Arp53D expression is mildly reduced in the presence of the topi-Gal4 inducer. (D) A male fertility assay at 29°C comparing the Arp53D-knockdown male to a control male encoding only the RNAi hairpin. Mating and embryo laying took place over 9 days, and adult progeny were counted. Even partial knockdown of Arp53D leads to an increase in male fertility. (E) Meiotic cysts from Oregon-R and isogenized Arp53D-KO whole testes were dissected and stained with DAPI (DNA) and anti-spectrin (fusome). The fusome appears similar between the two genotypes. (F, G) WT and Arp53D-KO virgin males were aged 3 days at 29°C, and seminal vesicles were then dissected, fixed, and stained for DNA to compare the quantity of mature sperm between the two genotypes. The area of the seminal vesicle was measured; KOs appeared to have similarly sized seminal vesicles as WT, suggesting comparable amounts of mature sperm. (H) WT Arp53D and 0.5 kbp of the upstream intergenic region (including its endogenous promoter) was inserted into the attP site of the Arp53D-KOs previously generated (see Figure 5—figure supplement 1A). This rescue transgene was tracked with sfGFP under the control of an eye-specific promoter. Presence of the Arp53D transgene was verified by PCR as shown in the DNA gel below the schematic (‘Rescue’), whereas the transgene was absent in the original Arp53D-KO. The PCR product was sequence verified. (I) RT-PCRs with primers targeting Arp53D were conducted with RNA extracted from testes of WT (Oregon-R) flies, Arp53D-KOs, and the modified Arp53D-KOs encoding the Arp53D rescue transgene (‘Rescue’). KOs show no expression of Arp53D, whereas the Arp53D transgene is expressed in ‘Rescue,’ albeit more weakly compared to endogenous Arp53D in Oregon-R flies. RT-PCRs with primers targeting rp49 indicate comparable amounts of cDNA among the genotypes. Samples not treated with reverse transcriptase exhibit no bands, indicating lack of genomic DNA contamination during RNA extraction.
-
Figure 5—figure supplement 2—source data 1
Uncropped gel images corresponding to Figure 5—figure supplement 2B, C.
- https://cdn.elifesciences.org/articles/71279/elife-71279-fig5-figsupp2-data1-v1.pdf
-
Figure 5—figure supplement 2—source data 2
Uncropped gel images corresponding to Figure 5—figure supplement 2H, I.
- https://cdn.elifesciences.org/articles/71279/elife-71279-fig5-figsupp2-data2-v1.pdf
Figure 6 with 1 supplement
Loss of Arp53D results in an overall fitness disadvantage.
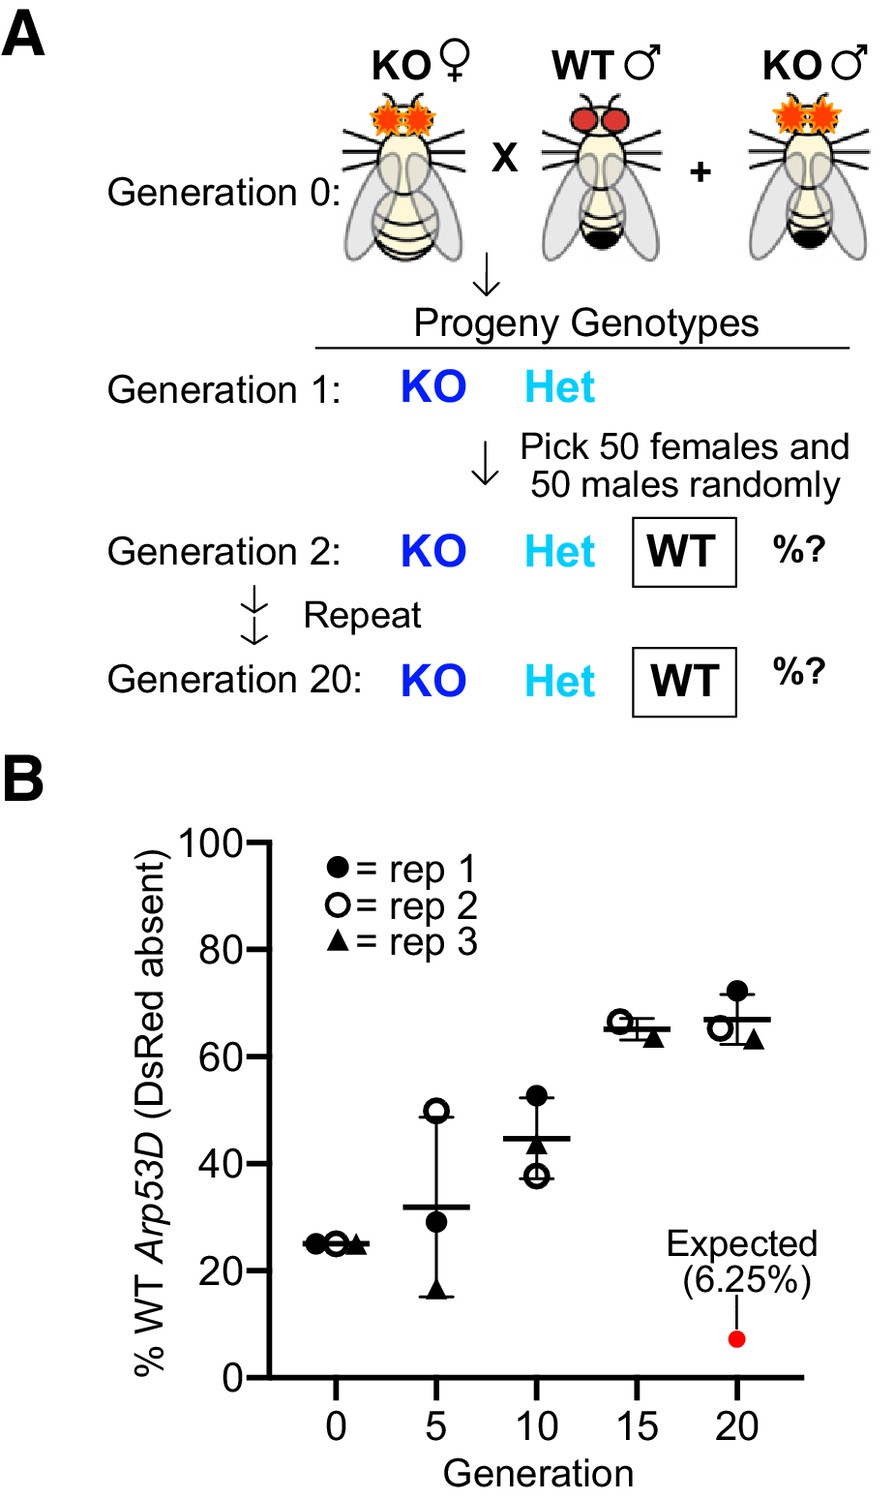
(A) Arp53D-KOs were isogenized in the w1118 background. A population cage experiment was initiated by mixing 50 Arp53D-KO females with 25 Arp53D-KO males, and 25 wildtype (WT) (w1118) males in each of three replicate bottles. All subsequent generations were passaged by randomly selecting 50 male and 50 female progeny from the previous generation and placing them in a new bottle at room temperature. (B) All progeny at selected generations were assessed for the presence of DsRed-fluorescent eyes, the marker for the Arp53D-KO allele. The graph displays the percent of each generation’s total population that were homozygous for the WT allele (entirely lacking DsRed fluorescence); replicates are distinguished by icons with different shapes and color. The red dot indicates the expected percentage of homozygous WT progeny over time if no fitness advantage is associated with WT Arp53D (according to Hardy–Weinberg equilibrium). In contrast to this expectation, homozygous WT Arp53D flies overtook the majority of the population in all three replicate populations, demonstrating Arp53D confers a strong fitness advantage to D. melanogaster. WT: wildtype.
Figure 6—figure supplement 1
Modeling of the population cage experiment estimates the fitness disadvantage upon loss of Arp53D.
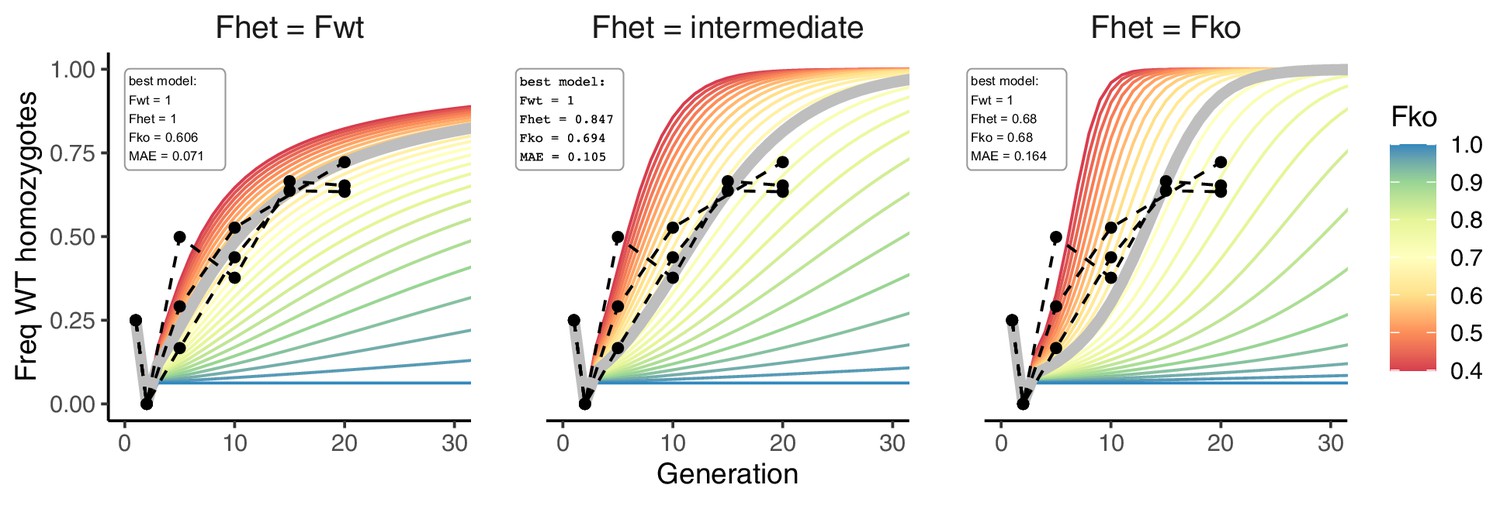
In order to estimate the magnitude of the fitness difference, we performed in silico simulations (see Materials and methods), assigning Arp53D-KO homozygotes a range of fitness coefficients (FKO) of 0.4–1 relative to wildtype (WT)-homozygotes (FWT = 1) (colored lines, scale at right). This modeling is an oversimplification of real biology as it ignores the differential effects of genotype upon fathers, mothers, and zygotes. We modeled heterozygote fitness (Fhet) in three ways: with the Arp53D-KO as completely recessive (left, Fhet = FWT), as co-dominant with fitness exactly intermediate between that of the two homozygotes (center, Fhet = (FWT + FKO)/2), or as dominant (right, Fhet = FKO). We calculated the fit of each model to real data (shown in black) using the mean absolute deviation (MAE), and for each way of modeling heterozygotes we show the best fitting model (lowest MAE) as a thick gray line, with coefficients shown in inset boxes. Overall, the model that best fits the data is one where the Arp53D-KO allele is recessive (left, Fhet = FWT) with an estimated fitness coefficient for KO knockout (homozygotes) (FKO) of 0.606 (i.e., fitness of Arp53D-KO homozygotes is only 61% that of WT homozygotes).
Figure 7 with 1 supplement
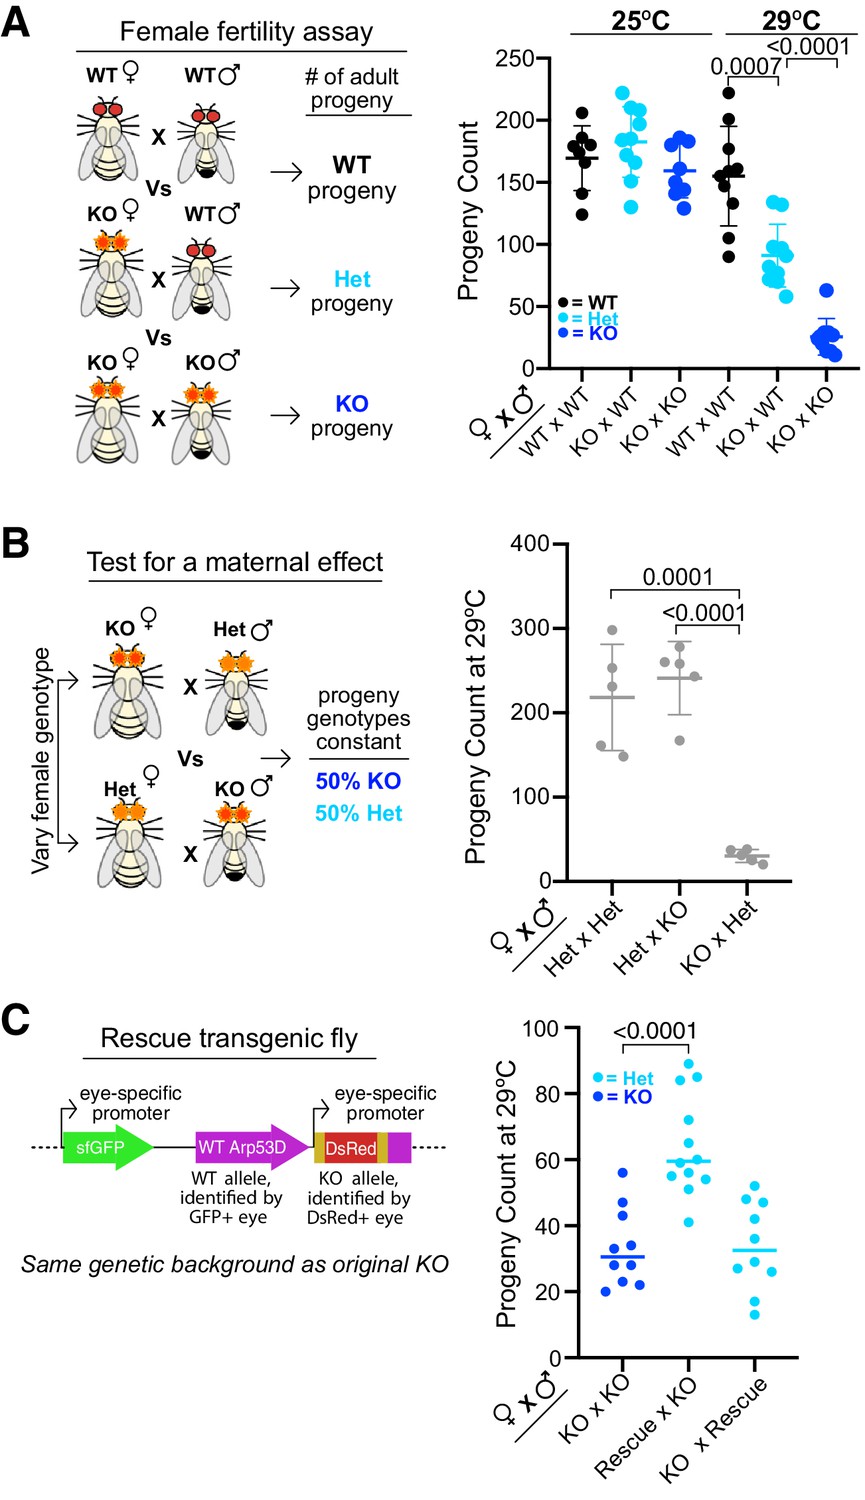
Maternal contribution of Arp53D is required for optimal fitness.
(A) Female fertility assays at 25°C and 29°C were conducted with knockout (KO) females mated to either wildtype (WT) males or KO males. Matings took place for 9 days, and all resulting adult progeny were counted. KO females have fewer progeny at high temperature, especially when a KO male is present. A t-test was used to determine all p-values. (B) To test for a maternal effect, Arp53D-KO females were crossed to heterozygous (HET) males, whereas HET females were crossed to KO males in reciprocal crosses, which yield progeny with the same genotypes. The total adult progeny counts for each cross are shown. Crosses between KO females and HET males exhibit a considerably lower progeny count compared to the reciprocal cross between HET females and KO males (<0.0001), suggesting that the KO females exhibit a maternal effect. (C) KO males were crossed to either KO females or KO females encoding the homozygous Arp53D rescue transgene (‘Rescue’), which was identified via GFP-positive eyes (see schematic). In addition, rescue transgene-bearing male KO flies were crossed to KO females. Matings took place for 6 days, and all resulting adult progeny were counted. KO females expressing a rescue transgene had more progeny than KO females, indicating a rescue of the fertility phenotype. However, KO rescue males did not exhibit an increase in progeny count when crossed to KO females, suggesting that Arp53D is predominantly playing a maternal role.
Figure 7—figure supplement 1
Arp53D plays maternal roles.
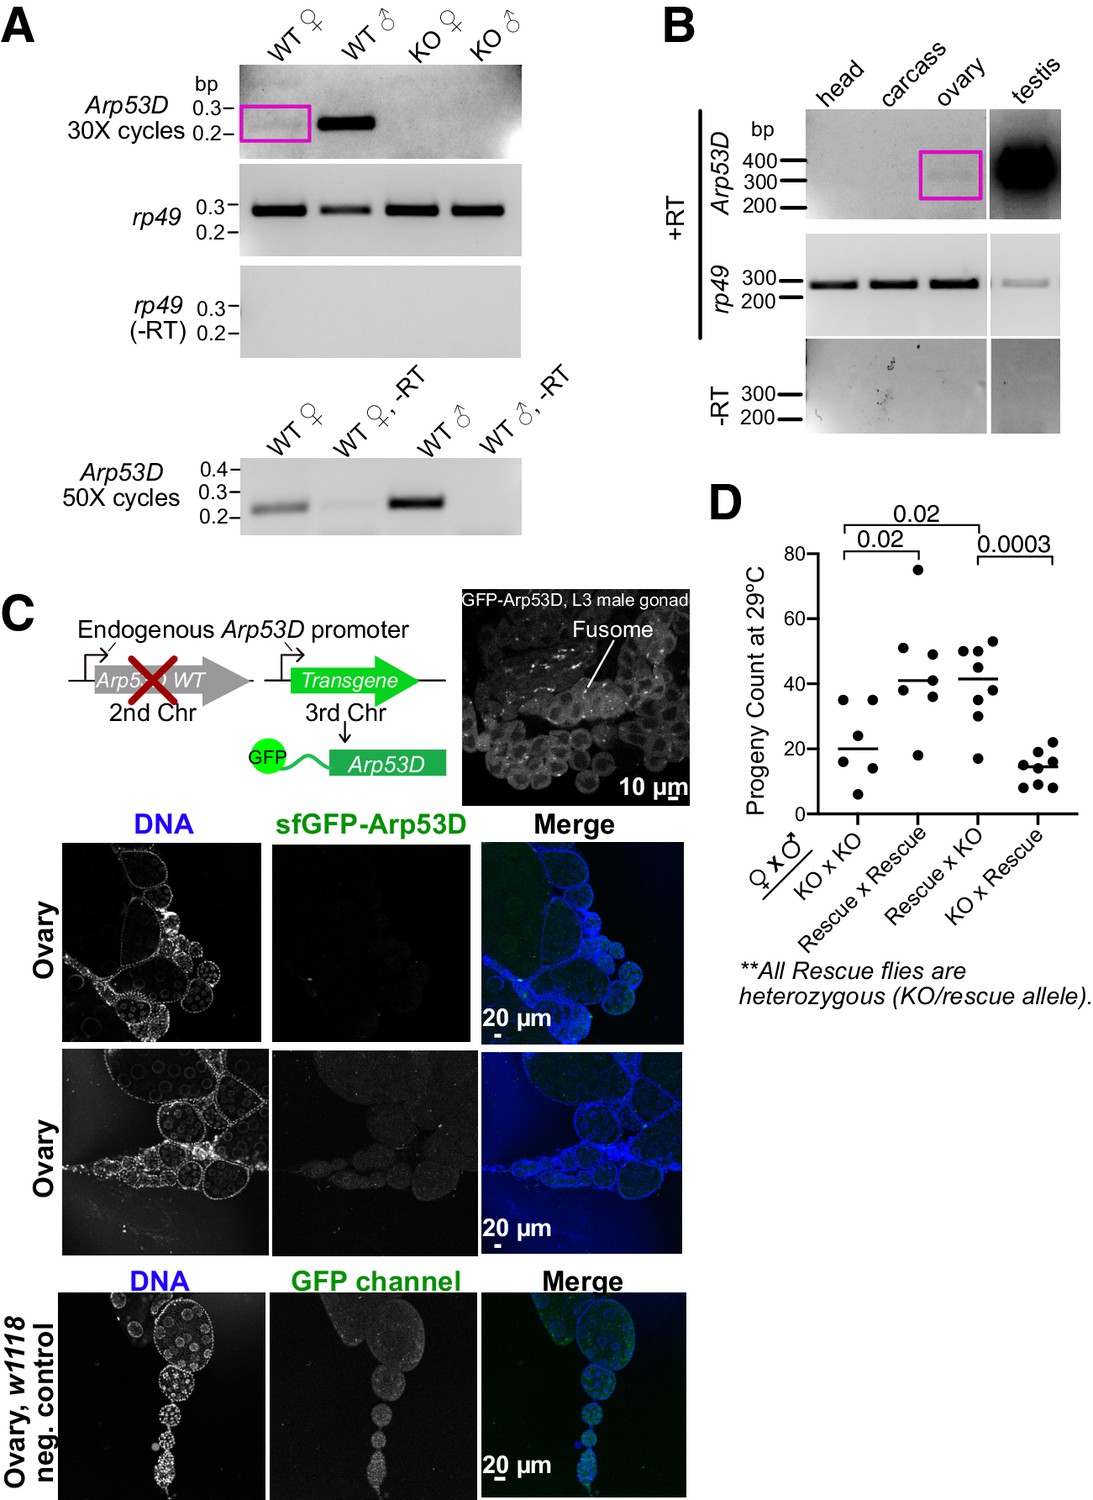
(A) The same RT-PCRs are shown as in Figure 5—figure supplement 1E except the image was acquired with a longer exposure and a faint band indicating Arp53D expression was detected in the wildtype (WT) female sample at much lower amounts than the WT male. Expression was absent in knockout (KO) females. Using the same cDNA samples, RT-PCRs were conducted with 50 cycles to amplify signal. The product was sequence-verified as Arp53D. (B) Virgin WT (Oregon-R) females were aged for 1 day at 29°C and then dissected. RT-PCR analyses of the head, ovary, and remaining carcass indicate expression of Arp53D specifically in the ovary, which is notably lower than the expression in testes. Samples that were not treated with reverse transcriptase (RT) show no genomic DNA contamination, and rp49 detection indicates relative levels of cDNA among the samples. Lanes in between the testis and female tissues were removed for clarity, but image exposure was treated equally for all lanes. (C) Adult ovaries encoding sfGFP-Arp53D in Arp53D-KOs were dissected and imaged live. DNA was visualized with Hoecsht. No GFP signal was visible. The male gonad from an L3 larva was imaged as a positive control and showed concentrated GFP signal at the fusome. Ovaries from the w1118 strain were also dissected and visualized with the same image-acquisition parameters. This negative control exhibits the same level of GFP autofluorescence as the ovary from flies expressing sfGFP-Arp53D. (D) Arp53D-KO flies that were heterozygous for the Arp53D rescue transgene (‘Rescue’) were crossed to each other or KO females or males to compare to the fertility of homozygous KOs. Even with only one copy of WT Arp53D, rescue females had significantly higher fertility than KOs (Rescue × KO versus KO × KO, p=0.02) and resulted in progeny counts that were comparable to rescue females crossed to rescue males (Rescue × Rescue, p=0.02). However, heterozygous ‘rescue’ males did not affect fertility relative to KOs.
-
Figure 7—figure supplement 1—source data 1
Uncropped gel images corresponding to Figure 7—figure supplement 1A.
The uncropped gel image corresponding to the rp49 control can be found in Figure 5—figure supplement 1—source data 1.
- https://cdn.elifesciences.org/articles/71279/elife-71279-fig7-figsupp1-data1-v1.pdf
-
Figure 7—figure supplement 1—source data 2
Uncropped gel images corresponding to Figure 7—figure supplement 1B.
- https://cdn.elifesciences.org/articles/71279/elife-71279-fig7-figsupp1-data2-v1.pdf
Figure 8 with 1 supplement

A zygotic fitness effect of Arp53D is masked by maternal contributions.
(A) To assess Arp53D’s zygotic requirements for fitness, we quantified progeny produced from the reciprocal crosses in Figure 7B as a percentage of the total population. Homozygous knockout (KO) progeny were reliably distinguished from heterozygous (HET) progeny by intensity of DsRed fluorescence. Progeny fractions obtained were compared to 50:50 Mendelian expectation using a chi-squared test, and p-values are reported. KO progeny comprise a significantly lower proportion than the expected 50% of the population. (B) To determine if KO progeny are only at a disadvantage when the mother lacks Arp53D, HET females were crossed to HET males, and progeny genotypes were quantified and compared to Mendelian expectations of 25:50:25. KO progeny were present at nearly 25% of the population, indicating that KO progeny have no significant fitness disadvantage when the mother has one copy of Arp53D (p-values from a chi-squared test indicate deviation from Mendelian expectation and are not significant). (C) A model for Arp53D’s role in fitness (as assessed by adult progeny counts) under heat stress. For optimal fitness, Arp53D must be contributed maternally or via zygotic transcription of the paternal Arp53D wildtype (WT) allele. Maternal contribution is most critical, while zygotic transcription alone only leads to partial rescue.
Figure 8—figure supplement 1
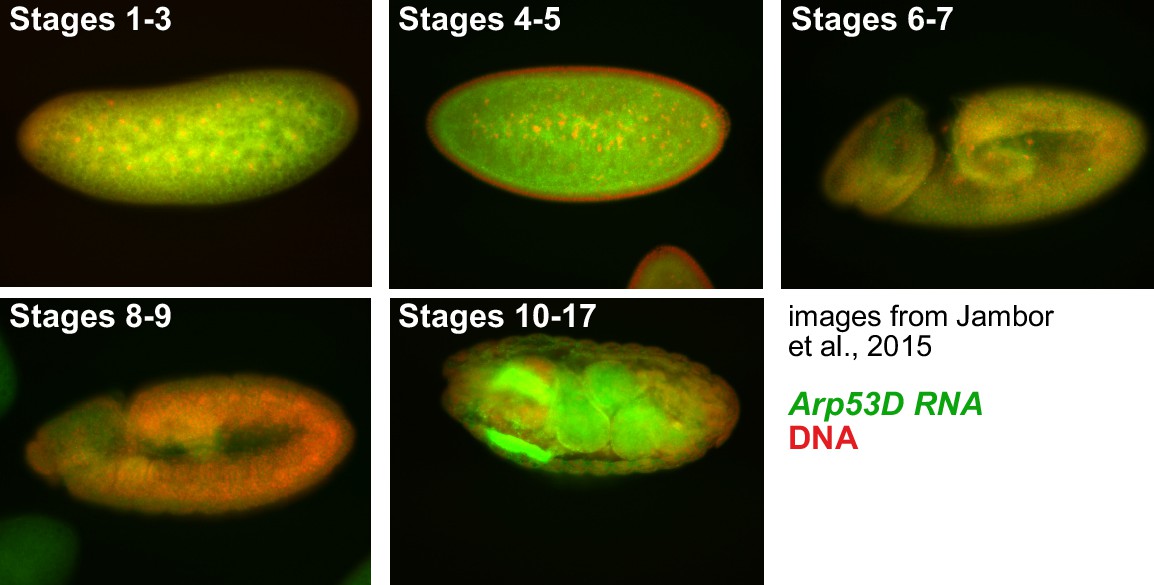
Arp53D is expressed in embryos.
Arp53D RNA was visualized in situ in embryos at different stages of development by a previous study (Jambor et al., 2015). The images were obtained from http://tomancak-srv1.mpi-cbg.de/DOT/main.html and display Arp53D in green and DNA in red.
Figure 9 with 1 supplement
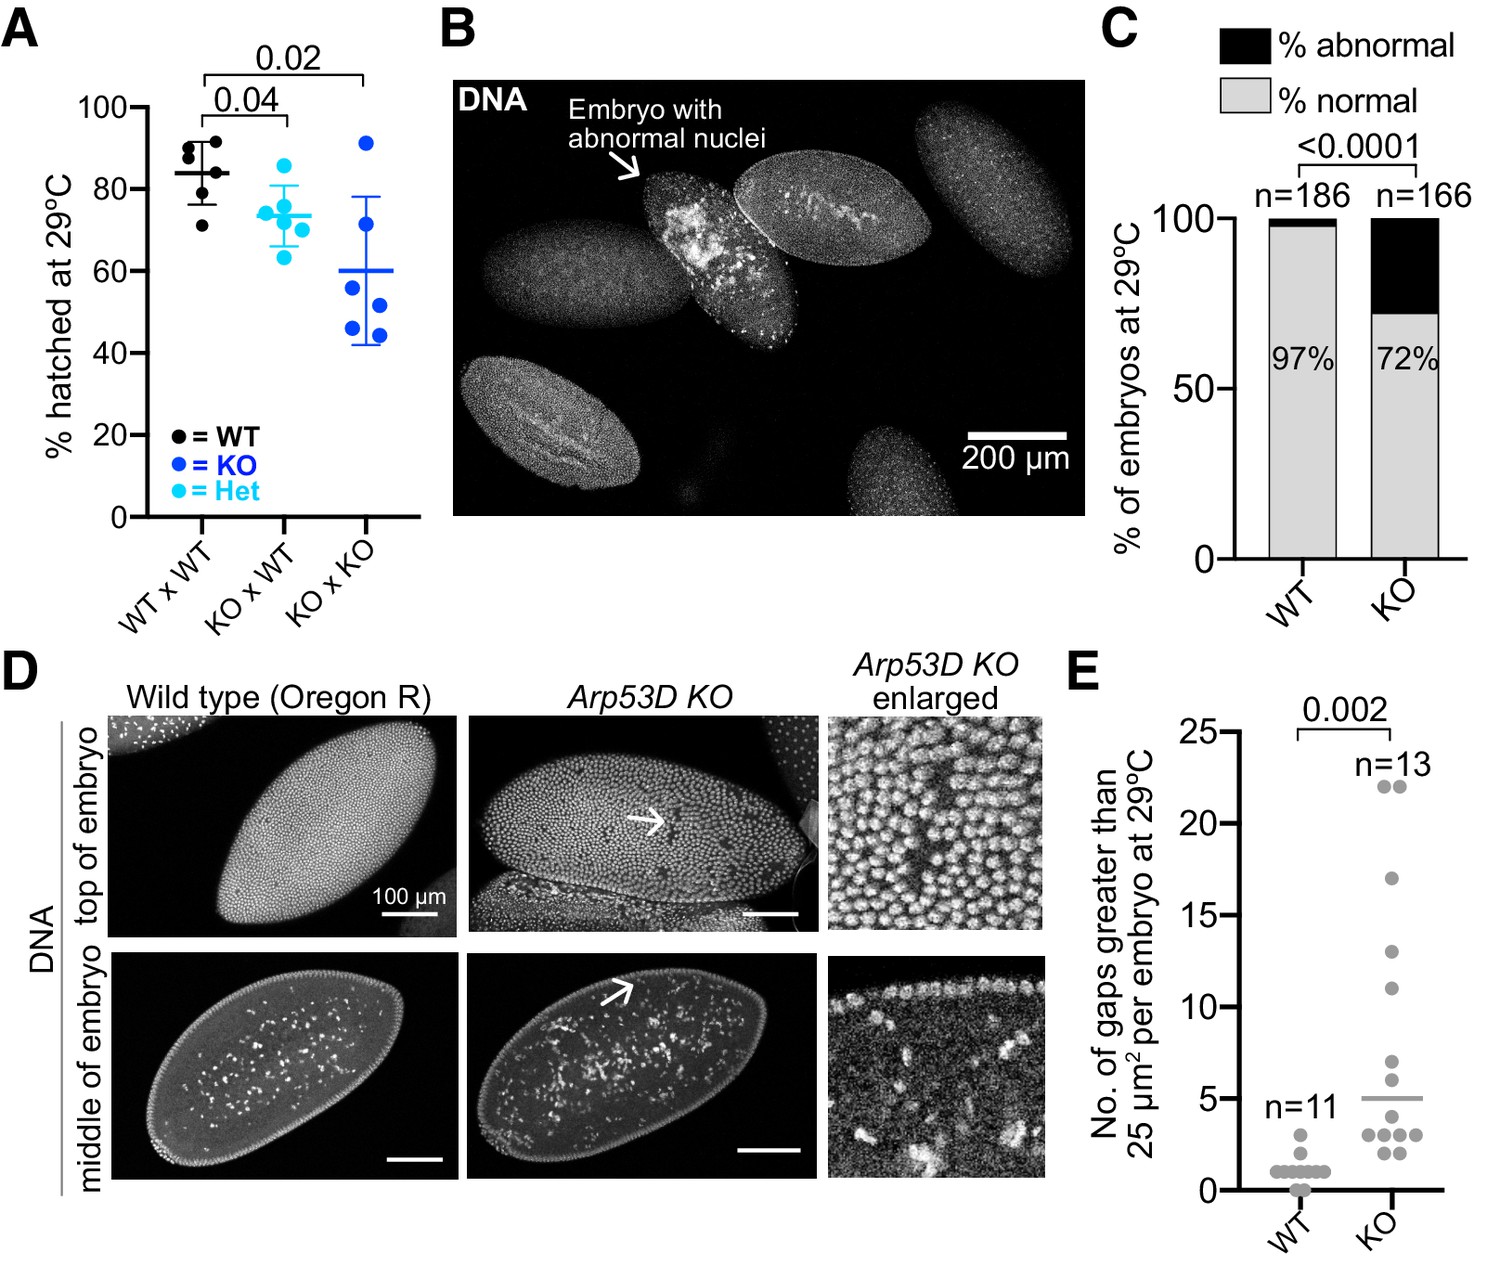
Loss of Arp53D impairs early embryonic development.
(A) Knockout (KO) females were crossed to wildtype (WT) or KO males and allowed to lay for 2 hr at 29°C, and all resulting embryos were counted. Hatched embryos were then quantified 24 hr later and are displayed as a percentage of total embryos laid the previous day. KO females lead to reduced embryonic viability relative to WT females (p=0.04, 0.02). (B, C) After a 2 hr lay at 29°C, embryos were collected from WT Oregon-R, Arp53D-KOs, and Arp53D-KOs encoding the rescue Arp53D transgene. Embryos were fixed, stained for DNA, and assessed for abnormal nuclei. In the representative image of WT Oregon-R embryos, only one (arrow) exhibits disorganized and aggregated nuclei. However, Arp53D-KO embryos exhibited more abnormal nuclei than WT, which correlates with their reduced viability. The number of embryos quantified is denoted above each genotype. (D) The embryos in (B, C) that were at approximately cycles 13–14 of embryogenesis (Kotadia et al., 2010) were assessed for ‘nuclear fallout,’ which results in visibly large gaps in the embryo’s epithelium and an increase in damaged nuclei in the middle of the embryo. The enlarged images in the third column (‘Arp53D KO enlarged’) correspond to the arrows in the Arp53D KO images in the second column. (E) Gaps were measured in WT and Arp53D-KO embryo epithelia represented in (D). The number of gaps larger than 25 µm2 is significantly higher in KO embryos at 29°C.
Figure 9—figure supplement 1
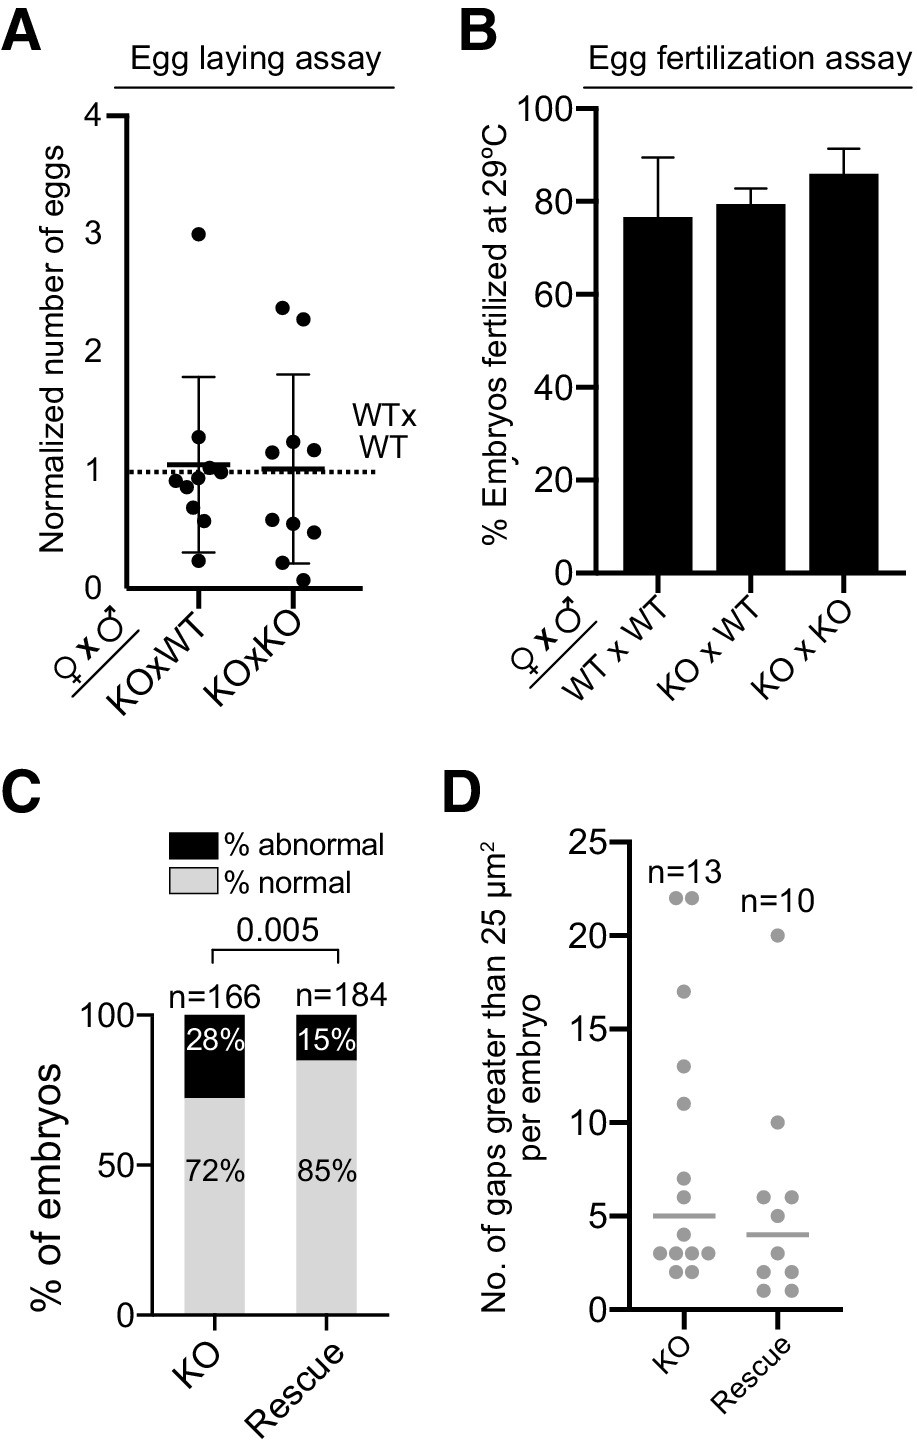
Arp53D plays roles in embryonic development and not fertilization.
(A) Wildtype (WT) × WT, knockout (KO) × WT, and KO × KO were allowed to lay for the same amount of time (overnight or for 2 hr) at 29°C, and the number of eggs laid was quantified and normalized to WT × WT. KO flies laid a similar number of eggs despite lack of Arp53D. All data is shown as an average of the ratios across different laying periods (10 in total). The ratio of 1 for WT × WT is indicated by a dotted line. For overnight lays, at least 100 embryos were laid in each cross, and for 2 hr lays, 30–50 embryos were laid. (B) The same crosses in (B) were allowed to lay eggs for 2 hr at 29°C and imaged with brightfield microscopy to assess cellularization, which marks the beginning of embryogenesis and which we use as an indicator of successful fertilization. Approximately 35–55 eggs were quantified for each cross and averaged among two experiments. The mean proportions of eggs fertilized are shown and do not significantly differ among the crosses. (C) After a 2 hr lay at 29°C, embryos were collected from Arp53D-KO flies and Arp53D-KO flies encoding the Arp53D rescue transgene. Embryos were then fixed, stained for DNA, and assessed for abnormal nuclei. The number of normal and abnormal nuclei was quantified per genotype; Arp53D-KO embryos exhibited more abnormal nuclei than Arp53D-KOs encoding the Arp53D rescue transgene (p=0.005). The number of embryos quantified is denoted above each genotype; the quantification for KOs is the same as that shown in Figure 9C. (D) Embryos at approximately cycles 13–14 of embryogenesis were assessed for nuclear fallout, which results in visibly large gaps in the embryo’s epithelium. Gaps were measured in the epithelia of Arp53D-KO embryos and Arp53D-KO embryos encoding the Arp53D rescue transgene. The number of gaps larger than 25 µm2 is slightly higher in KO embryos though this difference is statistically insignificant. The number of embryos quantified is denoted above each genotype; the quantification for KOs is the same as that shown in Figure 9E.
Tables
Table 1
Arp53D orthologs used in phylogenetic analysis.
| Species | NCBI Accession or Flybase (Thurmond et al., 2019) gene name |
|---|---|
| D. melanogaster | FBgn0011743 |
| D. simulans | XM_016168248.1 |
| D. sechellia | XM_032716929.1 |
| D. erecta | FBgn0112814 |
| D. yakuba | FBgn0229606 |
| D. eugracilis | XM_017223499.1 |
| D. takahashii | XM_017160173.1 |
| D. ficusphila | XM_017189170.1 |
| D. ananassae | XM_001960587.3_modified* |
| S. lebanonensis | XM_030513294.1 |
| D. busckii | XM_017981926.1 |
| D. mojavensis | XM_002006572.3 |
| D. virilis | FBgn0208134 |
| D. grimshawi | XM_001995276.2_modified* |
| D. willistoni | FBgn0217915 |
| D. pseudoobscura | FBgn0078861 |
| D. persimilis | XM_002026570.2 |
| D. miranda | XM_033397705.1 |
-
*Some NCBI gene models were incomplete and were corrected using the BLAT tool (Kent, 2002) in UCSC’s genome browser (http://genome.ucsc.edu).
Table 2
RNA-seq databases analyzed.
Table 3
Primers used in this study.
| Purpose | Primer 1’s sequence | Primer 2’s sequence |
|---|---|---|
| Sequencing Arp53-KO locus | ACCTTCCCGAATCAAAATCGA | TTCACGTACACCTTGGAGCC |
| Sequencing WT Arp53D locus | AGATACTCCCCGTGCTGTCT | GCAAATCCATTGGATCCGCC |
| Testing presence of Wolbachia (Schneider et al., 2014) | TTCGCCAATCTGCAGATTAAA | GTTTTAAACGCTTGACAA |
| Sequencing SOD2 | CTTCAGATCATCGCTGGGCT | TGAAGAATGTTCTGTGCCCGT |
| RT-PCR of SOD2 | TGGAGCTGCATCACCAGAAG | TCTTGTTGGGCGAGAGGTTC |
| RT-PCR of Arp53D (Fig. S4E) | ACCTTCCCGAATCAAAATCGA | GCGGCGTGGTGTGAATTAC |
| RT-PCR of Arp53D (Supp. Fig. S7B) | CAAAATCGATATAACAAATAAAC GGGCACAGAACATTCTTCAC | GATACTTTAGGGTTAGTATT CCCCTTTTTCGGGC |
Table 4
Imaging reagents.
| Antibody or chemical | Company | Purpose | Dilution |
|---|---|---|---|
| Anti-GFP (chicken) | Abcam (13970), RRID:AB_300798 | Western blot | 1:2000 |
| Immunofluorescence | 1:500 | ||
| Anti-tubulin (rabbit) | Abcam (6046), RRID:AB_2210370 | Western blot | 1:500 |
| Immunofluorescence | 1:200 | ||
| Anti-α-spectrin | Developmental Studies Hybridoma Bank (AB_528473), RRID:AB_528473 | Immunofluorescence | 1:50 |
| Anti-phospho-Histone H3 (Ser10) | Millipore (Upstate Brand), RRID:AB_310177 | Immunofluorescence | 1:1000 |
| Anti-calmodulin (rabbit) | Gift from Kathleen Beckingham and Leslie Vosshall | Immunofluorescence | 1:50 |
| Anti-mouse Cy3 or Cy5 | Invitrogen | Immunofluorescence | 1:2000 |
| Anti-rabbit Cy3 or Cy5 | Invitrogen | Immunofluorescence | 1:2000 |
| Anti-chicken 488 | Invitrogen | Immunofluorescence | 1:2000 |
| Anti-chicken 680 | LI-COR, RRID:AB_1850018 | Western blot | 1:2500 |
| Anti-rabbit 800 | LI-COR | Western blot | 1:2500 |
| Phalloidin Cy3 | Thermo Fisher | Immunofluorescence | 1:40 |
| Phalloidin Cy5 | Thermo Fisher | Immunofluorescence | 1:40 |
| SiR-actin (Lukinavičius et al., 2014) | Cytoskeleton, Inc | Live imaging | 10 µM |
Table 5
D. melanogaster transgenics constructed.
| Genetic modification | Chromosomal location | Integrated plasmid backbone | Fly strain injected |
|---|---|---|---|
| CRISPR/Cas9 Arp53D knockout | Chr 2, 53D8, 2R:12661915.12662963 | pHD-attP-DsRed (RRID:Addgene_51019)* | RRID:BDSC_55821 |
| sfGFP-Arp53D | Chr 3, 89E11, 3R:17052863 | p[acman] (Venken et al., 2006) | RRID:BDSC_9744 |
| sfGFP-△N-term -Arp53D | Chr 3, 89E11, 3R:17052863 | attB-DsRed† | RRID:BDSC_9744 |
| Nterm Arp53D-sfGFP | Chr 3, 89E11, 3R:17052863 | attB-DsRed† | RRID:BDSC_9744 |
| sfGFP-Nterm Arp53D-Act5C | Chr 3, 89E11, 3R:17052863 | attB-DsRed† | RRID:BDSC_9744 |
| WT Arp53D (tagless) | chr2R:16,774,308–16,774,426 | attB-sfGFP‡ | Arp53D KOs isogenized in the Oregon-R background |
-
*pDsRed-attP is from Melissa Harrison and Kate O'Connor-Giles and Jill Wildonger (Addgene plasmid # 51019; http://n2t.net/addgene:51019; RRID:Addgene_51019).
†Vector encoding an attB site and 3xP3-DsRed flanked by loxP sites.
-
‡Vector encoding an attB site and 3xP3-sfGFP.
Additional files
-
Source data 1
Raw images for figure supplements.
- https://cdn.elifesciences.org/articles/71279/elife-71279-data1-v1.zip
-
Supplementary file 1
The data for Figure 5B and Figure 8A, B are displayed in individual sheets in the Excel file.
For each panel, it is shown how the chi-squared test was conducted and the percent genotypes are graphed per replicate.
- https://cdn.elifesciences.org/articles/71279/elife-71279-supp1-v1.xlsx
-
Transparent reporting form
- https://cdn.elifesciences.org/articles/71279/elife-71279-transrepform-v1.docx
Download links
A two-part list of links to download the article, or parts of the article, in various formats.
Downloads (link to download the article as PDF)
Open citations (links to open the citations from this article in various online reference manager services)
Cite this article (links to download the citations from this article in formats compatible with various reference manager tools)
An actin-related protein that is most highly expressed in Drosophila testes is critical for embryonic development
eLife 10:e71279.
https://doi.org/10.7554/eLife.71279


