Pyruvate:ferredoxin oxidoreductase and low abundant ferredoxins support aerobic photomixotrophic growth in cyanobacteria
- Department of Biology, Botanical Institute, Christian-Albrechts-University, Germany
- Department of Molecular Plant Physiology, Bioenergetics in Photoautotrophs, University of Kassel, Germany
- Plant Physiology Department, University of Rostock, Germany
- Department of Biochemistry, Molecular Plant Biology, University of Turku, Finland
Figures
Figure 1 with 4 supplements
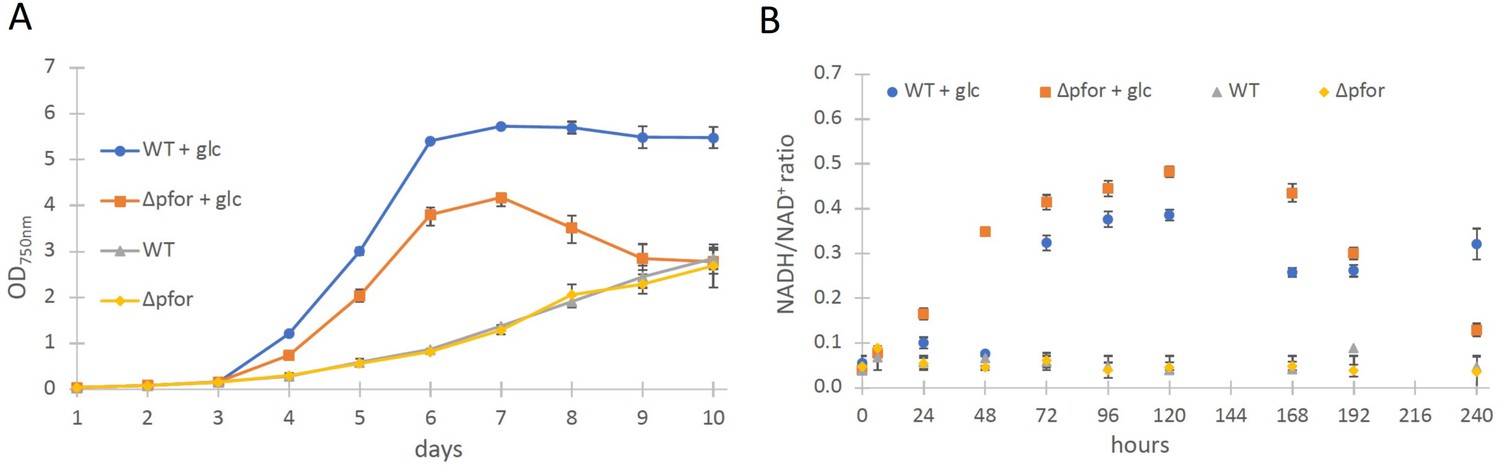
Wild type and Δpfor under photoautotrophic and photomixotrophic conditions.
(A) Growth and (B) NADH/NAD+ ratios of wild type (WT) and Δpfor under photoautotrophic and photomixotrophic (+glc) conditions in continuous light. Shown are mean values ± standard deviation (SD) from at least three replicates.
-
Figure 1—source data 1
Raw data of growth and NADH/NAD+ ratio of wild type (WT) and Δpfor under photoautotrophic and photomixotrophic conditions.
- https://cdn.elifesciences.org/articles/71339/elife-71339-fig1-data1-v2.xlsx
Figure 1—figure supplement 1
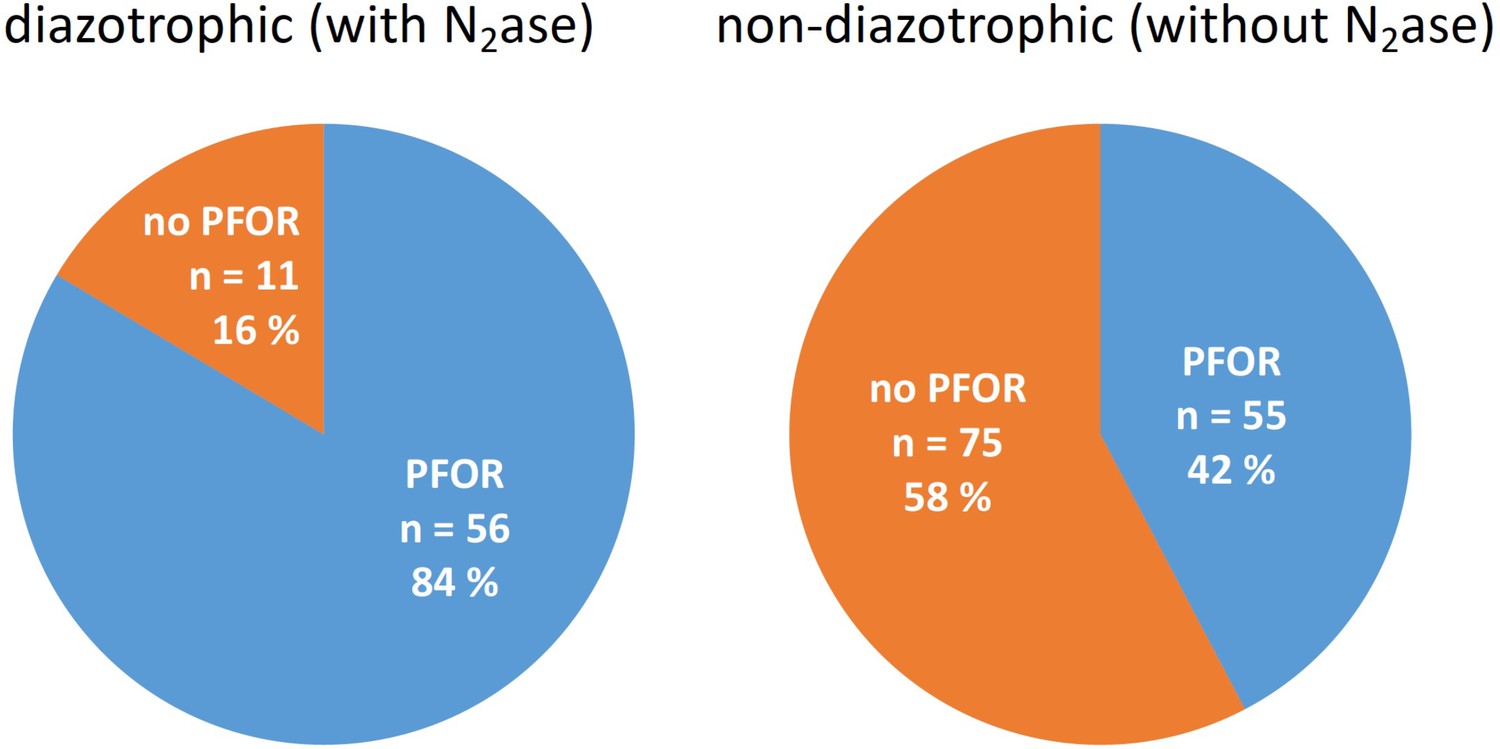
Bioinformatic analyses concerning the distribution of pyruvate dehydrogenase (PDH) complex and pyruvate:ferredoxin oxidoreductase (PFOR) in diazotrophic and nondiazotrophic cyanobacteria.
All shown genomes possess a PDH complex.
-
Figure 1—figure supplement 1—source data 1
Raw data of bioinformatic analysis of the occurrence of pyruvate:ferredoxin oxidoreductase (PFOR) and the pyruvate dehydrogenase (PDH) complex in cyanobacteria.
- https://cdn.elifesciences.org/articles/71339/elife-71339-fig1-figsupp1-data1-v2.xlsx
Figure 1—figure supplement 2
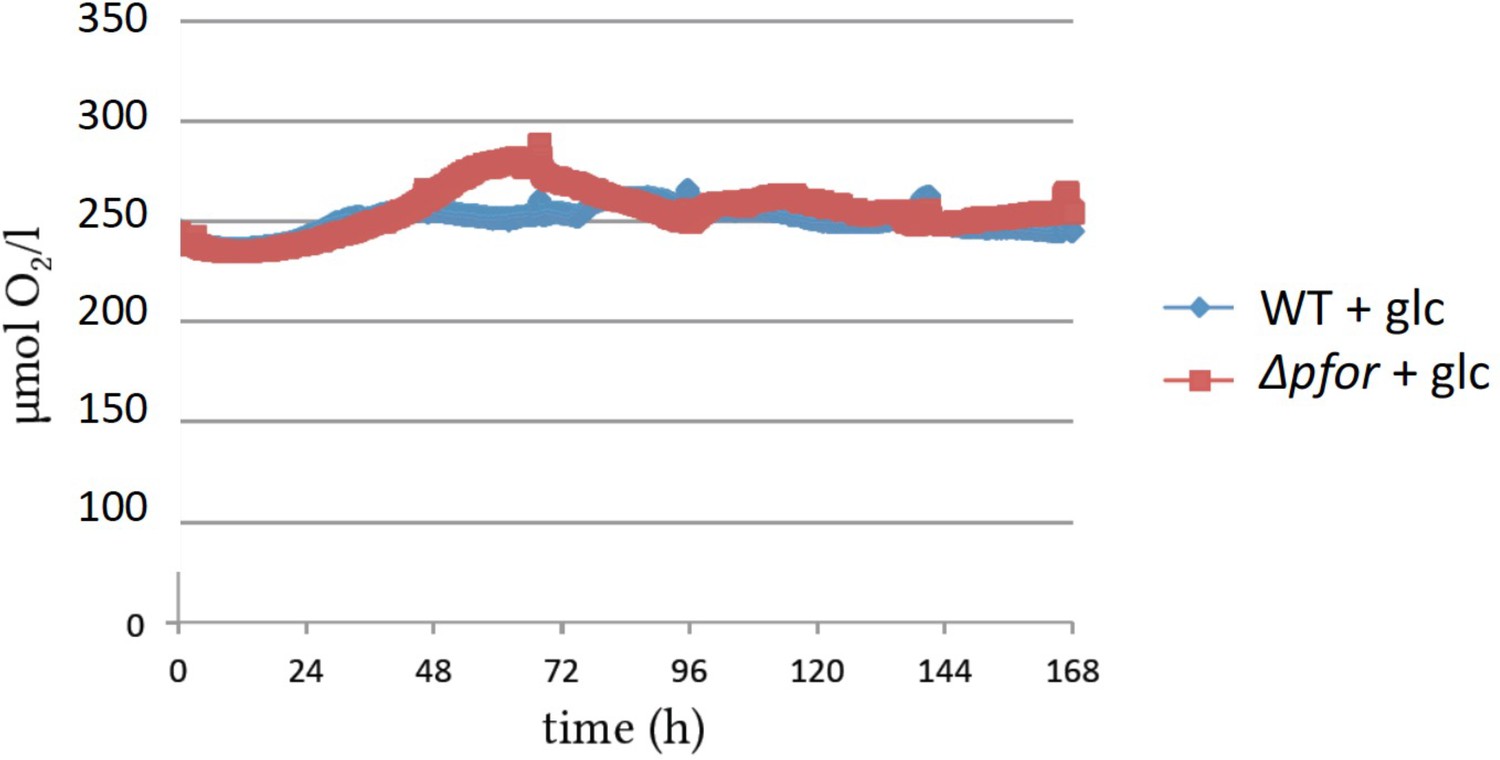
Oxygen concentrations in photomixotrophic cultures of wild type (WT) and pfor were close to oxygen saturation throughout the growth experiments.
Original traces are shown.
-
Figure 1—figure supplement 2—source data 1
Raw data of oxygen concentration in photomixotrophic wild type (WT) and Δpfor cultures.
- https://cdn.elifesciences.org/articles/71339/elife-71339-fig1-figsupp2-data1-v2.xlsx
Figure 1—figure supplement 3
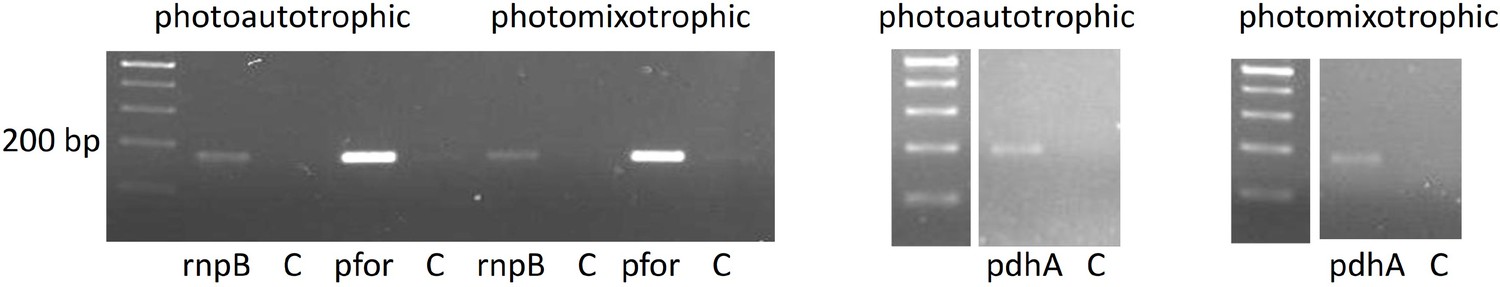
RT-PCR showing that pfor and pdhA are transcribed under photoautotrophic and photomixotrophic conditions in the wild type.
Total RNA of wild-type cells was reverse transcribed and subsequently subjected to PCRs with either primers specific for rnpB, pfor, or pdhA (Supplementary file 1a). In the control reactions (C) reverse transcriptase was omitted.
-
Figure 1—figure supplement 3—source data 1
Uncropped raw gel of RT-PCR.
- https://cdn.elifesciences.org/articles/71339/elife-71339-fig1-figsupp3-data1-v2.zip
Figure 1—figure supplement 4
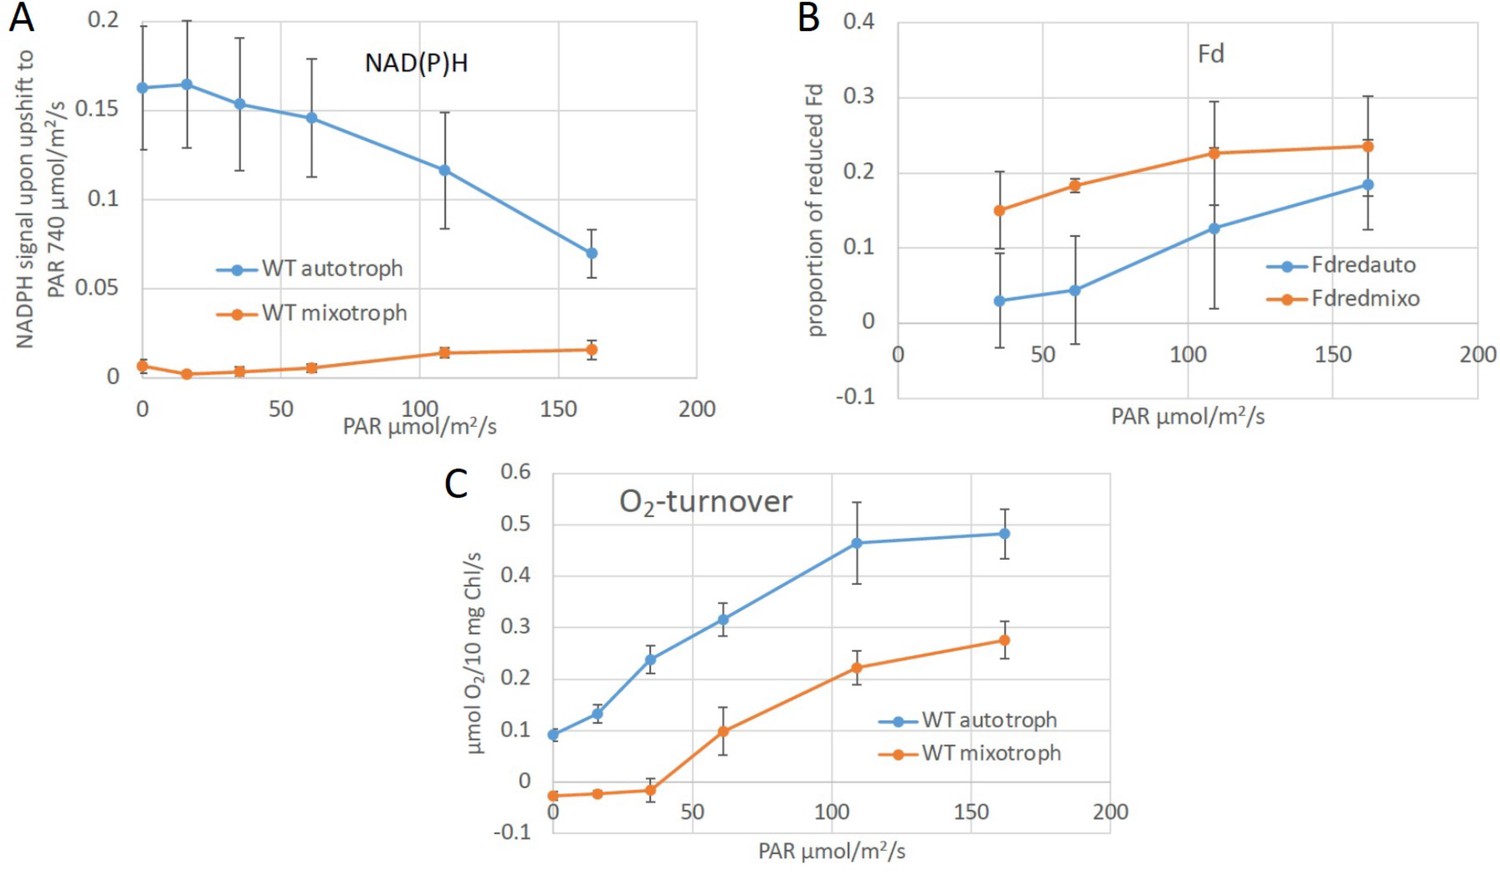
Redox states of NAD(P)H and ferredoxin and O2 turnover in auto- and mixotrophic cultures.
(A) NAD(P)H fluorescence measurements were applied to get an estimate of its redox state under photomixotrophic in comparison to photoautotrophic conditions in vivo. This method does not distinguish between NADPH and NADH, though. The reduction level of NAD(P)H was determined by applying a strong light pulse (740 µE/m2/s) in addition to actinic light (0–160 µE/m2/s). The resulting signal differences give an estimate about the amount of available NAD(P)+, which can still be reduced. Low NAD(P)H signals thus indicate a rather reduced NAD(P)H pool, as shown for photomixotrophic in comparison to photoautotrophic conditions. (B) The reduction level of the ferredoxin pool was determined using the Dual-KLAS/NIR. The ferredoxin pool which was likewise more reduced under photomixotrophy. (C) Oxygen evolution was determined in parallel and found that it was reduced to about half of that of the photoautotrophic ones. Thus, linear electron transport should still be able to reduce about half of the NAD(P)H compared to photoautotrophic cultures. Thus, since NAD(P)H is barely reducibly under photomixotrophy these data clearly show, that the NAD(P)H pool is strongly reduced in the presence of glucose. This is well in line with the NADH/NAD+ levels that are likewise rather reduced under photomixotrophy (Figure 1B).
Figure 2 with 3 supplements
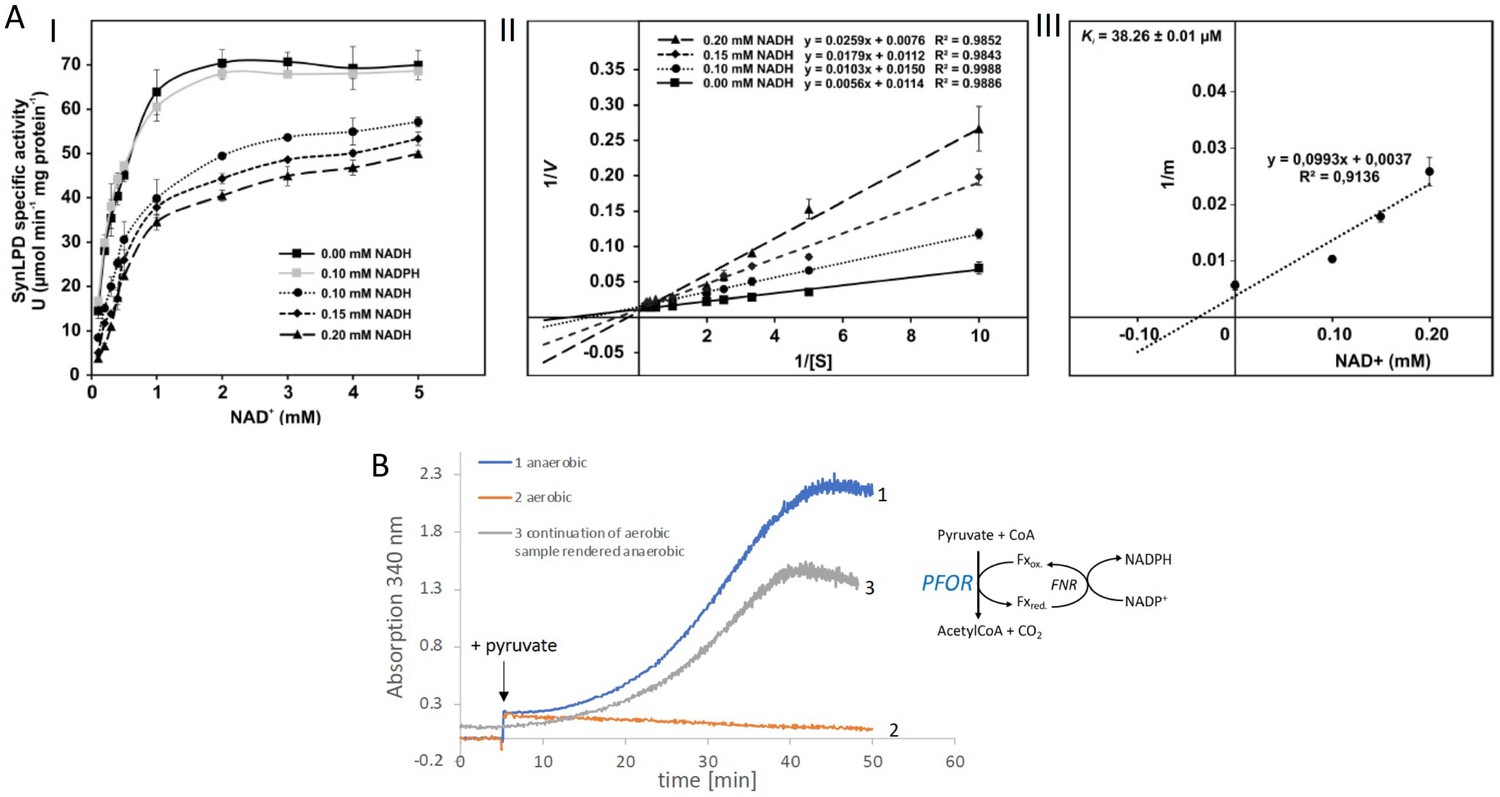
Biochemical characterization of the pyruvate dehydrogenase complex and the pyruvate:ferredoxin oxidoreductase.
(A) Inhibition of the pyruvate dehydrogenase (PDH) complex in Synechocystis via inactivation of the dihydrolipoyl dehydrogenase (E3) subunit (SynLPD) by NADH. I: The rate of recombinant SynLPD activity (3 mM DL-dihydrolipoic acid) as a function of NAD+ (0.1, 0.2, 0.3, 0.4, 0.5, 1, 2, 3, 4, and 5 mM) reduction in the presence of the indicated NADH concentrations (0, 0.1, 0.15 and 0.2 mM). NADPH (0.1 mM) was used as a control to demonstrate the specificity of NADH inhibition. Specific enzyme activity is expressed in µmol NADH per min–1 mg protein–1 at 25ºC. II: Lineweaver-Burk plots of enzyme activities at four NADH concentrations. III: The inhibitor constant (Ki) was estimated by linear regression of (I) the slopes of the three Lineweaver-Burk plots at the four NADH concentrations versus (II) the NADH concentration. Shown are mean values ± standard deviation (SD) from at least 3 technical replicates. (B) Enzyme activity of pyruvate:ferredoxin oxidoreductase (PFOR) that was purified in the presence of oxygen. PFOR activity was measured in the presence of ferredoxin-NADPH-oxidoreductase (FNR), ferredoxin, and NADP+. The reaction was started by addition of 10 mM pyruvate as indicated by the arrow. Assay 1 (blue line): The assay mixture was kept anaerobic with 40 mM glucose, 40 U glucose oxidase, and 50 U catalase, showing that PFOR, which was purified in the presence of oxygen, is active. Assay 2 (red line): Assay 2 had the same composition as assay 1 but glucose, glucose oxidase and catalase were omitted, showing that anaerobic conditions are required for activity of PFOR in vitro. Assay 3 (gray line): This assay is the continuation of the measurement of assay 2 after addition of glucose, glucose oxidase and catalase. Representative traces of three replicates are shown.
-
Figure 2—source data 1
Raw data of enzymatic in vitro test with the dihydrolipoyl dehydrogenase (E3) subunit (SynLPD) of the pyruvate dehydrogenase (PDH) complex and pyruvate:ferredoxin oxidoreductase (PFOR).
- https://cdn.elifesciences.org/articles/71339/elife-71339-fig2-data1-v2.xlsx
Figure 2—figure supplement 1
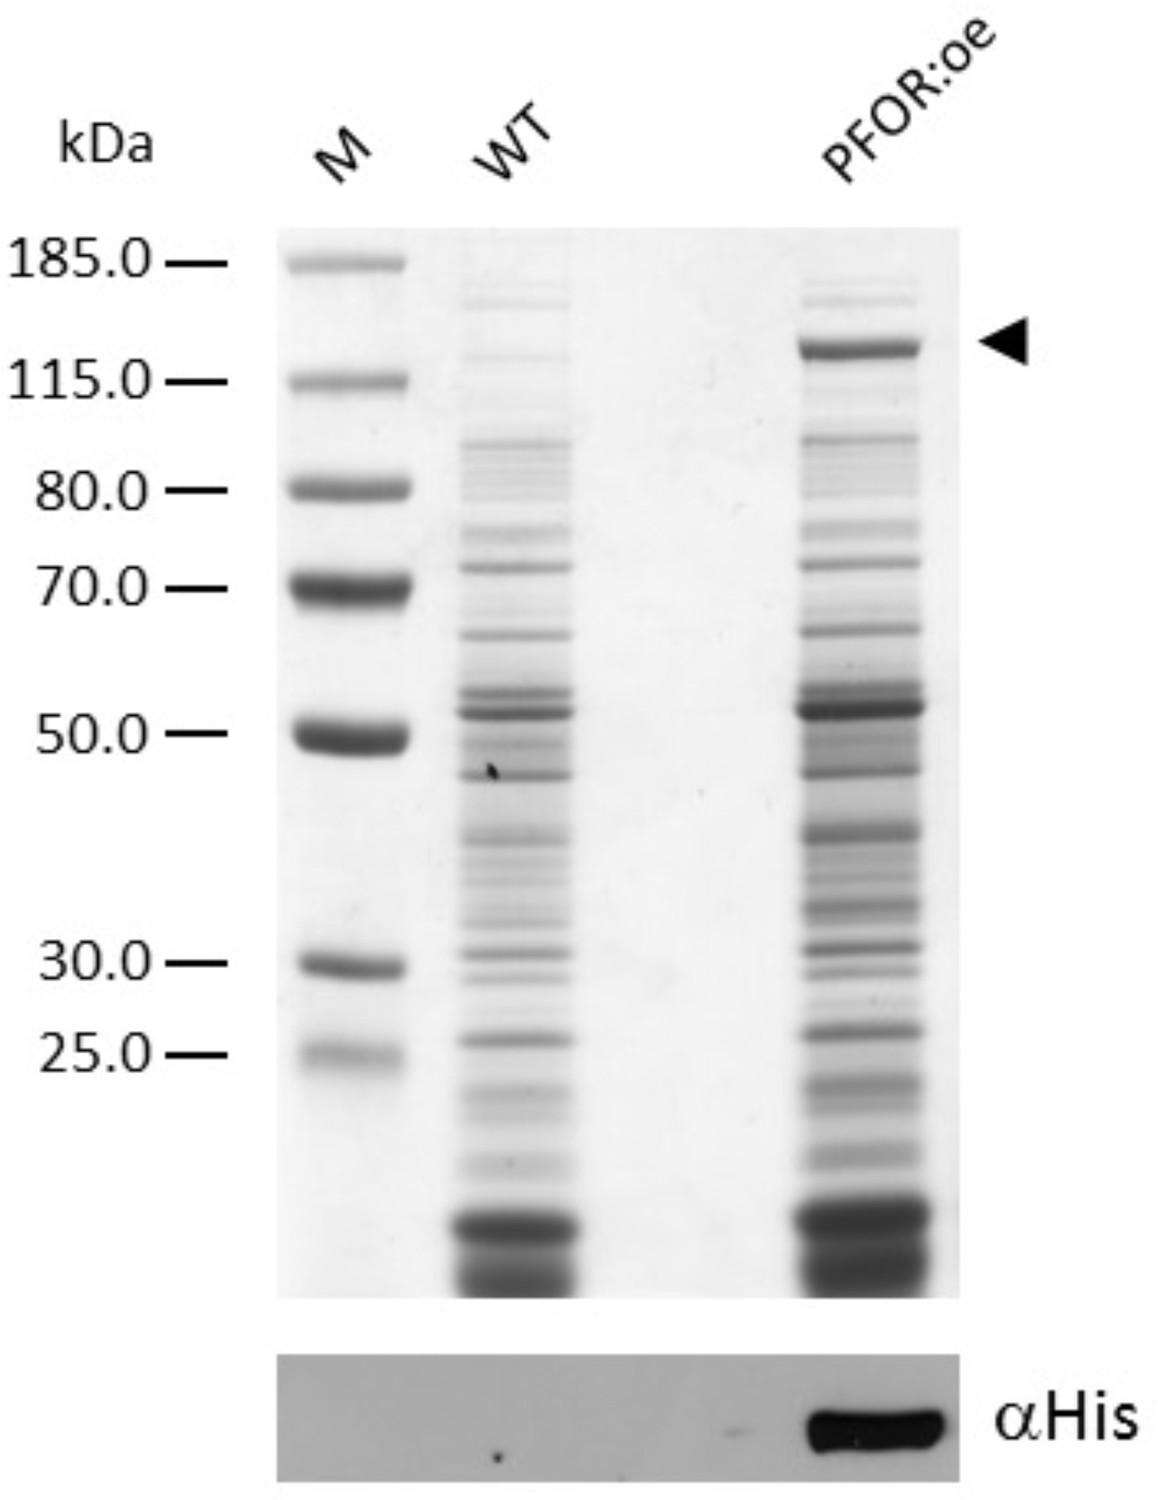
Sodium dodecyl sulfate–polyacrylamide gel electrophoresis (SDS–PAGE) analysis followed by immunoblotting of Synechocystis soluble extracts.
Soluble extracts for the wild type (WT) and the mutant overexpressing pyruvate:ferredoxin oxidoreductase (PFOR:oe) containing 15 µg of protein were loaded per lane. The arrowhead indicates the position of overexpressed PFOR.
Figure 2—figure supplement 2

Large-scale pyruvate:ferredoxin oxidoreductase (PFOR) purification.
(A) The chromatogram of the FPLC size exclusion run. The collected fractions (5–7) are marked by the black bar underneath. (B) Various fractions from the purification procedure were analyzed by Sodium dodecyl sulfate–polyacrylamide gel electrophoresis (SDS–PAGE). Soluble extracts before (Pre) and after (Post) the incubation with Talon cobalt resin, a wash fraction, the His-tag elution and the pooled FPLC fraction (5–7) were loaded on the gel.
-
Figure 2—figure supplement 2—source data 1
Uncropped gel of pyruvate:ferredoxin oxidoreductase (PFOR) purification.
- https://cdn.elifesciences.org/articles/71339/elife-71339-fig2-figsupp2-data1-v2.pdf
Figure 2—figure supplement 3
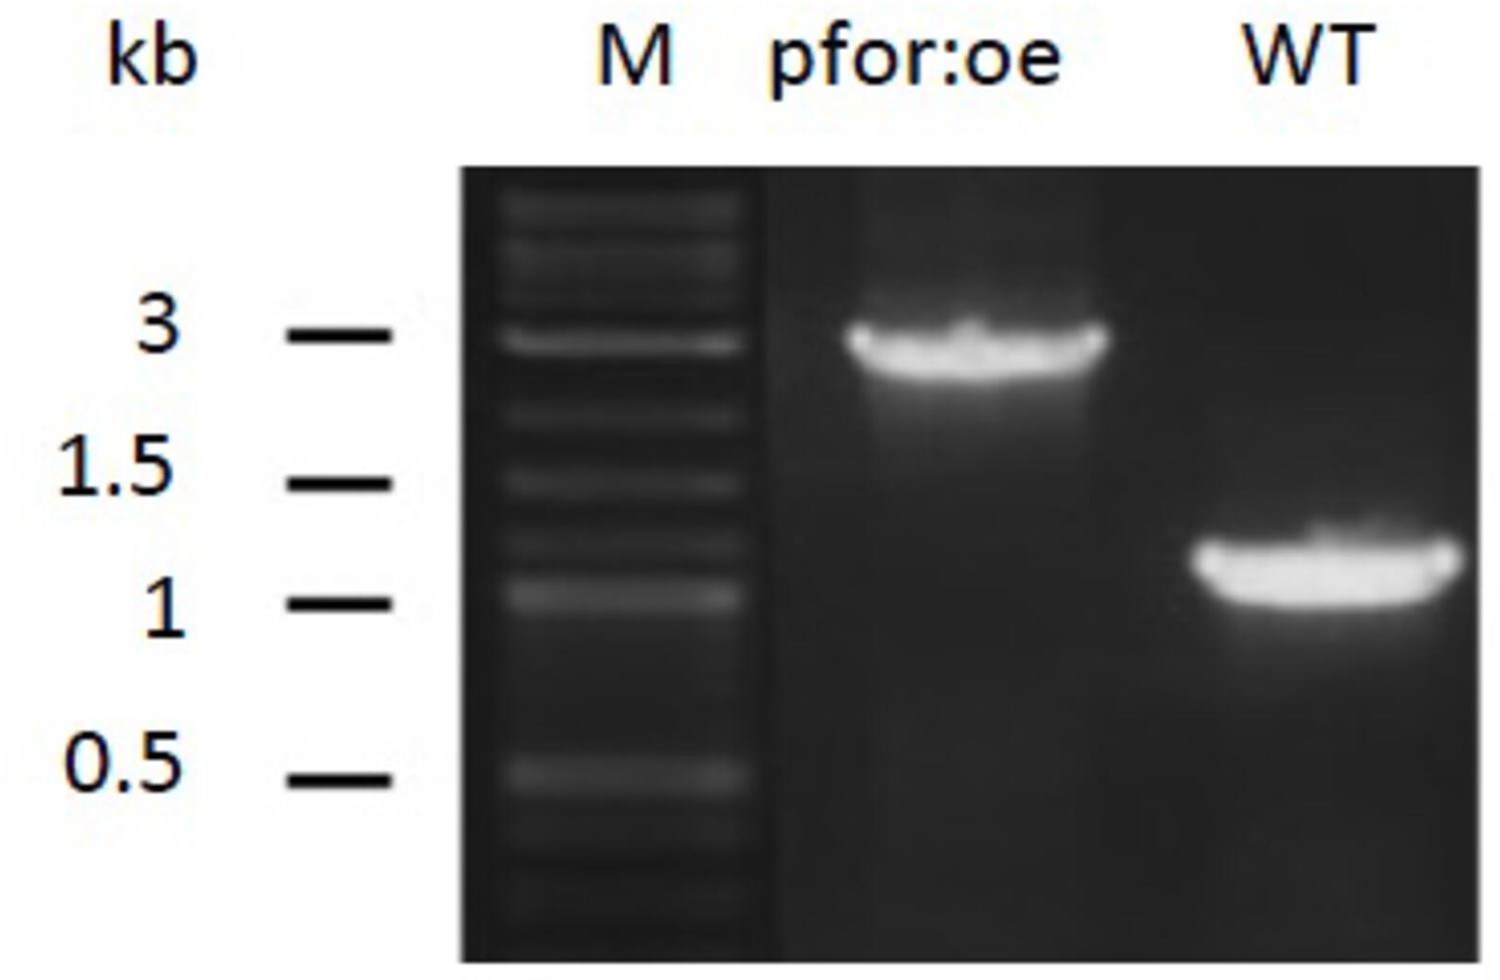
PCR analysis of pyruvate:ferredoxin oxidoreductase overexpression (pfor:oe) mutant and wild type (WT).
Figure 3 with 2 supplements
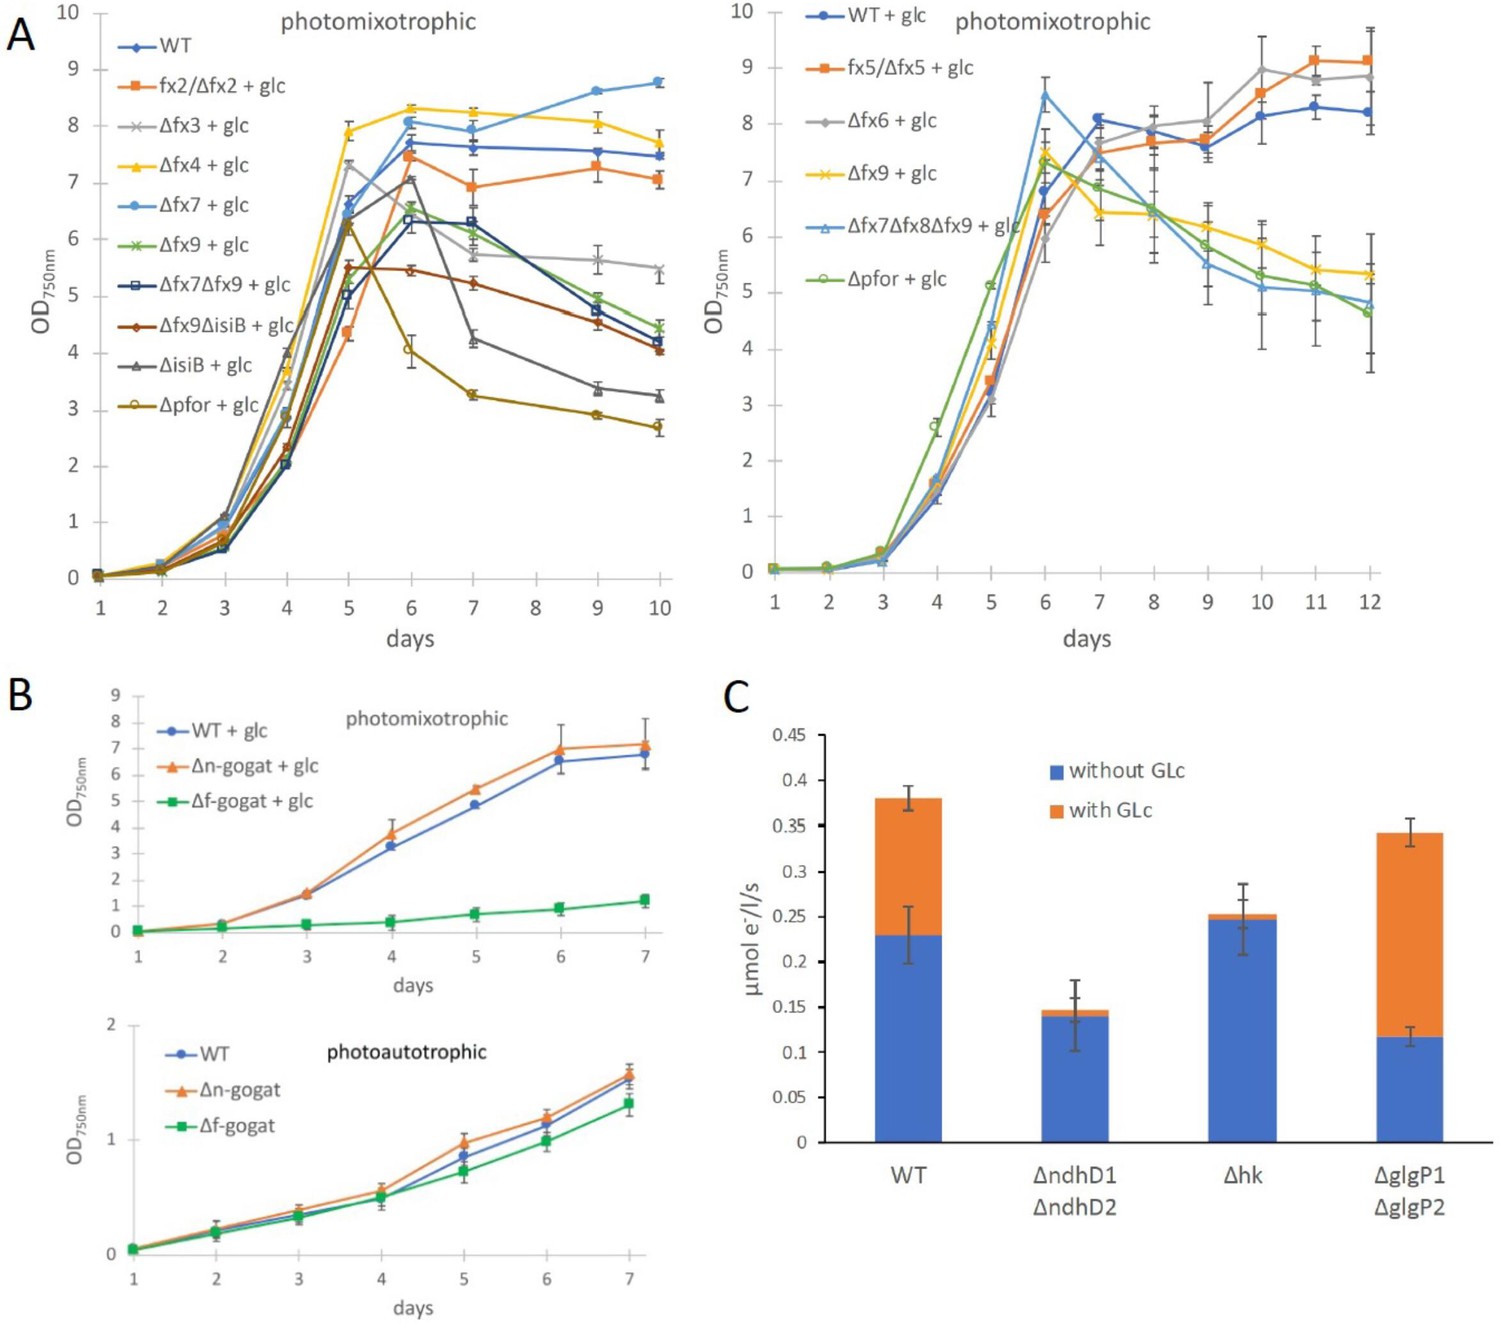
Growth and electron transport at PSI in wild type and several deletion mutants in the presence and absence of glucose.
(A) Photomixotrophic growth of wild type (WT), Δpfor, ferredoxin (fx), and flavodoxin (isiB) deletion mutants as indicated. (B) Growth of WT, Δf-gogat, and Δn-gogat under photoautotrophic and photomixotrophic conditions. (C) Electron transport with 3-(3,4-dichlorophenyl)-1,1-dimethylurea (DCMU) at photosystem I (PSI) in the absence and presence of glucose in the WT, ΔndhD1ΔndhD2, Δhk, and ΔglgP1ΔglgP2. Shown are mean values ± standard deviation (SD) from at least 3 replicates.
-
Figure 3—source data 1
Raw data from growth of wild type (WT), Δpfor, Δfx, ΔisiB, Δf-gogat, and Δn-gogat and electron transport with DCMU at photosystem I (PSI) in the absence and presence of glucose in the WT, ΔndhD1ΔndhD2, Δhk, and ΔglgP1ΔglgP2.
- https://cdn.elifesciences.org/articles/71339/elife-71339-fig3-data1-v2.xlsx
Figure 3—figure supplement 1
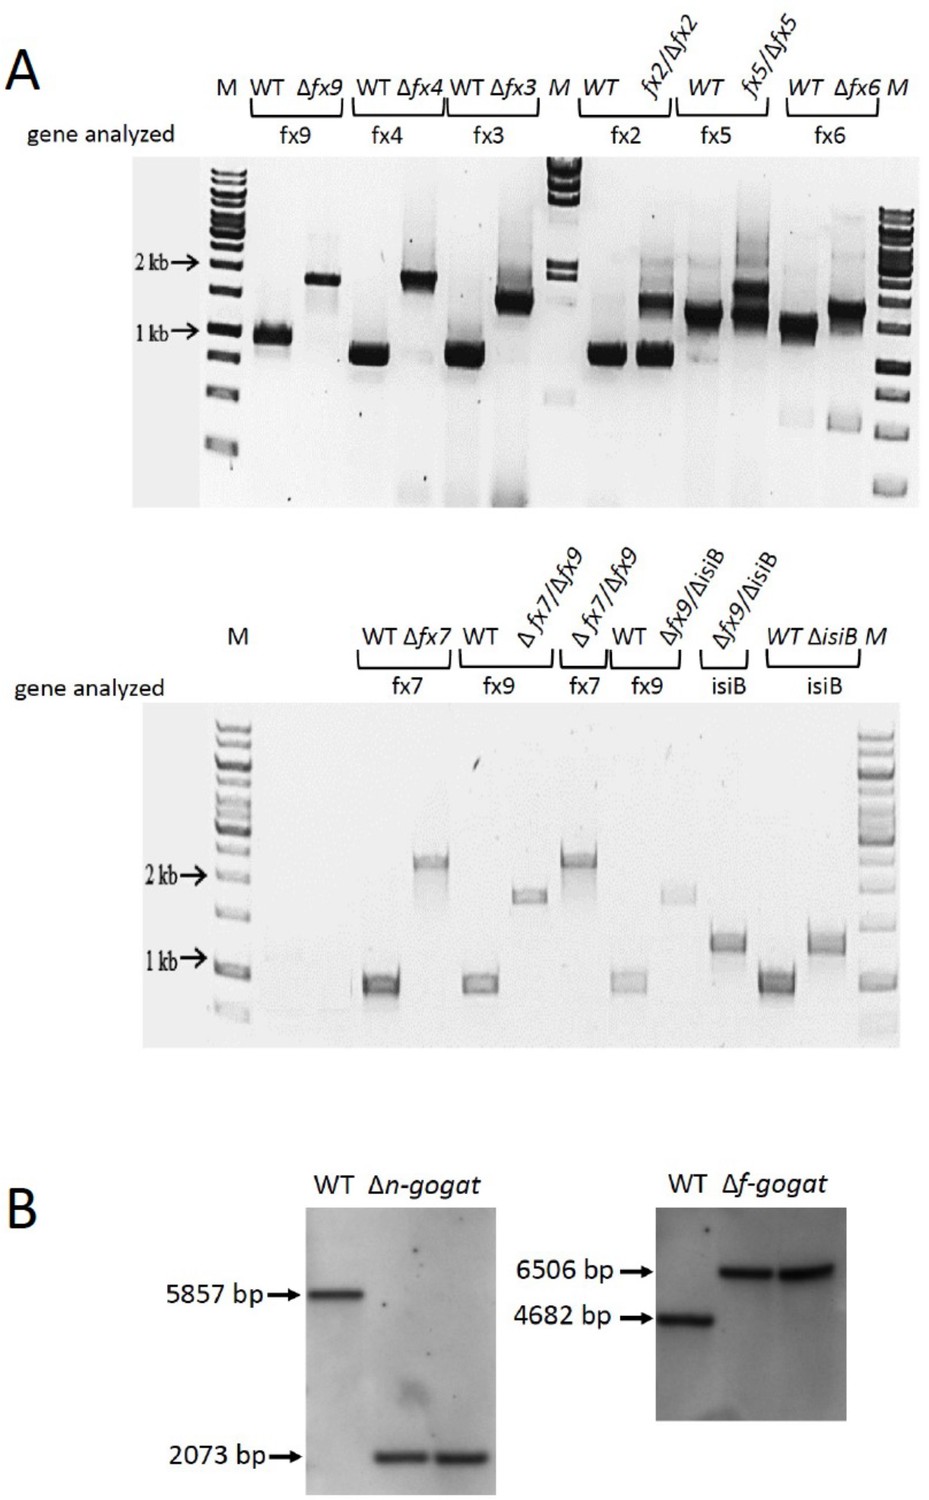
The examination of segregation of mutant strains.
(A) PCR analysis of wild type (WT), ferredoxin (fx) and flavodoxin (isiB) mutants as indicated. (B) Southern blot of WT and n-gogat and f-gogat deletion mutants. WT DNA and DNA of two different mutant clones were applied after HindIII digestion. The sizes of the bands are indicated and correspond to those expected due to the mutation.
-
Figure 3—figure supplement 1—source data 1
Uncropped raw gels and blots from the examination of deletion mutants.
- https://cdn.elifesciences.org/articles/71339/elife-71339-fig3-figsupp1-data1-v2.pdf
Figure 3—figure supplement 2
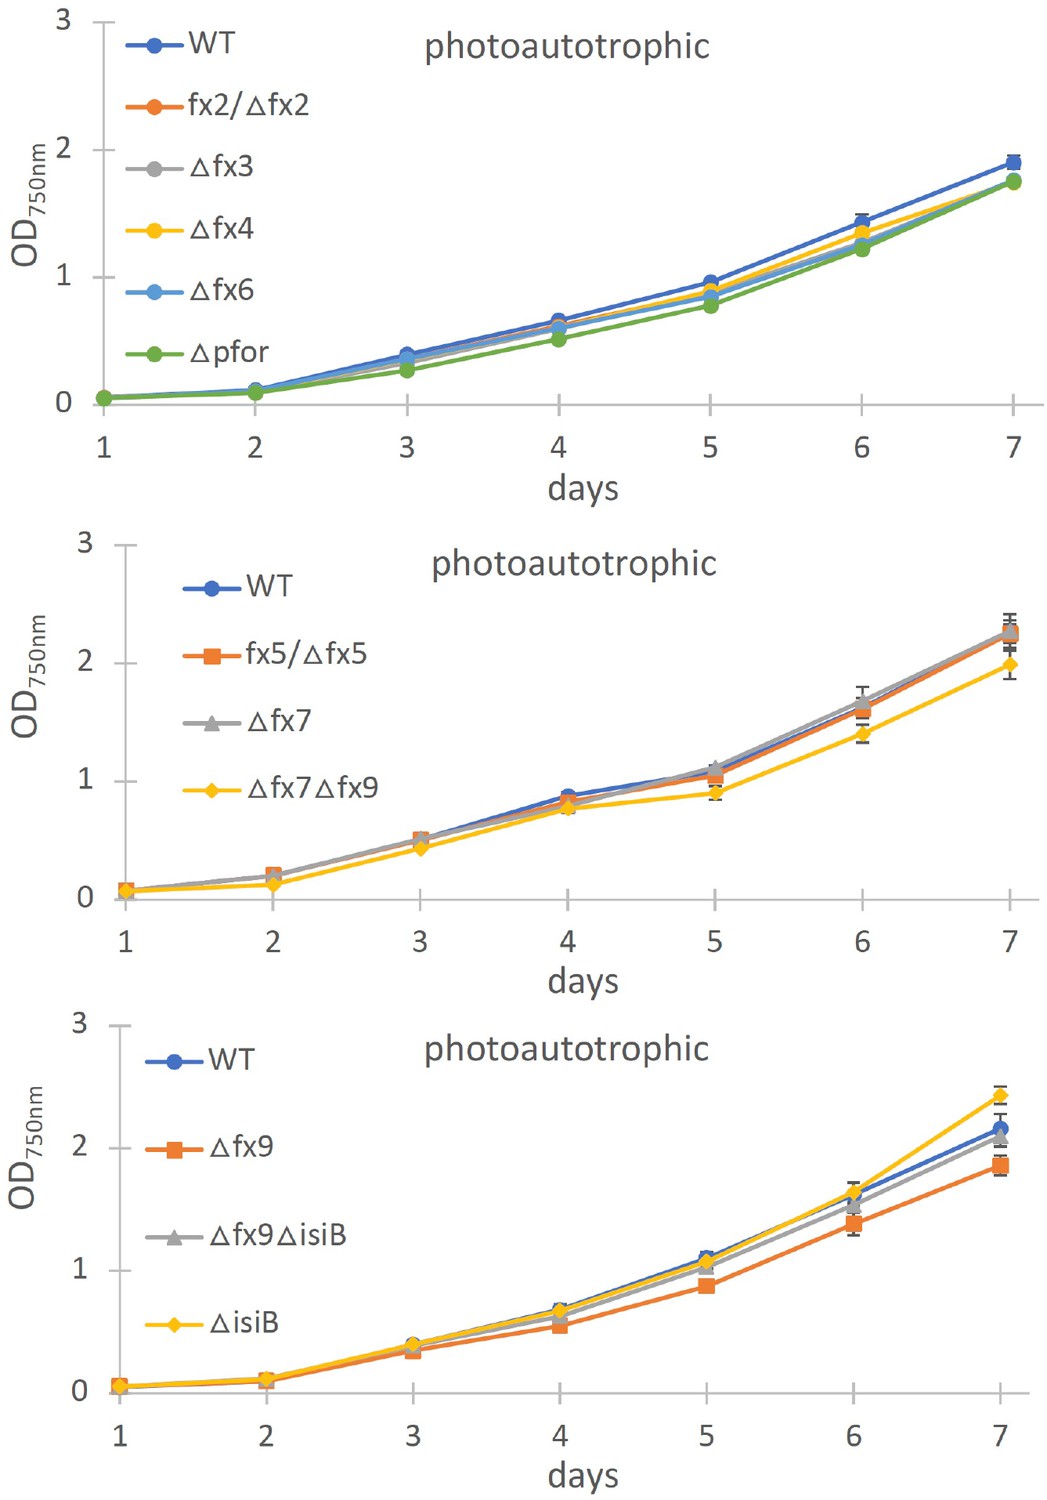
Photoautotrophic growth of different ferredoxin (fx) and the flavodoxin (isiB) deletion mutant as indicated in comparison to the wild type (WT).
Shown are mean values ± standard deviation (SD) from at least three replicates.
-
Figure 3—figure supplement 2—source data 1
Raw data from photoautotrophic growth of different ferredoxin (fx) and the flavodoxin (isiB) deletion mutant as indicated in comparison to the wild type (WT).
- https://cdn.elifesciences.org/articles/71339/elife-71339-fig3-figsupp2-data1-v2.xlsx
Figure 4
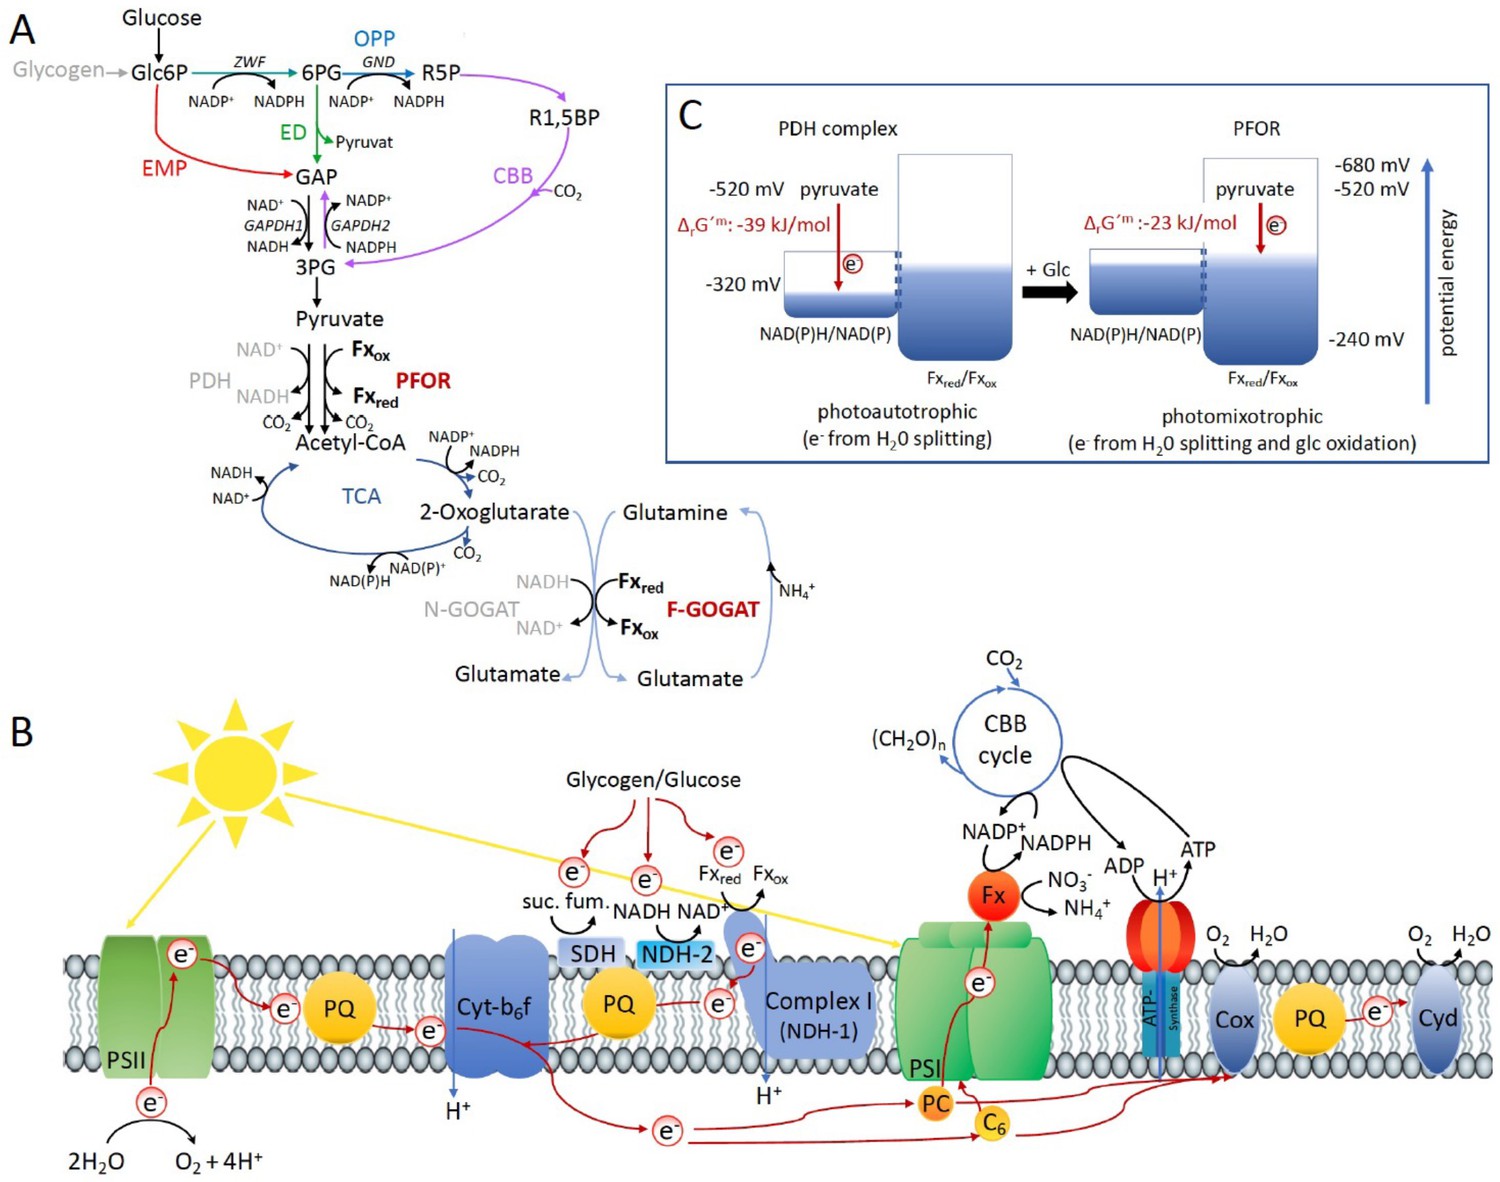
Optimal photomixotrophic growth requires low abundant ferredoxins, pyruvate:ferredoxin oxidoreductase (PFOR) and F-GOGAT.
Electrons from glucose oxidation that arrive at photosystem I (PSI) require ferredoxin-dependent photosynthetic complex I (NDH-1). Cells shift from utilizing NAD(H)- to ferredoxin-dependent enzymes when brought from photoautotrophic to photomixotrophic conditions. (A) Glycolytic routes, lower glycolysis, and the tricarboxylic acid (TCA) cycle yield NAD(P)H from glucose oxidation. The only known enzyme that produces reduced ferredoxin from glucose oxidation is PFOR. Both the decarboxylation of pyruvate as well as the synthesis from glutamate from 2-oxoglutarate and glutamine can be catalyzed by distinct enzymes that either utilize ferredoxin (PFOR, F-GOGAT) or NAD(H) (pyruvate dehydrogenase [PDH] complex, N-GOGAT). (B) Photosynthetic complex I (NDH-1) accepts electrons from reduced ferredoxin. The complex is required for the input of electrons from glucose oxidation into photosynthesis in the presence of DCMU. (C) The ΔrG′m of pyruvate decarboxylation via the PDH complex is more negative that via PFOR, which results in a higher driving force (for calculations see Materials and methods). Photomixotrophy results in reducing conditions. The redox potential of the NAD(P)H/NAD(P)+ pool which is around −320 mV will turn more negative upon reduction. This could facilitate the transfer of electrons from NADH to ferredoxins. In addition, inactivation of NAD+-dependent enzymes (such as the PDH complex) and their functional replacement by ferredoxin-dependent enzymes (such as PFOR) support the suggested shift from the utilization of the NAD(H) to the ferredoxin pool.
Additional files
-
Supplementary file 1
List of primers.
(a) List of primers used in this study to generate deletion strains and for RT-PCR. (b) List of Synechocystis strains and mutants used in this study.
- https://cdn.elifesciences.org/articles/71339/elife-71339-supp1-v2.docx
-
Transparent reporting form
- https://cdn.elifesciences.org/articles/71339/elife-71339-transrepform1-v2.pdf
Download links
A two-part list of links to download the article, or parts of the article, in various formats.
Downloads (link to download the article as PDF)
Open citations (links to open the citations from this article in various online reference manager services)
Cite this article (links to download the citations from this article in formats compatible with various reference manager tools)
Pyruvate:ferredoxin oxidoreductase and low abundant ferredoxins support aerobic photomixotrophic growth in cyanobacteria
eLife 11:e71339.
https://doi.org/10.7554/eLife.71339


