Gene age shapes the transcriptional landscape of sexual morphogenesis in mushroom-forming fungi (Agaricomycetes)
- Synthetic and Systems Biology Unit, Biological Research Center, Hungary
- Department of Biology, University of Pennsylvania, United States
- College of Food, Agricultural, and Environmental Sciences, Department of Plant Pathology, Ohio State University, United States
- Institute of Horticultural Science, Department of Vegetable and Mushroom Growing, Hungarian University of Agriculture and Life Sciences, Hungary
- Department of Plant Anatomy, Institute of Biology, Eötvös Loránd University, Hungary
Figures
Figure 1 with 4 supplements
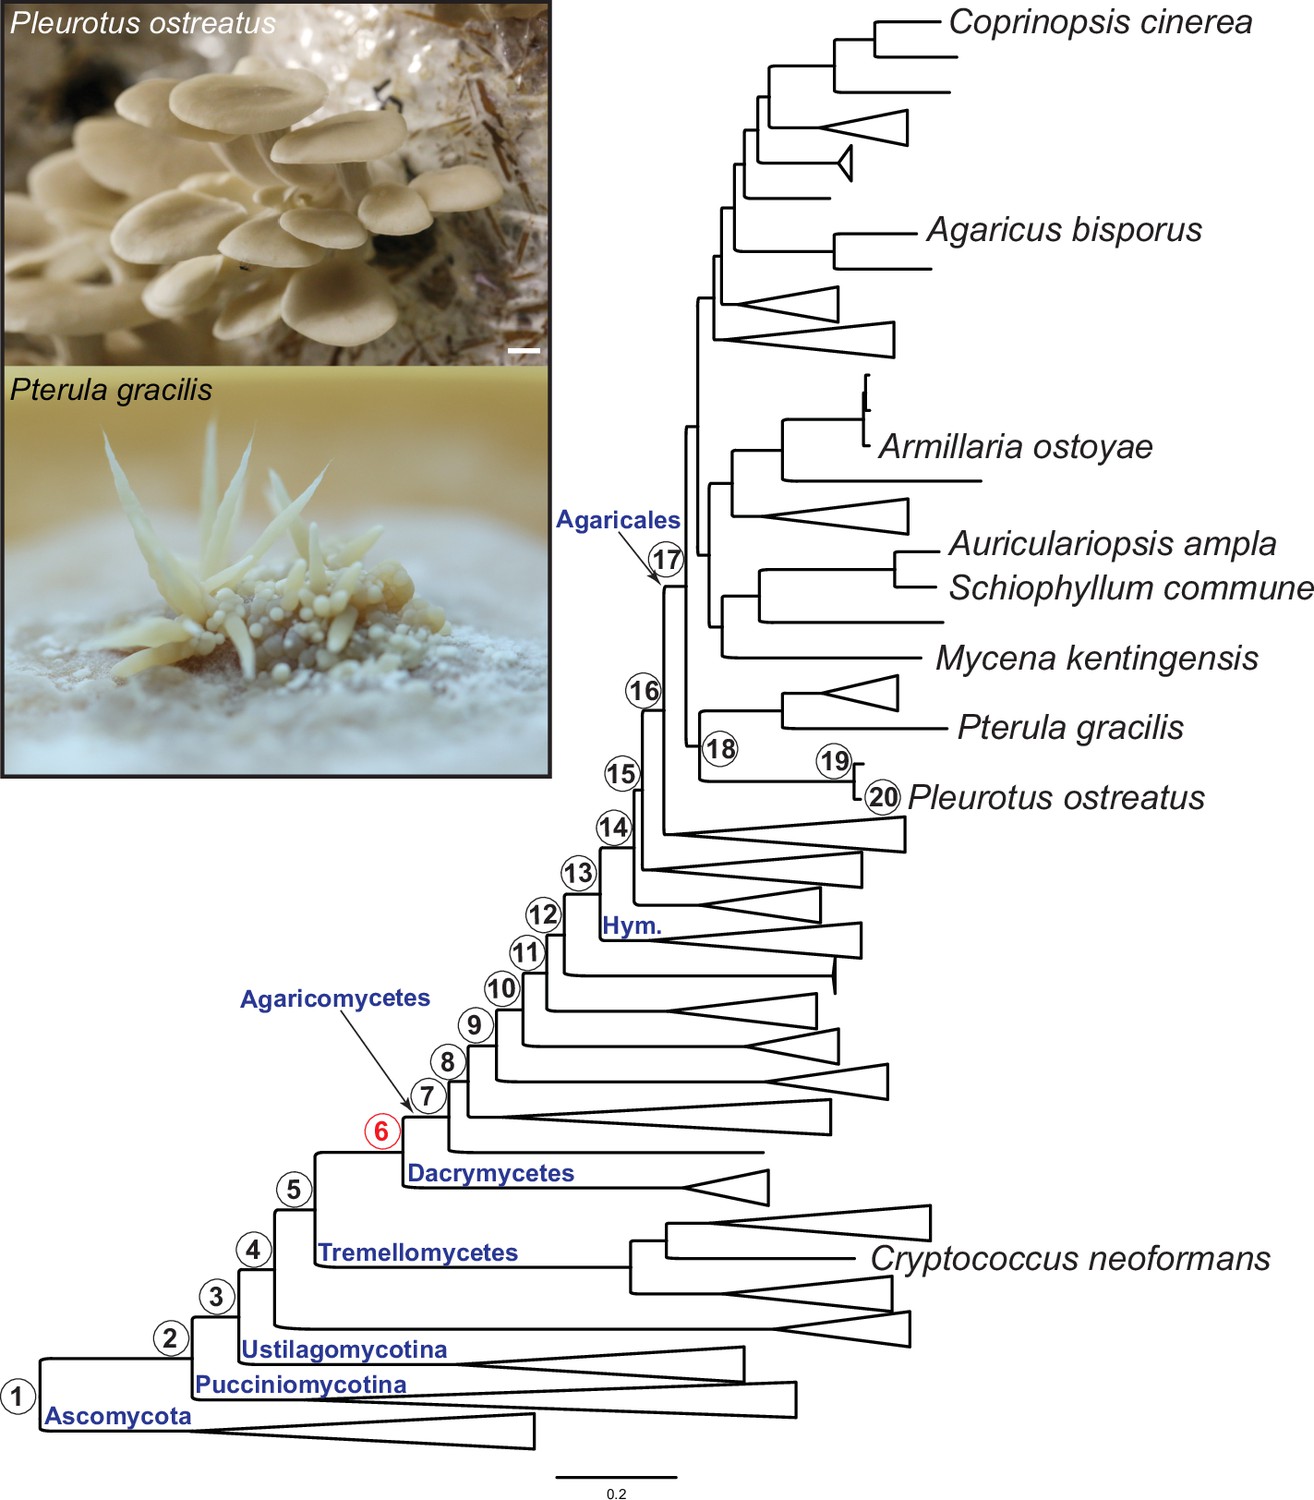
Pylostratigraphic gene ages and phylogenetic relationships among the nine species analyzed in this study.
Numbers in circles next to nodes represent gene ages used in phylostratigraphic analyses of Pleurotus ostreatus. Nodes are numbered from 1 to 20 from the root of the tree to the tip harboring P. ostreatus. The first emergence of complex multicellularity in this lineage is shown with red, according to Merényi et al., 2020. The scale bar represents 0.2 expected change per site. Fruiting bodies of P. ostreatus (upper) and Pterula gracilis (lower) are shown in the box. ‘Hym,’ Hymenochaetales.
Figure 1—figure supplement 1
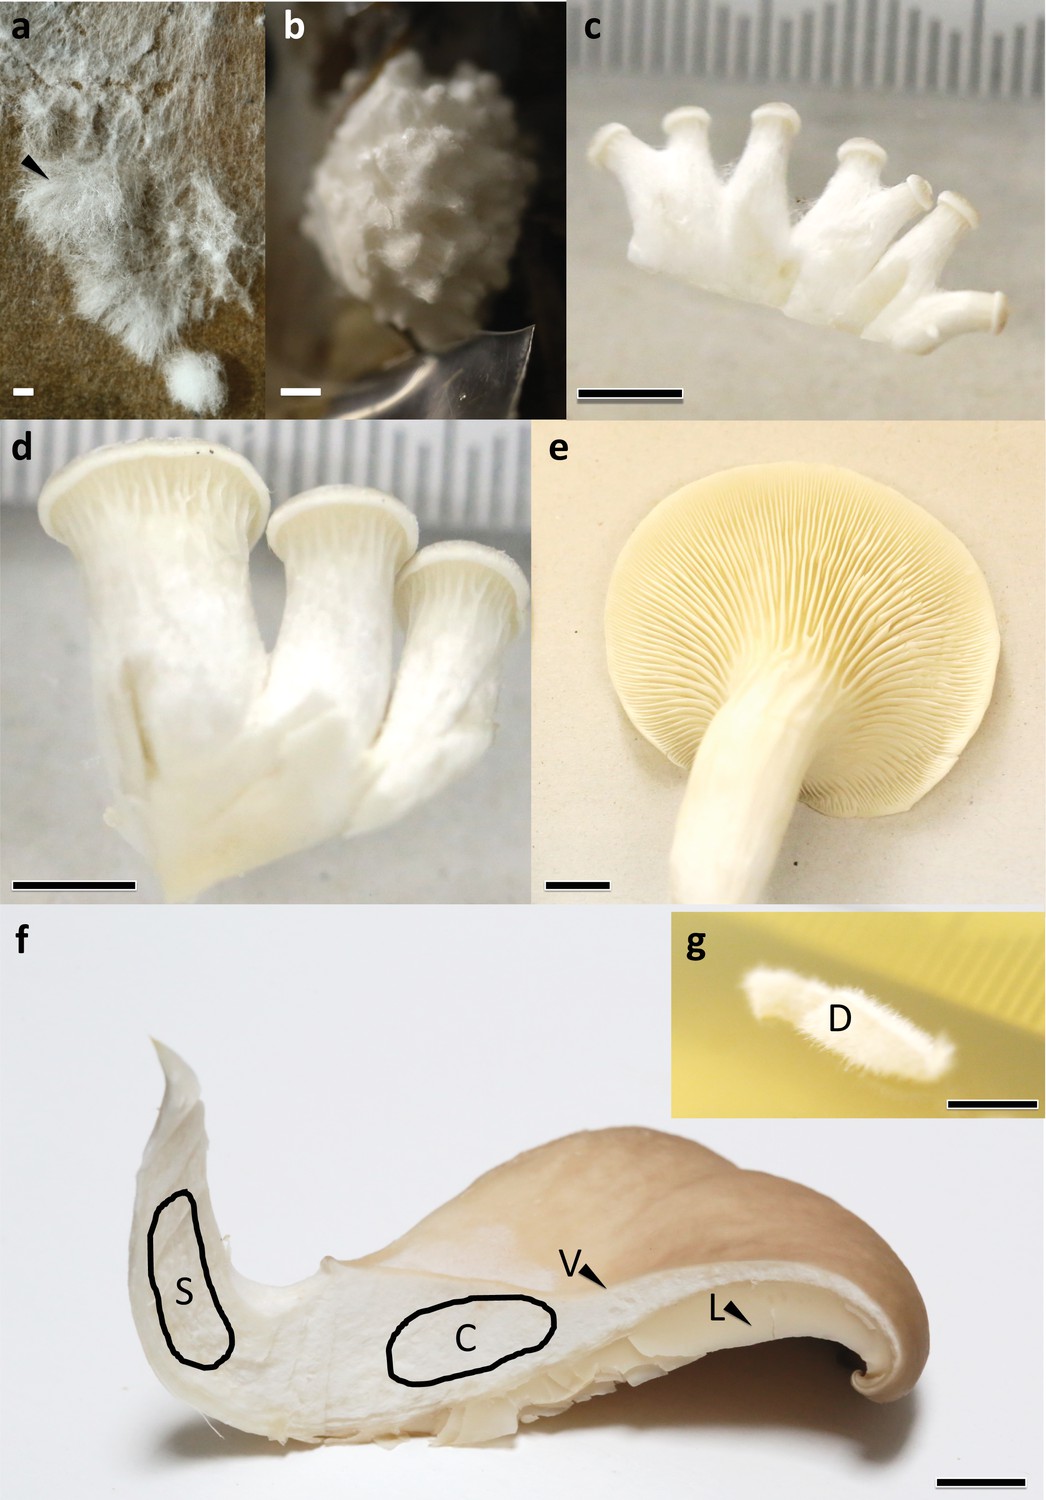
Sampled developmental stages and tissue types during fruiting body formation of Pleurotus ostreatus.
(a) VM: vegetative mycelium; (b) P1: stage 1 primordium; (c) P3: stage 3 primordium; (d) YFB: young fruiting body; (e) FB: fruiting body; (f) dashed areas and black arrows show different tissue types S: stipe; C: cap trama; D: dedifferentiated tissue of cap trama; L: lamellae; and V: cuticle. Bars represent 1 mm in (a) and (b), 5 mm in (c) and (d) while 1 cm in (e–g).
Figure 1—figure supplement 2
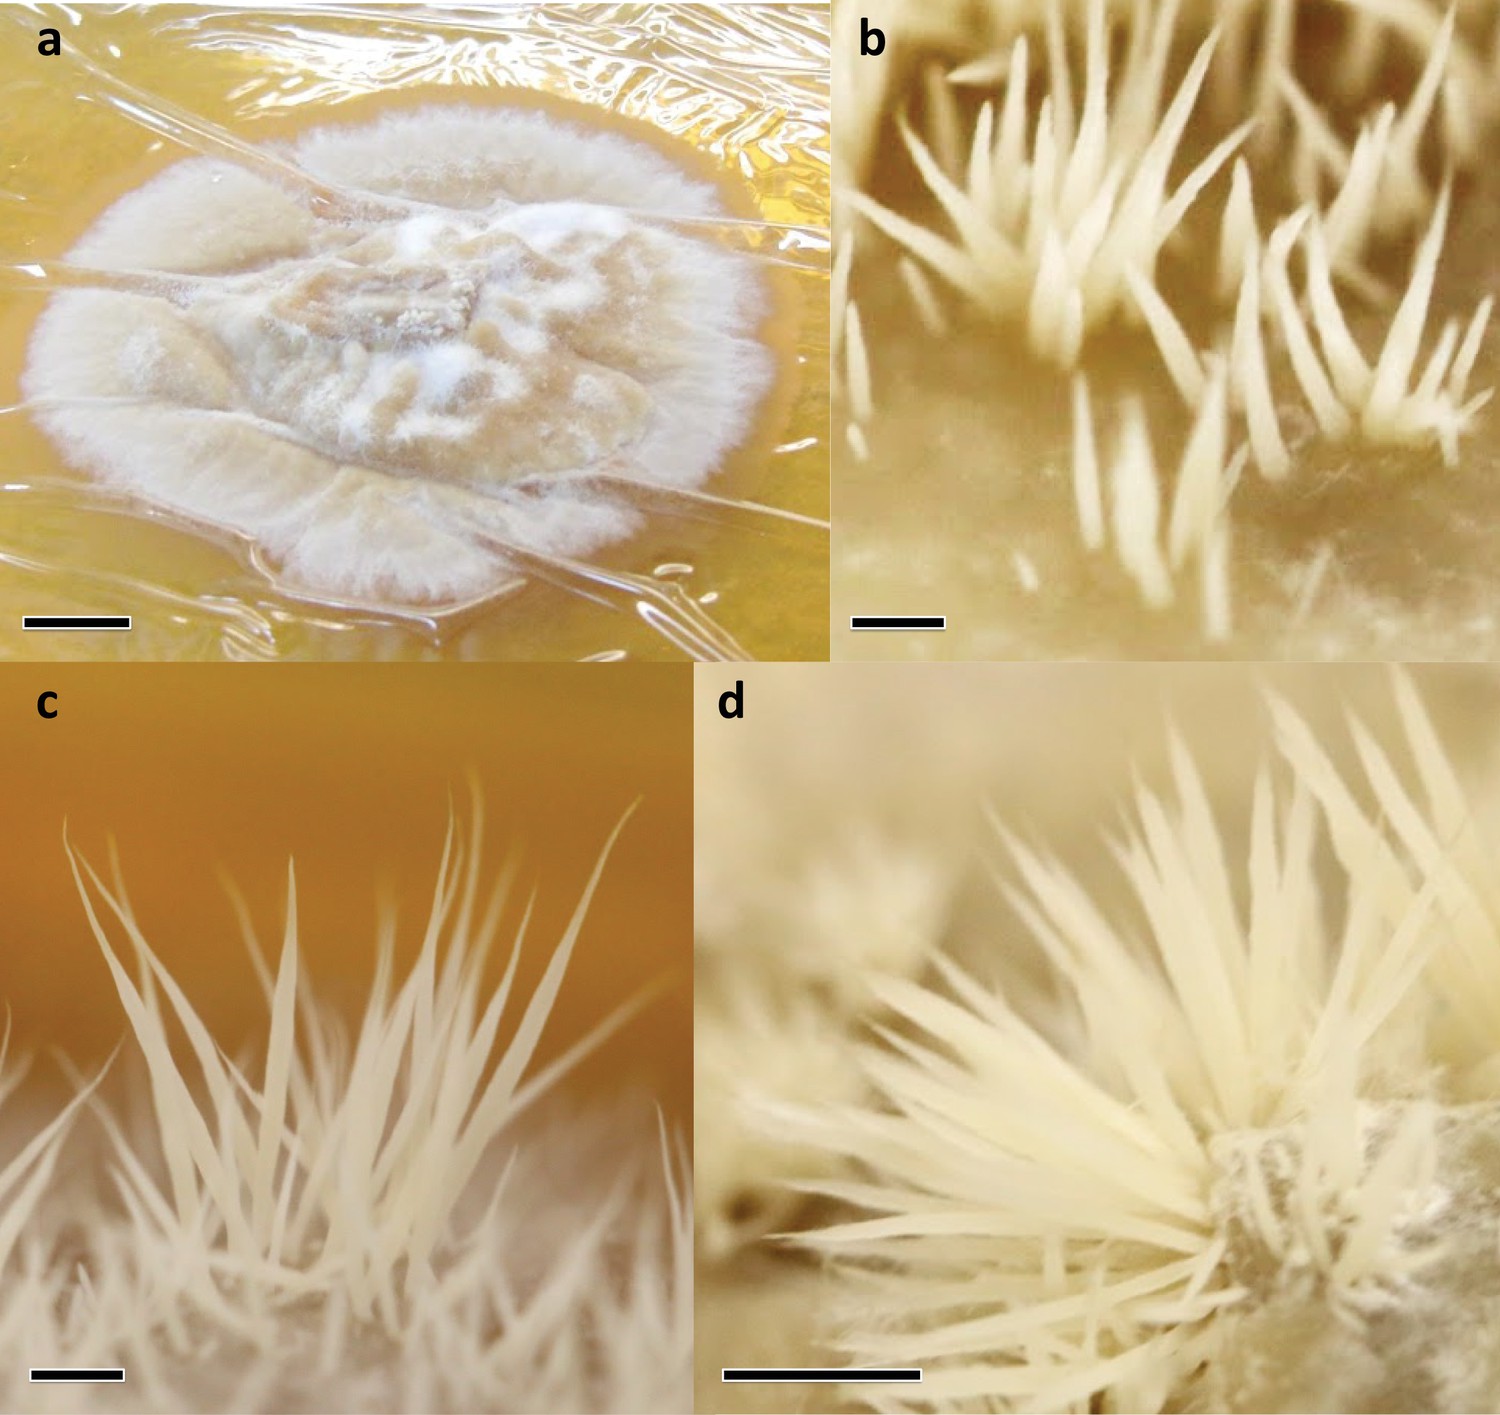
Sampled developmental stages during fruiting body formation of Pterula gracilis.
(a) VM: vegetative mycelium; (b) P: primordium; (c) YFB: young fruiting body; (d) FB: fruiting body; bars represent 1 mm in (b) and (c), 5 mm in (d) while 1 cm in (a).
Figure 1—figure supplement 3
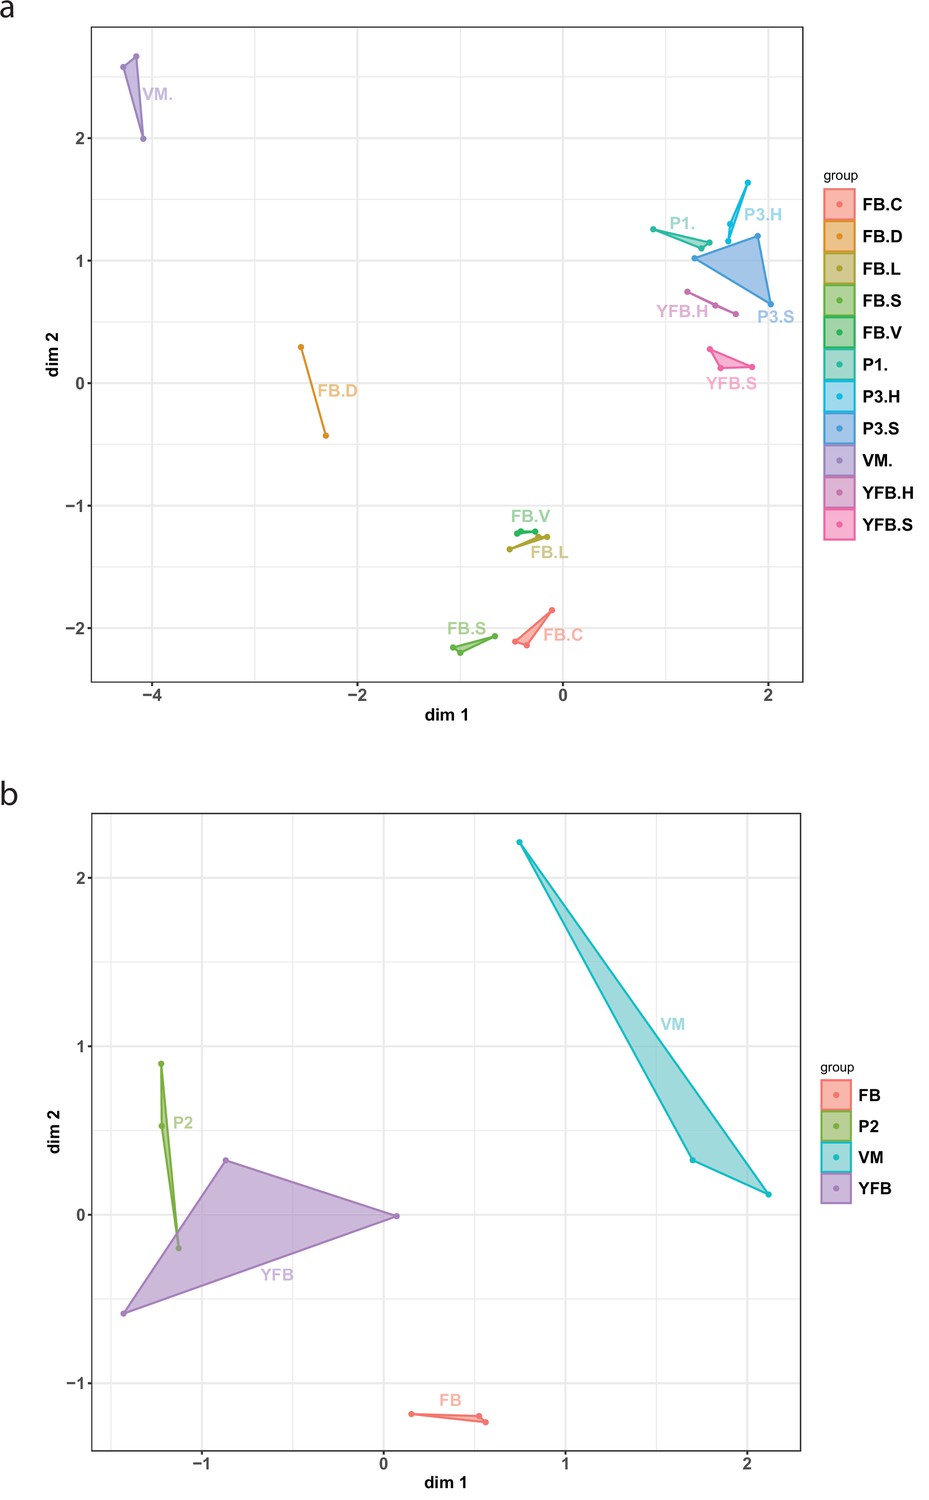
Multidimensional scaling (MDS) plot based on the expression of genes in (a) Pleurotus ostreatus and (b) Pterula gracilis.
Normalized transcriptome data accurately identified sample groups with biological replicates being tightly positioned together. VM: vegetative mycelium; P1: stage 1 primordium; P3: stage 3 primordium; YFB: young fruiting body, FB: fruiting body; H: cap (entire); C: cap trama (only the inner part, without lamellae or skin); L: lamellae; S: stipe; V: cuticle; and D: dedifferentiated tissue of cap.
Figure 1—figure supplement 4
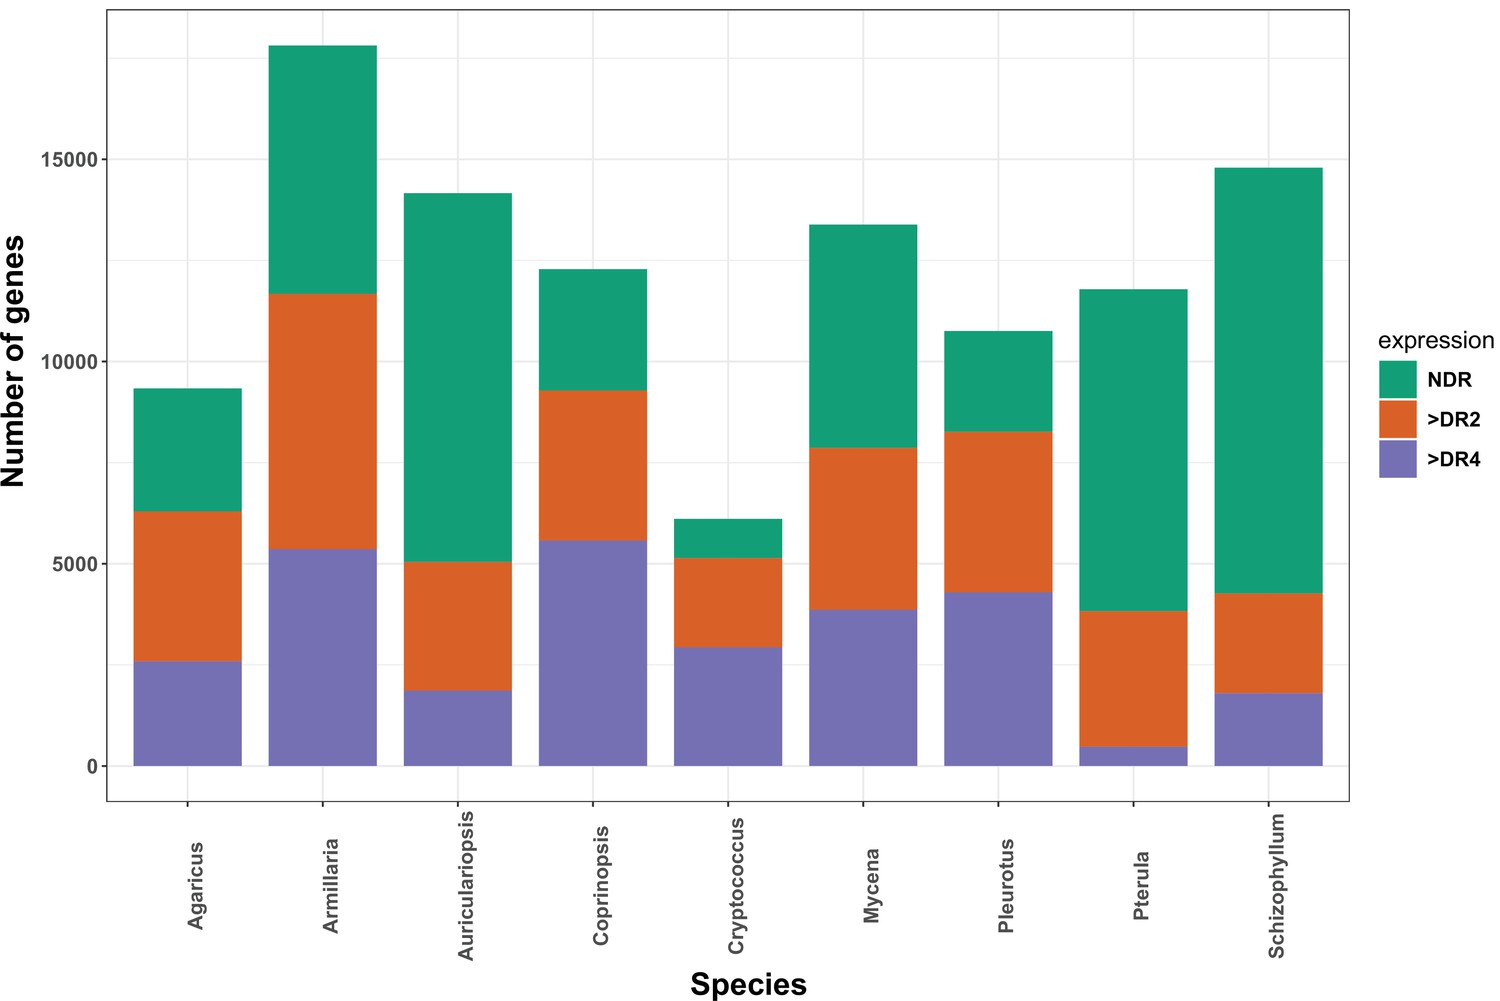
The distribution of developmentally expressed genes in each species.
NDR: not developmentally expressed; >DR2: developmentally expressed with at least twofold change; > DR4: developmentally expressed with at least fourfold change.
Figure 2

Proportion of developmentally expressed (DR >4 fold change [FC]) genes in different gene ages.
* represents significant differences p-value<0.05 (Fisher’s exact test with Benjamini–Hochberg correction). Gene age was calculated based on orthogroup membership (the presence of clear orthologs across species). For each species, nodes along the node path were numbered in ascending order on the species tree from root to tip starting with the value 1 (see Figure 1 for an example); node numbers were then used as the gene age values.
Figure 3
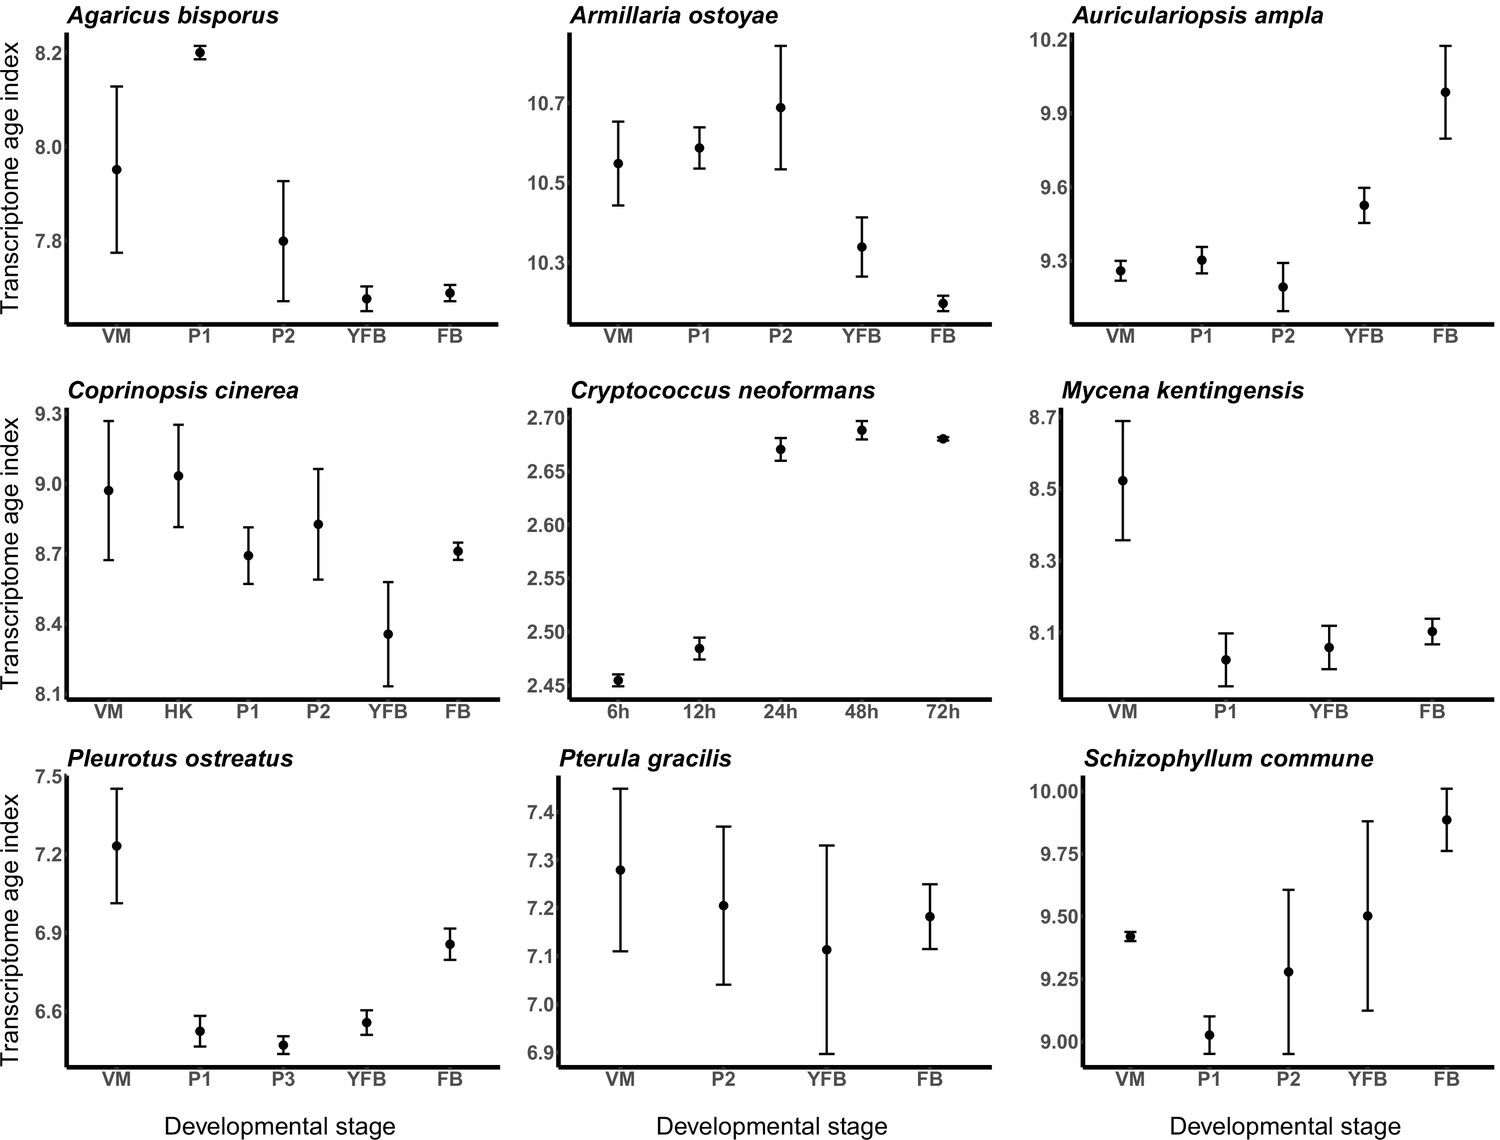
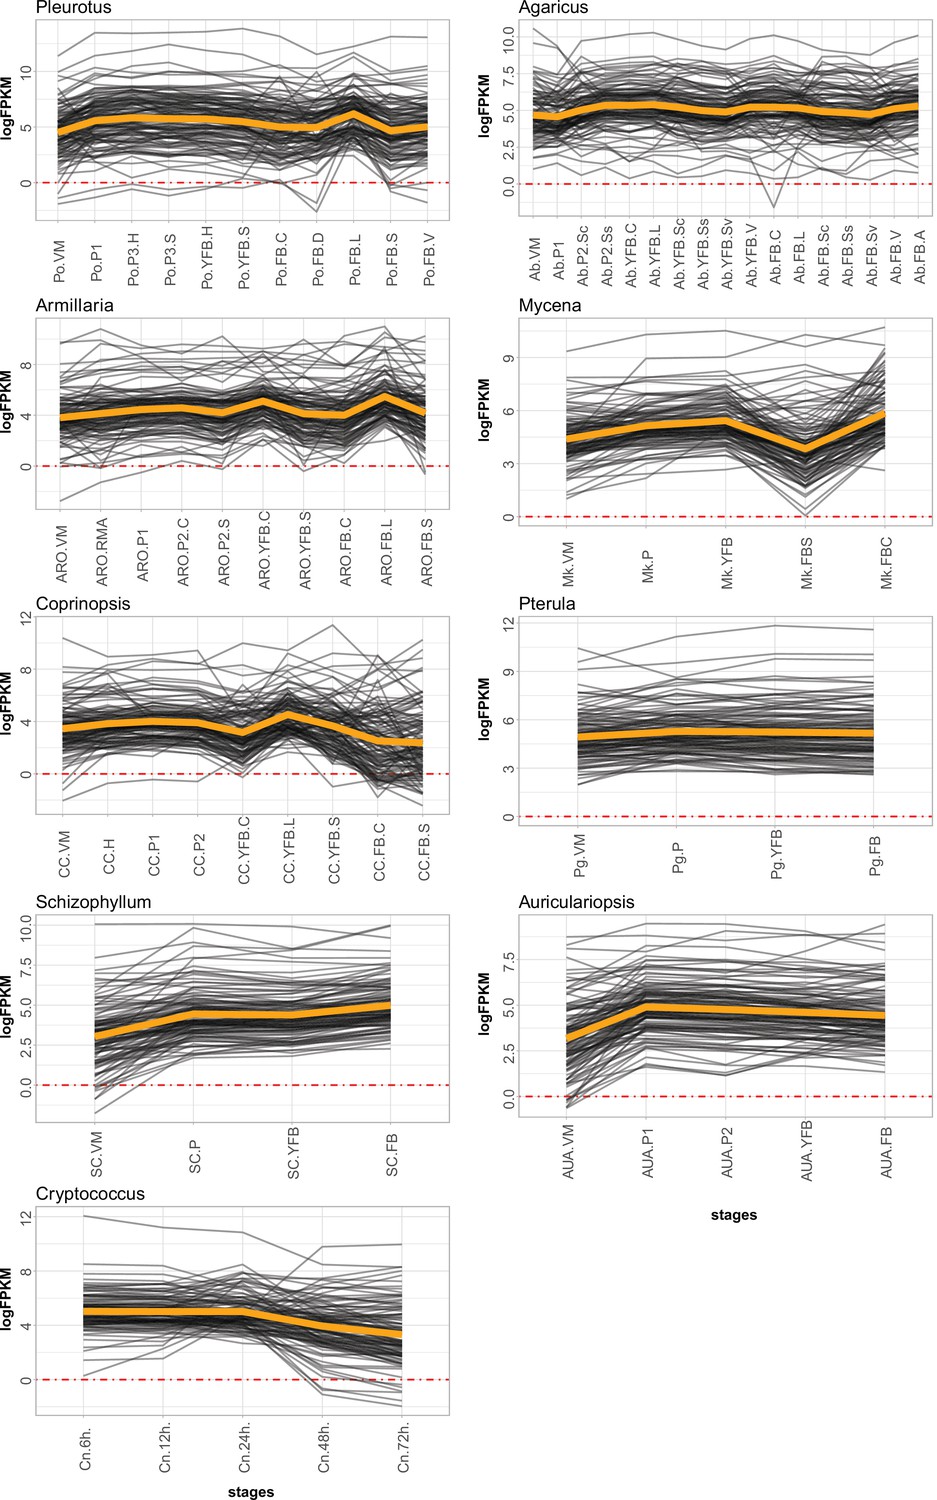
Transcriptome conservation in the nine species based on transcriptome age index (TAI).
VM: vegetative mycelium; P1: stage 1 primordium; P3: stage 3 primordium; YFB: young fruiting body; FB: fruiting body.
Figure 4 with 2 supplements
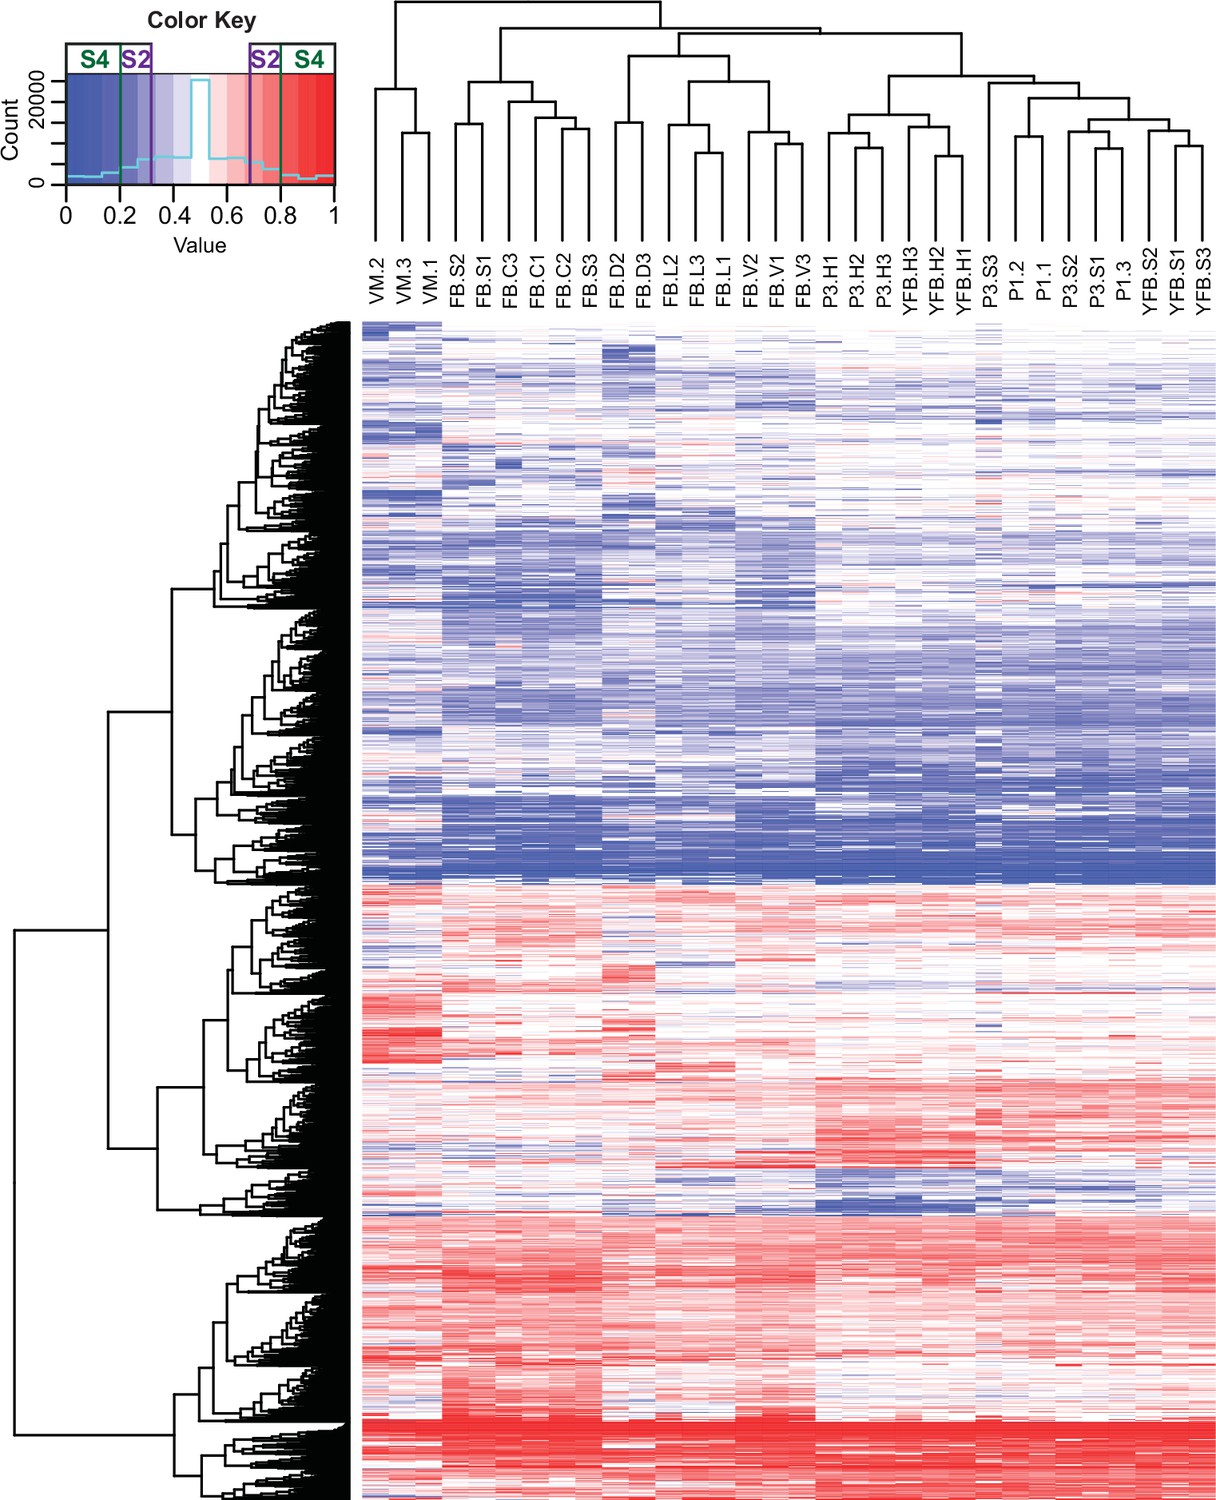
Contribution of two haploid nuclei of P. ostreatus to total gene expression.
Expression of PC15 relative to the sum of PC15 and PC9 (AS ratio) was visualized in a heatmap for genes that showed at least twofold allele-specific expression (ASE) in at least one stage. Thresholds that we used to define S2 and S4 gene sets are marked in the color key. VM: vegetative mycelium; P1: stage 1 primordium; P3: stage 3 primordium; YFB: young fruiting body; FB: fruiting body; H: cap (entire); C: cap trama; L: lamellae; S: stipe; V: cuticle; D: dedifferentiated tissue of cap.
Figure 4—figure supplement 1
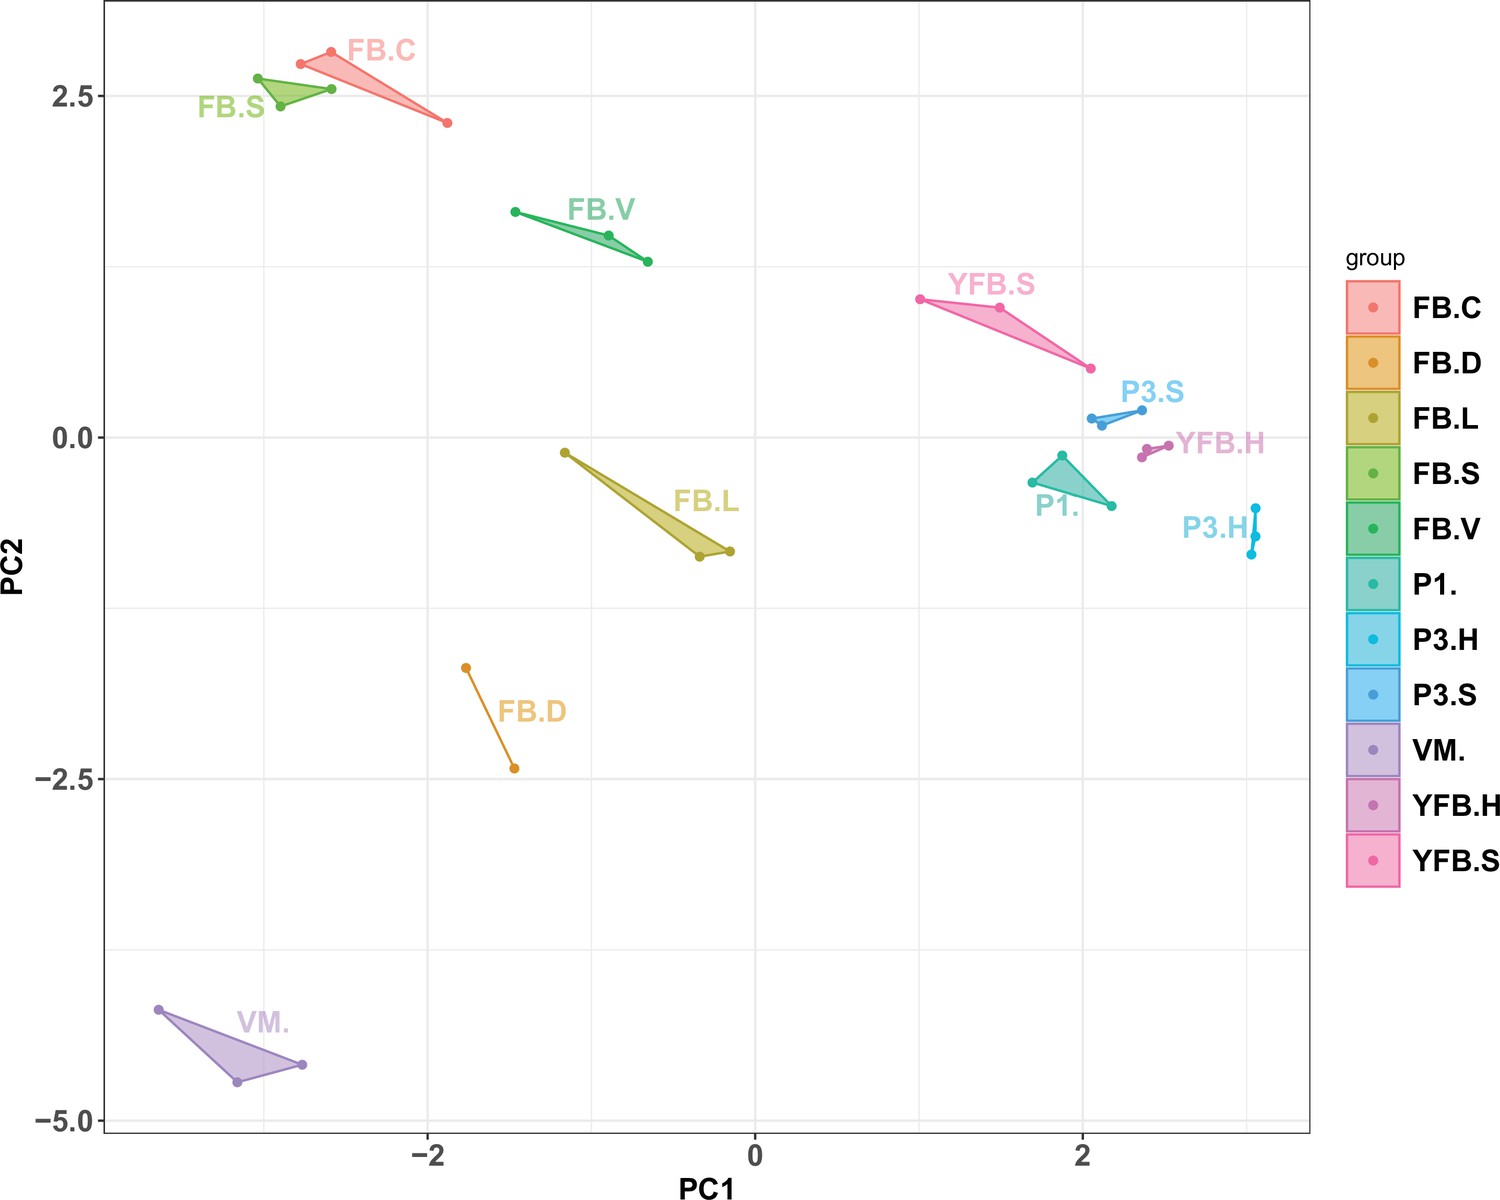
Principal component analysis based on AS ratio.
Replicates of stages clustered together, and therefore allele-specific expression showed a development- and tissue-specific pattern. VM: vegetative mycelium; P1: stage 1 primordium; P3: stage 3 primordium; YFB: young fruiting body, FB: fruiting body; H: cap (entire); C: cap trama (only the inner part, without lamellae or skin); L: lamellae; S: stipe; V: cuticle; D: dedifferentiated tissue of cap.
Figure 4—figure supplement 2
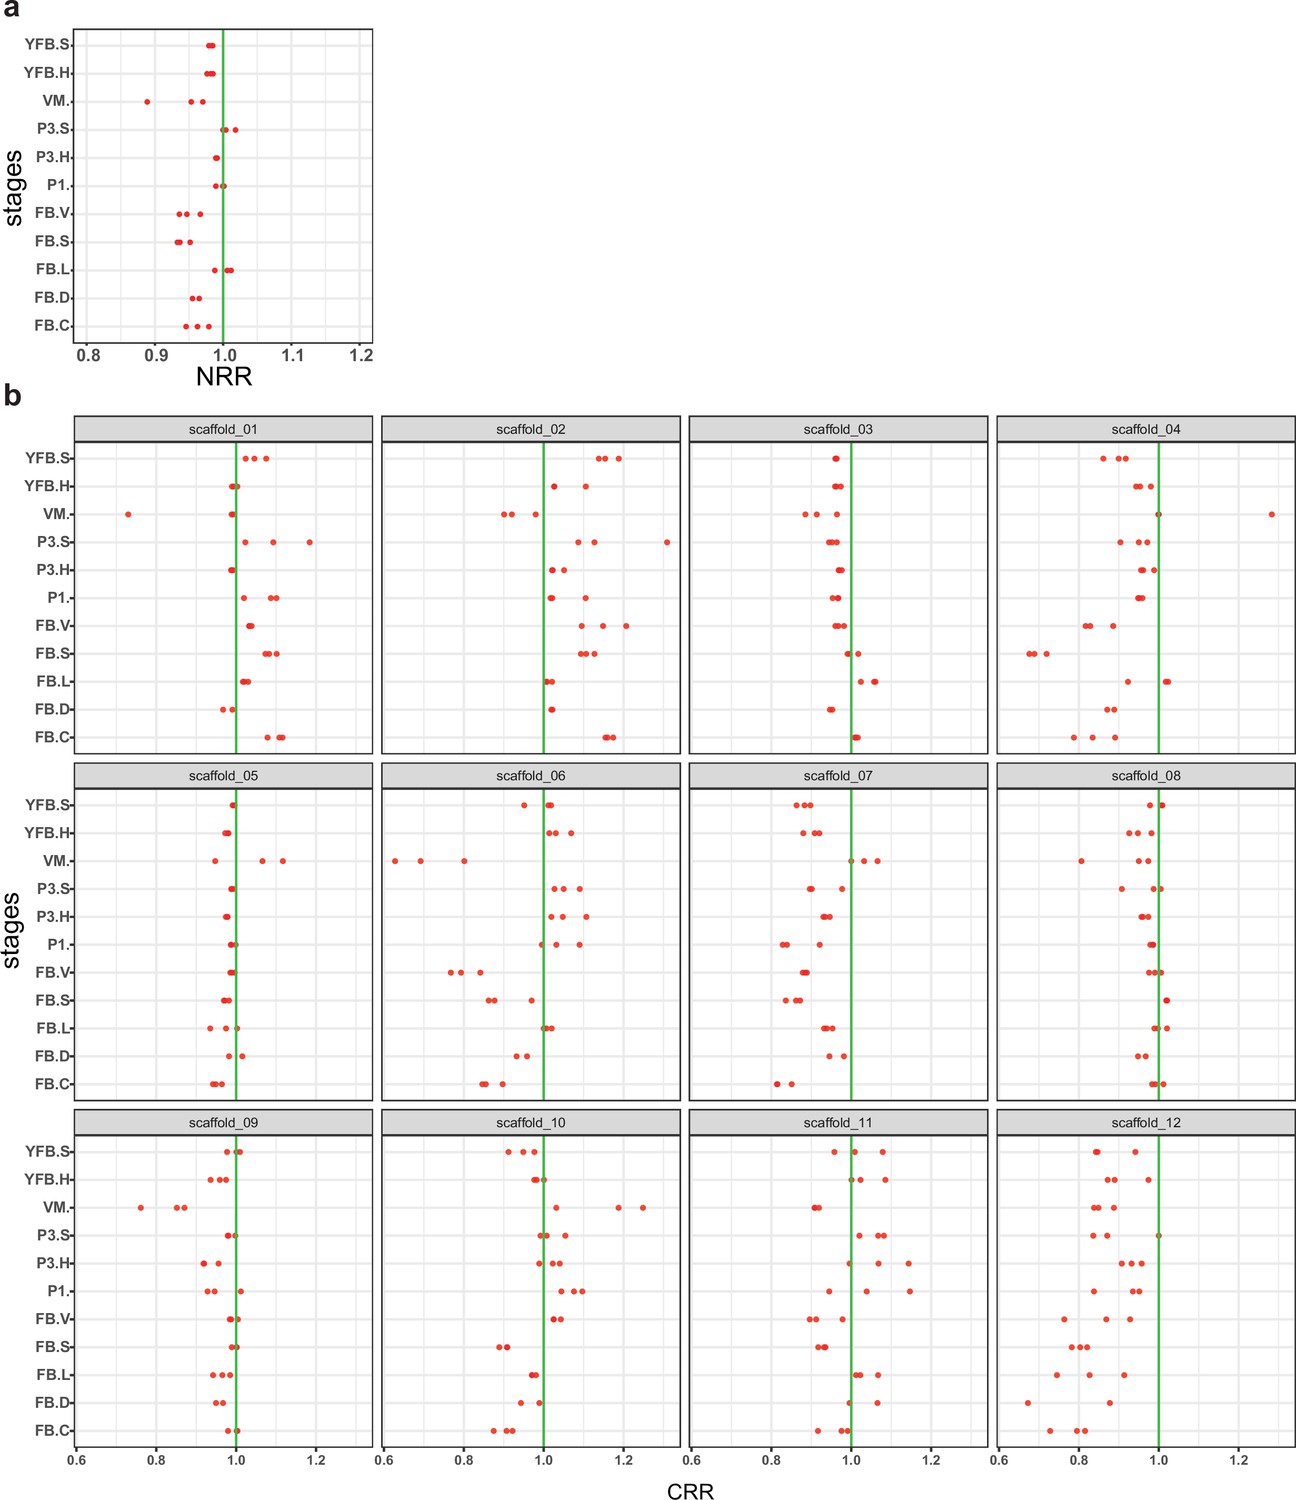
Allele-specific expression was not biased toward one nucleus or chromosome(s).
(a) The nuclear read ratio (NRR, the contribution of nuclei to the total expression) across stages and tissues. (b) Chromosomal read ratio (CRR, the contribution of nuclei to the expression of scaffolds) across stages and tissues. Red dots represent the biological replicates separately. A slight dominance of PC9 was observable (mean NRR across samples 0.97; max difference 12.5%). Values smaller than one mean the dominance of the PC9 nucleus over PC15 while the opposite marks the dominance of PC15. VM: vegetative mycelium; P1: stage 1 primordium; P3: stage 3 primordium; YFB: young fruiting body, FB: fruiting body; H: cap (entire); C: cap trama (only the inner part, without lamellae or skin); L: lamellae; S: stipe; V: cuticle; D: dedifferentiated tissue of cap.
Figure 5
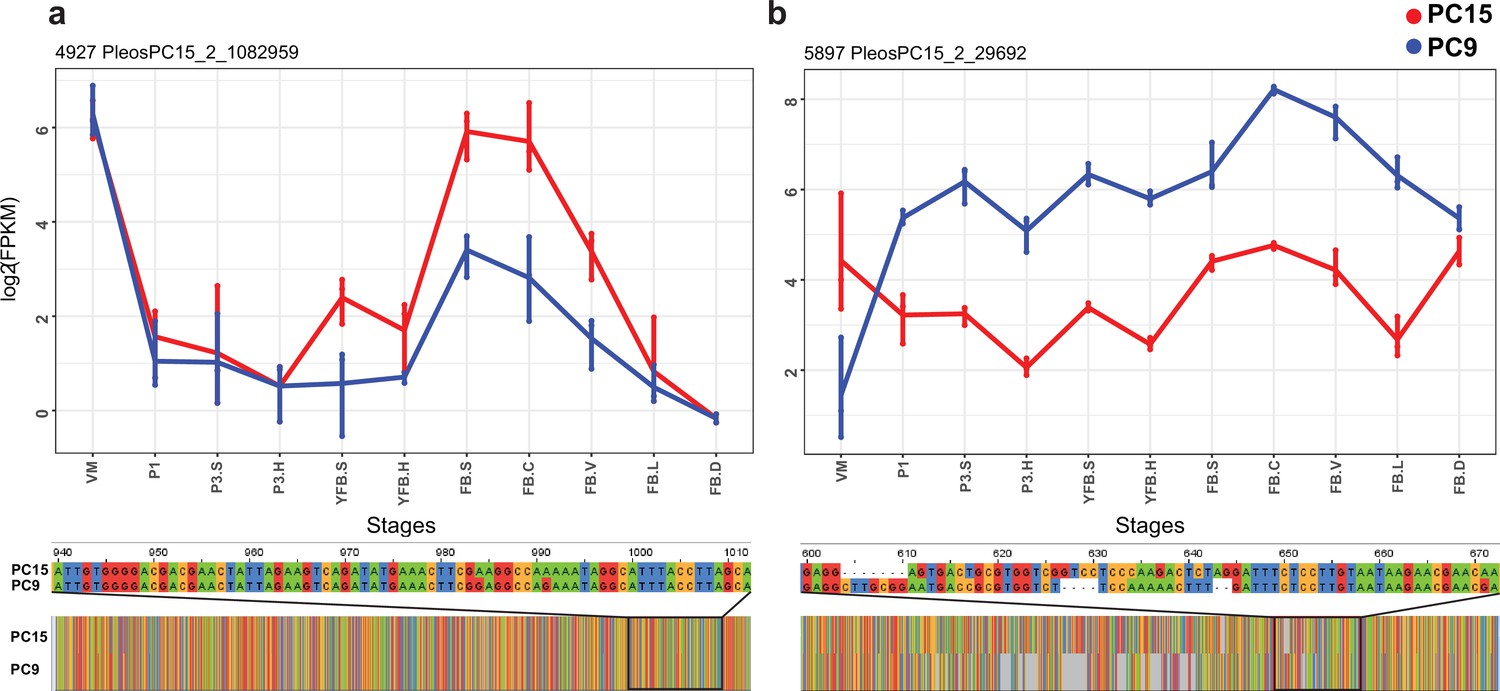
Examples of allele-specific expression (ASE) during fruiting body formation of Pleurotus ostreatus.
Expression level (log2 transformed fragments per kilobase of transcript per million mapped reads [FPKM]) from the two nuclei are colored with blue (PC9) and red (PC15). P. ostreatus gene- and protein IDs (PleosPC15_2) are displayed in each plot as a title. (a) Hydrophobin; (b) UstYa-like mycotoxin biosynthesis protein genes. Differences in the upstream gene regions are shown under the plots. VM: vegetative mycelium; P1: stage 1 primordium; P3: stage 3 primordium; YFB: young fruiting body, FB: fruiting body; H: cap (entire); C: cap trama; L: lamellae; S: stipe; V: cuticle; D dedifferentiated tissue of cap.
Figure 6 with 1 supplement
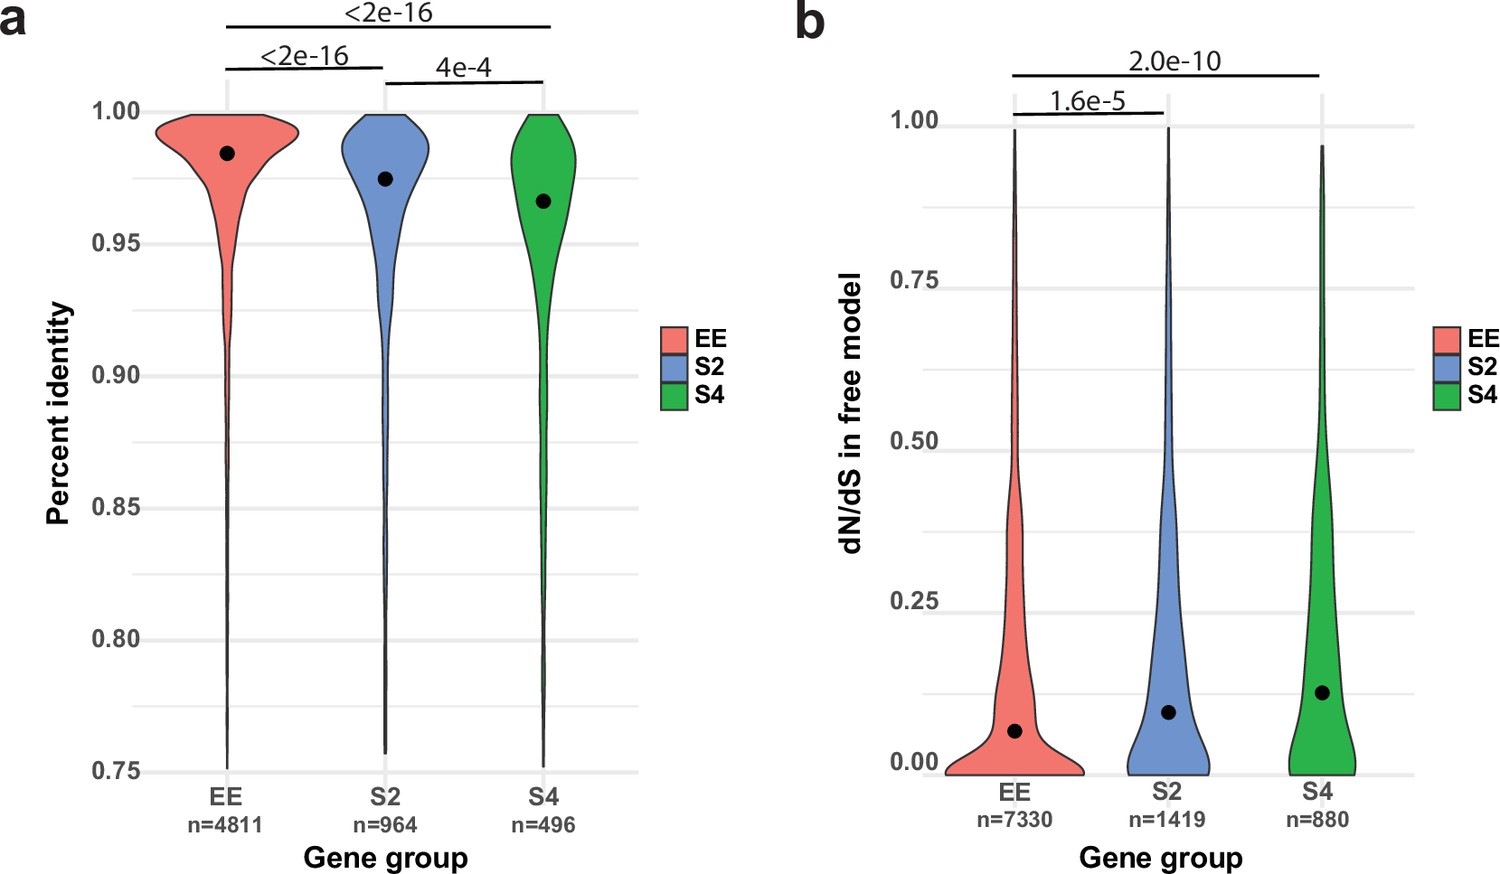
Allele-specific expression (ASE) may arise from cis-regulatory divergence.
(a) Percent sequence identity between the 1 kb upstream regions of PC15 and PC9 genes. (b) dN/dS distribution for ASE (ASE with twofold change [S2] and ASE with fourfold change [S4]) and equally expressed (EE) genes under the free model in CodeML.
Figure 6—figure supplement 1
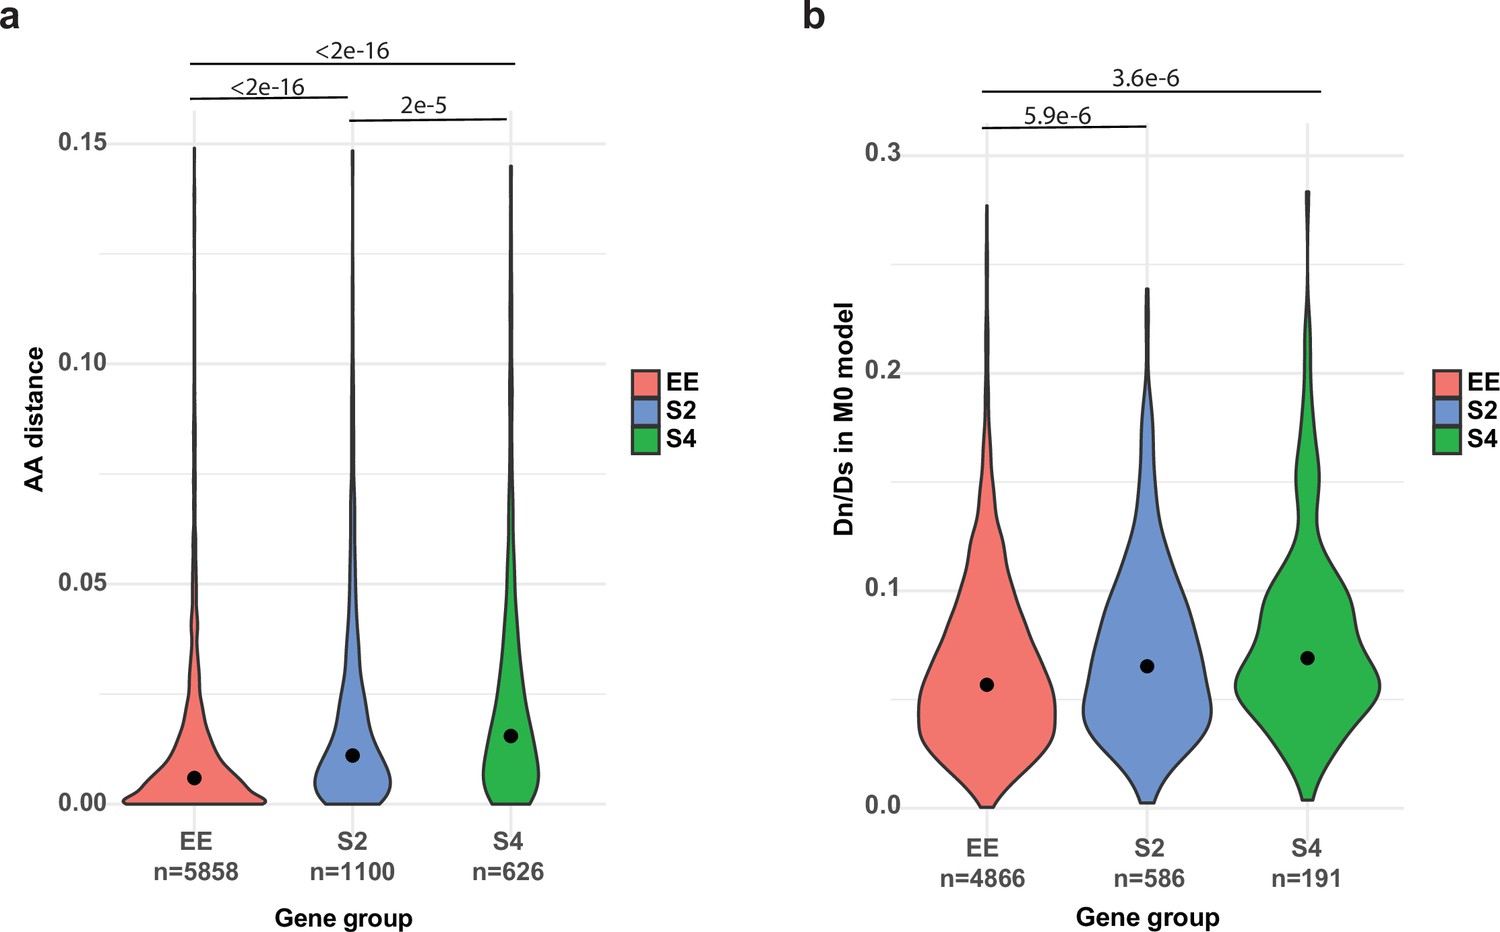
Comparison of genes with allele-specific expression (ASE) or equally expressed (EE).
(a) Maximum likelihood amino acid distances between PC15 and PC9 proteins (model = WAG). (b) dN/dS distribution for the three gene groups under the M0 model in CodeML. S2 and S4: genes with ASE at least in one stage with two- (S2) or fourfold change (S4). Lines and p-values (<1e-3) represent the pairwise comparison of Nemenyi post hoc test of the Kruskal–Wallis test.
Figure 7 with 1 supplement
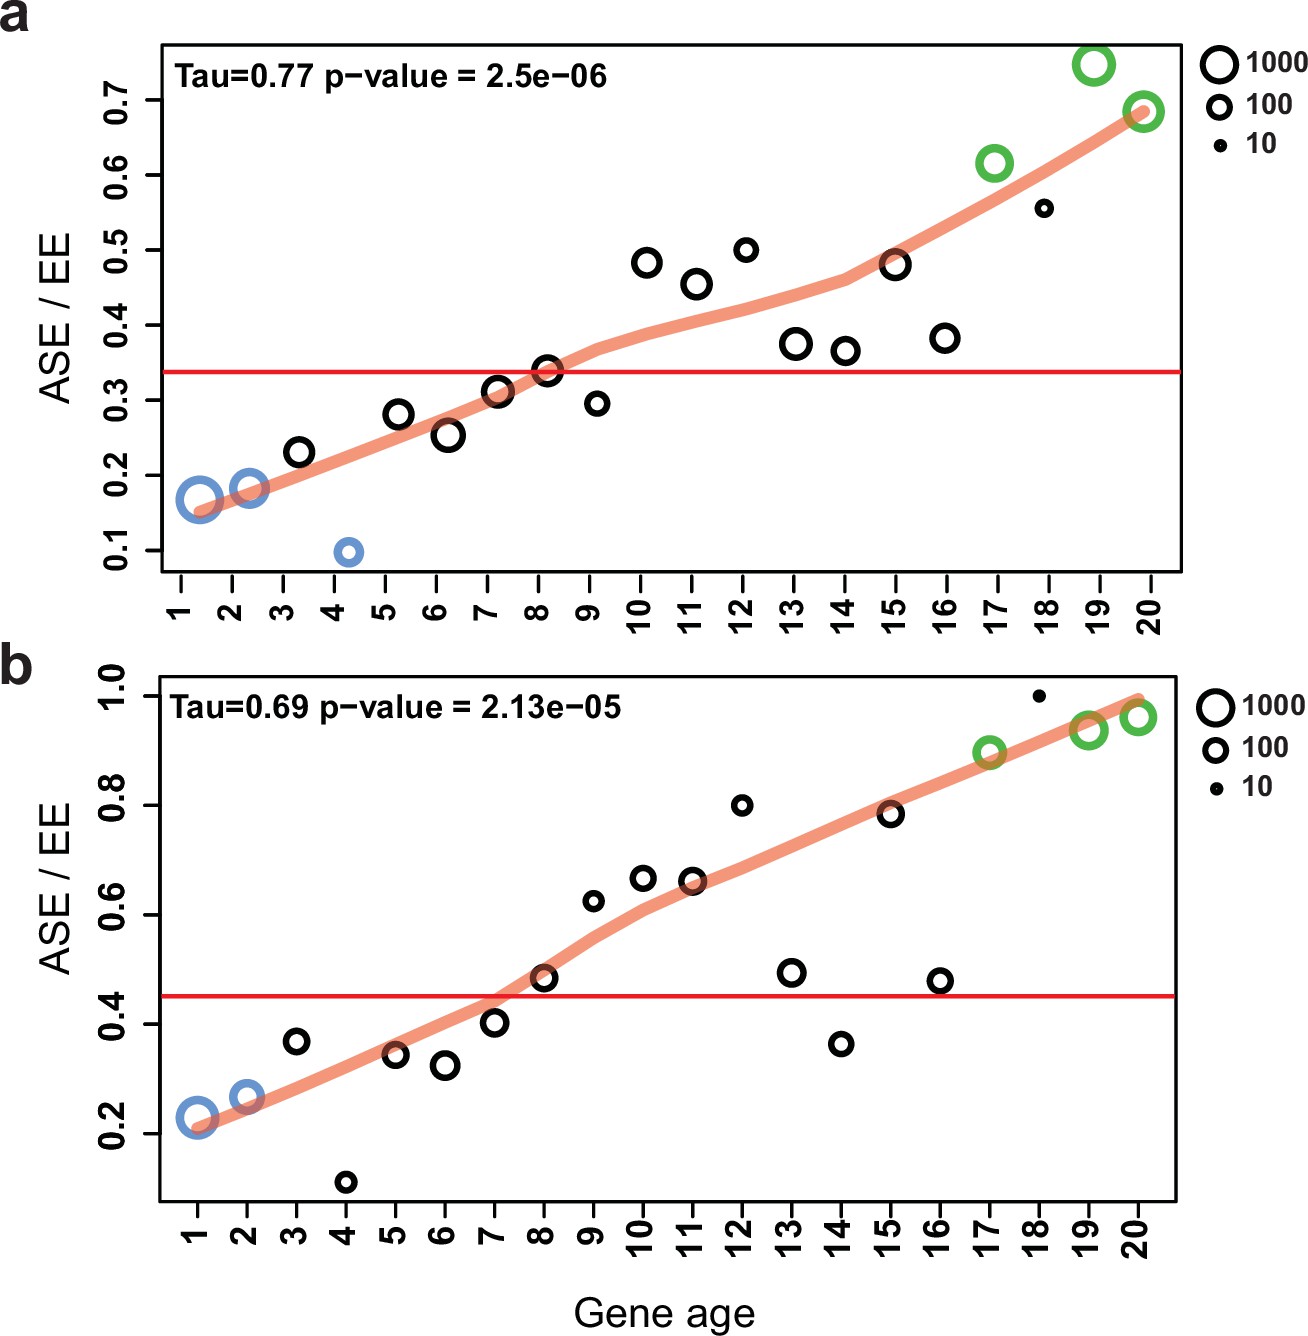
Allele-specific expression (ASE) genes are enriched among young genes.
The proportion of ASE shows a significant tendency toward higher values (Mann–Kendall statistics) across gene ages in the case of (a) all genes and (b) developmentally expressed genes (fold change [FC] > 4). The horizontal red line represents the ratio of all ASE/equally expressed (EE) genes, while significant differences from the background (Fisher’s exact test p-value<0.001) are shown with green (overrepresentation) and blue (underrepresentation). The size of circles represents the number of proteins (log10 transformed).
Figure 7—figure supplement 1
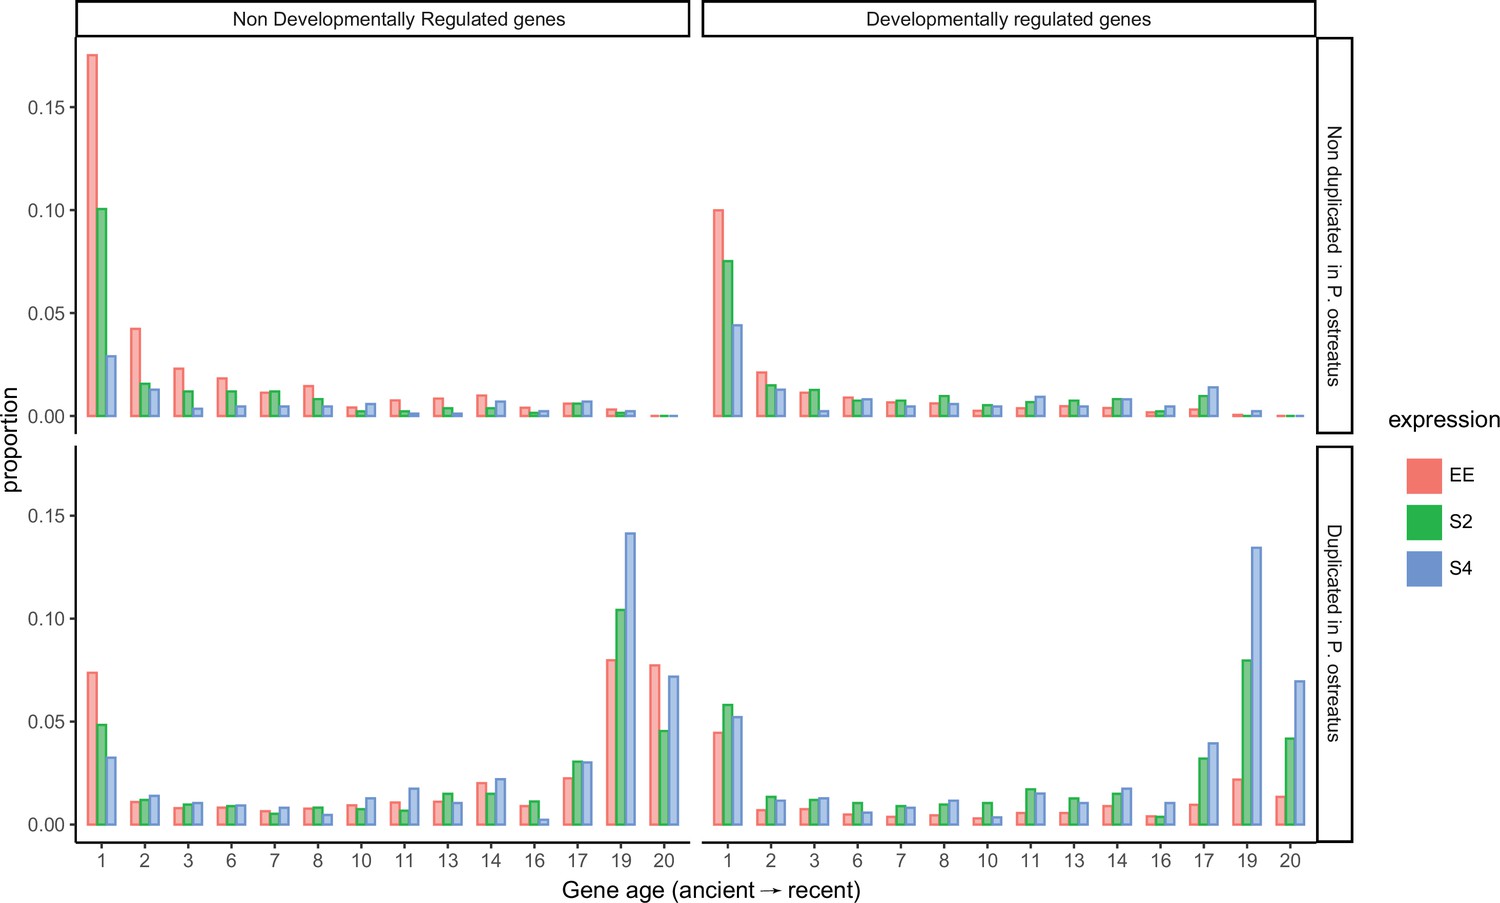
Distribution of genes across gene ages (1 representing the oldest and 20 the youngest), broken down by allele-specific expression (ASE), developmental regulation, and duplication in Pleurotus ostreatus.
Bars represent the proportions of gene numbers relative to the total gene number of a group (equally expressed [EE], ASE with twofold change [S2], or ASE with fourfold change [S4]). NDR: non-developmentally expressed gene; DR: developmentally expressed gene.
Figure 8 with 3 supplements
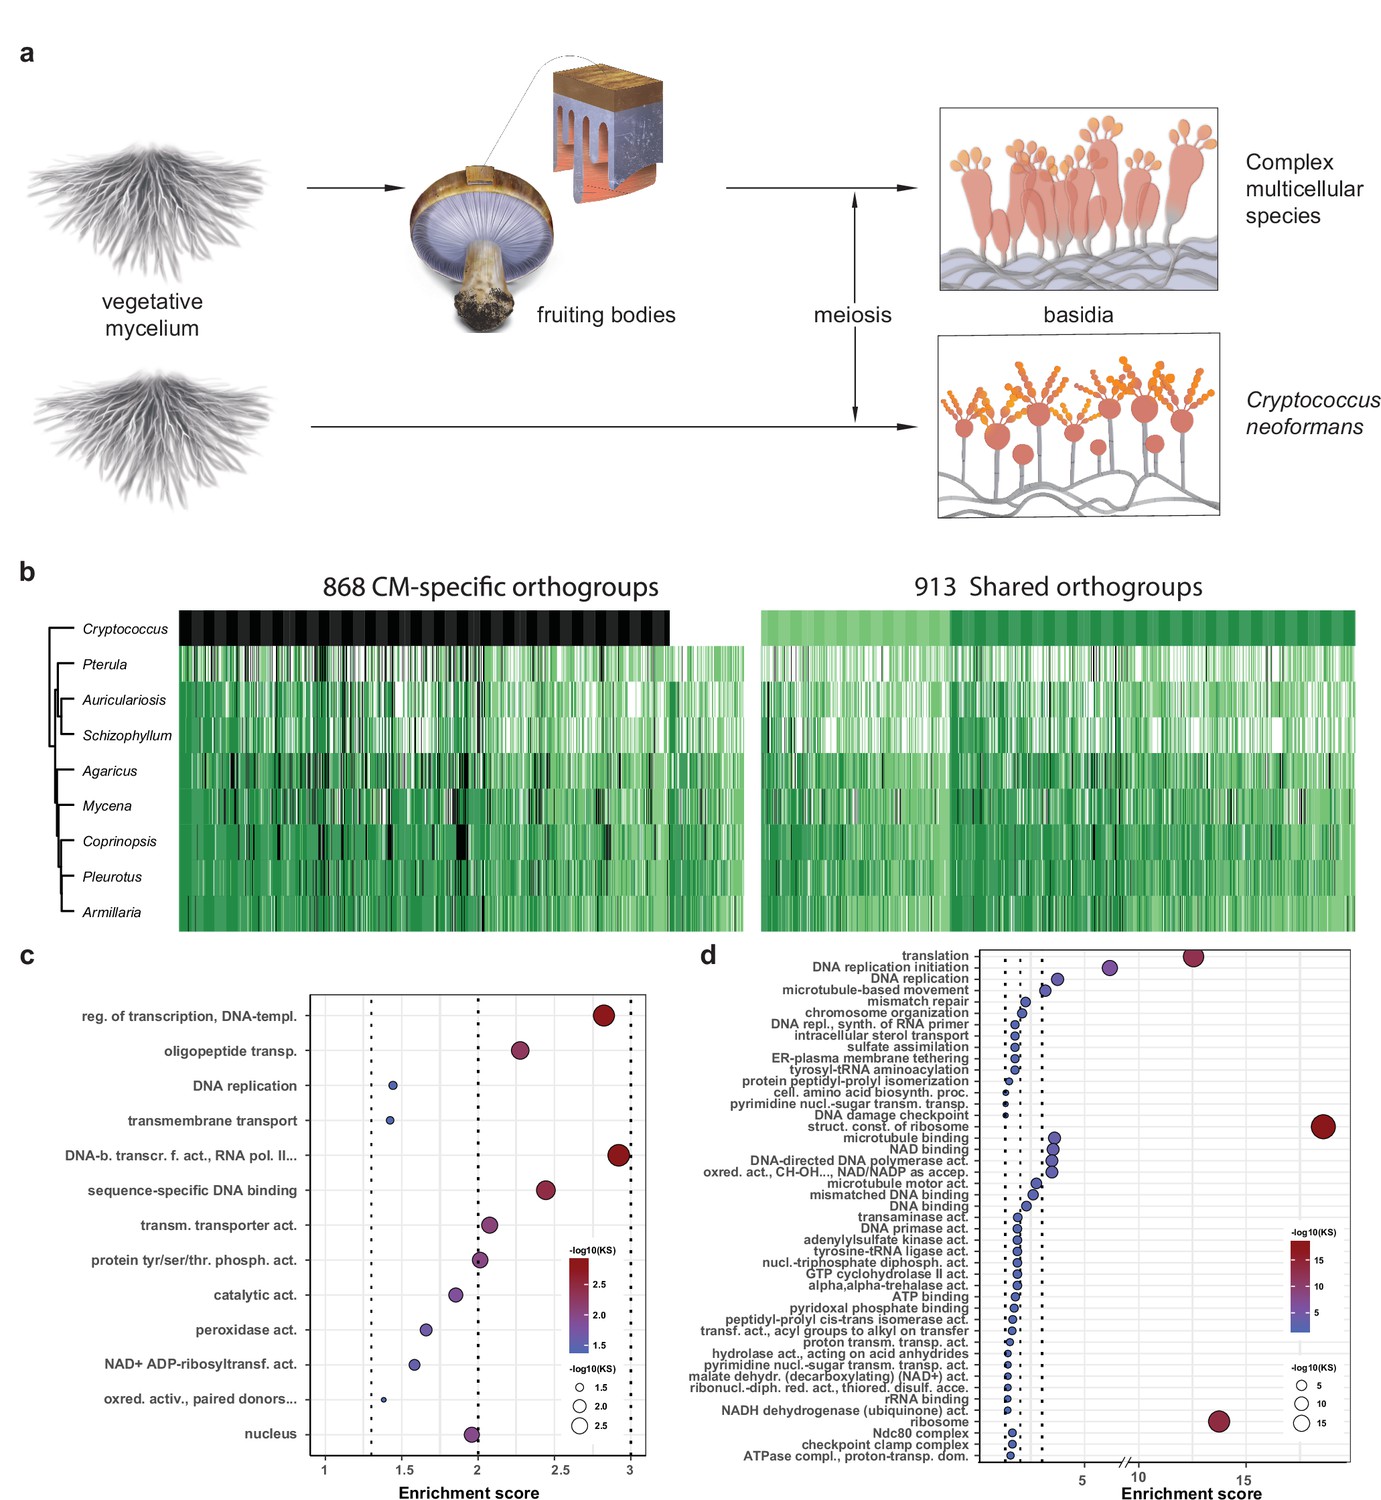
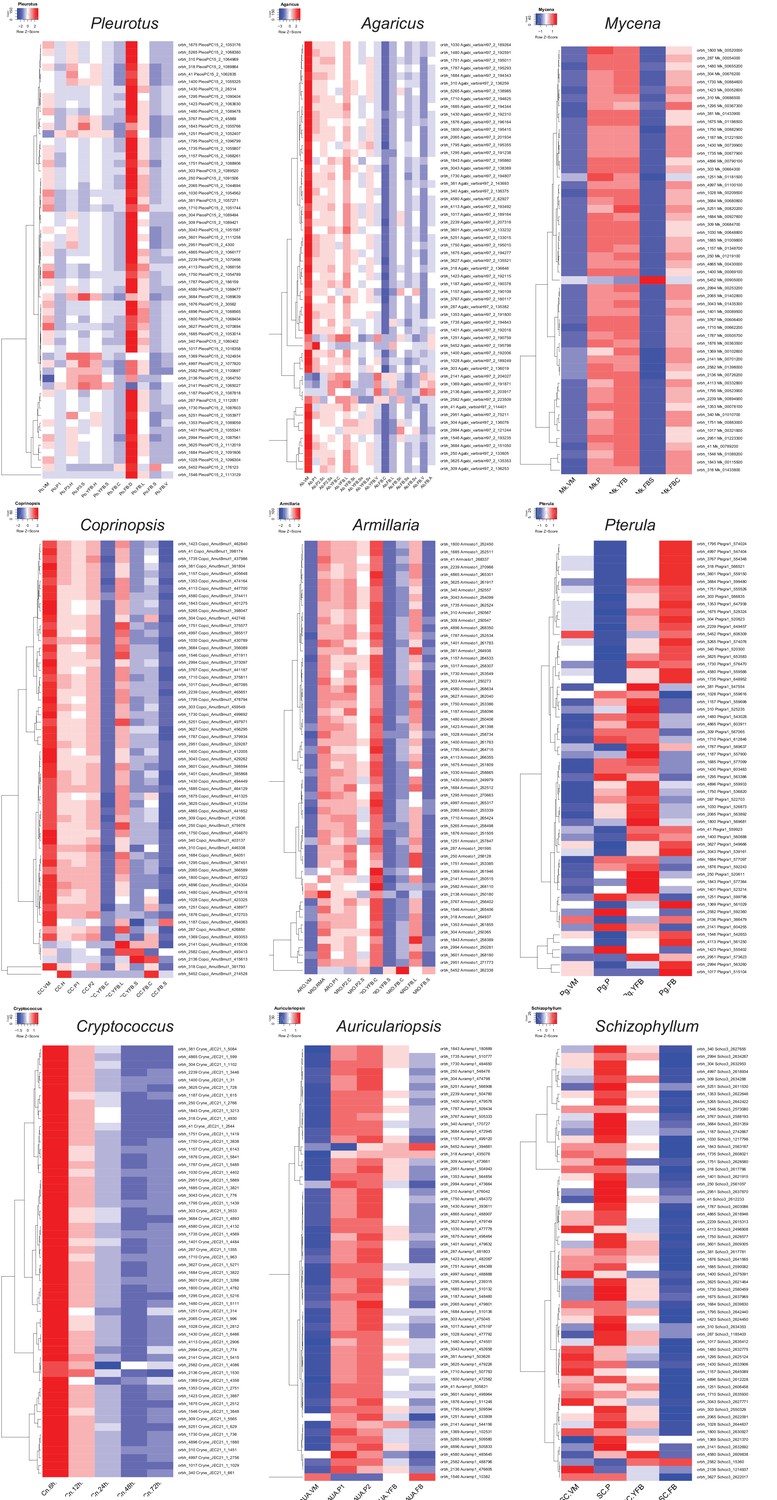
Conserved developmental expression in complex multicellularity (CM) fungi.
(a) Schematic representation of complex multicellular and simple development and the use of C. neoformans as a minimal model of sexual development in the Basidiomycota. (b) Distribution of genes and their developmental expression across the nine species. Dark and light green refers to genes with developmental regulation at fold change > 4 and 2, respectively, whereas white and black denote nondevelopmentally expressed and missing genes, respectively. Dendrogram was inferred in a hierarchical clustering based on expression categories. Gene Ontology (GO) enrichment for (c) CM-specific and (d) shared orthogroups. KS means the p-value of Kolmogorov–Smirnov test implemented in the R package ‘topGO.’ On panels (c) and (d), cutoff lines (dashed line) are drawn at enrichment scores corresponding to p=0.05, p=0.01, and p=0.001 (from left to right). GO terms are ordered by Kolmogorov–Smirnov p-values. See also Supplementary file 5a and b for GO enrichment details.
Figure 8—figure supplement 1
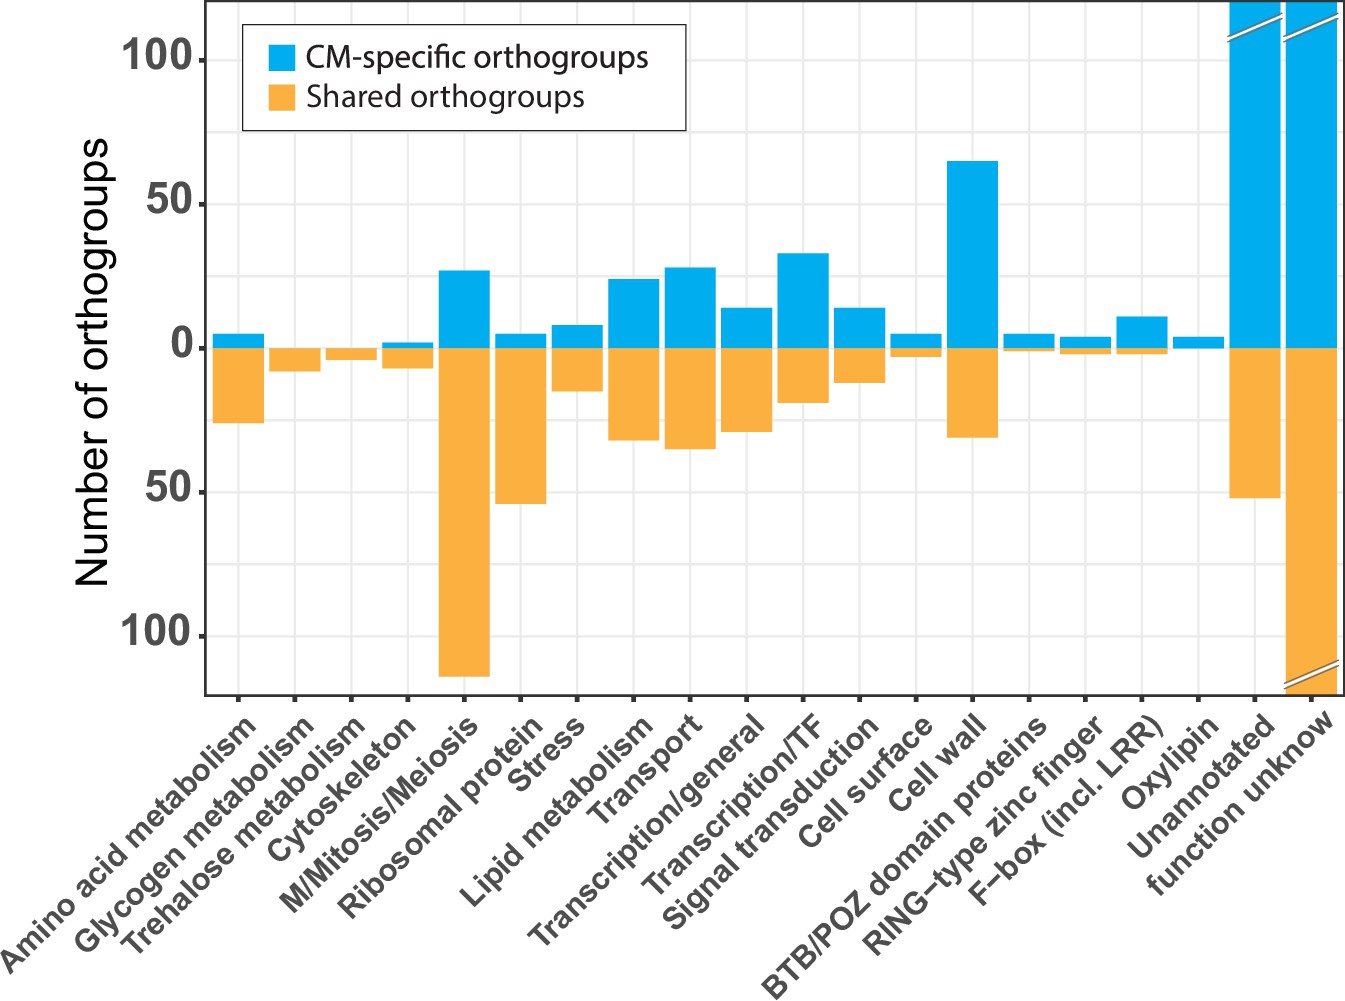
Functional categories across the conserved developmental orthogroups.
Number of conserved orthogroups in different functional categories.
Figure 8—figure supplement 2
Expression of meiotic genes in the nine species.
VM: vegetative mycelium; P1: stage 1 primordium; P3: stage 3 primordium; YFB: young fruiting body, FB: fruiting body; H: cap (entire); C: cap trama (only the inner part, without lamellae or skin); L: lamellae; S: stipe; V: cuticle; D: dedifferentiated tissue of cap; A: annulus. For stage details, see Supplementary file 4c.
Figure 8—figure supplement 3
Expression of ribosomal proteins in the nine species.
VM: vegetative mycelium; P1: stage 1 primordium; P3: stage 3 primordium; YFB: young fruiting body; ‘B: fruiting body; H: cap (entire); C: cap trama (only the inner part, without lamellae or skin); L: lamellae; S: stipe; V: cuticle; D: dedifferentiated tissue of cap; A: annulus. For stage details, see Supplementary file 4c.
Figure 9
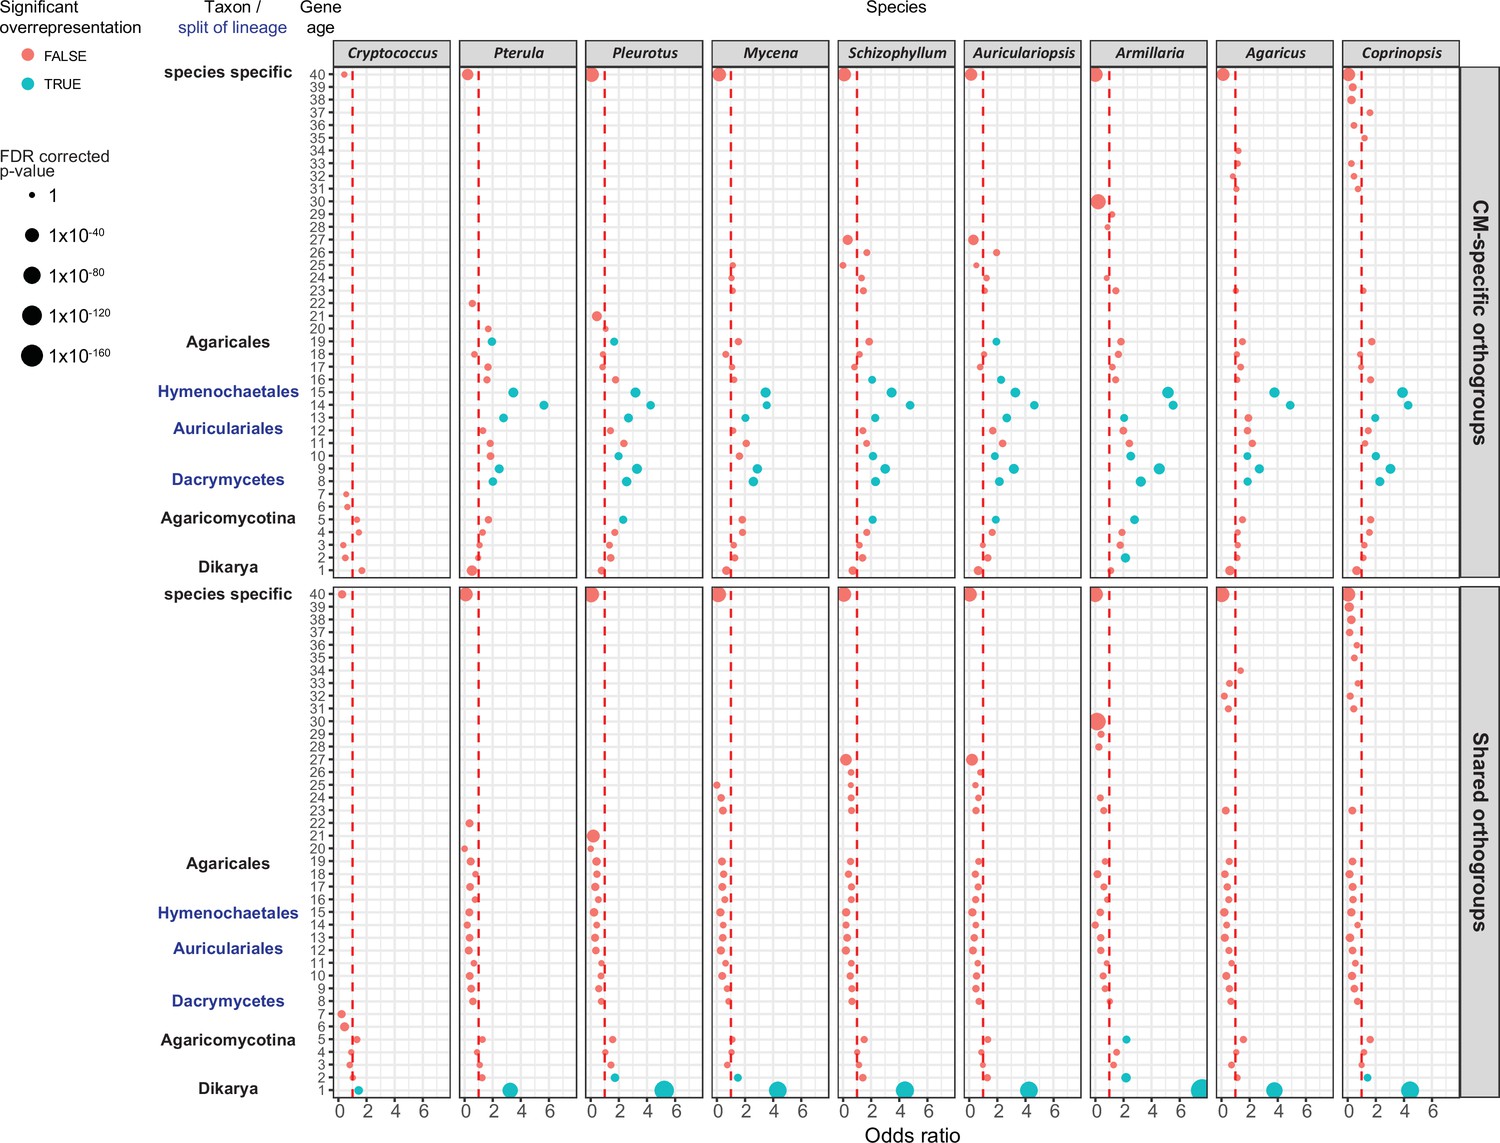
Gene age enrichment for shared and complex multicellularity (CM)-specific developmentally expressed orthogroups.
CM-specific orthogroups are significantly enriched in the most recent common ancestors of lineages in which the first complex structures emerged (see also Figure 1). Y-axis represents relative gene age (for definition of gene ages, see Dryad: Figure D1). X-axis displays the odds ratio of the enrichment of developmentally expressed orthogroups relative to all orthogroups in a given age category based on Fisher’s exact test. If the odds ratio exceeds 1 (red dotted line), developmentally expressed orthogroups are overrepresented in that gene age. Significant (FDR p<0.05) overrepresentation is indicated by blue. The size of circles corresponds to the FDR-corrected p-value of Fisher’s exact test.
Figure 10

Pipeline of RNA editing and allele-specific expression annotation.
Names of scripts available in Dryad (doi:https://doi.org.10.5061/dryad.5qfttdz5m) are displayed next to process boxes. VRS: variant read support; RS: read support; RVF: relative variant frequency.
Appendix 1—figure 1
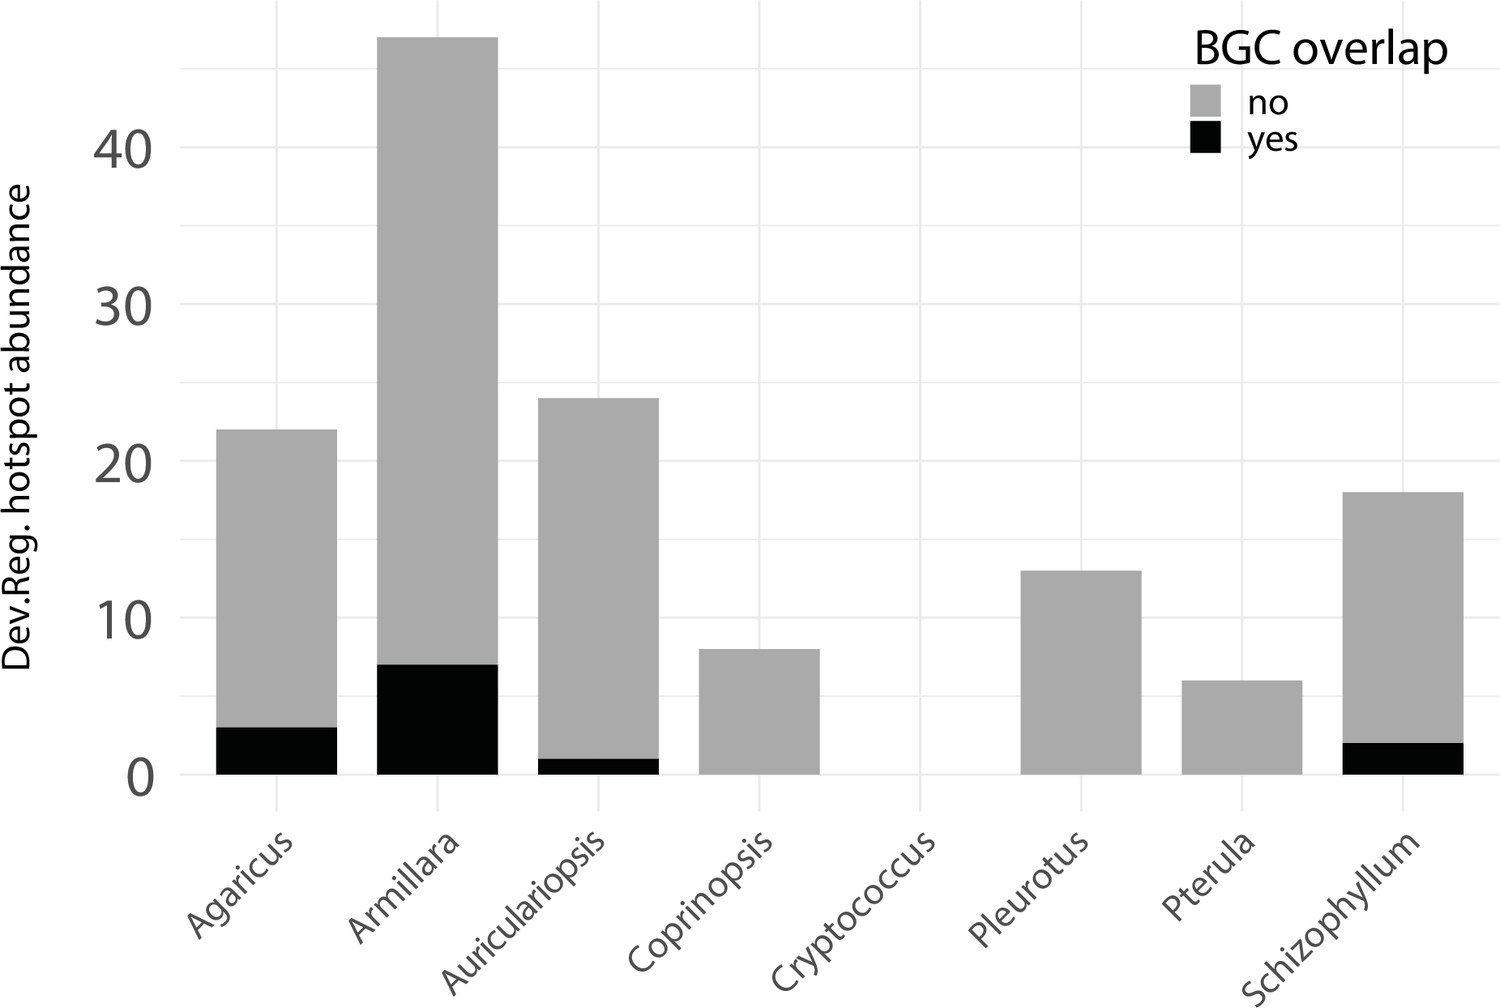
Developmentally expressed genes occasionally cluster together in genomic ‘hotspots.’.
A bar chart summarizing the number of hotspots detected per genome (total = 153) and the degree of overlap between hotspots and predicted biosynthetic gene clusters (BGCs).
Appendix 1—figure 2
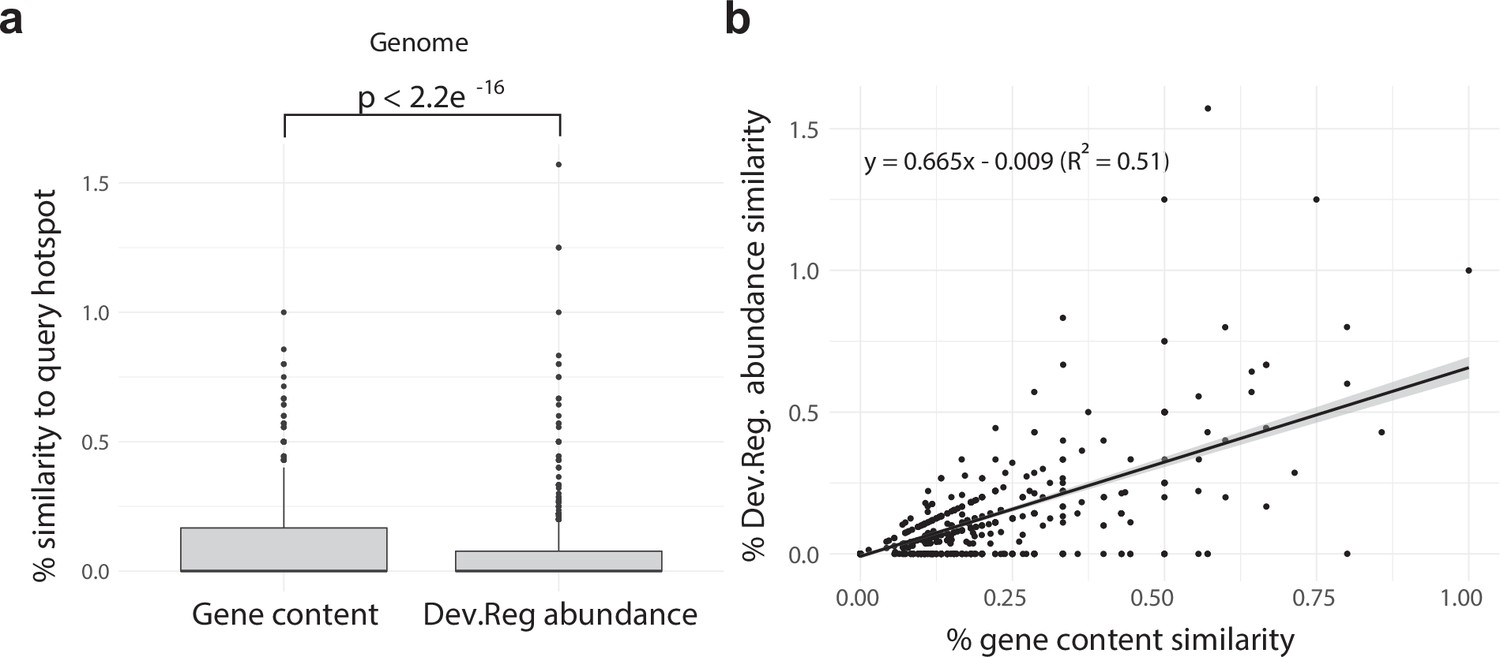
Developmentally expressed genes occasionally cluster together in genomic ‘hotspots.’.
(a) A box-and-whisker plot summarizing the distribution of % gene content conservation and the distribution of % Dev.Reg. abundance conservation of all 153 hotspots when searched for in genomes other than the one in which they are found. Significance between distributions determined by the Wilcoxon rank-sum test. (b) Scatterplot and linear regression describing the relationship between the % gene content conservation and % Dev.Reg. abundance conservation of each of the 153 hotspots when searched for in genomes other than the one in which they are found (number of observations = 153 hotspot queries × 8 target genomes). % Dev.Reg. abundance conservation may exceed 100% if more Dev.Reg. genes are found in target regions as compared with query hotspot. The shaded region around the fitted regression line represents 95% confidence interval.
Appendix 2—figure 1
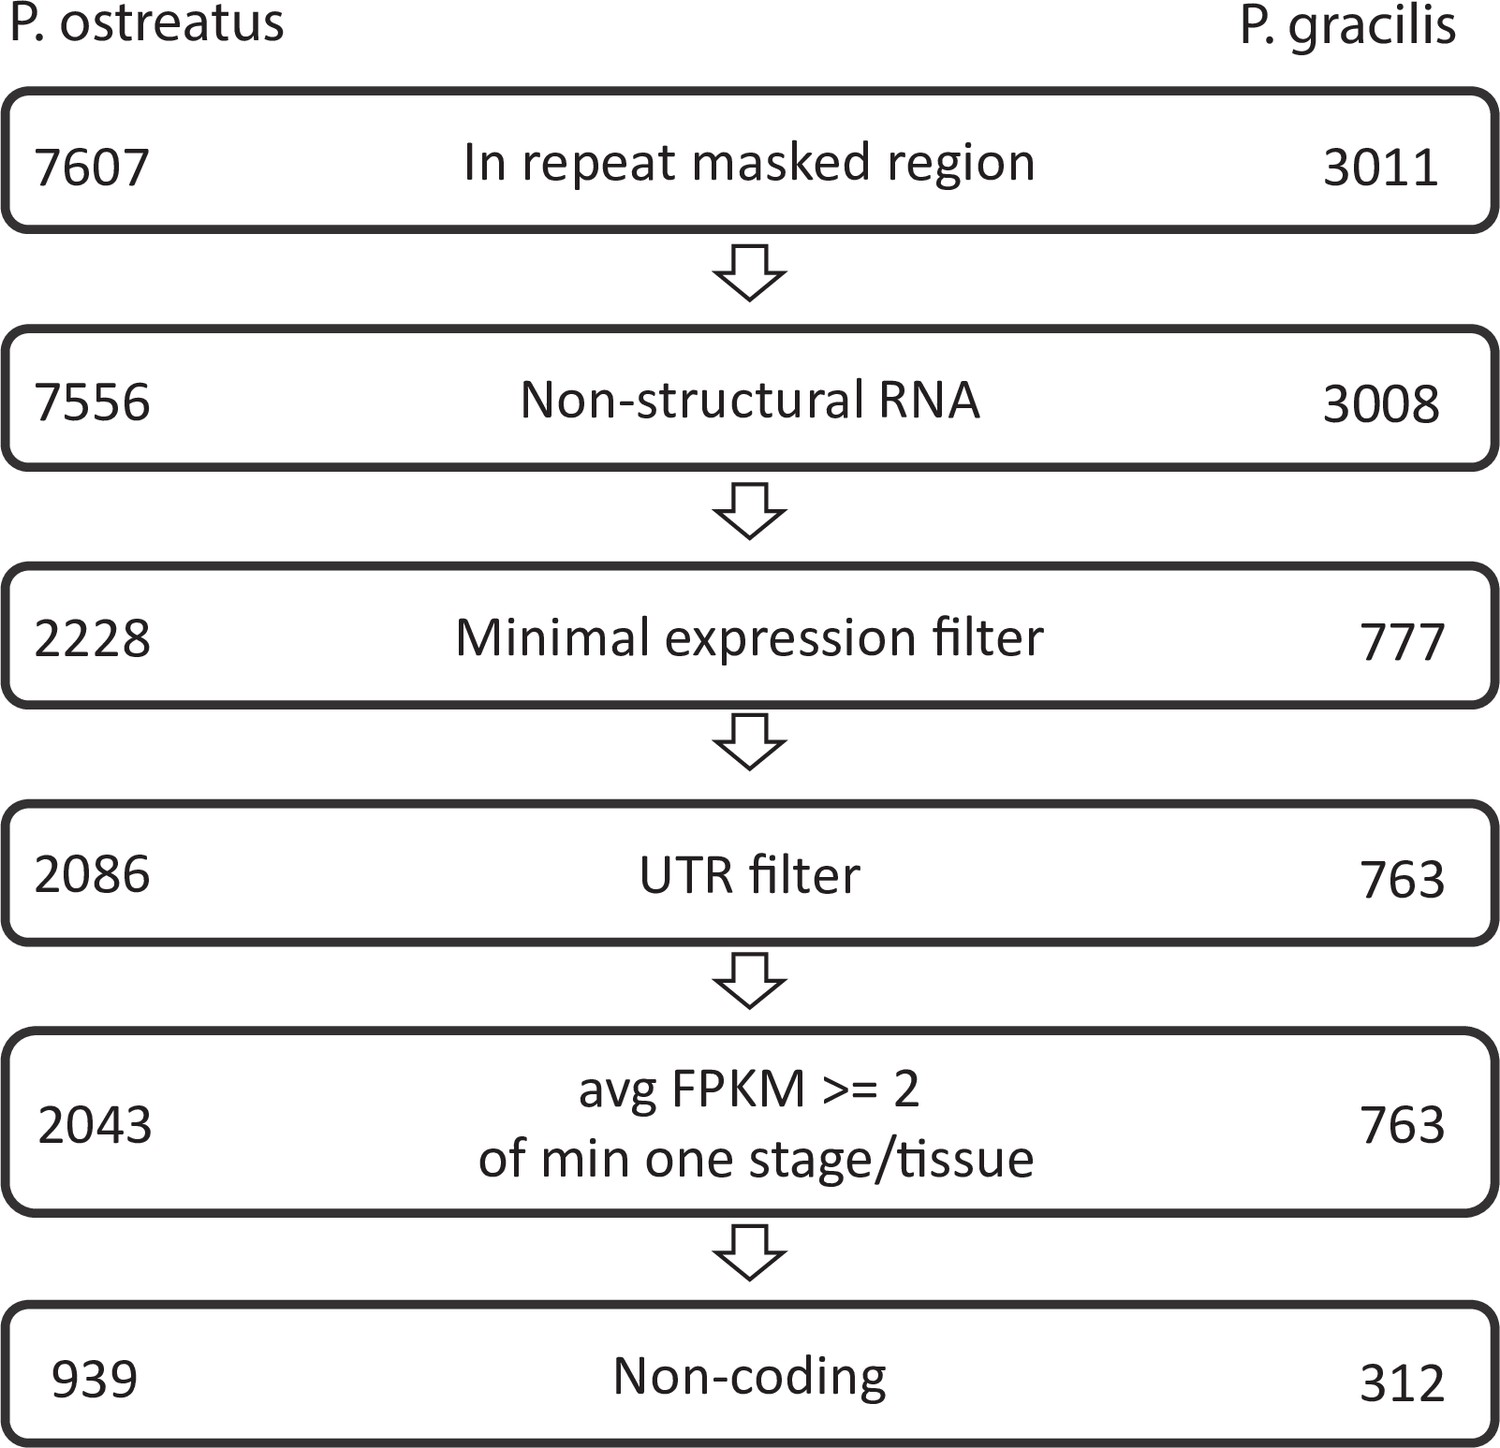
Pipeline of natural antisense transcripts.
Numbers represent the retained transcripts in each filtering step.
Appendix 2—figure 2

Length (a, b) and exon number (c, d) distribution of natural antisense transcripts (NATs) in Pleurotus ostreatus (a, c) and Pterula gracilis (b, d).
NATs were divided into putatively coding and noncoding categories using the default settings of CPC2 (Kang et al., 2017).
Appendix 2—figure 3
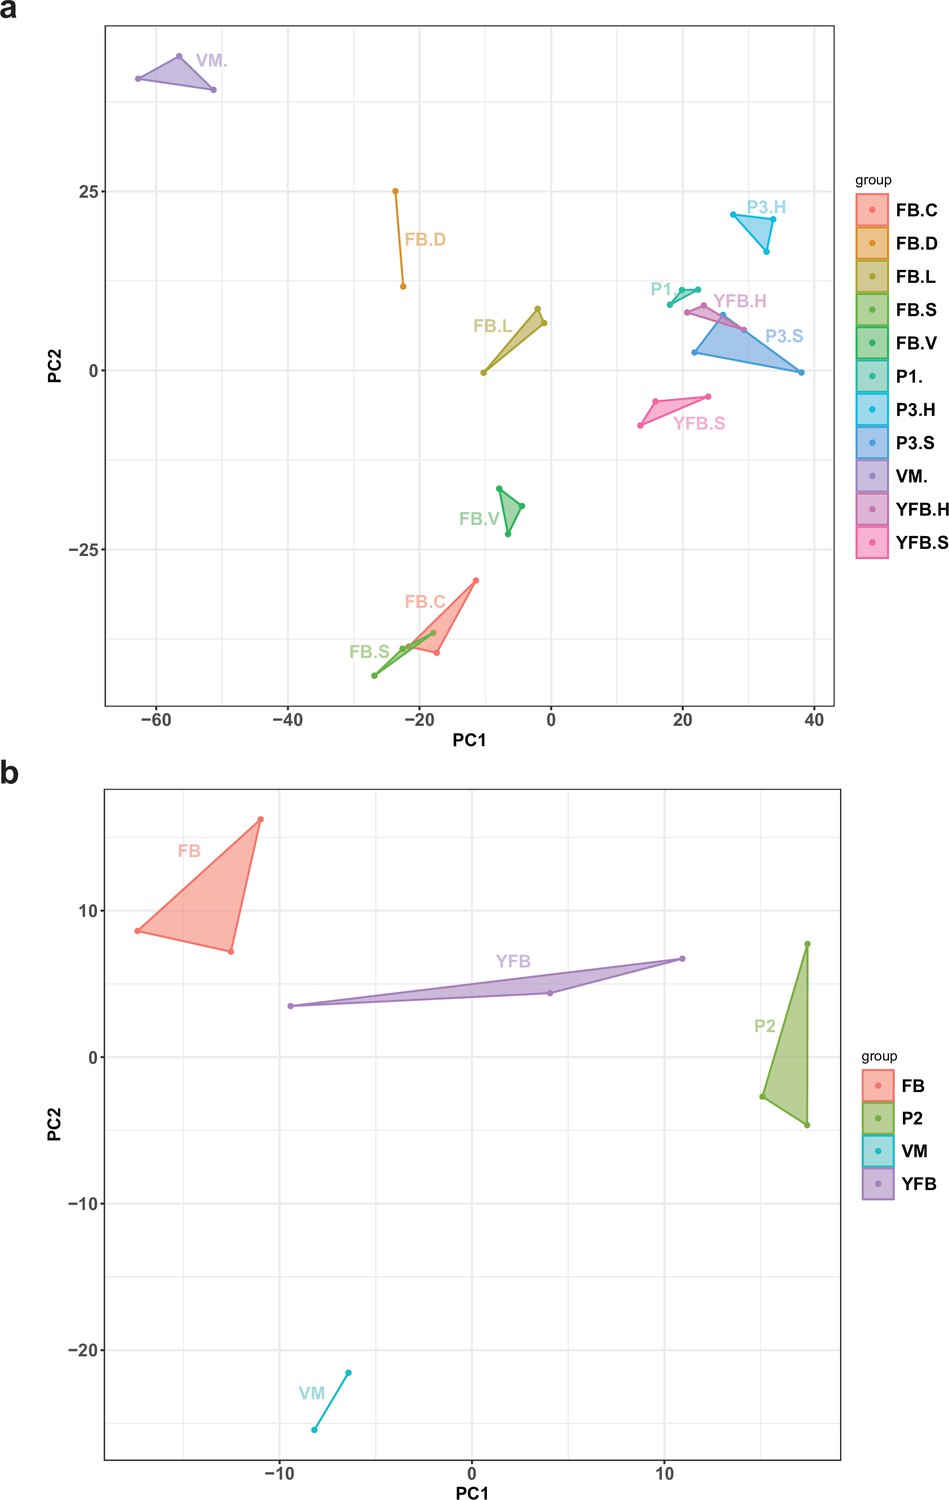
Principal component analysis (PCA) plot based on the expression of natural antisense transcripts detected in (a) Pleurotus ostreatus and (b) Pterula gracilis.
VM: vegetative mycelium; P1: stage 1 primordium; P3: stage 3 primordium; YFB: young fruiting body; FB: fruiting body; H: cap (entire); C: cap trama (only the inner part, without lamellae, or skin); L: lamellae; S: stipe; V: cuticle; D: dedifferentiated tissue of cap.
Appendix 2—figure 4
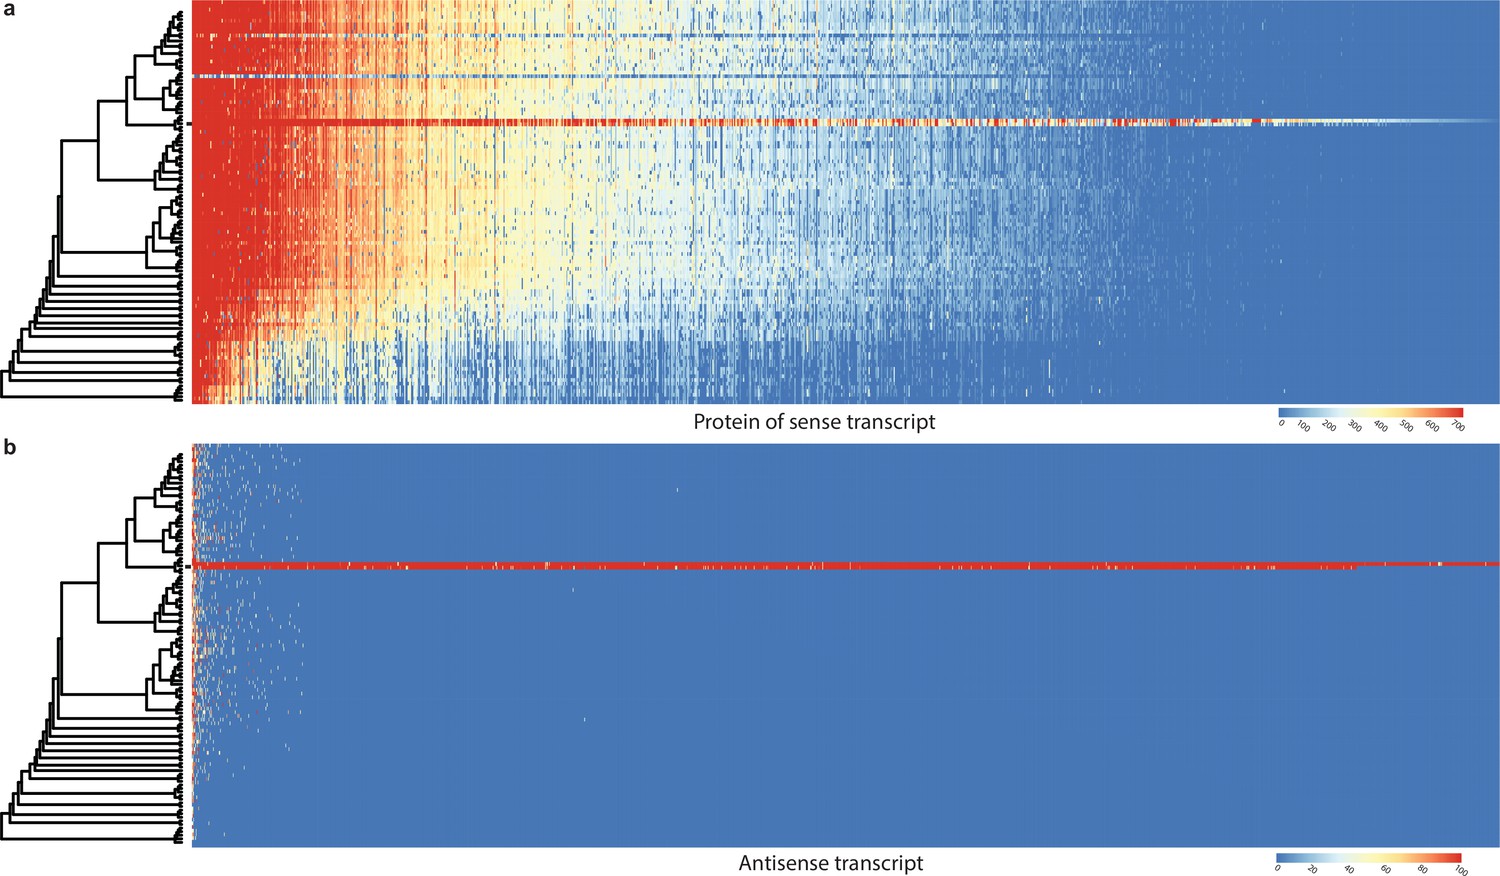
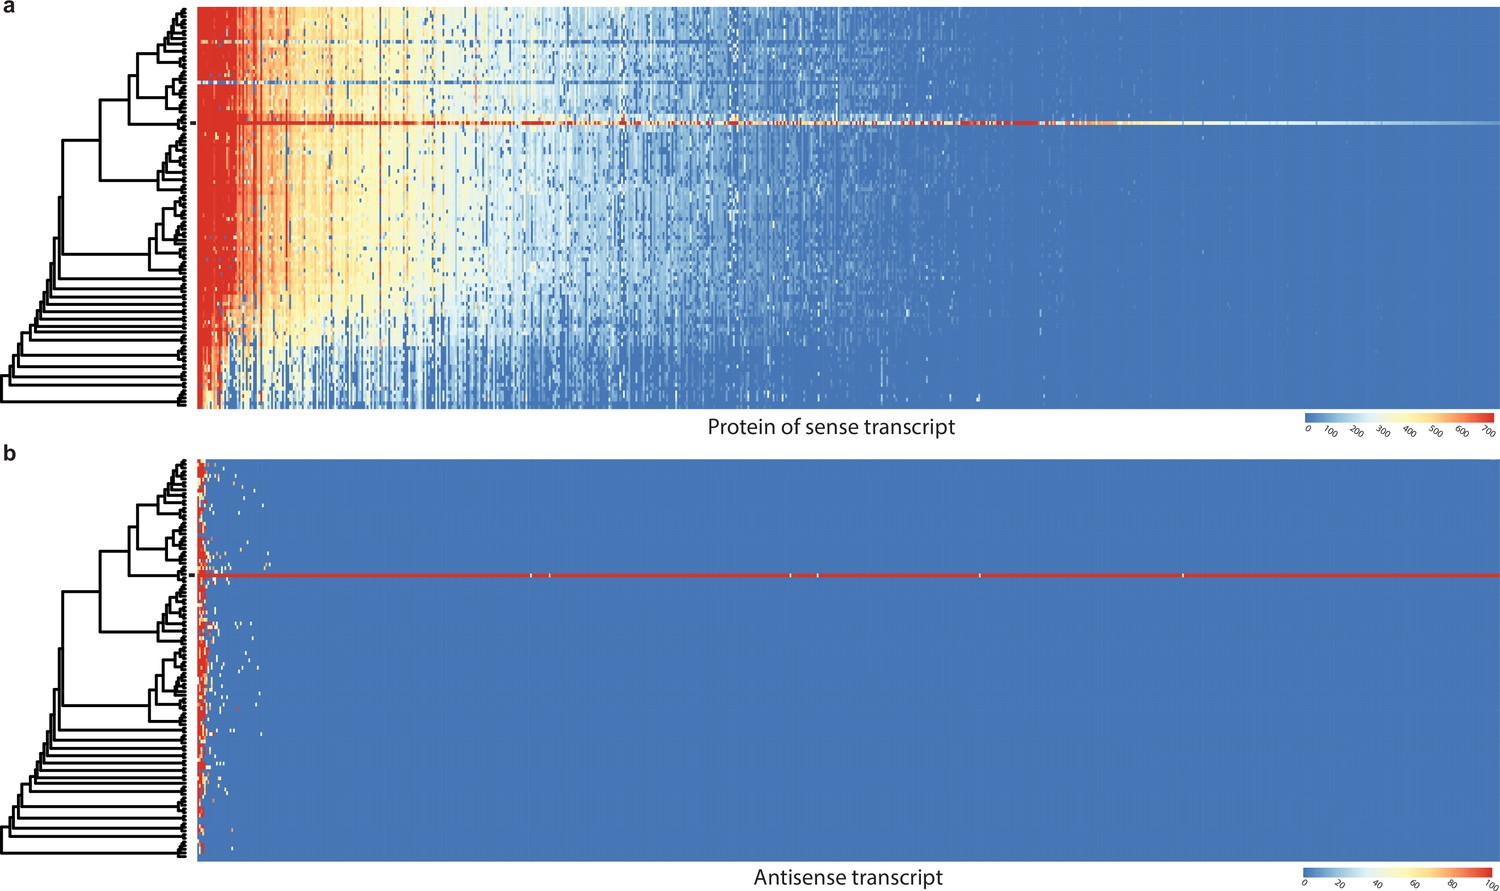
Conservation of sense genes and their natural antisense transcripts (NATs) of Pleurotus ostreatus across 109 species.
(a) Similarity of proteins of sense transcripts – having antisense transcripts – measured with –log10(e-value) from MMseqs search against the 109 species dataset. (b) Mapping score of antisense transcripts based on minimap2. Warmer color represents a higher similarity according to the scales. Black square denotes P. ostreatus. Rows represent the species while columns represent the antisense query transcripts (b) or proteins from sense transcripts (a). For a larger species tree, see Figure 1.
Appendix 2—figure 5
Conservation of sense genes and their natural antisense transcripts (NATs) of Pterula gracilis across 109 species.
(a) Similarity of proteins of sense transcripts – having antisense transcripts – measured with –log10(e-value) from MMseqs search against the 109 species dataset. (b) Mapping score of antisense transcripts based on minimap2. Warmer color represents a higher similarity according to the scales. Black square denotes Pt. gracilis. Rows represent the species while columns represent the antisense query transcripts (b) or proteins from sense transcripts (a). For a larger species tree, see Figure 1.
Appendix 2—figure 6

Expression pattern of 263 sense transcripts and their antisense transcripts that showed significant positive correlation (Pearson r ≥ 0.7, p<0.05) in Pleurotus ostreatus.
Corresponding lines of the heatmaps contain sense and antisense transcript pairs. VM: vegetative mycelium; P1: stage 1 primordium; P3: stage 3 primordium; YFB: young fruiting body; FB: fruiting body; H: cap (entire); C: cap trama (only the inner part, without lamellae, or skin); L: lamellae; S: stipe; V: cuticle; D: dedifferentiated tissue of cap.
Appendix 2—figure 7
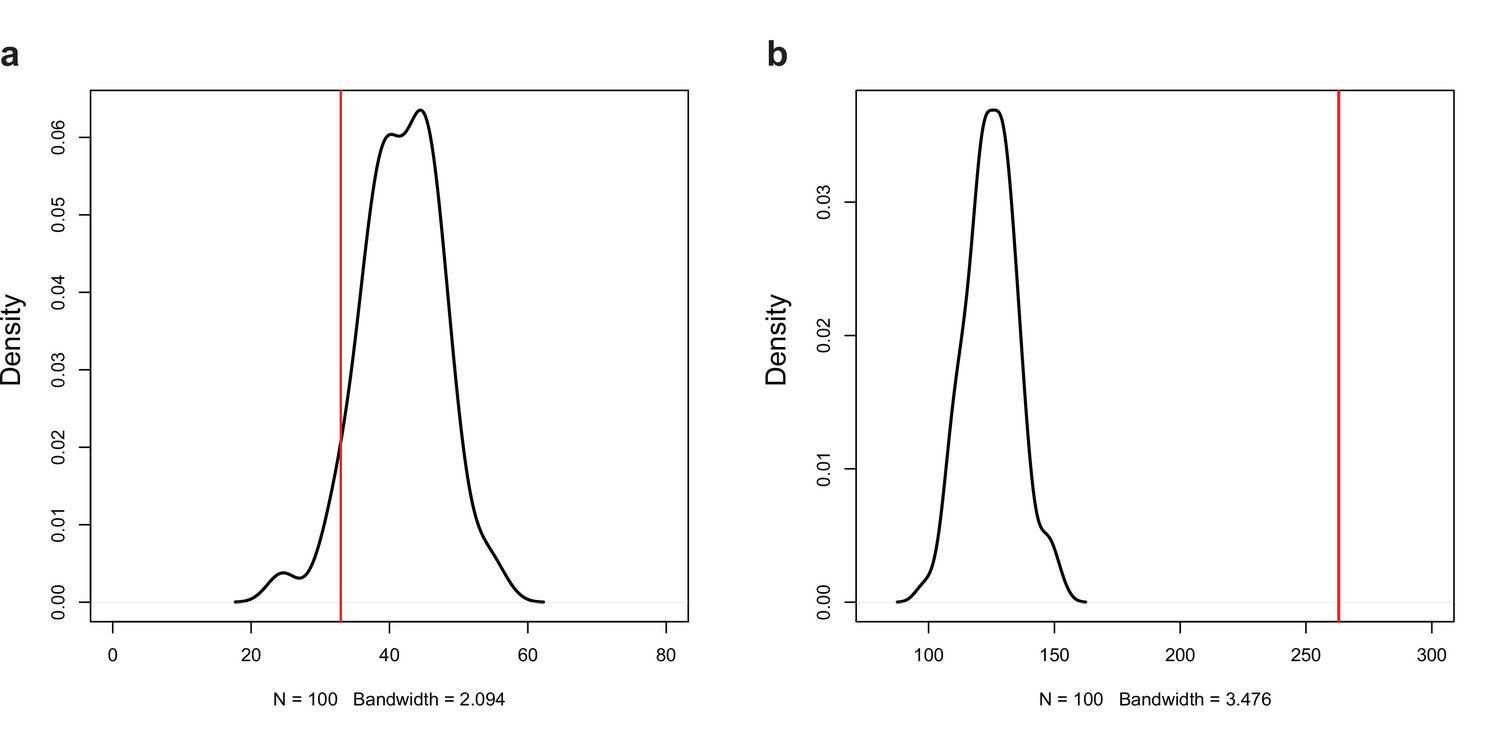
Permutation test for the number of (a) negative (r < −0.7, p<0.05) and (b) positive (r > 0.7, p<0.05) correlations among the expression of natural antisense transcripts (NATs) and random genes.
Red line represents the observed number of significant correlations.
Appendix 2—figure 8
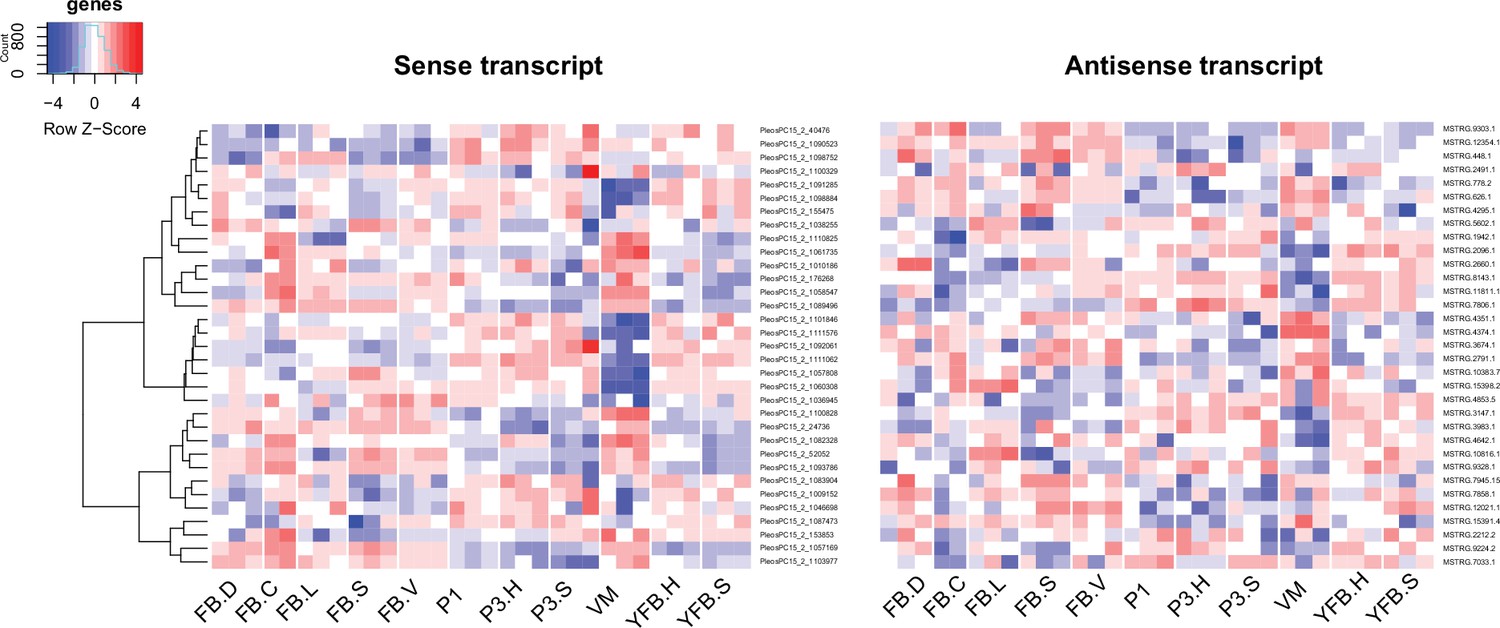
Expression pattern of 33 sense transcripts and their antisense transcripts that showed significant negative correlation (Pearson r ≤ –0.7, p<0.05) in Pleurotus ostreatus.
Corresponding lines of the heatmaps contain sense and antisense transcript pairs. VM: vegetative mycelium; P1: stage 1 primordium; P3: stage 3 primordium; YFB: young fruiting body; FB: fruiting body; H: cap (entire); C: cap trama (only the inner part, without lamellae, or skin); L: lamellae; S: stipe; V: cuticle; D: dedifferentiated tissue of cap.
Appendix 2—figure 9
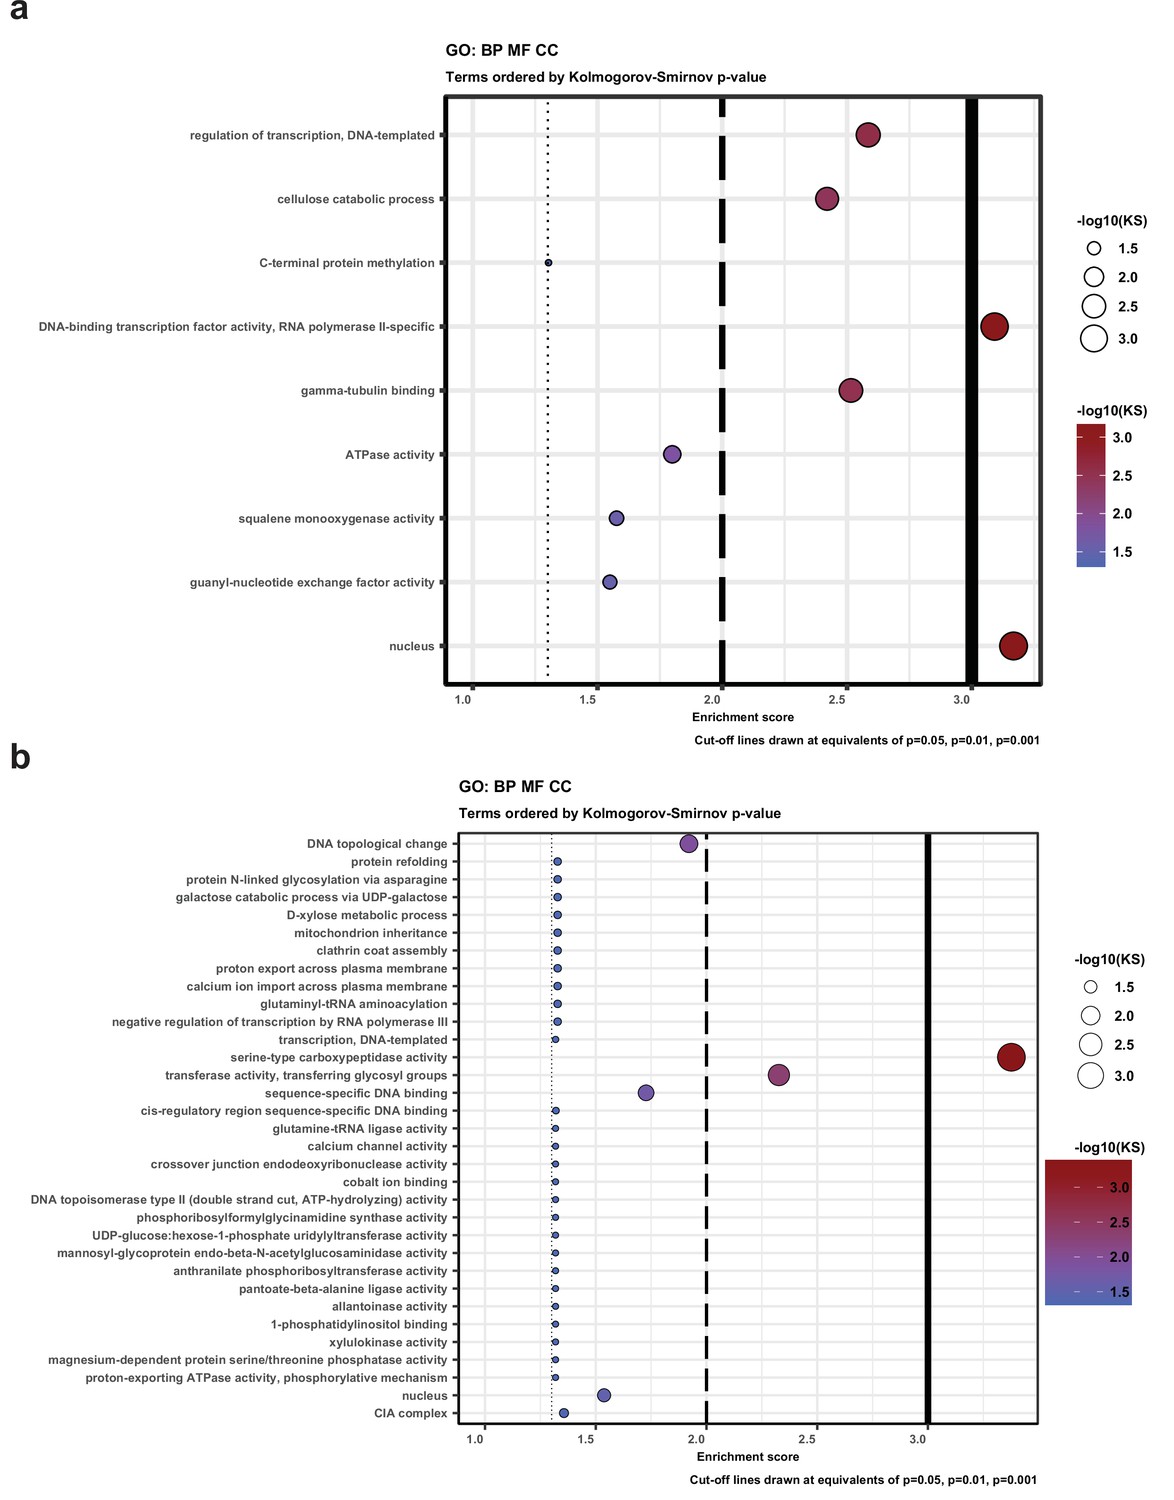
Gene Ontology (GO) enrichment for genes that have natural antisense transcripts (a) in Pleurotus ostreatus and (b) Pterula gracilis.
KS means the p-value of Kolmogorov–Smirnov test implemented in the R package ‘topGO.’ BP: biological process; MF: molecular function; CC: cellular component.
Appendix 3—figure 1

Examples for variants of different types.
In (a) and (b), erroneous read alignment around splice sites causing variants (red arrows) similar to RNA editing. In (c) and (d), green arrows represent potential RNA editing sites, while yellow arrows represent allele-specific SNPs.
Appendix 3—figure 2
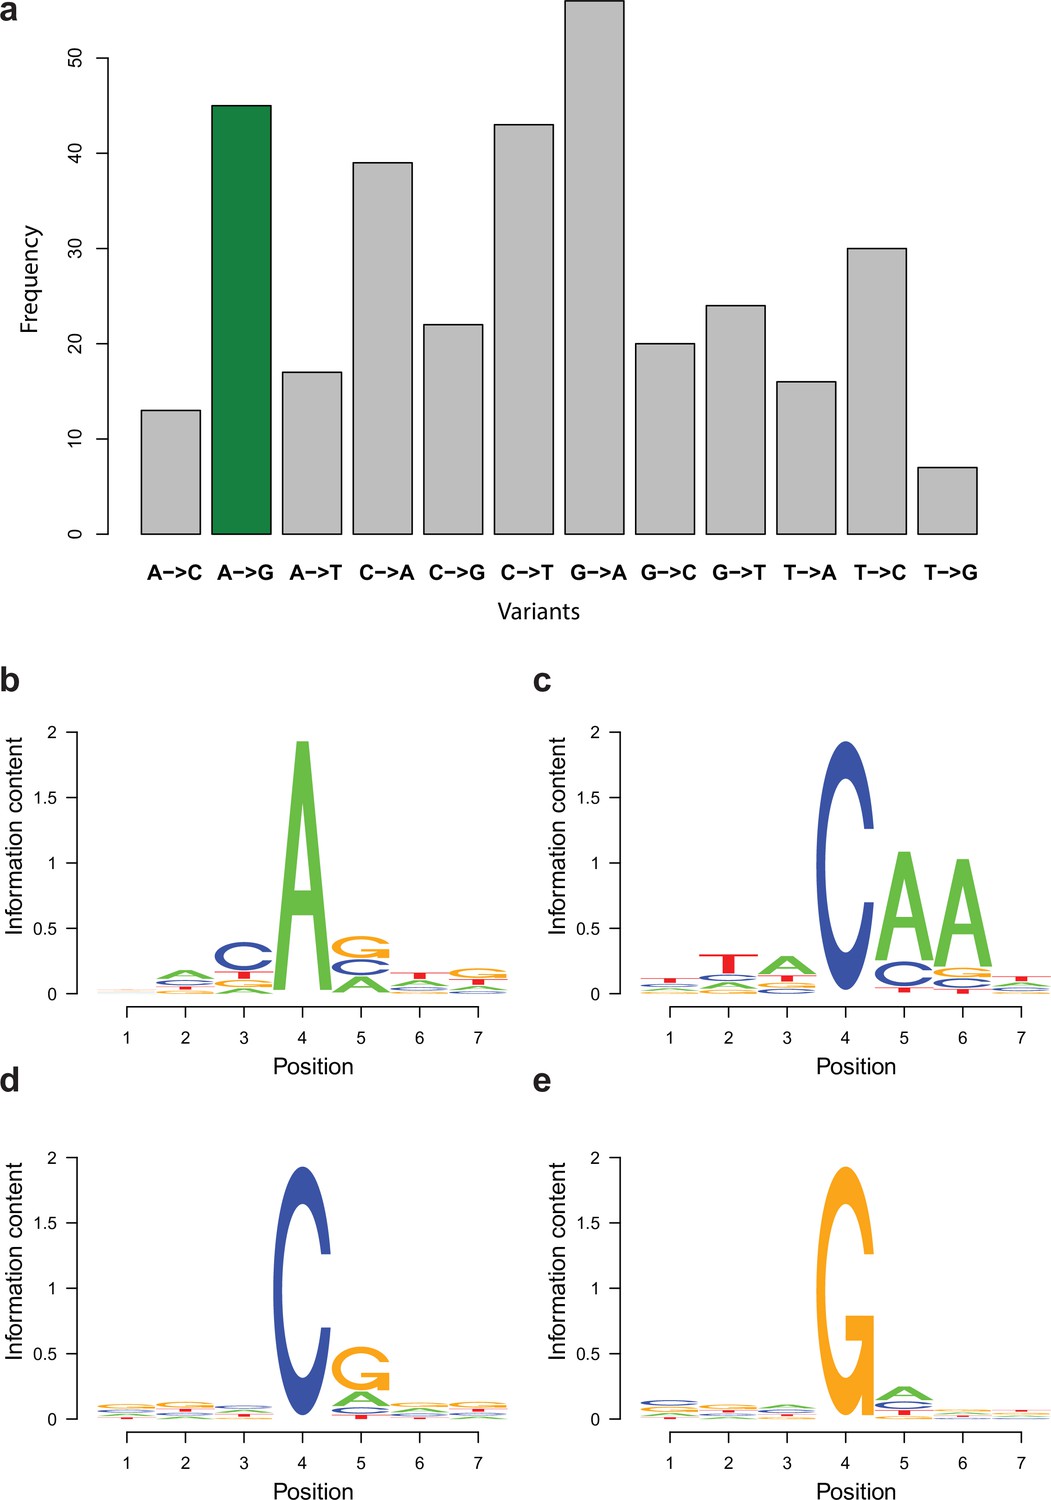
Enrichment of variant types and motifs among potential RNA editing sites.
(a) Distribution of variant types retained in the RNA editing-specific pipeline with A-to-I variants being marked with green. (b–e) Sequence motifs surrounding the most frequent candidate RNA editing changes displayed as sequence logos. Fourth position represents the variants among reads. 1–3 is the upstream three positions, while 4–7 is the downstream three positions. (b) A-to-G, (c) C-to-A, (d) C-to-T, and (e) G-to-A changes.
Author response image 1
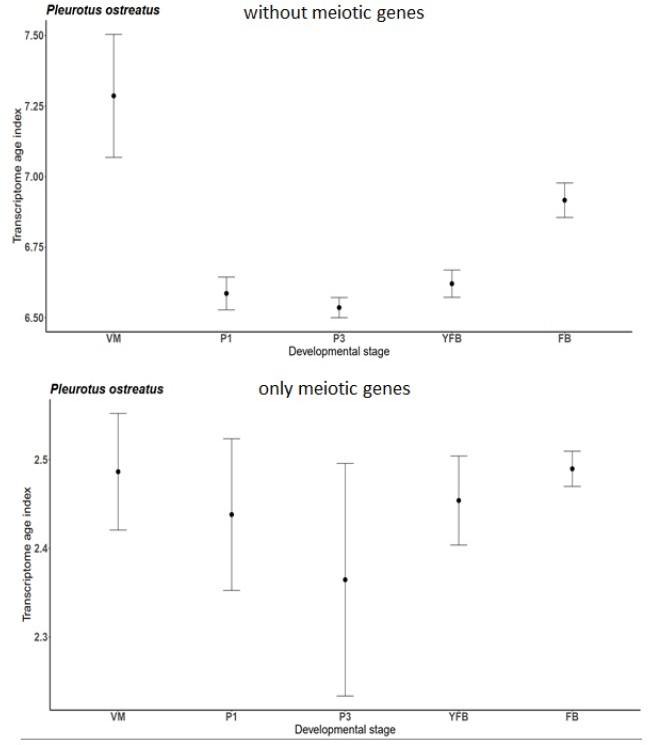
Transcriptome Age Index for only meiotic genes and without them of P. ostreatus separately.
Author response image 2
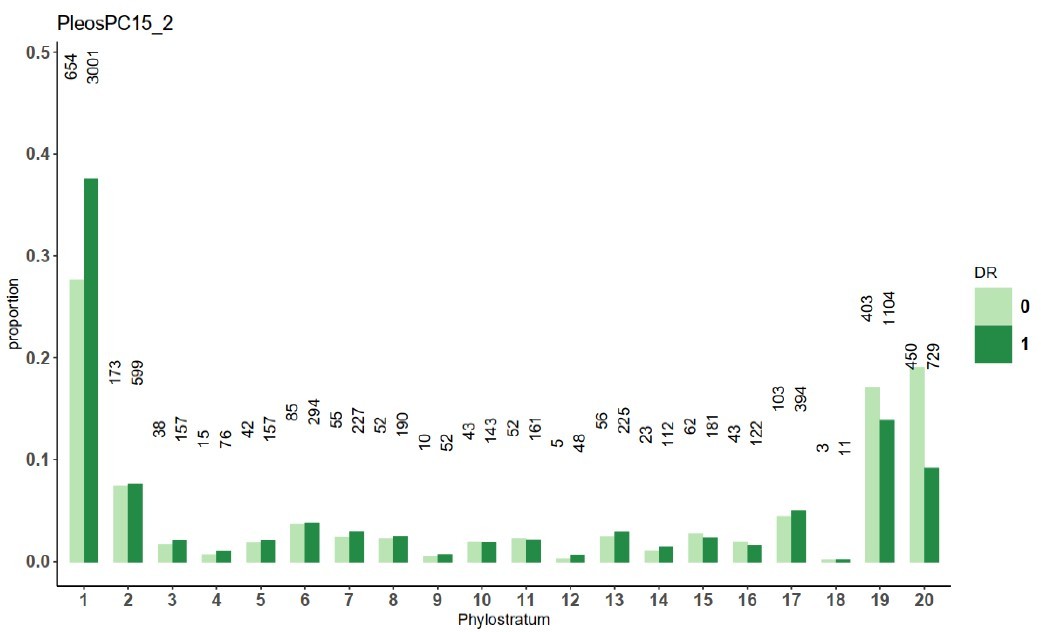
The number of genes in each phylostratum.
Tables
Key resources table
| Reagent type (species) or resource | Designation | Source or reference | Identifiers | Additional information |
|---|---|---|---|---|
| Strain, strain background (Pleurotus ostreatus) | N001 | CETC | CECT-20600 | Wild-type dikaryotic strain |
| Strain, strain background (Pterula gracilis) | CBS 309.79 | CBS | CBS 309.79 | Wild-type dikaryotic strain |
Additional files
-
Supplementary file 1
Literature-collected developmental genes in Coprinopsis cinerea and Pleurotus sp.
- https://cdn.elifesciences.org/articles/71348/elife-71348-supp1-v2.xlsx
-
Supplementary file 2
InterPro domain enrichment analysis for genes with allele-specific expression (S2 and S4) among all IPR annotated genes.
- https://cdn.elifesciences.org/articles/71348/elife-71348-supp2-v2.xlsx
-
Supplementary file 3
Conserved 1:1 ortholog groups.
- https://cdn.elifesciences.org/articles/71348/elife-71348-supp3-v2.xlsx
-
Supplementary file 4
Species that were used for transcriptomic analysis and for species tree.
- https://cdn.elifesciences.org/articles/71348/elife-71348-supp4-v2.xlsx
-
Supplementary file 5
Gene Ontology enrichment for complex multicellularity (CM)-specific and shared orthologs.
- https://cdn.elifesciences.org/articles/71348/elife-71348-supp5-v2.xlsx
-
Transparent reporting form
- https://cdn.elifesciences.org/articles/71348/elife-71348-transrepform1-v2.docx
Download links
A two-part list of links to download the article, or parts of the article, in various formats.
Downloads (link to download the article as PDF)
Open citations (links to open the citations from this article in various online reference manager services)
Cite this article (links to download the citations from this article in formats compatible with various reference manager tools)
Gene age shapes the transcriptional landscape of sexual morphogenesis in mushroom-forming fungi (Agaricomycetes)
eLife 11:e71348.
https://doi.org/10.7554/eLife.71348


