The inner mechanics of rhodopsin guanylyl cyclase during cGMP-formation revealed by real-time FTIR spectroscopy
- Institute for Biology, Experimental Biophysics, Humboldt-Universität zu Berlin, Germany
- Institute of Biology, Biophysical Chemistry, Humboldt University of Berlin, Germany
Figures
Figure 1
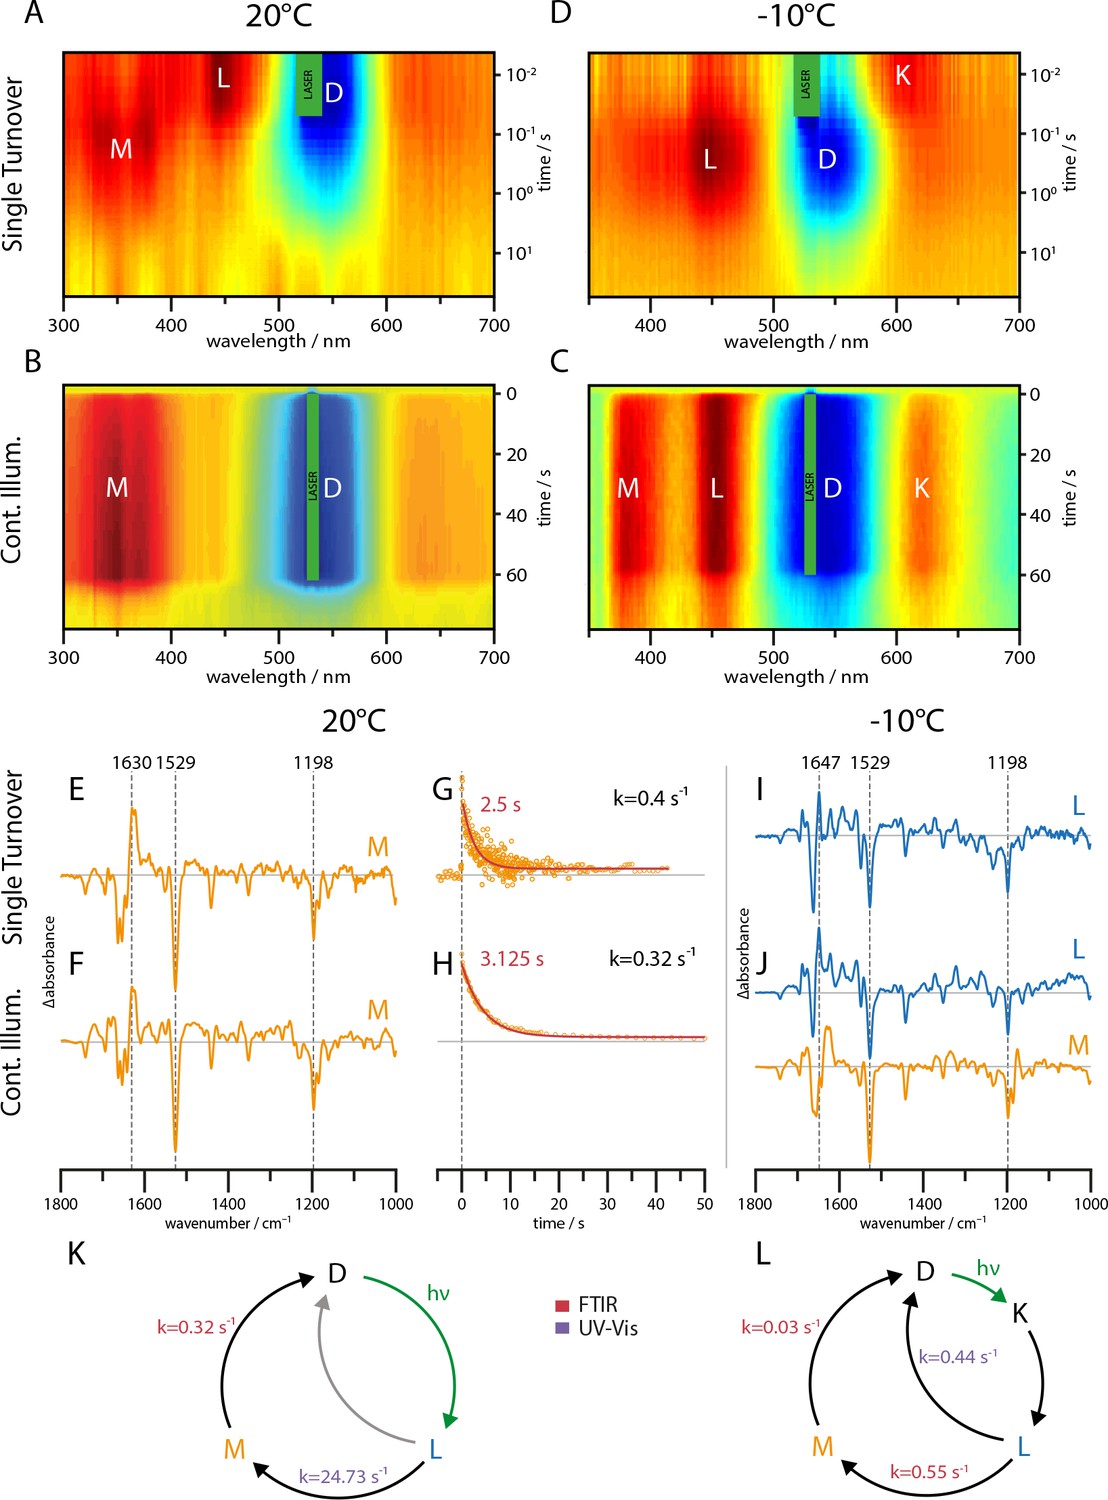
UV-Vis (A–D) and global-fit analysis of FTIR (E–J) difference spectra of the RGC slow mutant C259S for 20°C and −10°C under continuous and single turnover 532 nm illumination.
(A–C) Contour plot of transient UV-Vis absorption changes. (E) Single-turnover spectrum at 20°C corresponding to the M intermediate. (F) Decay component after green illumination at 20°C showing features of the M state. (G) Kinetic trace of the transient absorption changes after a single green nanosecond laser flash (orange) with corresponding mono-exponential fit (red line). (H) Kinetic trace after green illumination (orange) with mono-exponential fit (red line). (I) L state spectrum acquired after a single laser flash at −10°C. (J) Global-fit analysis of the SVD decay components after continuous green illumination at −10°C showing a L (blue line) and M state (orange line) spectrum. (K–L) The implied photocycles and corresponding kinetic constants derived via a global fit analysis of FTIR and UV-Vis spectra for 20°C and −10°C respectively.
Figure 2
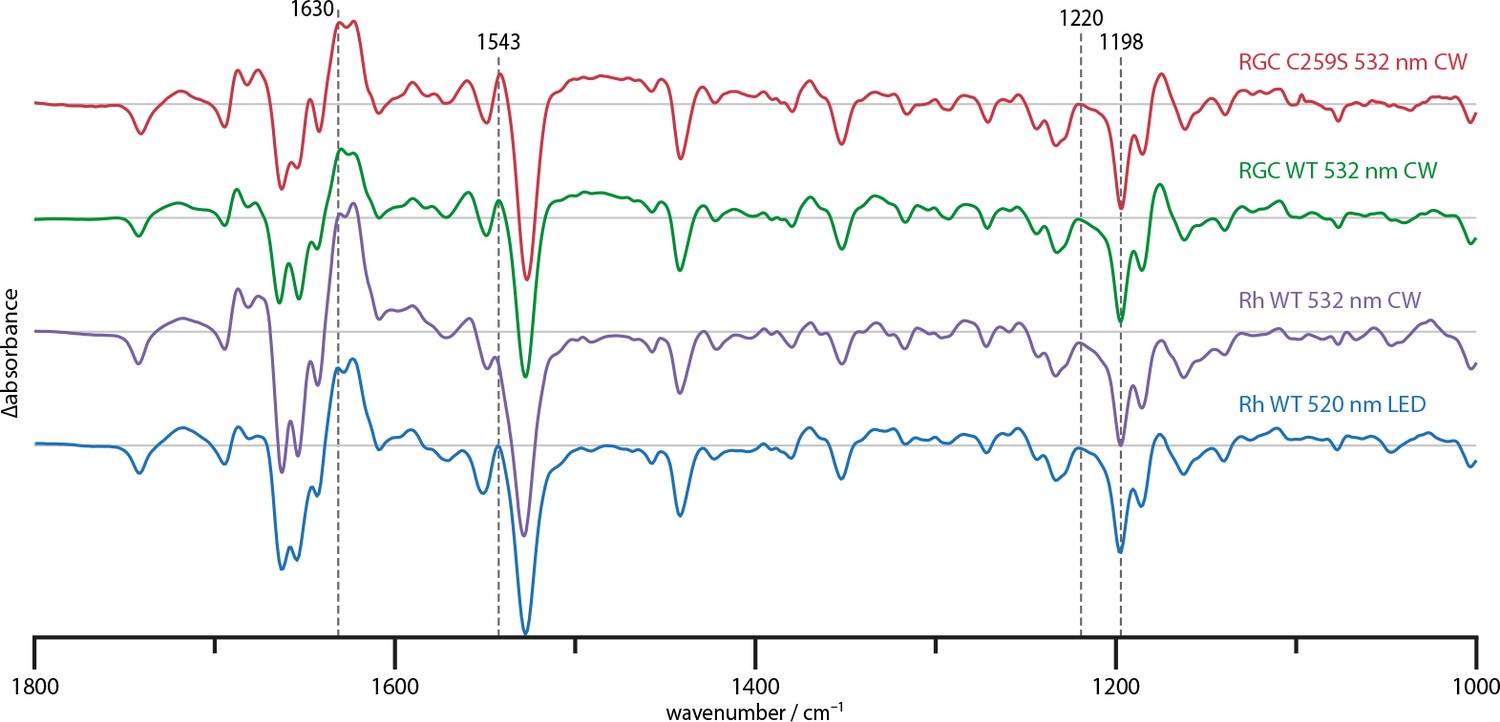
Steady state difference spectra of Rh WT illuminated with broad bandwidth 520 nm LEDs and a narrow bandwidth 532 nm CW laser, the full-length RGC WT and the RGC C259S mutant under CW illumination.
The spectra are scaled on the 1220 and 1198 cm−1 bands in the retinal fingerprint region.
Figure 3

FTIR spectra of truncated variants.
(A) Schematic representation of the predicted CaRGC structure with indicated truncation sites. (B) Steady state FTIR difference spectra of RGC with linker domain (RhL, aa 1–442, green line), with slightly truncated N-terminus (Rh-43, aa 44–396, light green area) and (C) with removed cytosolic N-terminus (Rh-139, aa 140–396, red line) compared to Rh-43 (light red area). The steady state was determined after the 1630(+) band under continuous wavelength laser illumination at 532 nm. Amide I (1620–1680 cm−1) and II (1500–1560 cm−1) regions are magnified.
Figure 4

Monitoring substrate turnover with FTIR.
(A) Molecular mechanism of the two-step experiment to monitor GC and RGC enzyme activity. (B) CaGC crystal structure with bound GTP (PDB 6SIR). The Ca2+ ion is shown as green and water molecules as red spheres. (C) FTIR measurement protocols for GC and RGC experiments corresponding to E and G. Colors indicate time intervals over which FTIR spectra in D and F were averaged. (D) RGC·NPE-GTP (blue line) and NPE-GTP (light blue area) photolysis FTIR difference spectra. Spectrum averaged from 10 to 20 s (green line) after green illumination start and RGC steady state spectrum (light green area). Clipping of cGMP absolute spectrum (light red area). Spectrum averaged over last 200 s (purple line) compared to green light activation (light green area). (E) Kinetic traces of marker bands 1070(+) and 1117(-) (binding), 1630(+) (RGC activation) and 1087(+) (cGMP formation). Gray lines represent sections of constant slope during different illumination conditions. (inset) Normalized, smoothed (eight points) and dark activity corrected kinetic traces of 1087(+) (red line) and 1630(+) (black line) bands at green illumination onset. (F) UV-light-induced FTIR difference spectra of GC·NPE-GTP. Averaged spectra over first 20 s (purple line) and last 64 s (blue line) after photolysis. (light blue area) Photolysis spectrum of NPE-GTP. (G) Kinetic traces of GC·NPE-GTP photolysis marker bands 1527(-) (NPE cleavage), 1122 and 1087(+) (GTP to cGMP turnover). (inset) Experiment with 10-fold increased NPE-GTP concentration.
Figure 5
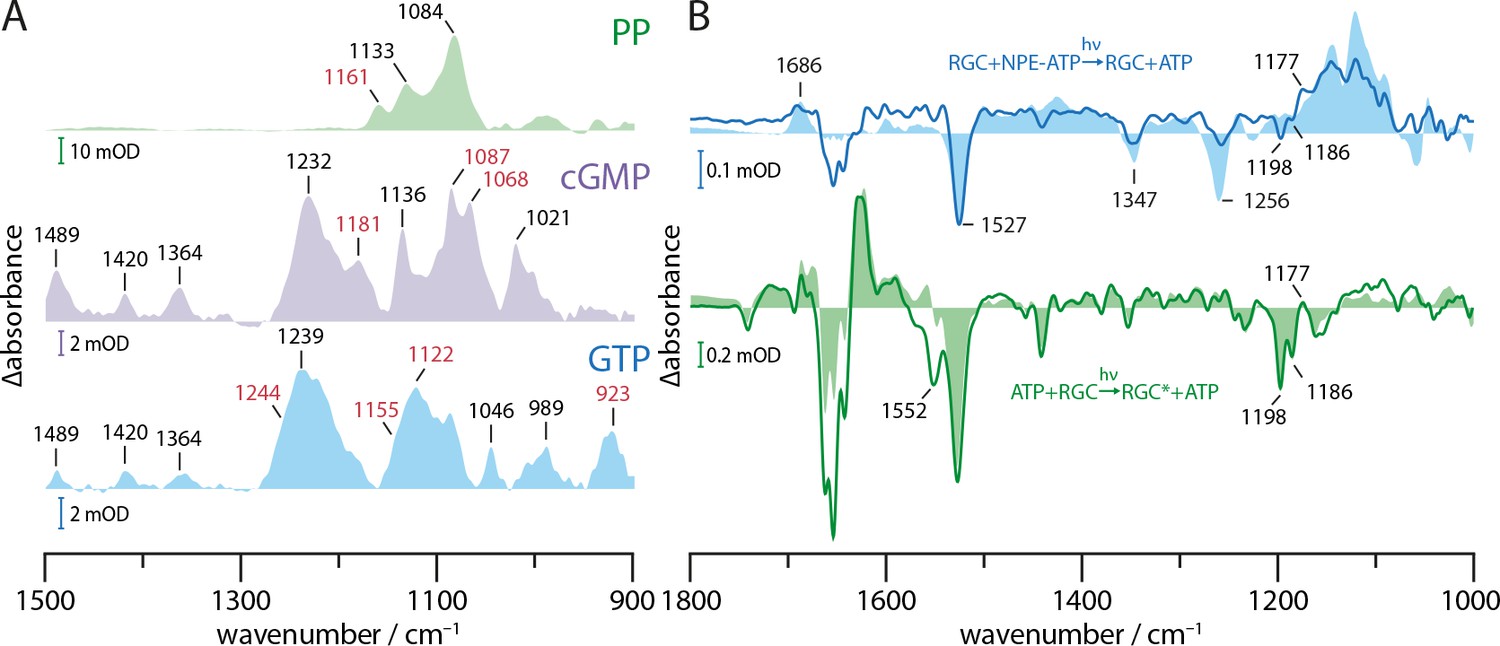
Substrate turnover supplementary studies.
(A) Absorption spectra of PP, cGMP, and GTP in presence of Mn2+ in a substrate to ion ratio of 1:2. The spectra were baseline corrected and smoothed using 25 spectral points. Bands discussed in context with GTP to cGMP and PP turnover by GC and RGC are shown in red. (B) FTIR difference spectra of catalytic interaction of RGC with NPE-ATP in the presence of Mn2+ measured with the same protocol as shown in Figure 4C. NPE-ATP+RGC to ATP+RGC photolysis spectrum (blue line) was derived via global fit analysis and has been smoothed using 18 spectral points due to the poor signal-to-noise-ratio. For comparison, an NPE-ATP+Mn2+ photolysis spectrum (light blue area) is underlaid. Using the spectra measured for 85 s after UV-light-induced photolysis as baseline the RGC photo-activation difference spectrum averaged over 20–300 s during green illumination with a 532 nm CW laser is shown (green line). A Rh steady state difference spectrum is underlaid for comparison (light green area).
Figure 6
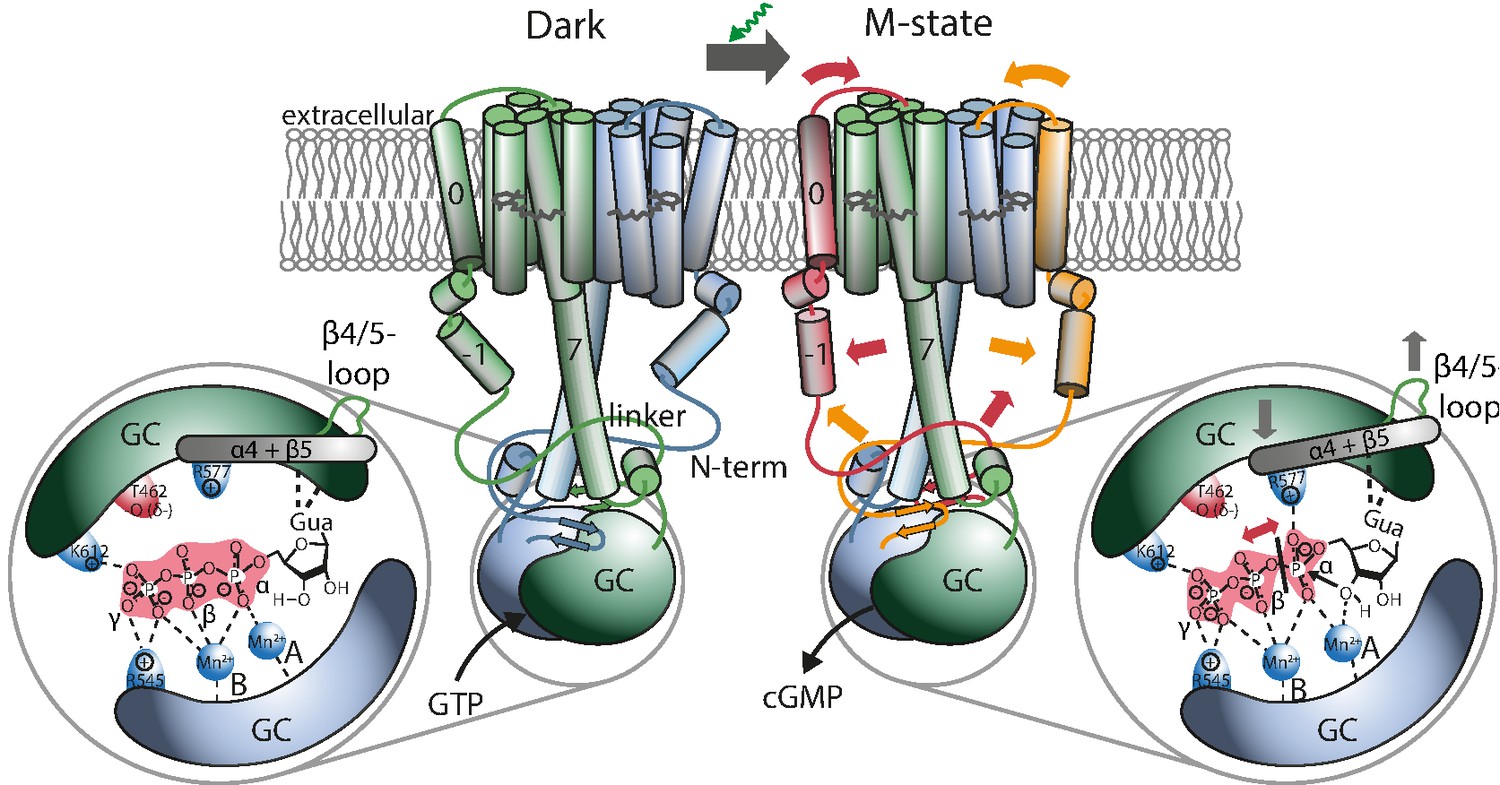
Proposed mechanism leading to light-induced activation of the GC domain.
GTP binds to the dark-adapted RGC. After photon absorption, the Rh domain converts into the M state causing the N-terminus to interact with the linker or be retracted from the β4/5-loop at the GC domain, which then assumes an active position. The positive charged R577, located at helix α4 after β-sheet 5, interacts with the α-phosphate, making it more vulnerable to the nucleophilic attack of the ribose-3’-OH group leading to subsequent cleavage of the α-β phosphate bond.
Appendix 1—figure 1
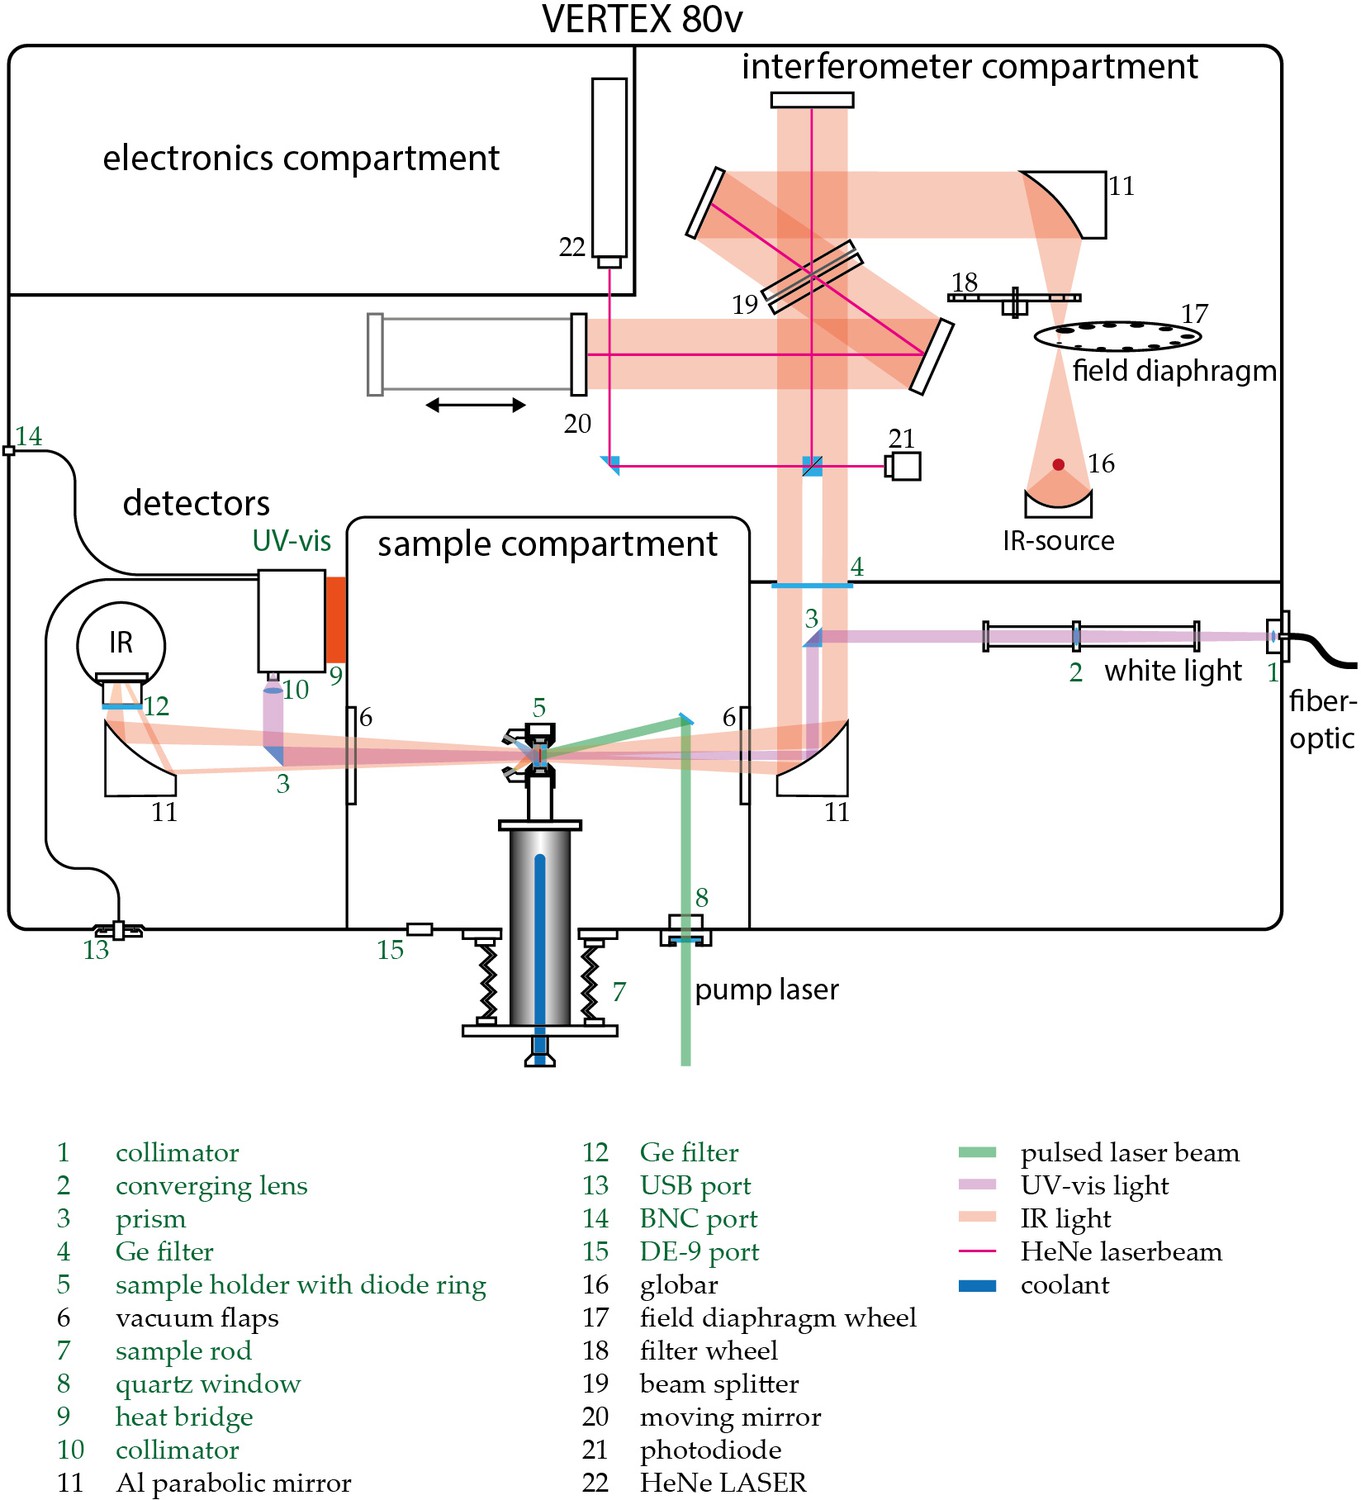
Schematic view of the customized Vertex 80 v (Bruker Optics).
Custom built parts are indicated green. Depicted numbers are discussed in the Experimental section of the main text.
Appendix 2—figure 1

Uncaging of NPE-GPCPP.
(A) Structural formula of NPE-GPCPP. (B) UV-light-induced uncaging FTIR difference spectra of free NPE-GPCPP (solid blue line) compared to free NPE-GTP (light blue area) and NPE-GPCPP in presence of GC (light purple area). All spectra were measured in presence of Mn2+.
Appendix 3—figure 1

L and M state spectra of CaRGC in H2O (black line) and D2O (red line).
C is the magnified amide I region of A, measured time resolved after a laser flash at −10°C. D shows amide I bands of B and has been obtained via a global fit procedure on the SVD decay components after a 1 min illumination with a 532 nm CW laser at −10°C.
Appendix 4—figure 1
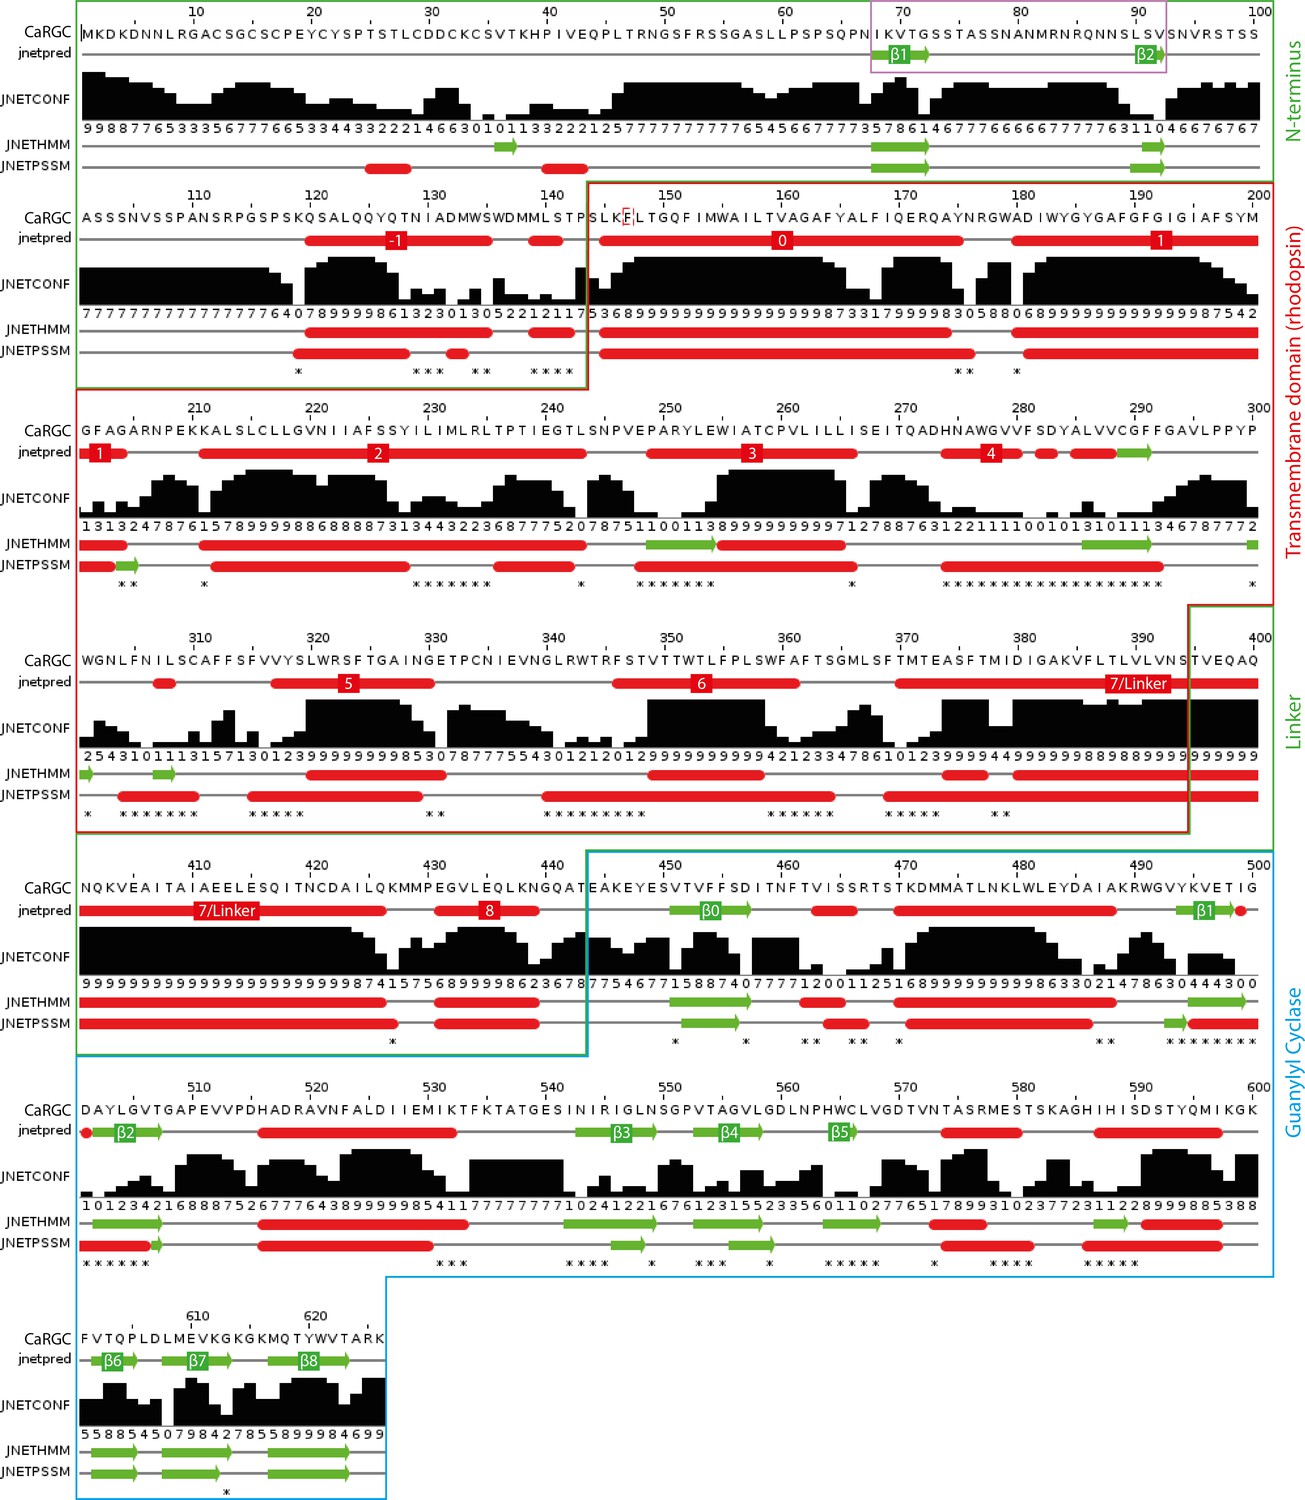
Secondary structure prediction for full length CaRGC using JPred434: α-helices are represented as red tubes, β-sheets as green arrows and random coil as grey lines.
N-terminal β-sheets β1 and β2 predicted to be involved in cyclase activation are highlighted by a violet frame. Annotations: jnetpred = the consensus prediction. JNETCONF = the confidence estimate for the prediction. High values mean high confidence. JNETHMM - HMM profile based prediction. JNETPSSM = PSSM based prediction. Asterisks are used to rationalize significantly different primary predictions.
Appendix 5—figure 1
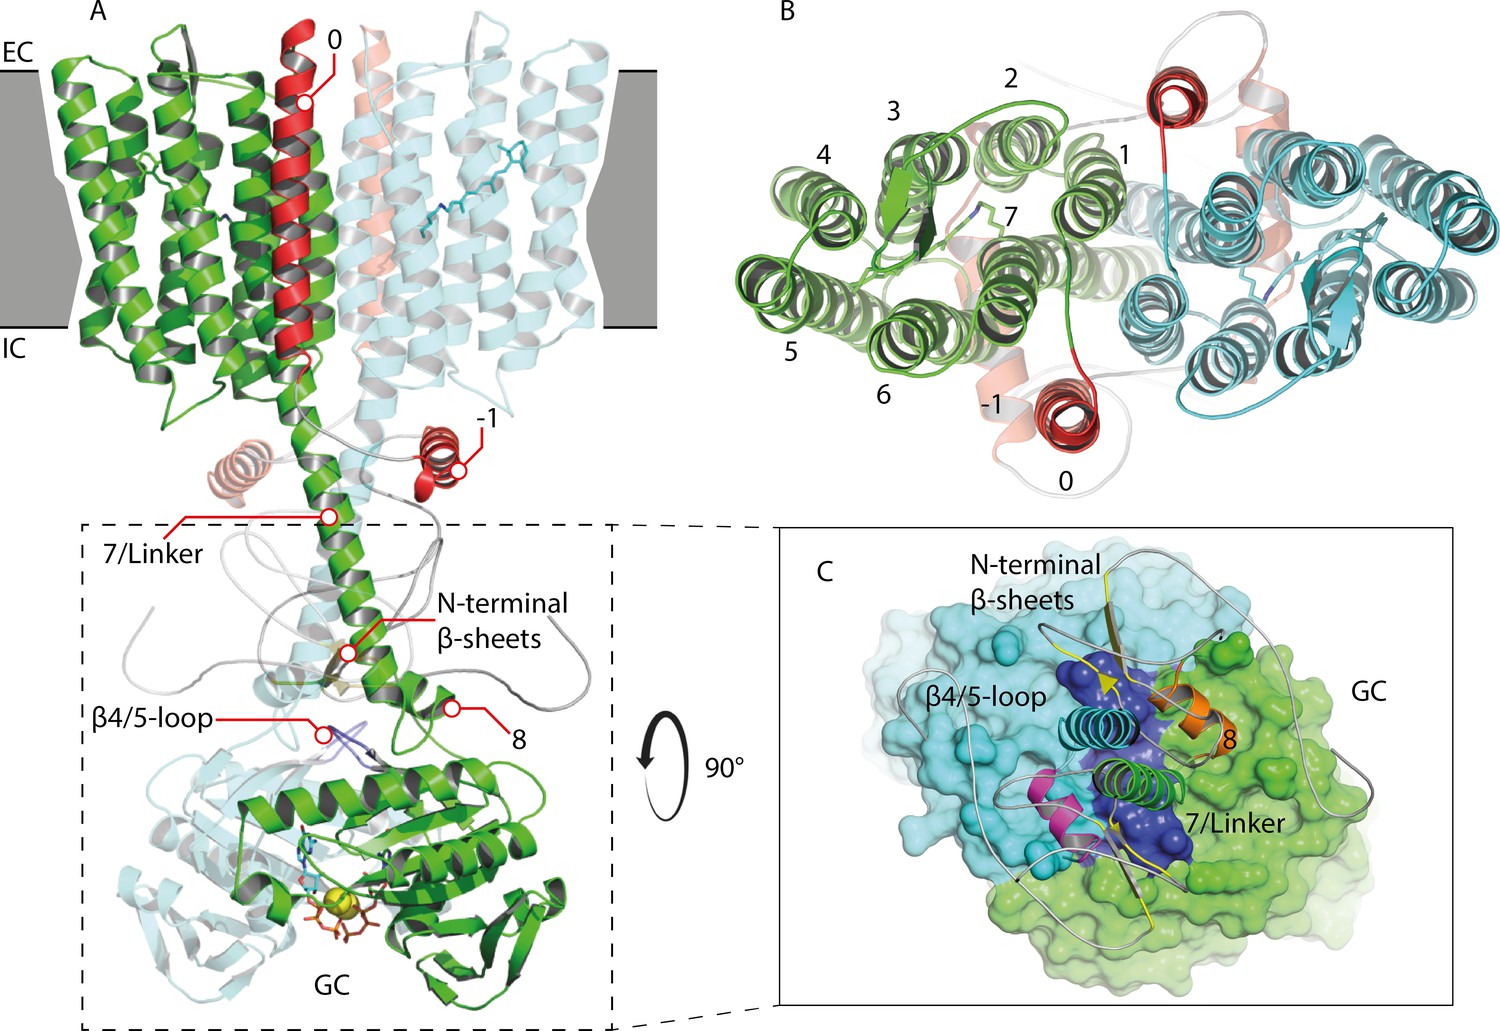
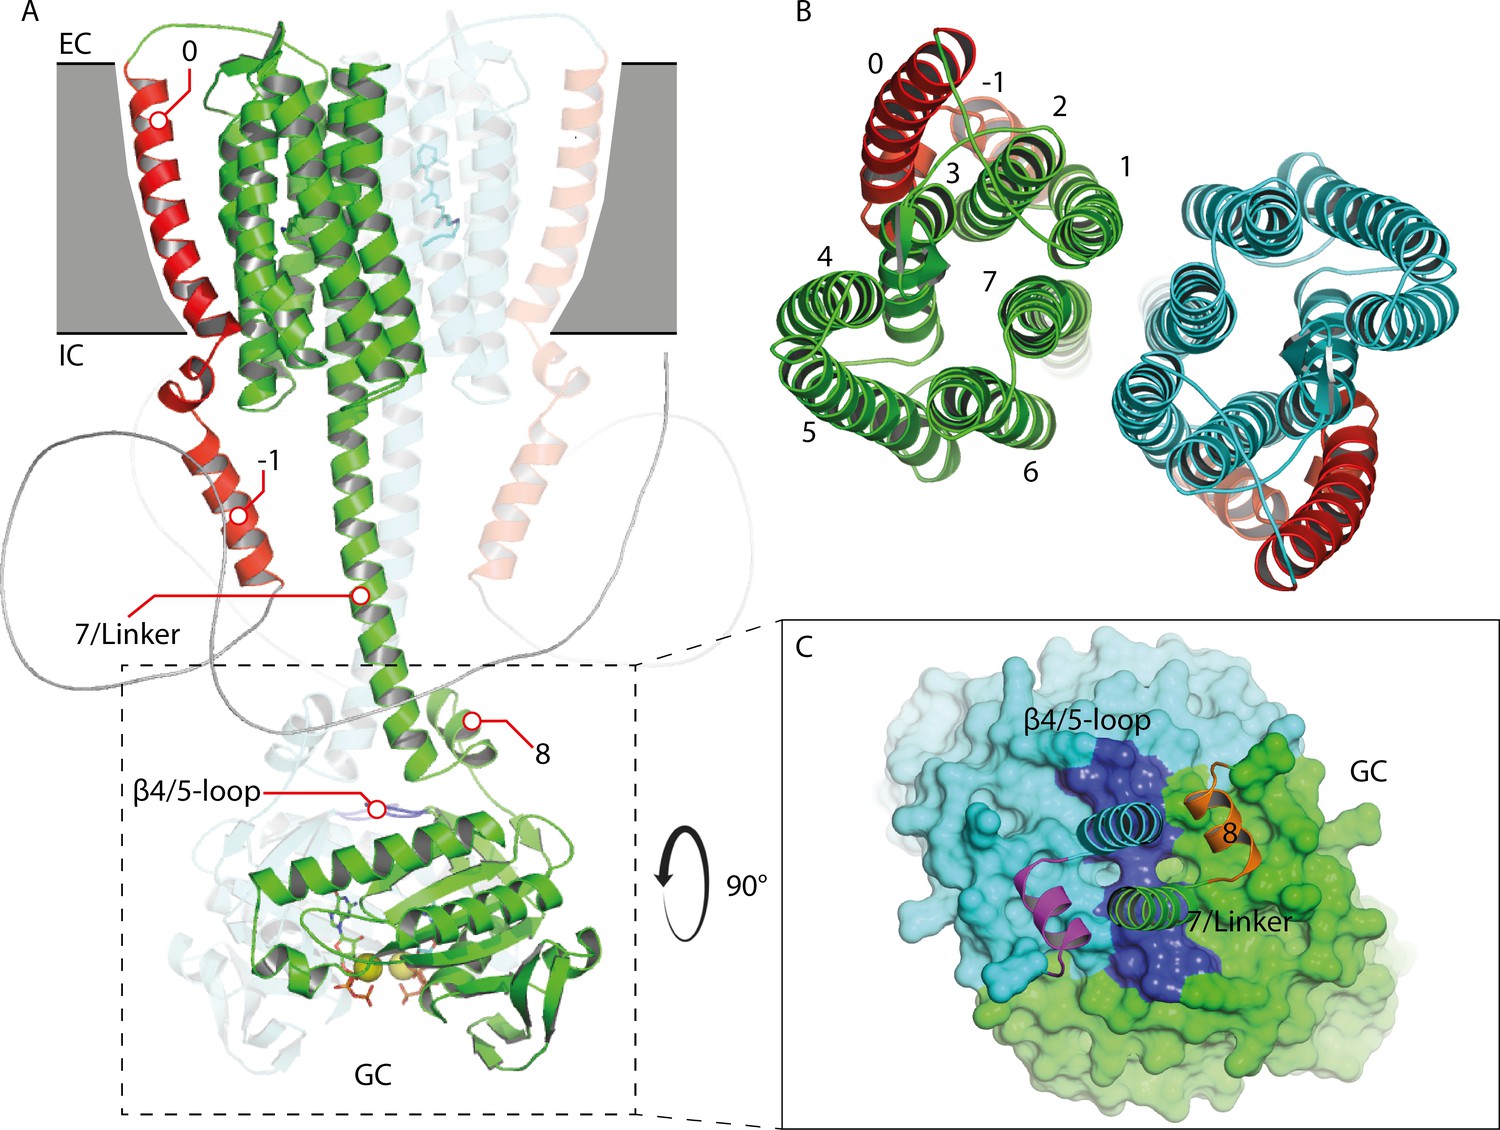
Homology model of the 43-truncated CaRGC sequence.
(A) Cartoon representation of the homology model dimer of CaRGC (lateral view) consisting of the 43-truncated N-terminus, the transmembrane (TM) rhodopsin domain, the elongated helix 7 linker and the GC domain. N-terminal helices 0 and −1 are highlighted in red, N-terminal β-sheets in yellow. The β4/5-loops on the GC top surface are colored in dark blue. Retinal bound to rhodopsin and guanine bound to GC are shown as licorice. Ca2+ bound by GC is shown as yellow spheres. (B) Top view of the TM domain. Both protomers are colored in green and light blue, respectively. N-terminal helices 0 and −1 are highlighted in red. (C) Top view of the GC domain surface including helix 8 and parts of the helix 7 linker and the N-terminus. N-terminal β-sheets are highlighted in yellow. Helix 8 is colored in yellow and orange for better contrast. The β4/5-loops of the GC domain are colored in dark blue.
Appendix 5—figure 2
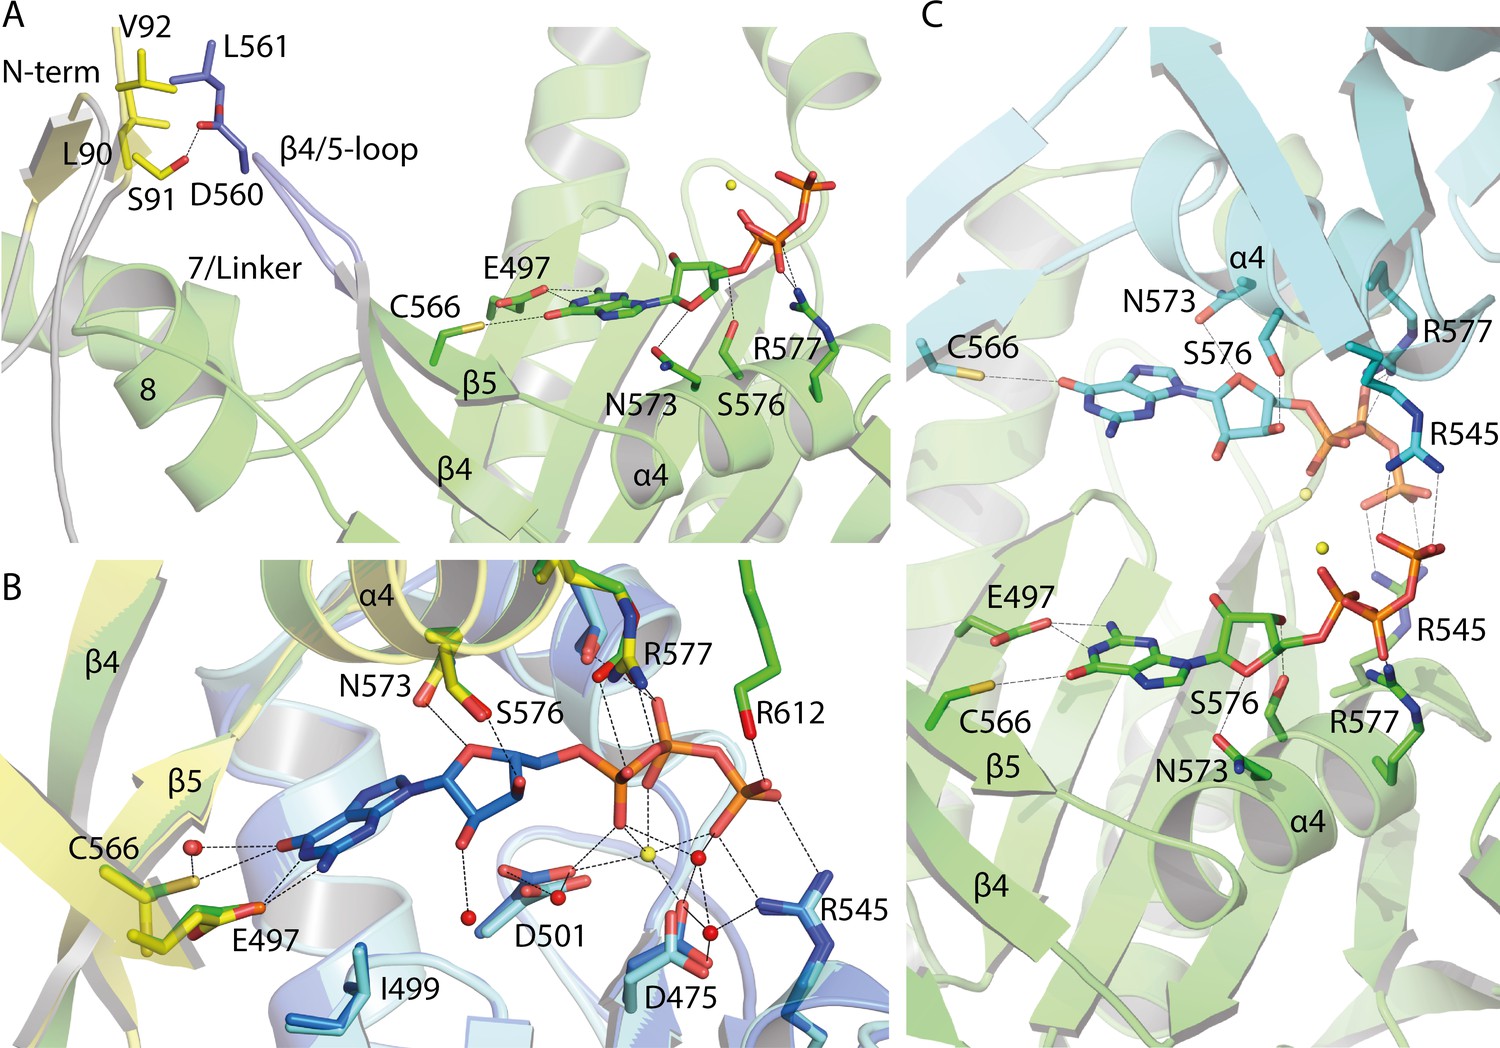
Guanine binding pocket of the GC domain and its predicted connection to the CaRGC helix 7 linker and the N-terminus.
(A) L90, S91 and V92 sidechains of the cytosolic N-terminus are possible interaction partners for L561 and D560 of the GC β4/5-loop, which could trigger the GC activity. The N-terminal β-sheets are represented in yellow and the β4/5-loop in dark blue. Guanine is shown as licorice. Ca2+ bound by GC is represented by small yellow spheres. (B) Comparison of the guanine binding pocket of the CaRGC homology model and biological assembly 2 of the crystal structure (PDB-ID 6SIR) indicating variations in C566 and R577 side chain orientations. The homology model protomers are colored in green and light blue and the GC crystal structure protomers are colored in yellow and dark blue, respectively. Guanine and the highlighted amino acid sidechains are shown as licorice. Bound Ca2+ and close water molecules are represented as yellow and red spheres, respectively. (C) Both binding pockets of the CaRGC homology model including guanine substrate and Ca2+ ions bound. Both GC protomers are colored in green and light blue, respectively. Guanine and the highlighted amino acid sidechains are shown as licorice. Bound Ca2+ is represented as yellow spheres.
Appendix 5—figure 3
Alternative homology model of the 43-truncated CaRGC sequence generated by Alphafold 2 using the AlphaFold2 advanced notebook on Google Colab Mirdita et al., 2021; Jumper et al., 2021.
Retinal bound to rhodopsin and guanine and Ca2+ bound to GC were added manually using PyMOL 2.5. (A) Cartoon representation of the homology model dimer of CaRGC (lateral view). N-terminal helices 0 and −1 (red) show strong deviations from the preceding homology model: helix 0 is located close to helices 2 and 3 comparable to the crystal structure of SrRhPDE (PDB-ID: 7CJ3) (Ikuta et al., 2020). Helix -1 takes a rather flexible conformation close to linker helix 7 on the intracellular side. No additional N-terminal features can be found which could influence the GC activity. It has to be noted that it is very unlikely for Alphafold 2 to predict intrinsically disordered structures like most of the N-terminus correctly. Both linker helices 7 are less twisted and helix 8 is almost parallel to helix 7, but their contact site with the GC domain is similar to the preceding homology model. The β4/5-loop is bent towards the GC center compared to the CaGC crystal structure which could be connected to the suppression of enzyme activity. (B) Top view of the TM domain. Helices 1 to 7 are oriented similar to the preceding homology model, but the protomers are slightly rotated towards each other: helix 1 is in contact with helix 6 resulting in a larger dimer contact area. (C) Top view of the GC domain surface including helix 8 and parts of the helix 7 linker. The GC domain is almost identical to its crystal structure (PDB-ID: 6SIR) (Butryn et al., 2020).
Appendix 5—figure 4
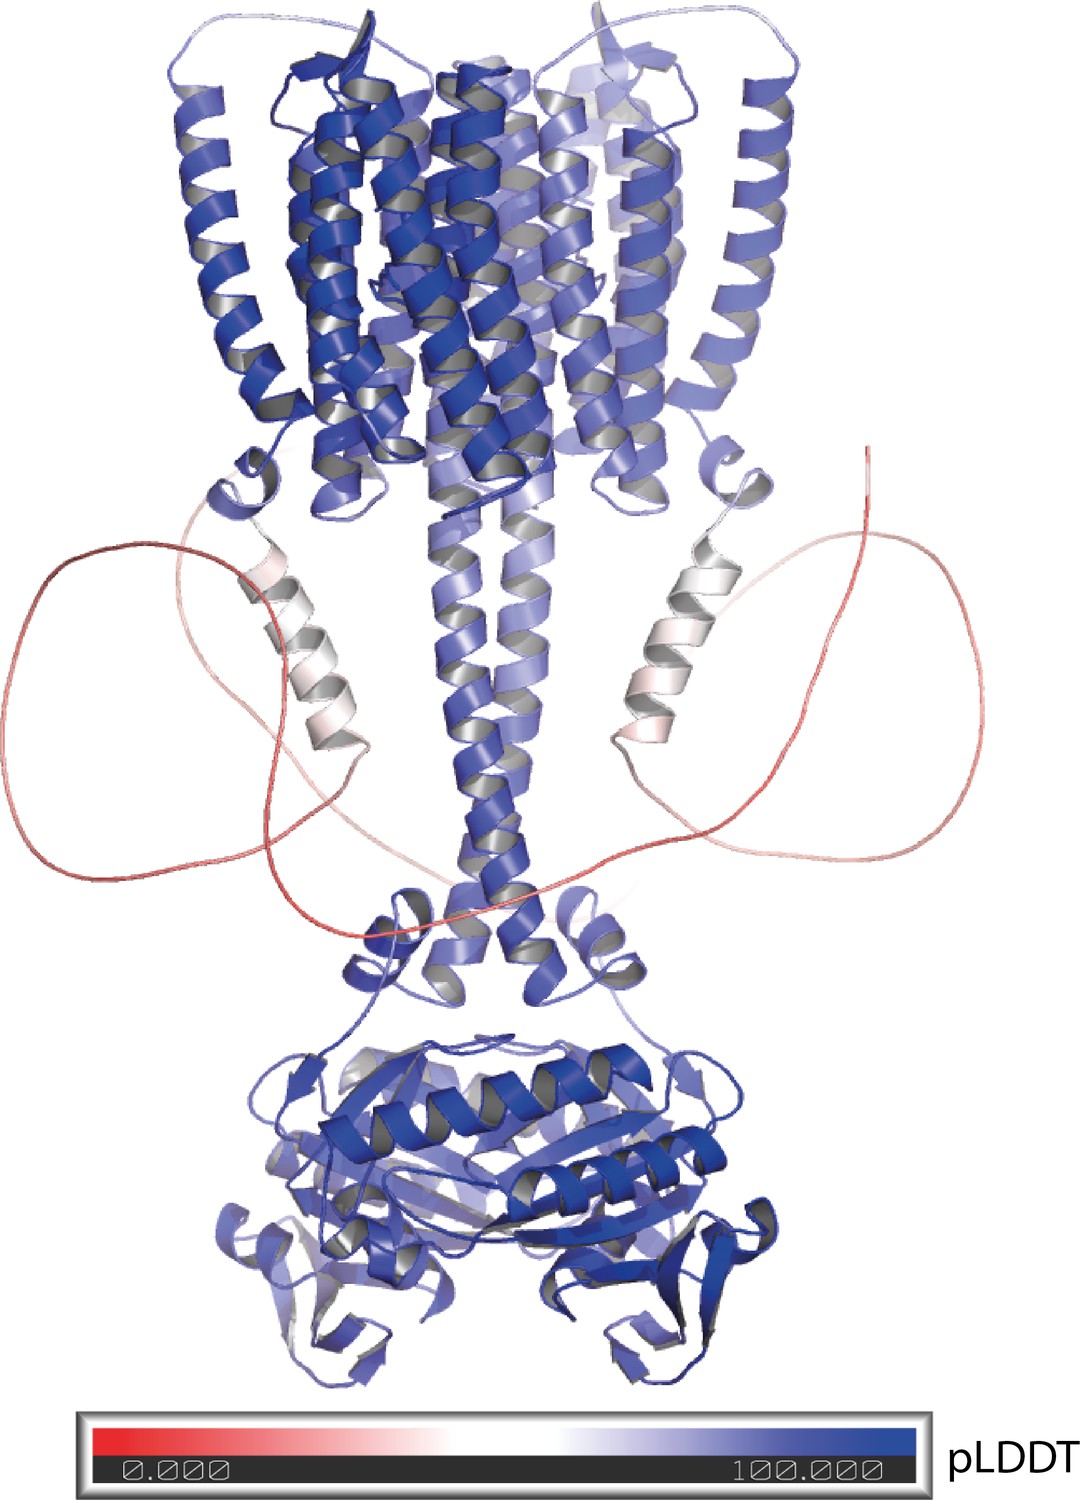
Alphafold 2 model of the 43-truncated CaRGC sequence, cartoon representation with color corresponding to the per-residue confidence metric that Alphafold produces (pLDDT Mariani et al., 2013).
Red to white color (pLDDT < 50) equals low confidence which correlates well with disorder. Blue equals high confidence.
Appendix 6—figure 1
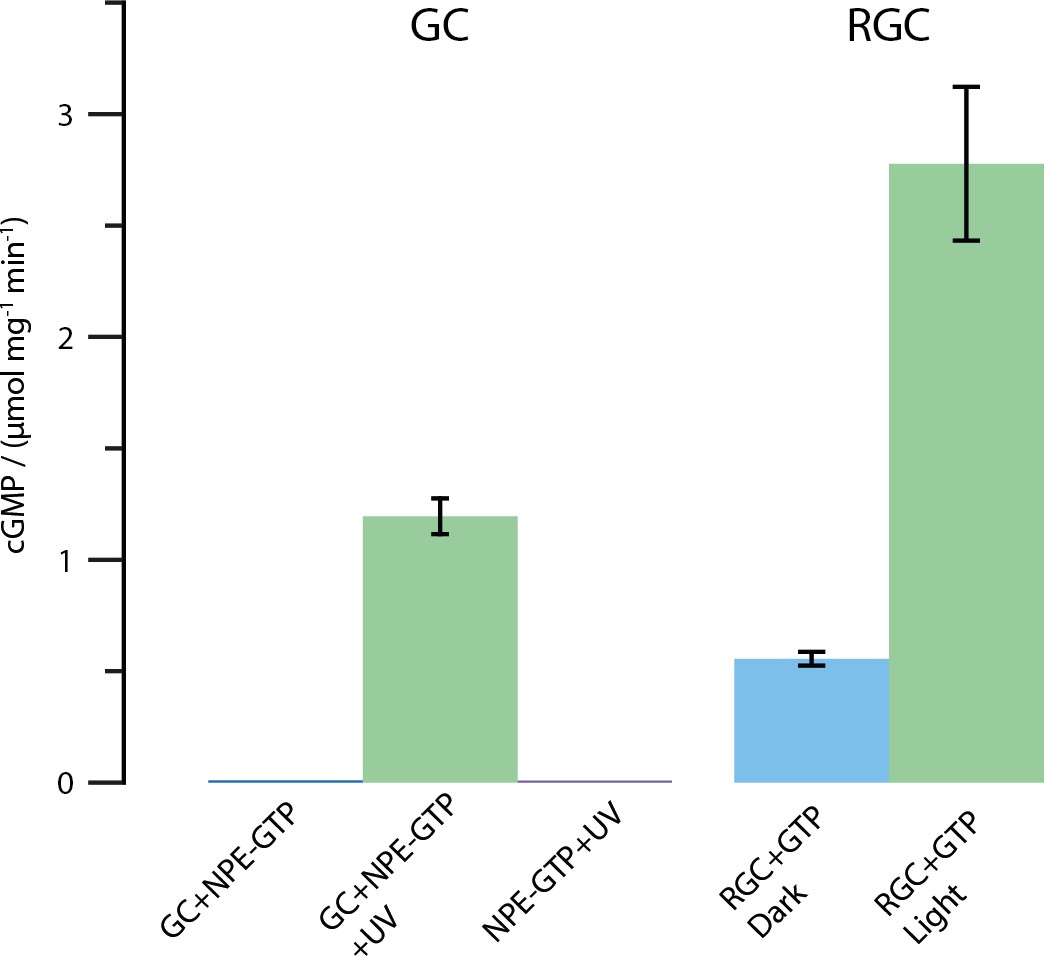
Results of the HPLC assay described in the Materials and methods section.
Shown is the amount of produced cGMP in μmol per mg protein and minute. All tests were conducted using 2 mM substrate and 2 mM Mn2+. The UV illumination was performed with the same protocol as described for the FTIR enzyme turnover experiments (50 pulses at 330 nm, puls duration 6 ns, frequency 10 Hz and 30 mJ per pulse). As shown, free CaGC does not process the caged NPE-GTP substrate unless illuminated with UV light. The full-length CaRGC construct shows an approximately doubled activity compared to free GC when illuminated with green light (532 nm CW laser). The dark activity however, mounts up to roughly 20% in the concentrated detergent samples. Therefore, the caged NPE-GTP construct was used in the FTIR experiments.
Additional files
Download links
A two-part list of links to download the article, or parts of the article, in various formats.
Downloads (link to download the article as PDF)
Open citations (links to open the citations from this article in various online reference manager services)
Cite this article (links to download the citations from this article in formats compatible with various reference manager tools)
The inner mechanics of rhodopsin guanylyl cyclase during cGMP-formation revealed by real-time FTIR spectroscopy
eLife 10:e71384.
https://doi.org/10.7554/eLife.71384


