Structure and dynamics of the chromatin remodeler ALC1 bound to a PARylated nucleosome
- Department of Cell and Molecular Biology, Science for Life Laboratory, Uppsala University, Sweden
- Department of Structural Biology, St Jude Children's Research Hospital, United States
- The Francis Crick Institute, United Kingdom
Figures
Figure 1 with 4 supplements
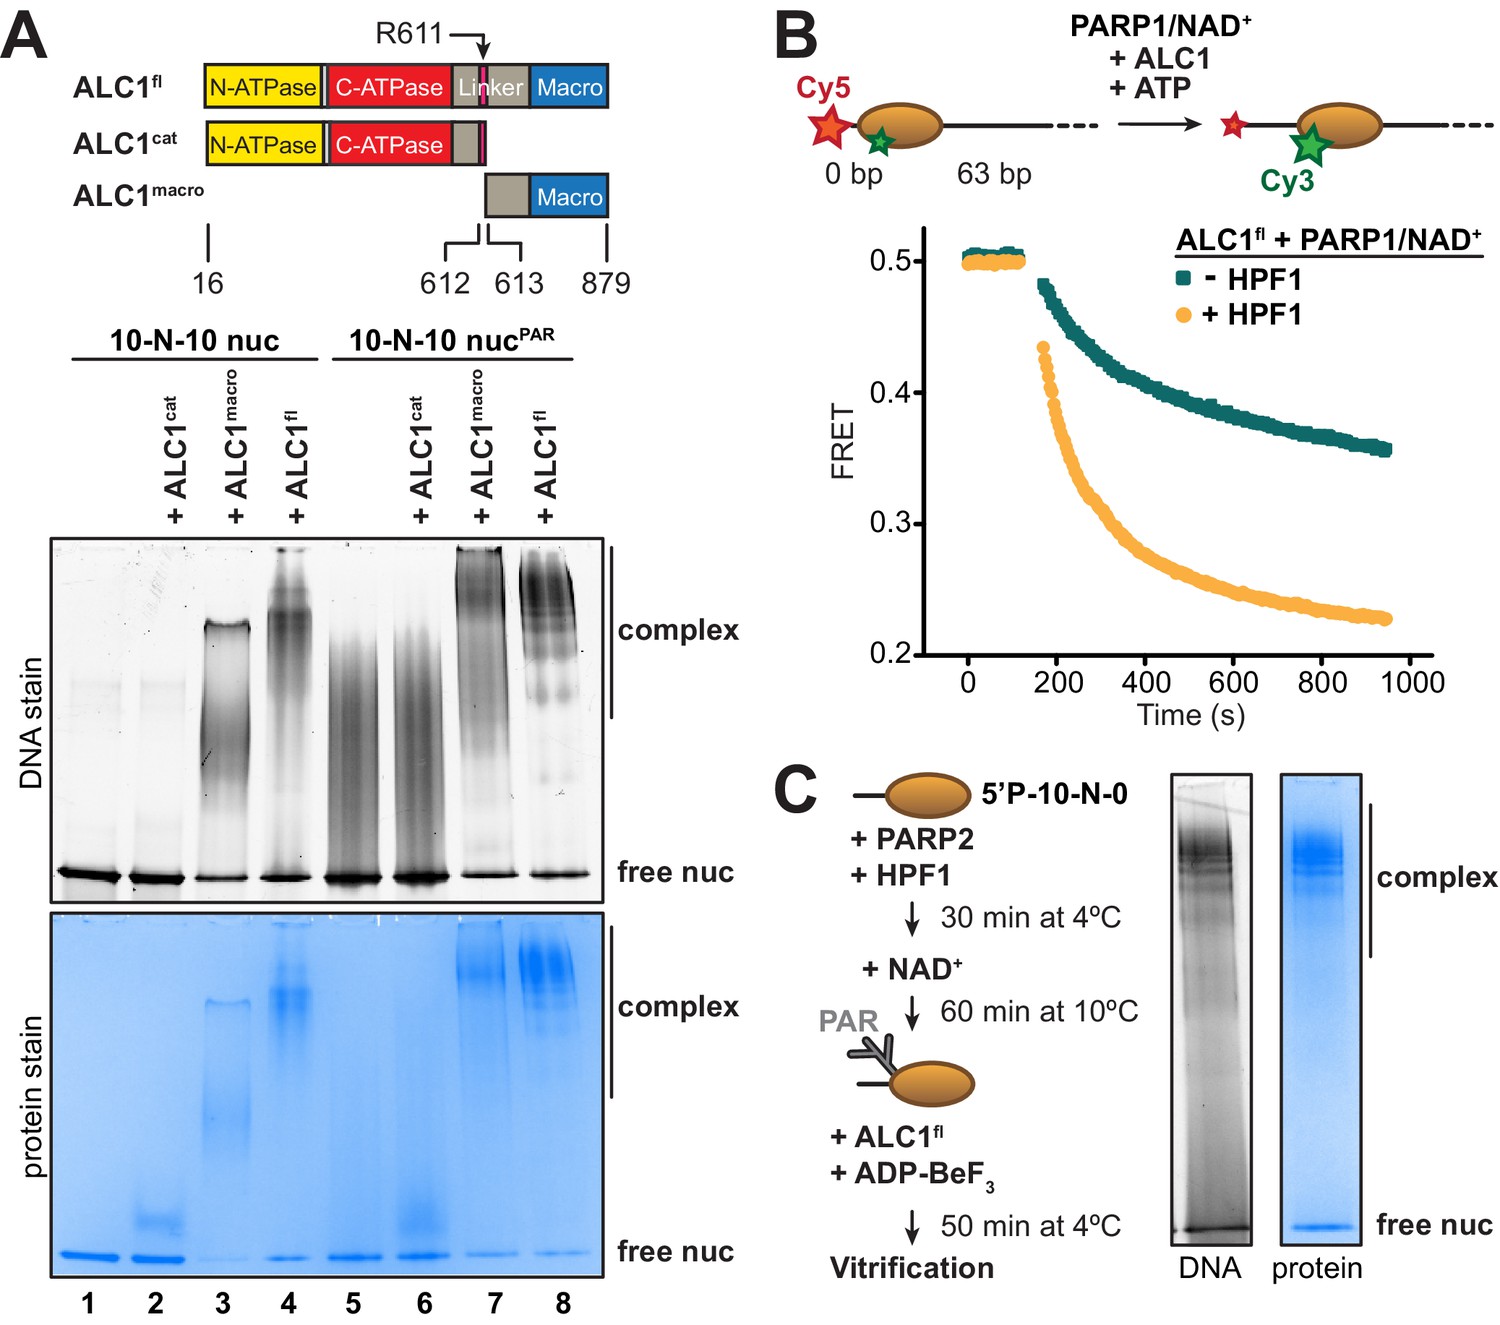
Identification of an ALC1-PARylated nucleosome complex suitable for cryo-EM.
(A) Top: schematic of ALC1 constructs used in EMSA experiments. The arginine anchor residue R611, previously shown to interact with the nucleosome acidic patch, is indicated. Bottom: EMSA analysis of the complexes formed by different constructs of ALC1 and a 5’P-10-N-10 nucleosome in absence or presence of PAR chains deposited by PARP2 and HPF1. (B) Nucleosome sliding assay of 10 nM nucleosomes by 31.3 nM ALC1fl, performed after PARylation by 80 nM of PARP1 with 25 µM NAD+ in the absence (teal) and presence (orange) of 20 nM of HPF1. (C) Preparation and native PAGE analysis of the complex between ALC1fl and a PARylated nucleosome for cryo-EM (see Materials and methods).
-
Figure 1—source data 1
Tiff files of raw gel images for Figure 1A,C.
- https://cdn.elifesciences.org/articles/71420/elife-71420-fig1-data1-v2.xlsx
Figure 1—figure supplement 1
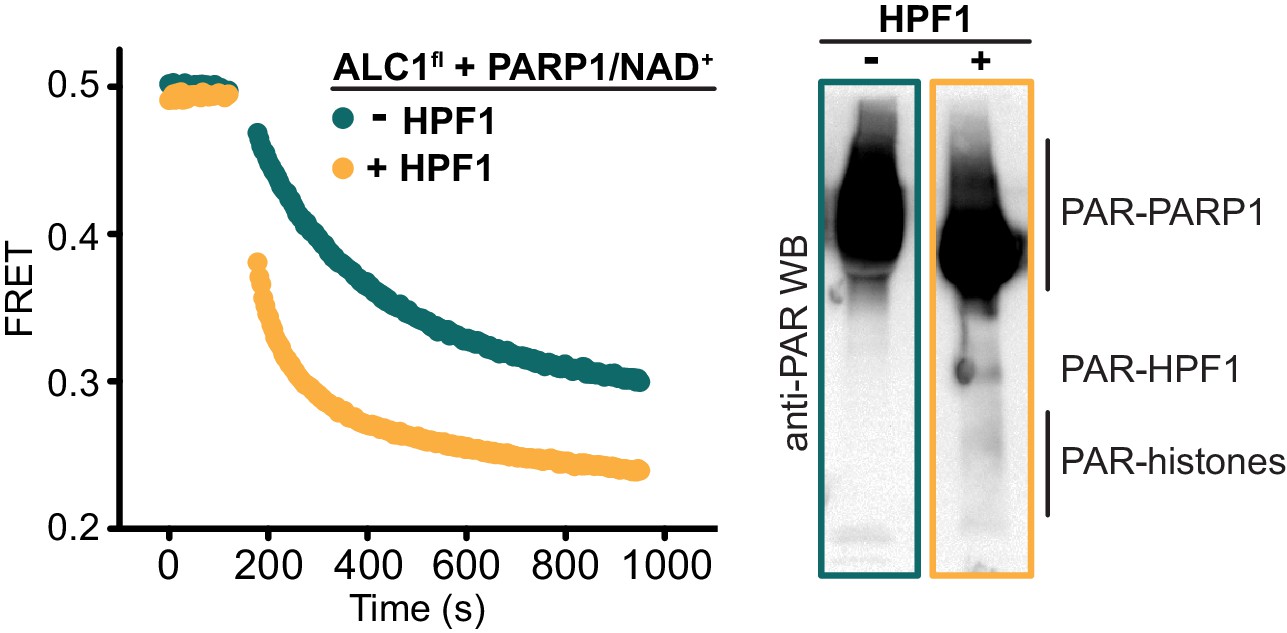
Nucleosome sliding assay replicated as shown in Figure 1B.
The PARylation reactions were scaled up prior to the sliding assay (left), which allowed the rest of the reaction products to be subjected to western blotting (right).
Figure 1—figure supplement 2
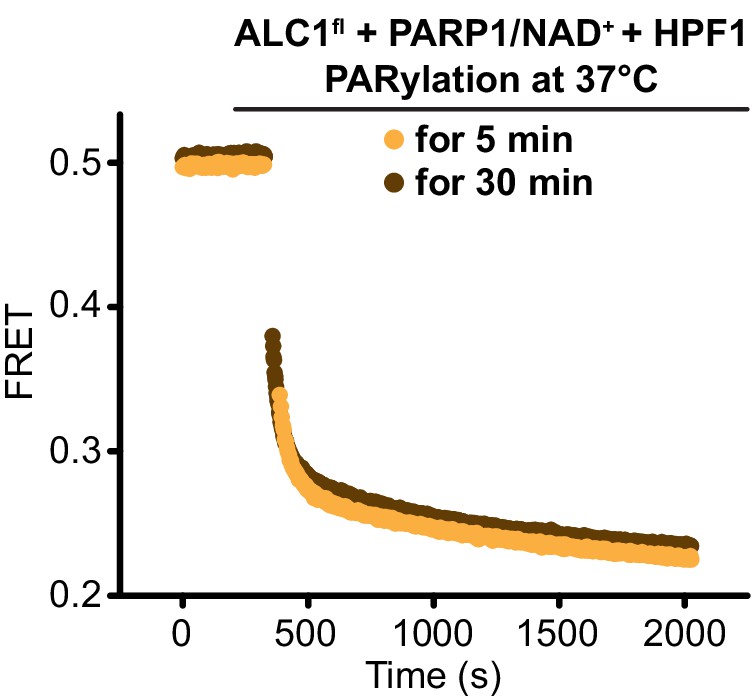
Nucleosome sliding assays with 5 min (orange) or 30 min (brown) incubation time of the PARylation reaction prior to the initiation of the sliding reaction.
Superimposition of the sliding curves indicates that the PARylated nucleosome substrate is functionally identical between the two reactions, and therefore that 5 min of incubation is enough for the PARylation reaction to generate an optimal substrate for ALC1.
Figure 1—figure supplement 3
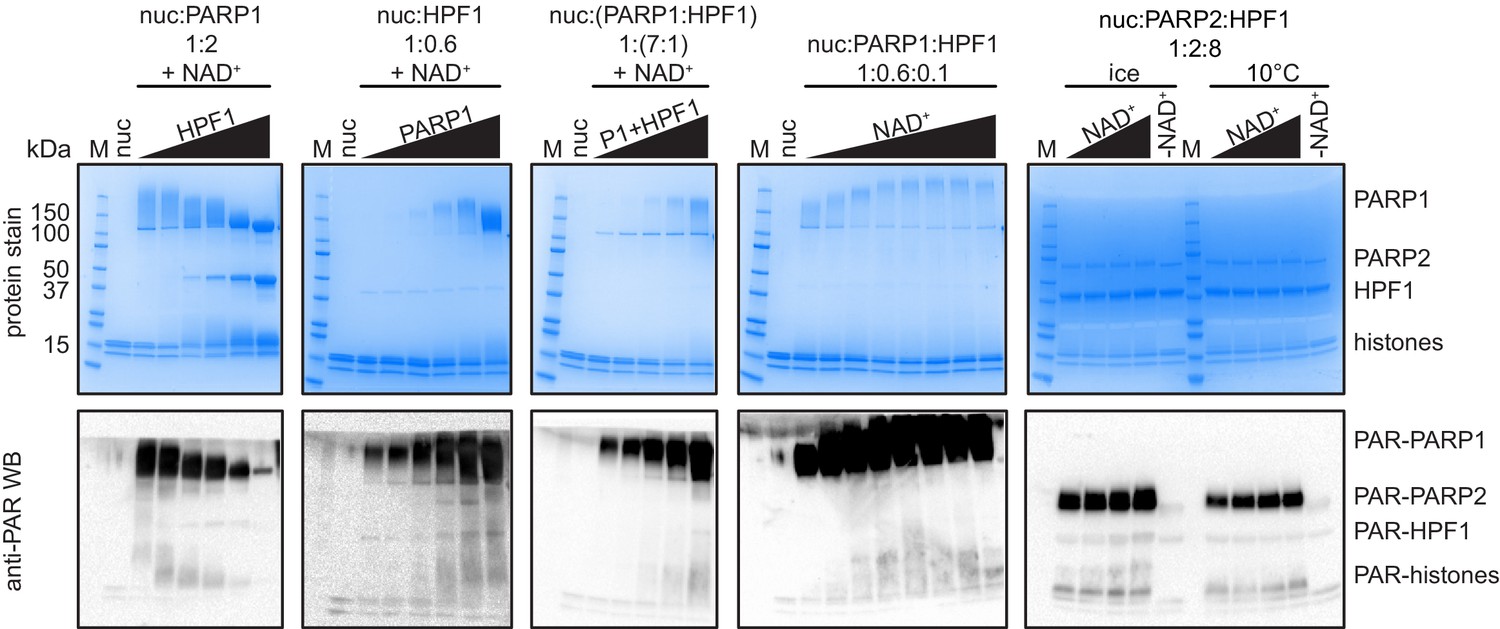
SDS–PAGE and Western blot analysis of different PARylation conditions of nucleosomes by PARP1/HPF1 or PARP2/HPF1.
Figure 1—figure supplement 4
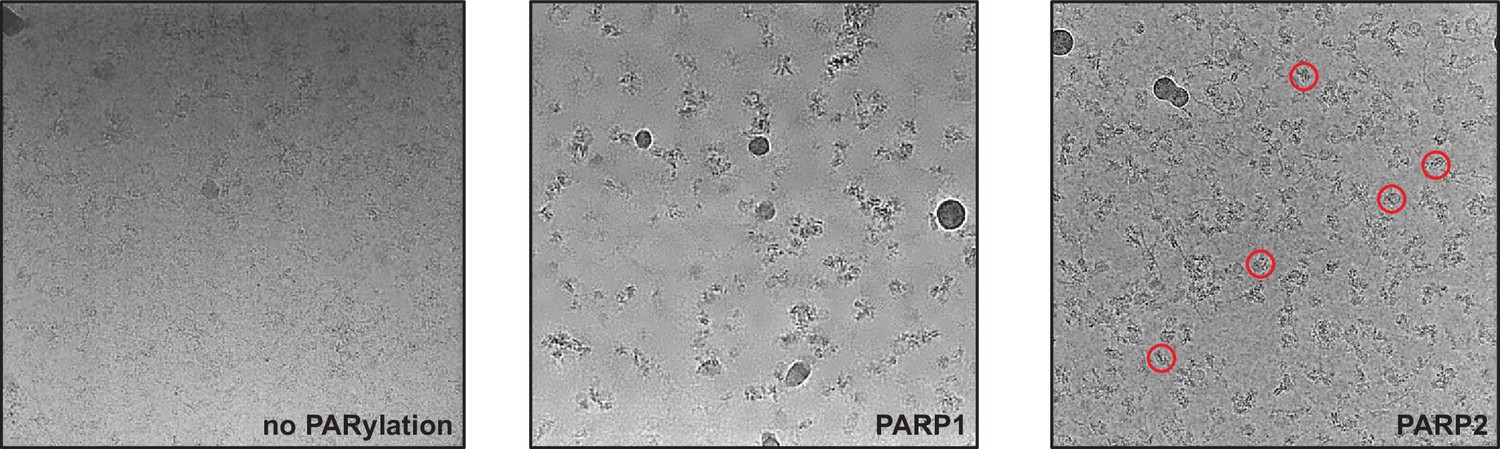
Screening micrographs of complexes prepared with ALC1 and nucleosomes either unmodified (left), PARylated by PARP1 and HPF1 (middle), or PARylated by PARP2 and HPF1 (right).
Figure 2 with 3 supplements
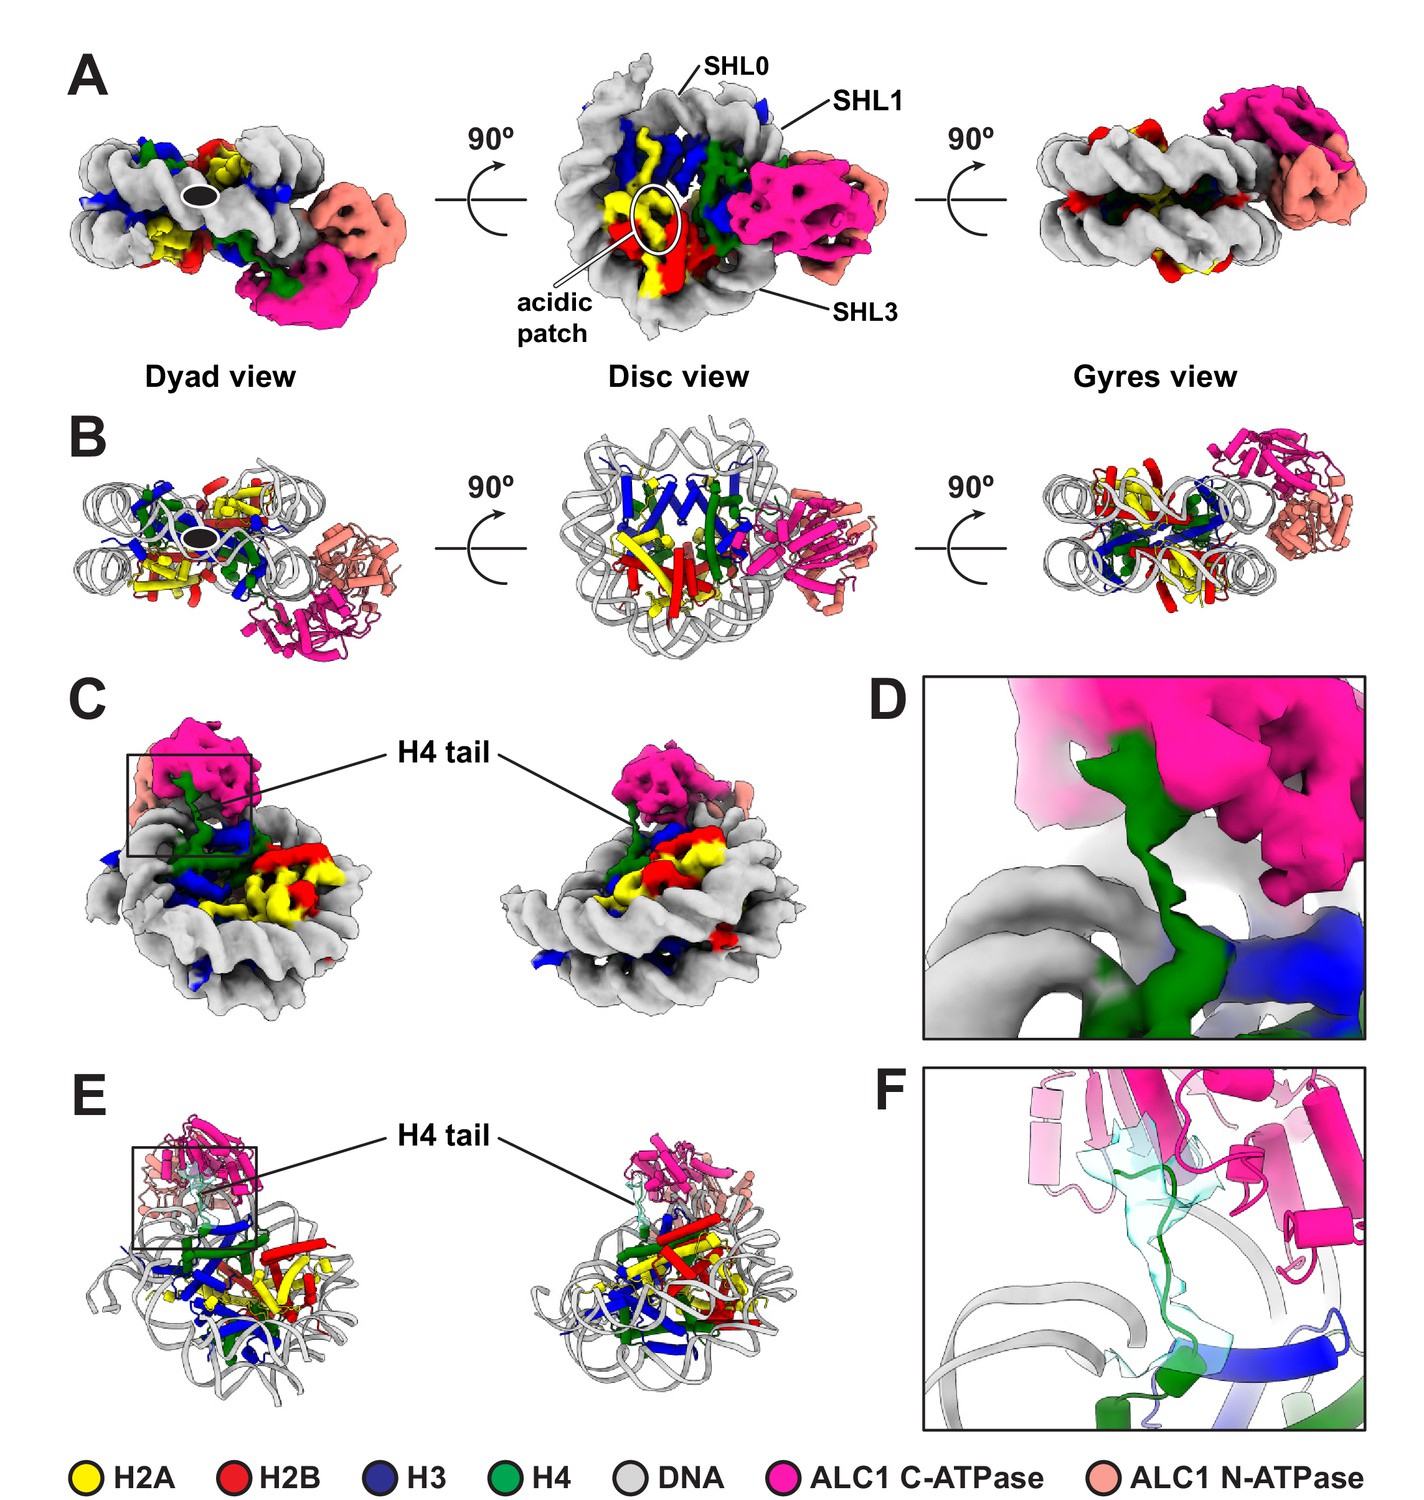
Cryo-EM structure of the complex between a PARylated nucleosome and ALC1 in its active state.
(A) Cryo-EM map of the complex between a PARylated nucleosome and ALC1 in the state tightly bound to SHL2 and the H4 tail. The map is shown at a contour level of 0.15 and colored by chain assignment (H3 in blue, H4 in green, H2A in yellow, H2B in red, DNA in gray, and ALC1 in pink). The black ellipse in the dyad view indicates the nucleosome dyad axis. Superhelical locations 0 (dyad), 1, and 3 and the location of the acidic patch are indicated. (B) Atomic model of the complex between a PARylated nucleosome and ALC1 in the state tightly bound to SHL2 and the H4 tail. Same views and same color code as in (A). The black ellipse in the dyad view indicates the nucleosome dyad axis. (C) Same cryo-EM map as in (A), displayed at the same contour level, but in two different orientations, showing the H4 tail interacting with the C-terminal ATPase domain of ALC1. Same color code as in (A). (D) Close-up view of the boxed region in (C). (E) Atomic model shown in the same two orientations as in (C). In addition to the same color code as in (A), the cryo-EM density of the H4 tail is shown as a turquoise transparent surface, at the same contour level as in (A), (C), and (D). (F) Close-up view of the boxed region in (E).
Figure 2—figure supplement 1
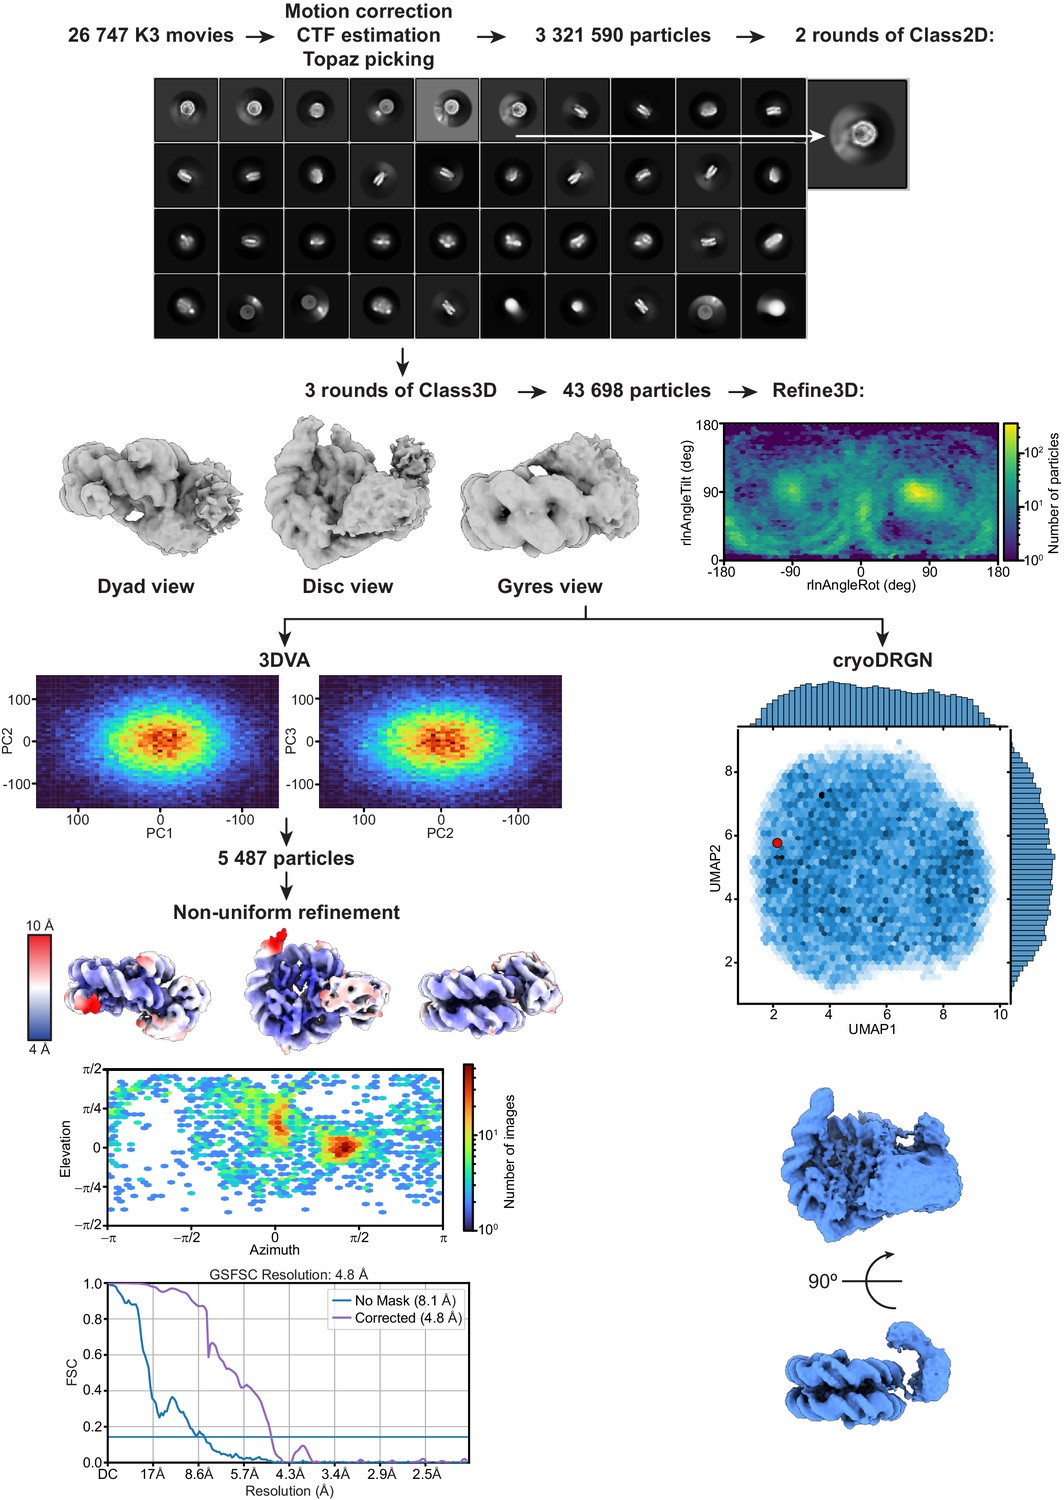
Overview of cryo-EM data processing and analysis.
Figure 2—figure supplement 2
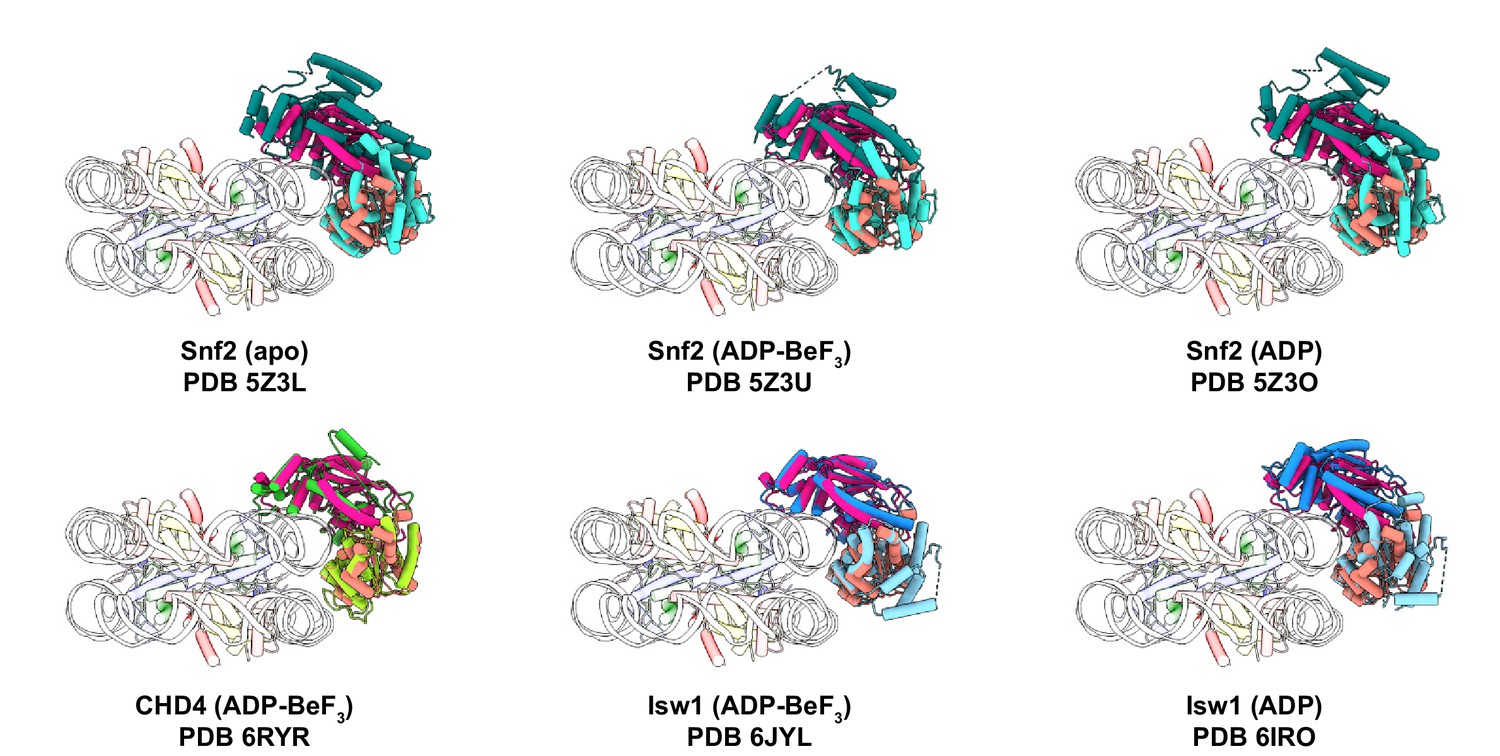
Superimposition of previous structures of remodeler-nucleosome complexes to our structure of the ALC1-nucleosome complex.
ALC1 is colored in two shades of pink as in Figure 2. For clarity, only the ATPase motor is shown for structures also containing other domains.
Figure 2—figure supplement 3
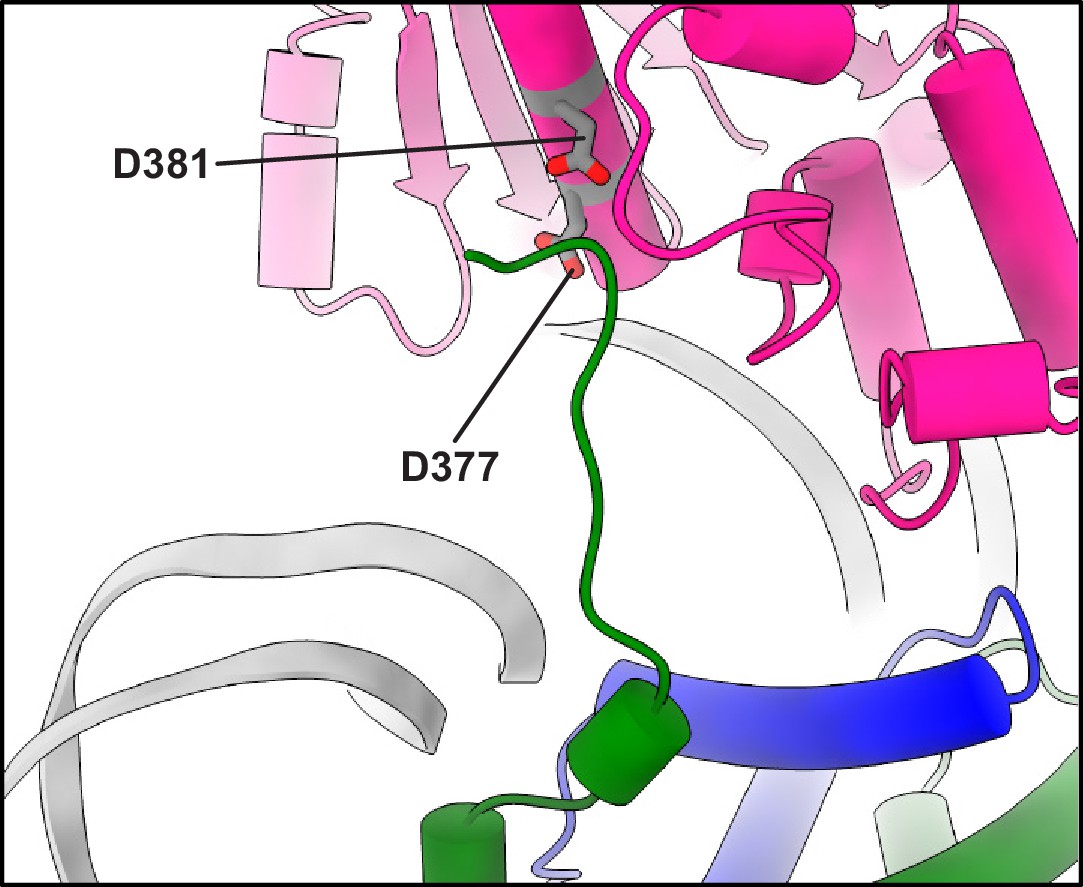
Close-up view of the structure of the complex between a PARylated nucleosome and ALC1 in the tightly bound state, showing the H4 tail interacting with the C-terminal ATPase domain of ALC1.
The same part of the complex is shown as in Figure 2F, with two residues from ALC1, D377, and D381, shown as gray sticks.
Figure 3 with 3 supplements
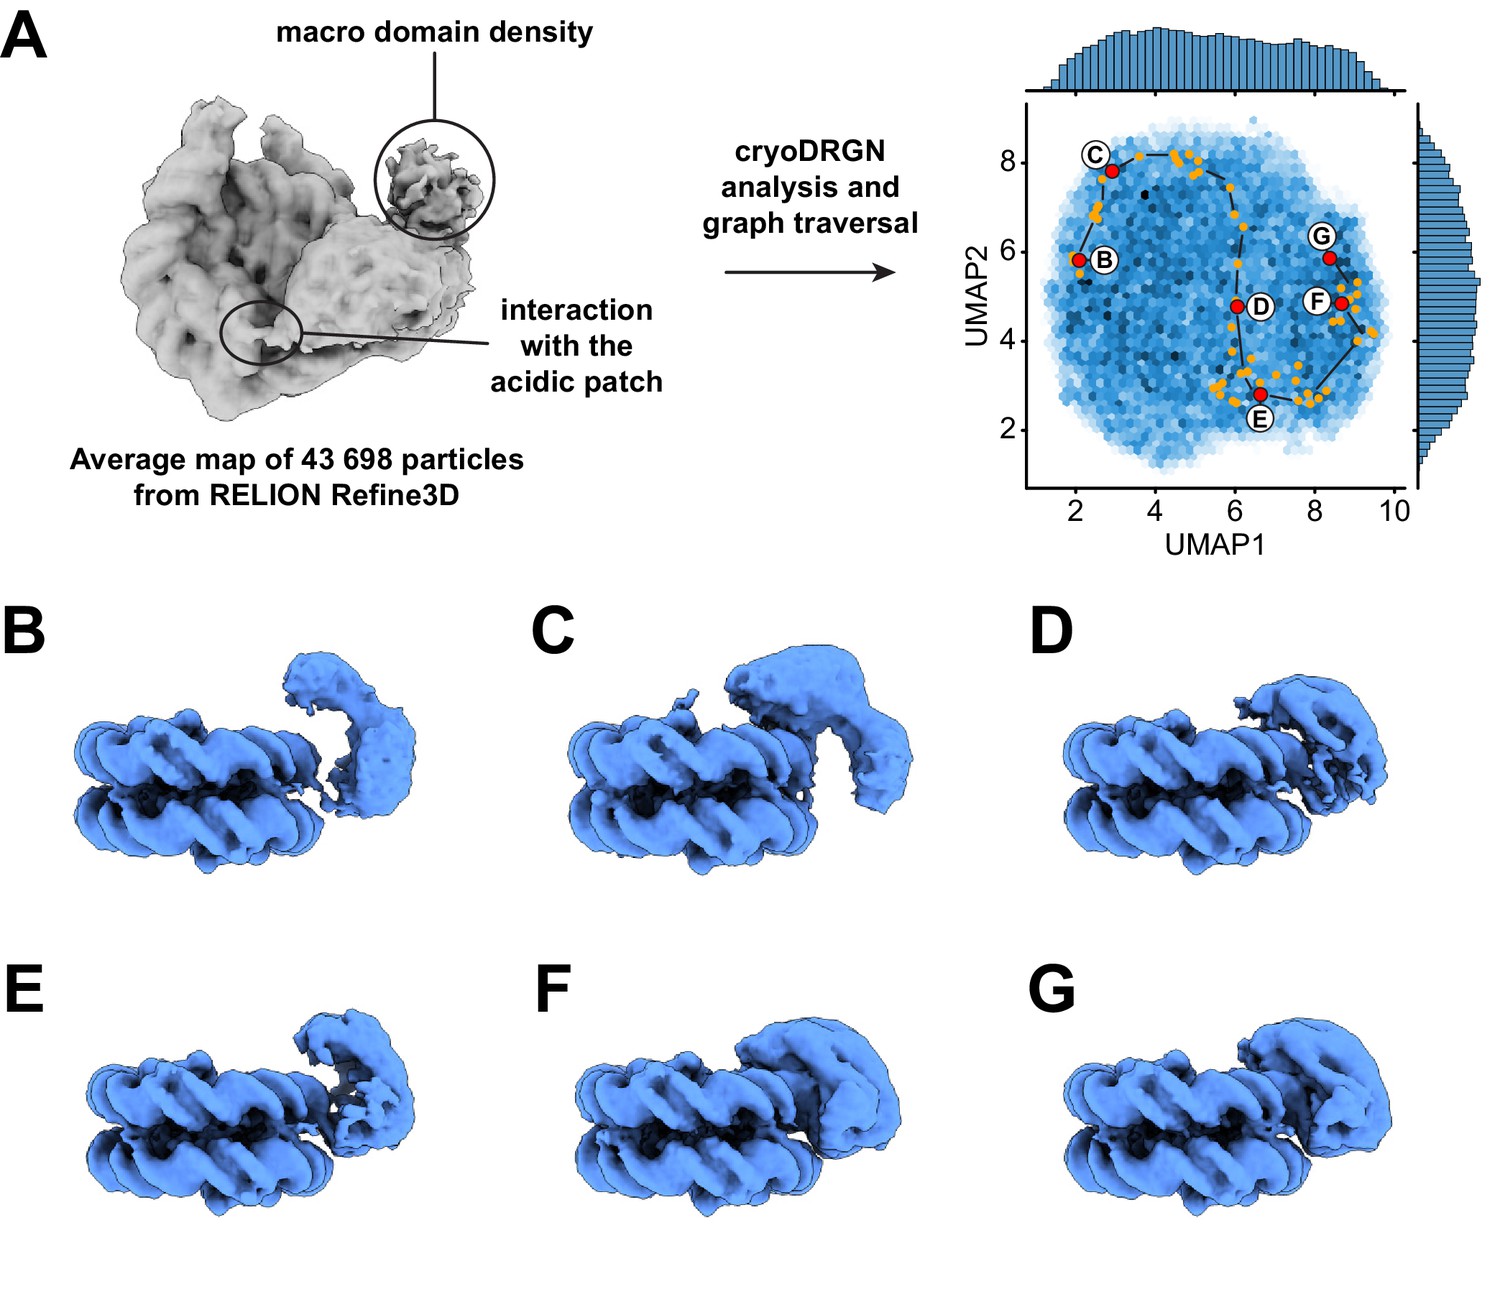
Dynamics of the ATPase domain of ALC1.
(A) Left: consensus map from 3D refinement in RELION of 43,698 particles, displayed at a contour level of 0.015 and in disc view. Regions of the map assigned to an interaction with the nucleosome acidic patch and to the macro domain are labeled. Right: UMAP visualization of the latent variable distribution of these same 43,698 particle images after training of an 8-dimensional latent variable model with cryoDRGN. Dots indicate all latent space coordinates that are part of the calculated graph traversal, labeled red dots indicate coordinates of maps shown in panels (B) – (G). Black lines are a visual guide and do not represent actual connectivity of the graph traversal. (B – G) Maps sampled at representative steps along the graph traversal shown in (A). All maps are displayed at a contour level of 0.025 and in gyres view.
Figure 3—figure supplement 1
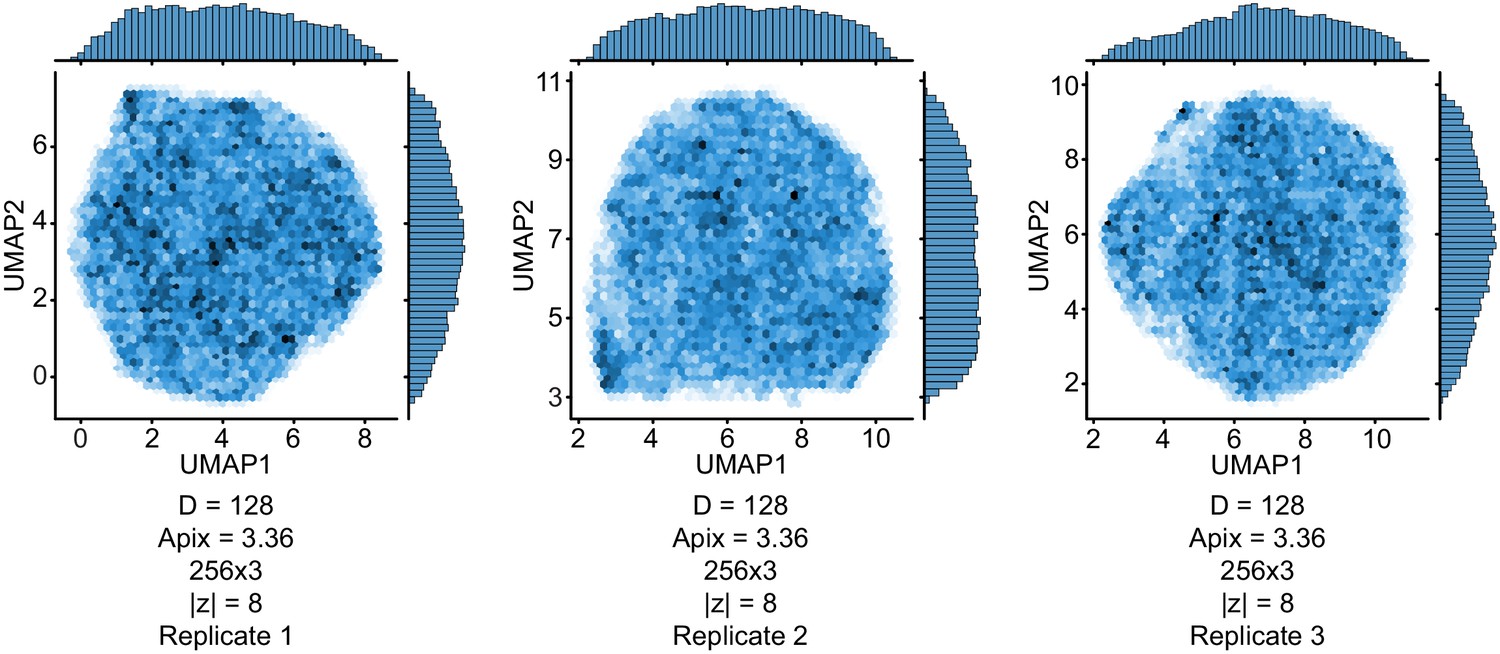
UMAP visualizations of the latent variable distributions from three replicate training runs of cryoDRGN with independent initializations, and with the indicated image size, pixel size, network architecture, and dimensionality of the latent variable.
Figure 3—figure supplement 2
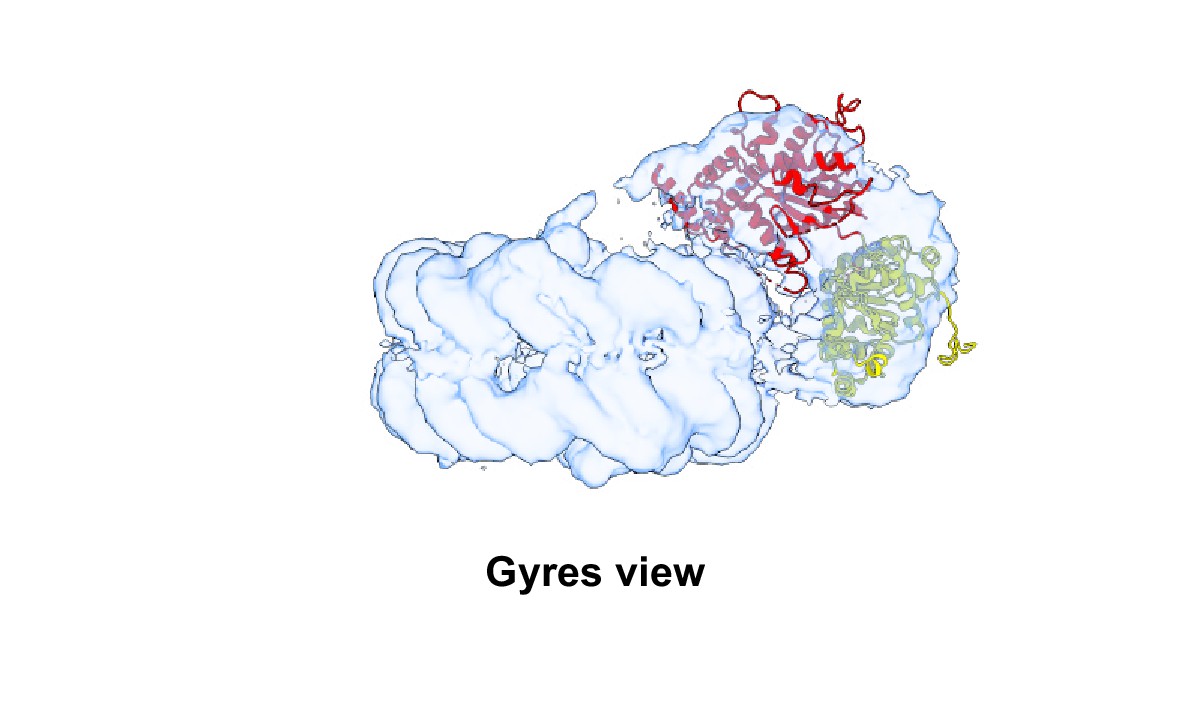
Atomic model of auto-inhibited ALC1 (PDB 7EPU) rigid-body fitted into one of the maps from cryoDRGN with an open conformation of the ATPase motor.
The N-ATPase lobe is colored yellow, the C-ATPase lobe is colored red. For clarity, the macro domain, linker, and single-chain antibody are not displayed.
Figure 3—figure supplement 3
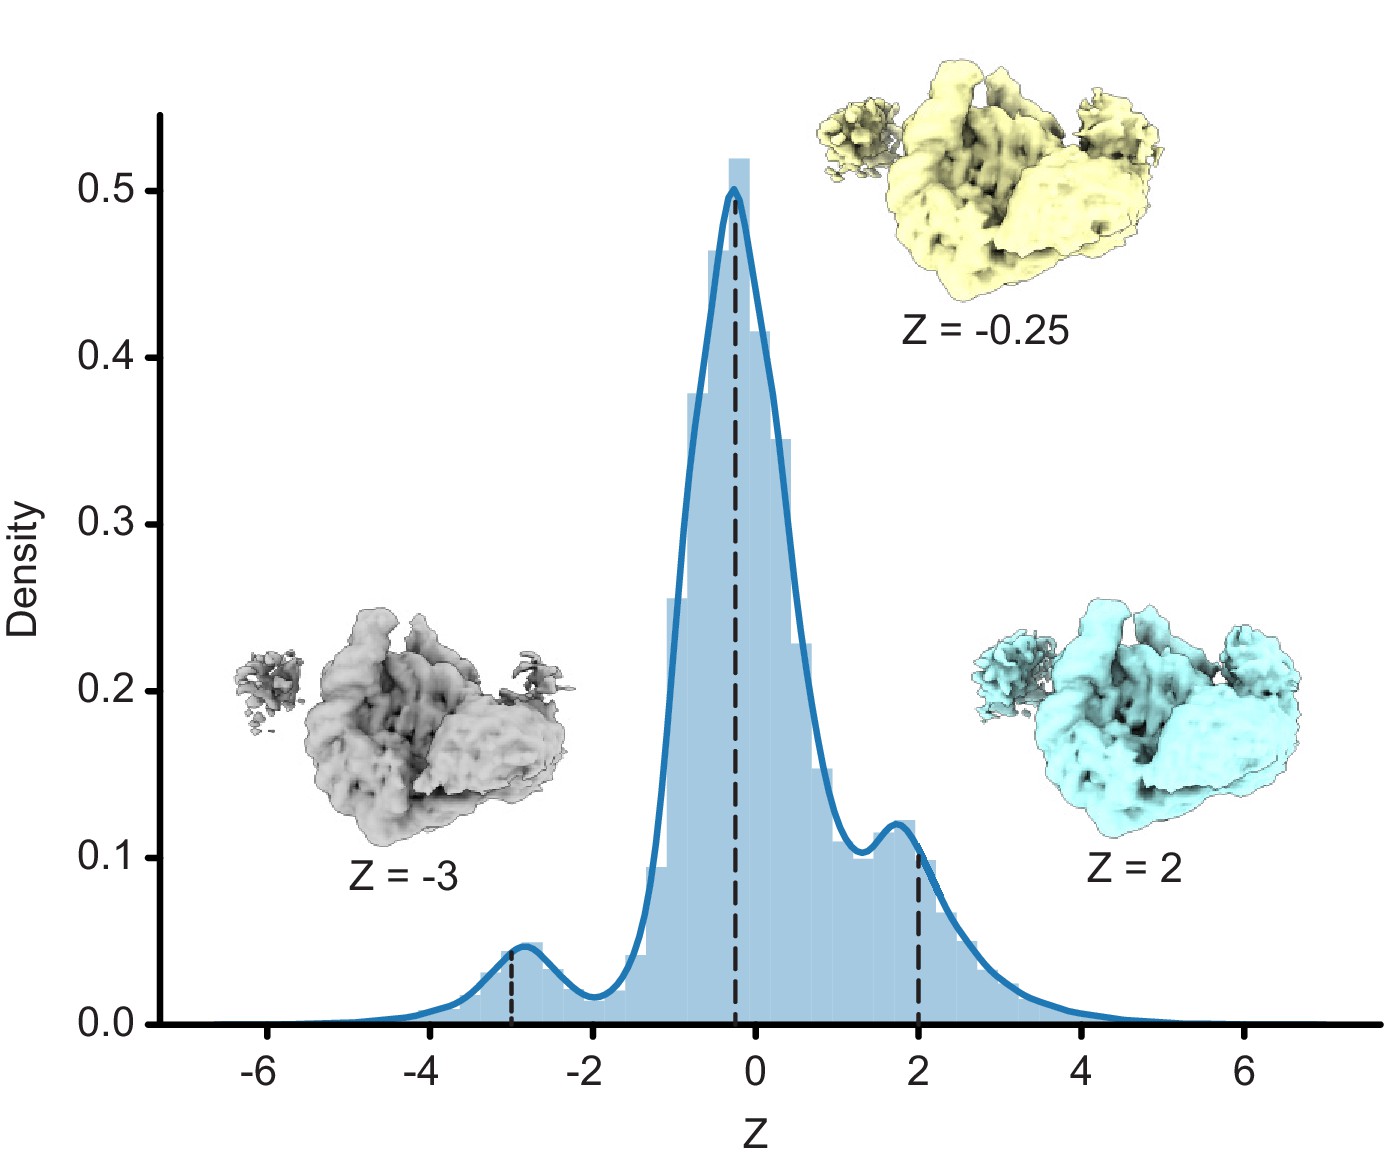
Distribution of Z values from a one-dimensional latent variable training run of cryoDRGN.
Maps generated by evaluating the decoder at Z values of the distribution’s peaks are shown.
Figure 4 with 1 supplement

Dynamics of the acidic patch interacting region and macro domain of ALC1.
(A) Left: consensus map from 3D refinement in RELION of 43,698 particles, displayed at a contour level of 0.015 and in disc view. Regions of the map assigned to an interaction with the nucleosome acidic patch and to the macro domain are labeled (same panel as in Figure 3A). Right: same plot as in Figure 3A but sampling different steps along the same graph traversal. Dots indicate all latent space coordinates that are part of the calculated graph traversal, labeled red dots indicate coordinates of maps shown in panels (B) – (G). Black lines are a visual guide and do not represent actual connectivity of the graph traversal. (B) – (G) Maps sampled along the graph traversal shown in (A). All maps are displayed at a contour level of 0.013 and in disc view.
Figure 4—figure supplement 1
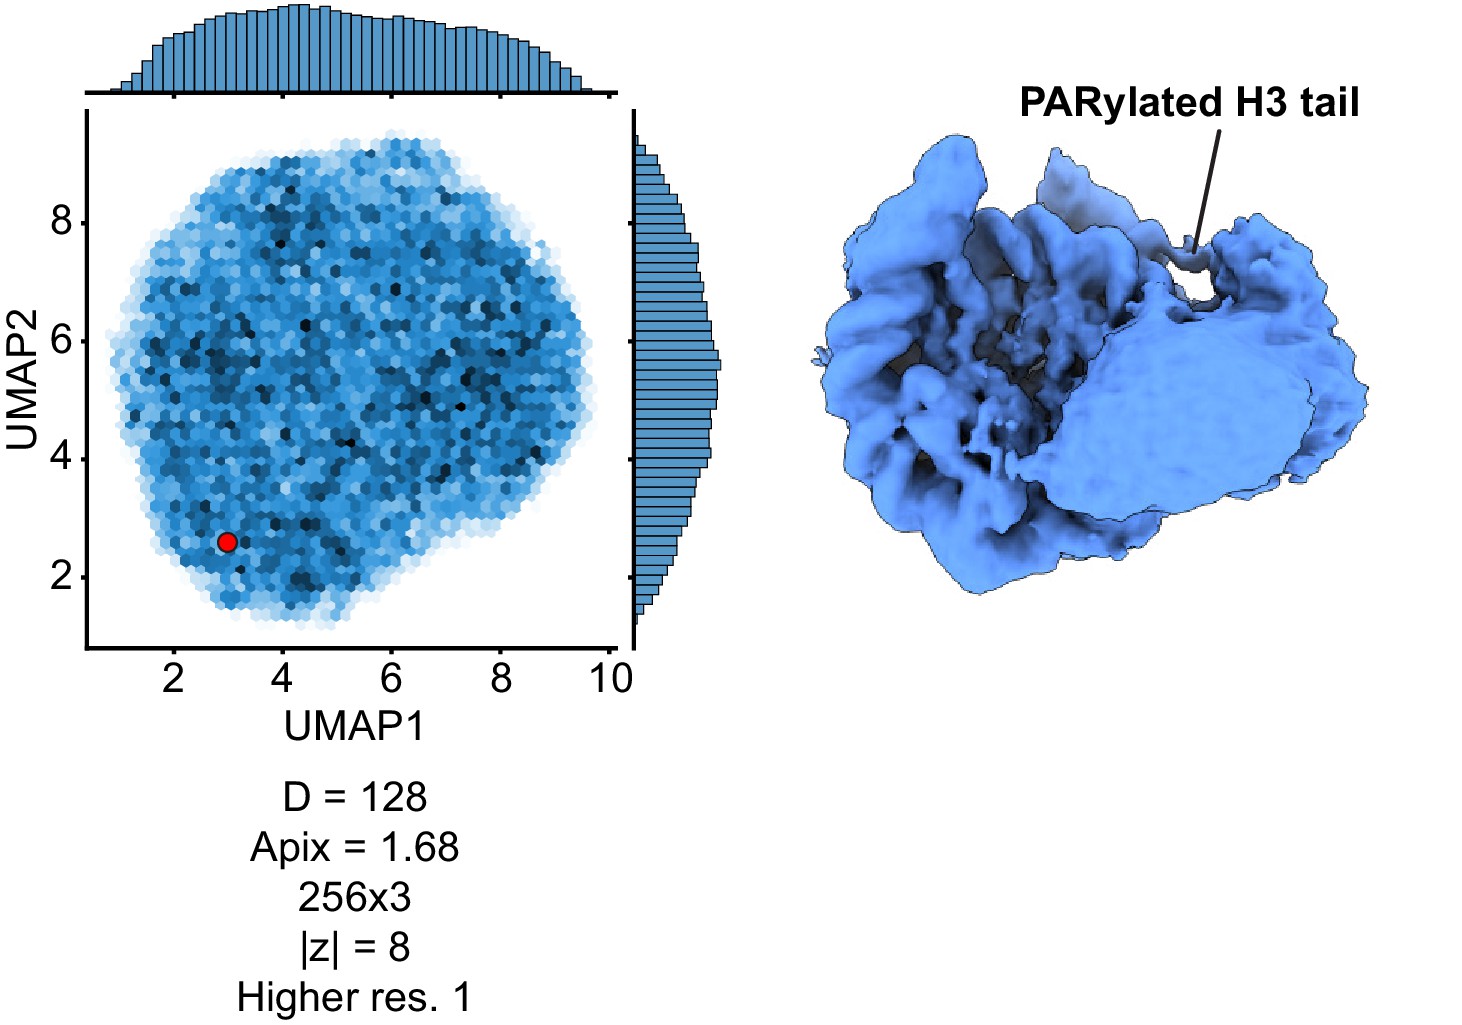
UMAP visualization of the latent variable distribution from a replicate training run of cryoDRGN with independent initialization and with the indicated image size, pixel size, network architecture, and dimensionality of the latent variable.
The map displayed on the right was produced by evaluating the decoder at the Z values indicated by the red dot in the UMAP distribution.
Figure 5 with 5 supplements

ALC1 kinetics in nucleosome sliding and ATPase assays.
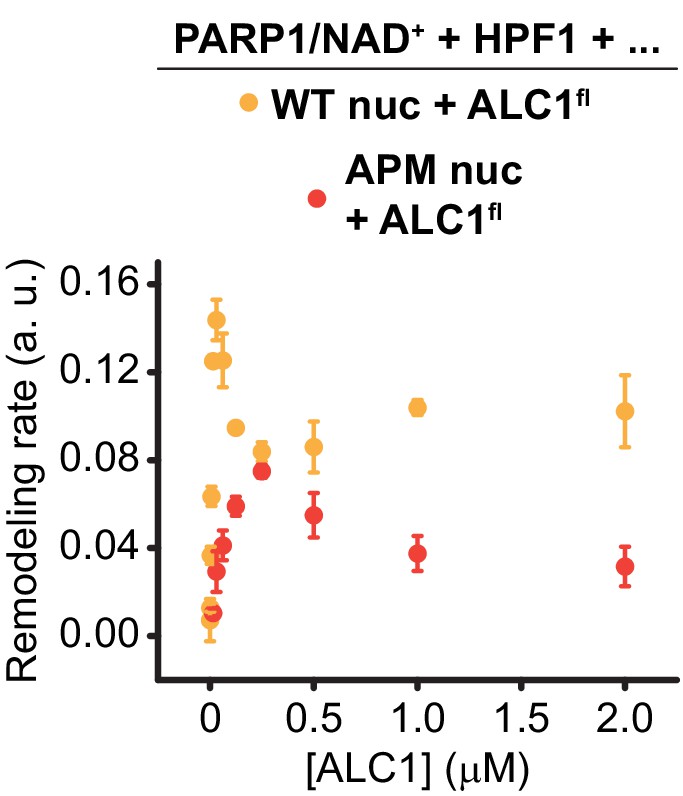
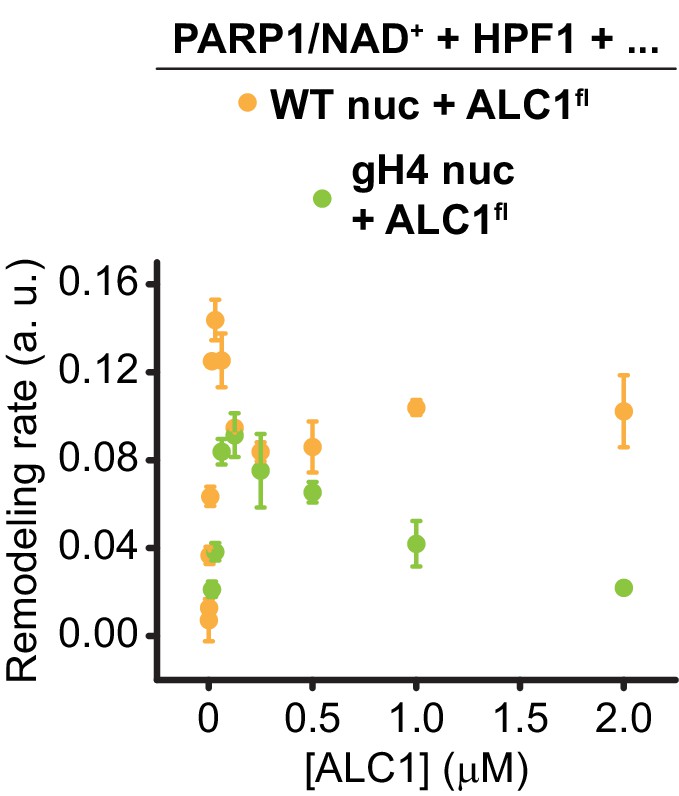
(A) Left: schematic of asymmetric nucleosomes PARylated by PARP1 with and without HPF1. Right: adding ALC1 and ATP to the PARylated FRET-labeled nucleosome results in sliding the histone octamer away from the short linker DNA end, resulting in a decrease of FRET. (B) Saturation curves of nucleosome sliding rates for 10 nM WT nucleosomes versus varying concentrations of ALC1fl. Nucleosome sliding assays were performed after PARylation by 80 nM PARP1 with 25 µM NAD+ in the absence (teal) or presence (orange) of 20 nM of HPF1. Points and error bars represent the mean and standard deviation, respectively, from three independent experiments. (C) Saturation curve of nucleosome sliding rates for 10 nM WT nucleosomes versus varying concentrations of ALC1fl R611A/S612A. Nucleosome sliding assays were performed after PARylation by 80 nM PARP1 and 20 nM HPF1 with 25 µM NAD+. Points and error bars represent the mean and standard deviation, respectively, from three independent experiments. (D, E) Saturation curves of nucleosome sliding rates for 10 nM APM (D) and gH4 (E) nucleosomes versus varying concentrations of ALC1fl. Nucleosome sliding assays were performed after PARylation by 80 nM PARP1 and 20 nM HPF1 with 25 µM NAD+. Points and error bars represent the mean and standard deviation, respectively, from three independent experiments. (F) ATPase activity for 2 µM ALC1fl (teal, orange, and green) or ALC1fl R611A/S612A (blue) in the presence of 250 nM 10-N-10 WT nucleosomes (teal, orange, and blue) or 10-N-10 gH4 nucleosomes (green), activated by PARylation by PARP1 with (orange, blue, and green) or without HPF1 (teal). Bars and error bars represent the mean and standard deviation, respectively, from three independent experiments.
-
Figure 5—source data 1
Nucleosome sliding and ATPase data.
- https://cdn.elifesciences.org/articles/71420/elife-71420-fig5-data1-v2.xlsx
Figure 5—figure supplement 1
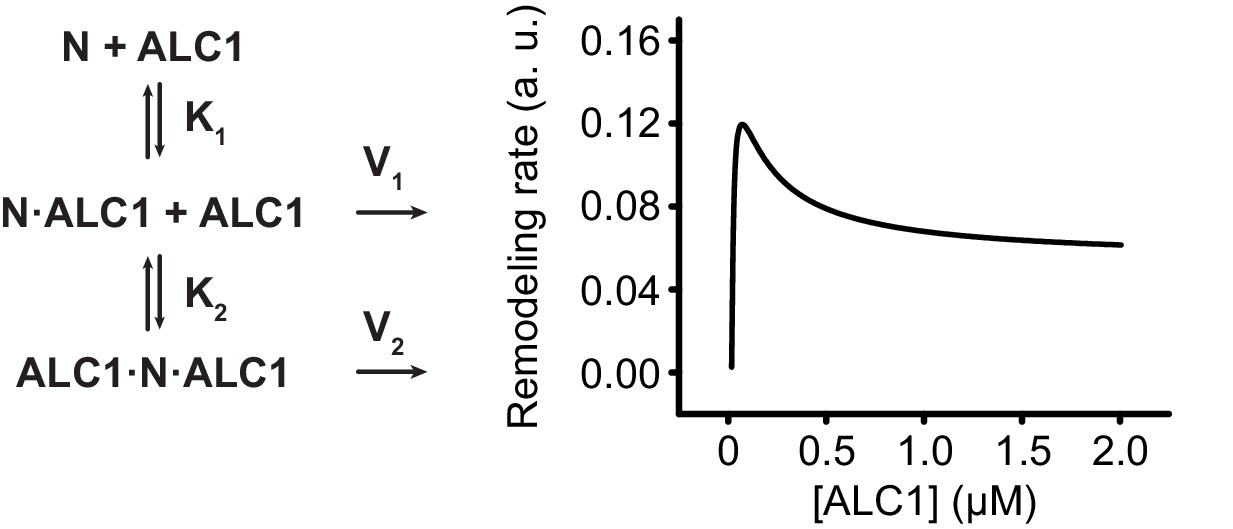
A simplistic model to reproduce the observed deviation from Michaelis-Menten kinetics.
Reaction diagram of a tentative model (left) and resulting simulated saturation curve (right) for ALC1-catalyzed nucleosome sliding, where ALC1 first binds to the PARylated side of the nucleosome with a high affinity (K1), which results in fast unopposed sliding towards the longer linker (V1). ALC1 then binds to the other side of the nucleosome, which opposes sliding toward the longer linker and results in slower remodeling rate (V2). See Materials and methods section for further details.
Figure 5—figure supplement 2
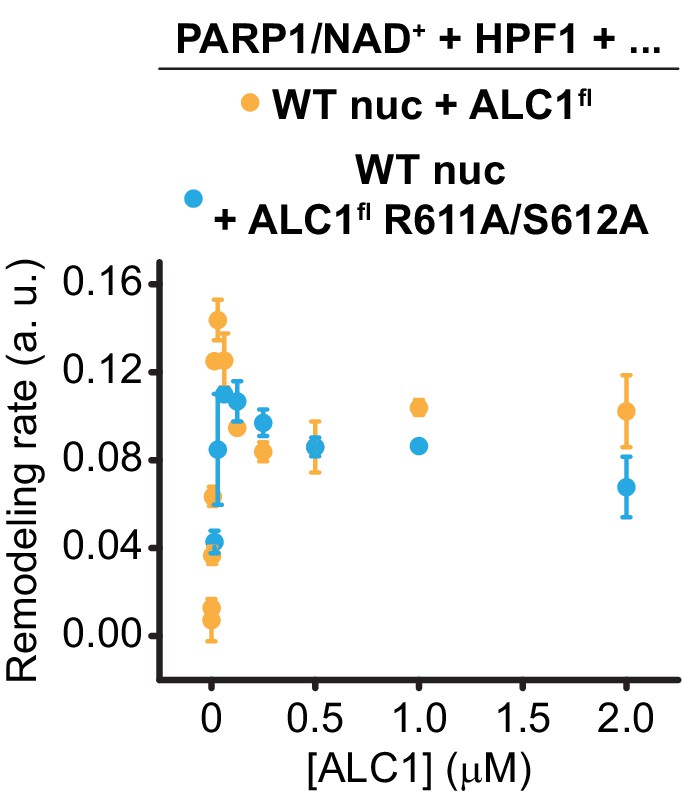
Saturation curve shown in Figure 5C (blue) overlaid with the curve for wild-type ALC1 shown in Figure 5B (orange).
Same data and color code as in Figure 5.
Figure 5—figure supplement 3
Saturation curve shown in Figure 5D (red) overlaid with the curve for wild-type ALC1 shown in Figure 5B (orange).
Same data and color code as in Figure 5.
Figure 5—figure supplement 4
Saturation curve shown in Figure 5E (green) overlaid with the curve for wild-type ALC1 shown in Figure 5B (orange).
Same data and color code as in Figure 5.
Figure 5—figure supplement 5
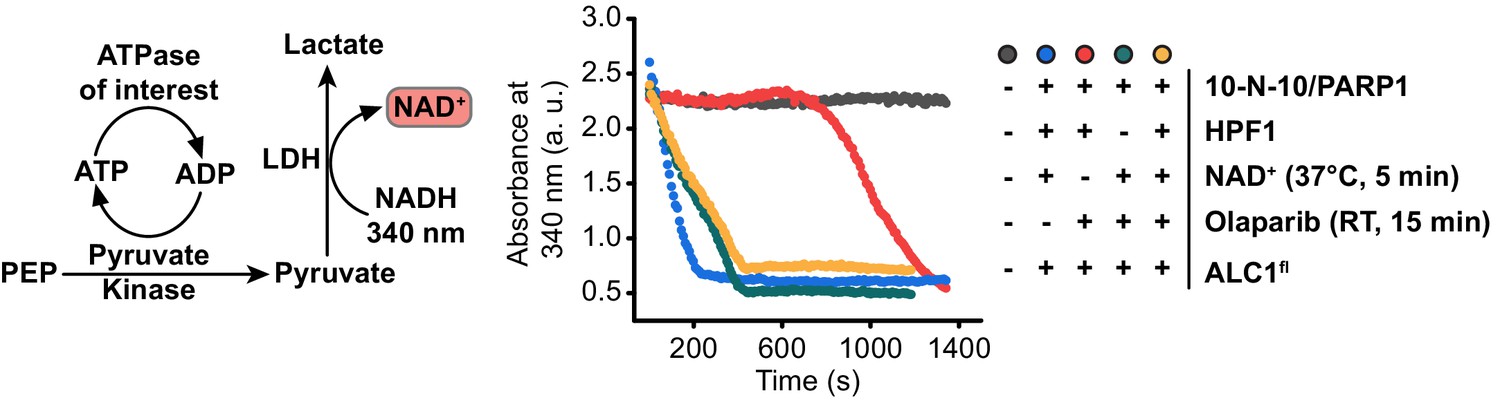
Continuous kinetic assay to measure ATP consumption.
Left: schematic of the ATPase assay used in this study. Right: Raw data curves for control ATPase assays. The assay produces NAD+, which is the substrate of PARP1. We therefore include the PARP inhibitor Olaparib in our ATPase assays, to avoid further PARylation during the assay. See Materials and methods for details.
Figure 6
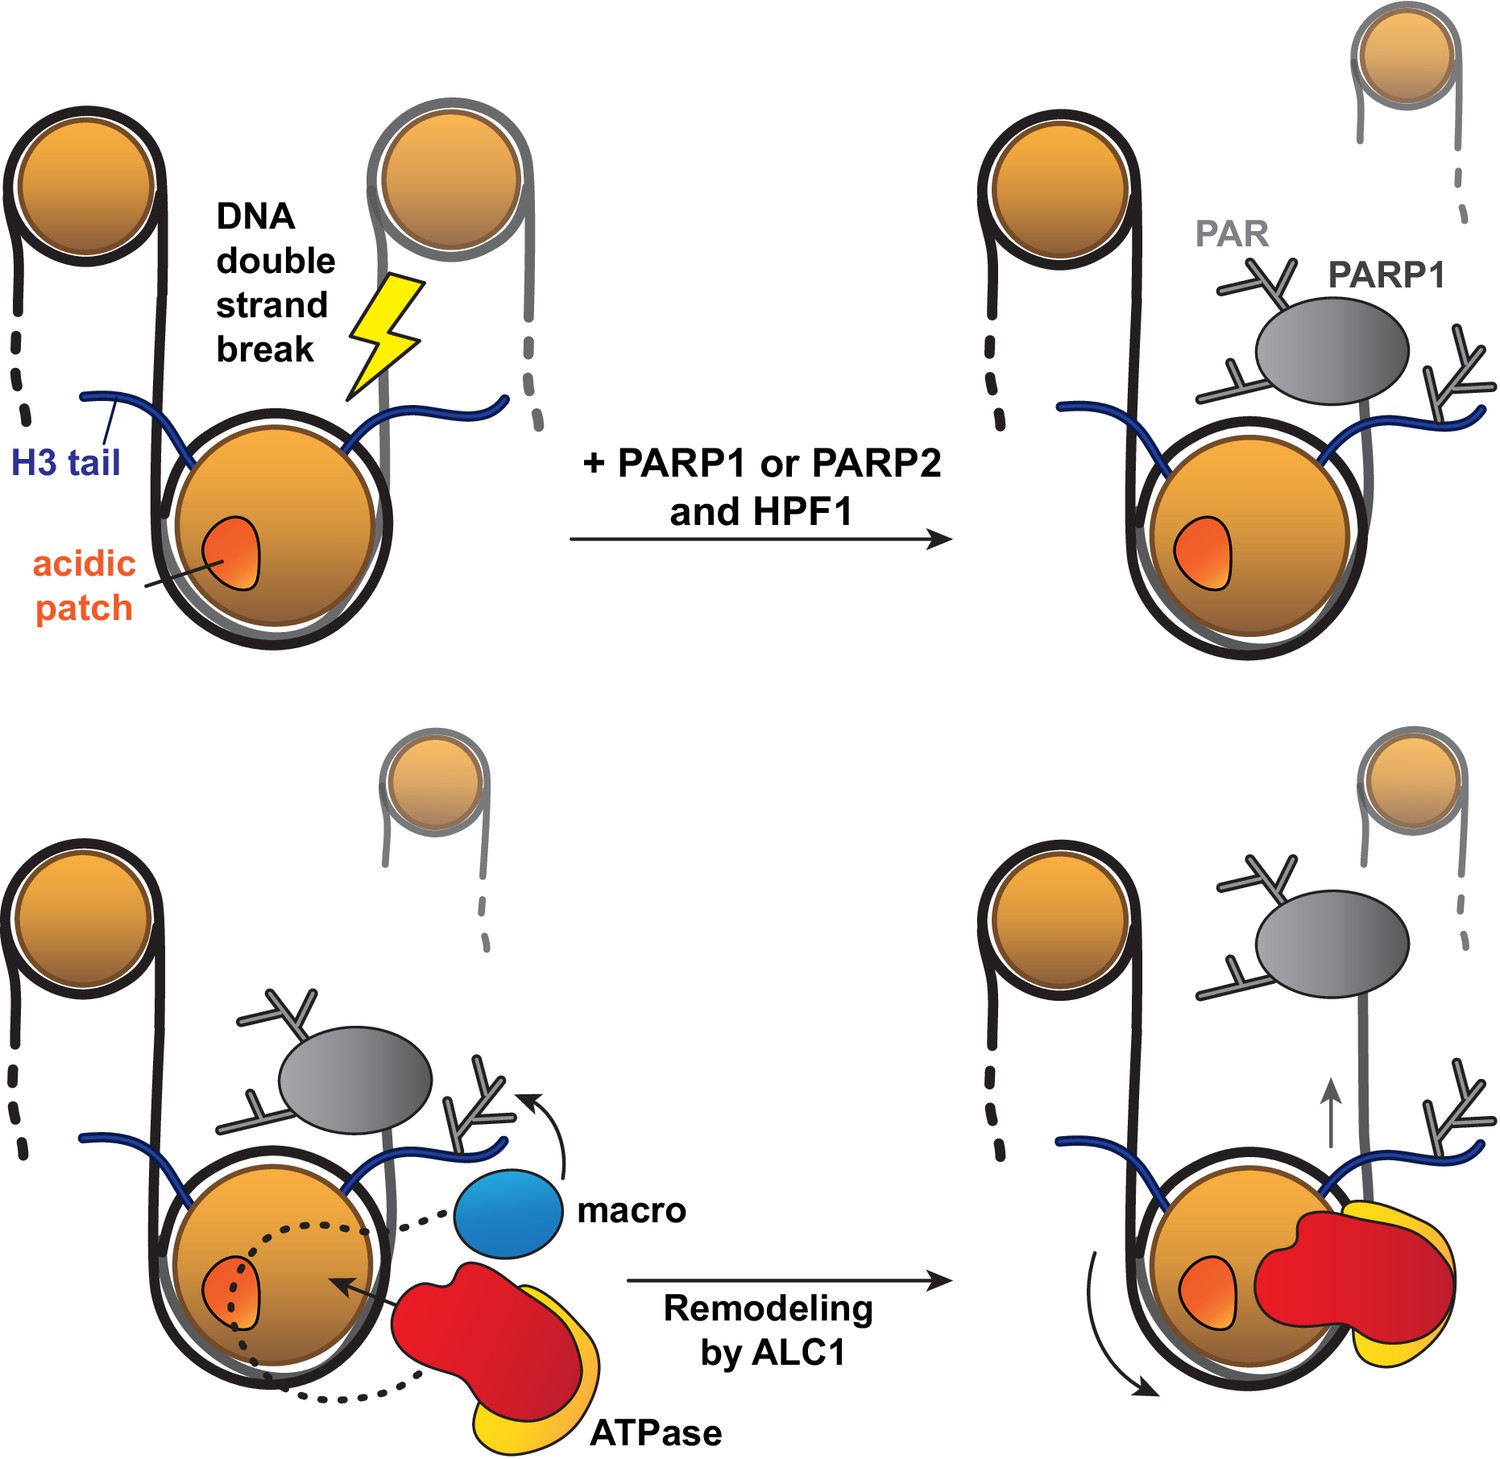
Model for the recognition of a PARylated nucleosome by ALC1.
Upon DNA damage, PARP1 or PARP2 and HPF1 deposit PAR chains on histones, causing the rapid recruitment of proteins containing PAR reader domains. Among these proteins, ALC1 selectively binds to PAR chains with its macro domain and recognizes the closest nucleosome by probing its acidic patch. Once the macro domain and linker region of ALC1 jointly recognize a PARylated nucleosome, the ATPase motor is released from their auto-inhibitory effect and can tightly bind to the nucleosomal DNA at SHL2 for productive remodeling. Preferential PARylation of target sites spatially closest to the DNA break causes preferential recruitment of ALC1 on the side of the nucleosome such that remodeling slides this nucleosome away from the break. By setting directionality in remodeling, this mechanism could promote exposure of the lesion to downstream repair factors.
Author response image 1
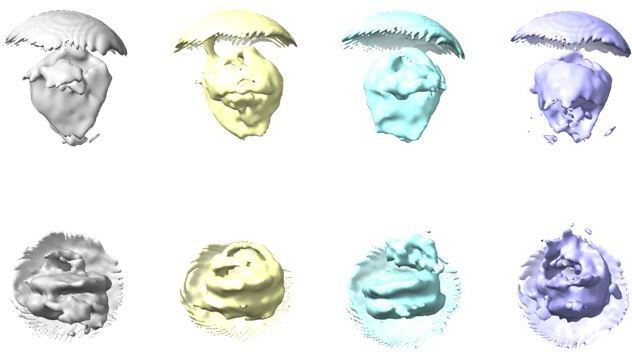
Four ab initio models generated from a random subset of 50 000 particles taken from the particles retained after 2D classification.
Top row shows models in disc view, bottom row shows the same models in gyres view.
Author response image 2
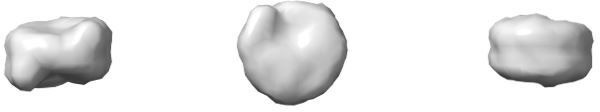
Synthetic 3D reference used to prime 3D classification.
This reference was generated from an atomic model of a free nucleosome (PDB entry 3LZ0) with a low-pass filter to 30 Å resolution. The model is shown in dyad view (left), disc view (center) and gyres view (right).
Author response image 3
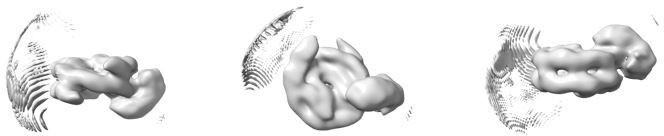
Ab initio model generated from the 43 698 particles after removal of their Euler angles.
The model is shown in dyad view (left), disc view (center) and gyres view (right).
Author response image 4
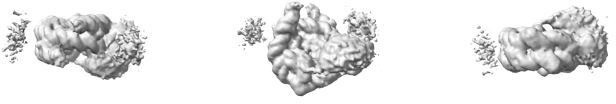
Map from 3D refinement of the 43 698 particles primed with the ab initio model in Author response image 3.
This map is shown at the same contour level as the map in Figure 3A.
Videos
Video 1
Traversal of the first principal component of variability in the Z values assigned by cryoDRGN, with maps shown in dyad view.
Video 2
Traversal of the first principal component of variability in the Z values assigned by cryoDRGN, with maps shown in disc view.
Video 3
Traversal of the first principal component of variability in the Z values assigned by cryoDRGN, with maps shown in gyres view.
Video 4
Dynamics of the ATPase lobes of ALC1.
Video 5
Dynamics of the acidic patch interacting region and macro domain of ALC1.
Video 6
Dynamics of the H4 tail interaction.
Video 7
Traversal of the first principal component of variability in the Z values assigned by cryoSPARC 3DVA, with maps shown in dyad view.
Video 8
Traversal of the first principal component of variability in the Z values assigned by cryoSPARC 3DVA, with maps shown in disc view.
Video 9
Traversal of the first principal component of variability in the Z values assigned by cryoSPARC 3DVA, with maps shown in gyres view.
Tables
Table 1
Cryo-EM data collection and refinement statistics.
| Data collection and processing | ||
|---|---|---|
| Acceleration voltage (kV) | 300 | |
| Spherical aberration (mm) | 2.7 | |
| Amplitude contrast (fraction) | 0.1 | |
| Image pixel size (Å/pixel) | 0.84 | |
| Electron exposure per frame (e-/Å2) | 1.125 | |
| Number of movie frames | 40 | |
| Total electron exposure (e-/Å2) | 45 | |
| Nominal defocus range (µm) | –1.0 to –2.5 | |
| Number of movies collected | 26,747 | |
| Number of picked particles | 3,321,590 | |
| Particles used for reconstruction | 5487 (single map) | 43 698 (cryoDRGN analysis) |
| Map symmetry imposed | C1 | |
| Map sharpening B-factor (Å2) | 128.2 | NA |
| Global resolution at 0.143 FSC (Å) | 4.8 | |
| Local resolution range (Å) | 4–20 | |
| Model building and refinement | ||
| Initial models used (PDB codes) | Nucleosome (6RYR)Template for homology modeling of ALC1 ATPase (6JYL) | NA |
| Number of atoms (hydrogens) | 29,161 (13 383) | |
| Number of protein residues | 1 214 | |
| Number of DNA residues | 298 | |
| Bond length RMSD (Å) | 0.004 | |
| Bond angles RMSD (°) | 0.760 | |
| MolProbity score | 1.74 | |
| Clash score | 6.69 | |
| Ramachandran outliers/allowed/favored (%) | 0.25/3.68/96.07 | |
| Rotamer outliers (%) | 1.36 | |
| Cβ outliers (%) | 0.00 | |
| CαBLAM outliers (%) | 2.72 | |
| Model to map CC (mask/box/peaks/volume) | 0.77/0.84/0.71/0.77 | |
Table 2
Settings of cryoDRGN training runs.
| Number of particles | Image size(pixels) | Pixel size(Å/pixel) | Image size (Å) | Dimension of Z | Network architecture | Number of epochs | Goal |
|---|---|---|---|---|---|---|---|
| 43,698 | 128 | 3.36 | 430 | 1 | 256 × 3 | 50 | Detection of junk |
| 43,698 | 128 | 3.36 | 430 | 8 | 256 × 3 | 50 | Evaluation (rep. 1) |
| 43,698 | 128 | 3.36 | 430 | 8 | 256 × 3 | 50 | Evaluation (rep. 2) |
| 43,698 | 128 | 3.36 | 430 | 8 | 256 × 3 | 50 | Evaluation (rep. 3) |
| 43,698 | 128 | 1.68 | 215 | 8 | 256 × 3 | 50 | Higher res. 1 |
| 43,698 | 128 | 1.68 | 215 | 8 | 512 × 3 | 50 | Higher res. 2 |
Table 3
Kinetic parameters from nucleosome sliding assays.
Rates are expressed as the mean ± standard deviation from three independent measurements (NA: not applicable).
| Condition | Sliding rate (a. u.) at [ALC1] = 31.25 nM | [ALC1] at peak (nM) | Sliding rate at peak (a.u.) | Sliding rate at saturation ([ALC1] = 2 μM) |
|---|---|---|---|---|
| -HPF1 | 0.059 ± 0.002 | NA | NA | 0.101 ± 0.015 |
| + HPF1 | 0.144 ± 0.009 | 31.25 | 0.144 ± 0.009 | 0.102 ± 0.016 |
| + HPF1, ALC1fl R611A, S612A | 0.085 ± 0.025 | 62.50 | 0.110 ± 0.003 | 0.068 ± 0.014 |
| + HPF1, APM nuc | 0.029 ± 0.009 | 250.00 | 0.075 ± 0.003 | 0.032 ± 0.009 |
| + HPF1, gH4 nuc | 0.038 ± 0.004 | 125.00 | 0.091 ± 0.010 | 0.022 ± 0.002 |
Key resources table
| Reagent type (species) or resource | Designation | Source or reference | Identifiers | Additional information |
|---|---|---|---|---|
| Strain, strain background (E. coli) | Rosetta 2 (DE3) | Novagen | Cat# 71,400 | Chemically competent |
| Antibody | anti-poly (ADP) ribose polymer (mouse monoclonal) | Abcam | Cat# ab14459, RRID:AB_301239 | WB (1:500) |
| Antibody | Mouse IgG, HRP-linked whole Ab (from sheep) | Cytiva | Cat# NA931, RRID:AB_772210 | WB (1:5000) |
| Recombinant DNA reagent | Human ALC1fl (16-879) pNIC-CH2 (plasmid) | Lehmann et al., 2017 | UniProt ID Q86WJ1 | |
| Recombinant DNA reagent | Human ALC1cat (16-612) pNIC-CH2 (plasmid) | Lehmann et al., 2017 | UniProt ID Q86WJ1 | |
| Recombinant DNA reagent | Human ALC1macro (613-879) pNIC-CH2 (plasmid) | Lehmann et al., 2017 | UniProt ID Q86WJ1 | |
| Recombinant DNA reagent | Human HPF1 (1–346) pET28a (plasmid) | Gaullier et al., 2020 | UniProt ID Q9NWY4 | |
| Recombinant DNA reagent | Human PARP1 (1–1014) pET28a (plasmid) | Langelier et al., 2017 | UniProt ID P09874 | |
| Recombinant DNA reagent | Human PARP2 Isoform 2 (1-570) pET28a (plasmid) | GenScript | UniProt ID Q9UGN5 | |
| Software, algorithm | RELION-3.1.1 | Zivanov et al., 2018 | RRID:SCR_016274 | https://www3.mrc-lmb.cam.ac.uk/relion/index.php/Main_Page |
| Software, algorithm | UCSF MotionCor2 version 1.3.2 | Zheng et al., 2017 | https://emcore.ucsf.edu/ucsf-software | |
| Software, algorithm | CTFFIND4 version 4.1.9 | Rohou and Grigorieff, 2015 | RRID:SCR_016732 | https://grigoriefflab.umassmed.edu/ctffind4 |
| Software, algorithm | Topaz version 0.2.4 | Bepler et al., 2019 | https://github.com/tbepler/topaz, Tristan, 2021 | |
| Software, algorithm | cryoSPARC version 3.2 | Punjani et al., 2017 | RRID:SCR_016501 | https://cryosparc.com/ |
| Software, algorithm | cryoDRGN version 0.3.2 | Zhong et al., 2021 | https://github.com/zhonge/cryodrgn, Ellen, 2021 | |
| Software, algorithm | UCSF ChimeraX 1.1 | Goddard et al., 2018 | RRID:SCR_015872 | https://www.rbvi.ucsf.edu/chimerax/ |
| Software, algorithm | ISOLDE 1.1 | Croll, 2018 | https://isolde.cimr.cam.ac.uk/ | |
| Software, algorithm | Phenix version 1.19.2–4158 | Liebschner et al., 2019 | RRID:SCR_014224 | https://www.phenix-online.org/ |
Additional files
Download links
A two-part list of links to download the article, or parts of the article, in various formats.
Downloads (link to download the article as PDF)
Open citations (links to open the citations from this article in various online reference manager services)
Cite this article (links to download the citations from this article in formats compatible with various reference manager tools)
Structure and dynamics of the chromatin remodeler ALC1 bound to a PARylated nucleosome
eLife 10:e71420.
https://doi.org/10.7554/eLife.71420


