The E3 ligase Thin controls homeostatic plasticity through neurotransmitter release repression
- Department of Molecular Life Sciences, University of Zurich, Switzerland
- Zurich Ph.D. Program in Molecular Life Sciences, Switzerland
- Neuroscience Center Zurich, University of Zurich/ETH Zurich, Switzerland
Figures
Figure 1 with 2 supplements
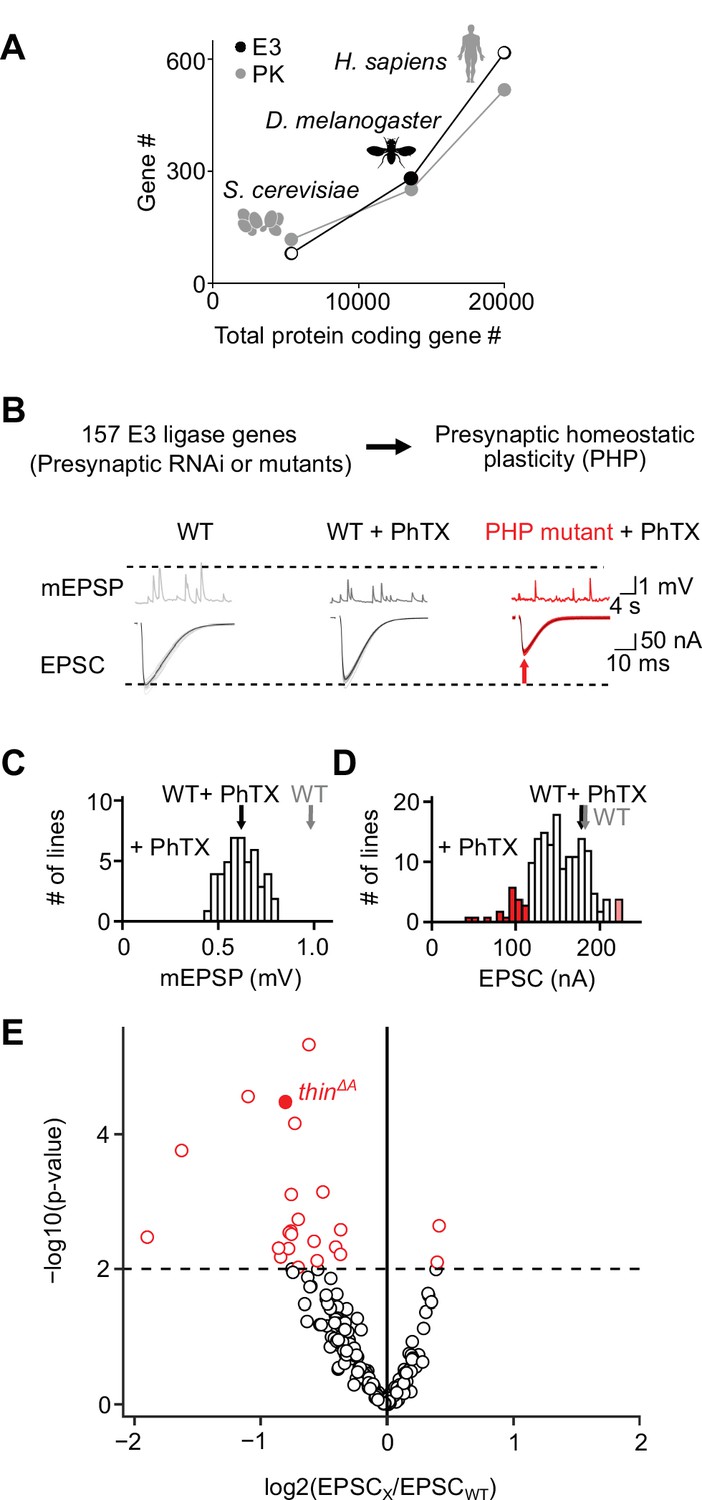
An electrophysiology-based genetic screen identifies thin as a synaptic homeostasis gene.
(A) The number of putative E3 ubiquitin ligase-encoding genes (E3) and protein kinase-encoding genes (PK) as a function of total protein-coding gene number of C. cerevisiae, D. melanogaster, and H. sapiens. Note the similar relationship between E3 number or PK number and total protein-coding gene number across species. (B) Top: 157 E3 ligase-encoding genes and 11 associated genes (180 lines; presynaptic RNAi expression, elavc155-Gal4>UAS RNAi, or mutants, note that some genes were targeted by more than one line) were tested using two-electrode voltage clamp analysis at the Drosophila neuromuscular junction (NMJ) in the presence of the glutamate receptor (GluR) antagonist philanthotoxin-443 (‘PhTX’) to assess presynaptic homeostatic plasticity (PHP) (see Materials and methods). Bottom: Exemplary miniature excitatory postsynaptic potentials (mEPSPs) and action potential (AP)-evoked excitatory postsynaptic currents (EPSCs) recorded from wild-type (WT), WT in the presence of PhTX (‘WT + PhTX’), and a PHP mutant in the presence of PhTX (‘PHP mutant + PhTX’). Note the decrease in mEPSP amplitude after PhTX treatment, indicating GluR inhibition, and the similar EPSC amplitude between WT and WT + PhTX, suggesting PHP. Small EPSC amplitudes in the presence of PhTX (red arrow) imply a defect in PHP or baseline synaptic transmission. (C) Histogram of mean mEPSP amplitudes for each transgenic or mutant line (mean n = 4 NMJs per line, range 3–12; N = 180 lines) following PhTX treatment. WT averages under control conditions (‘WT’, n = 16) and in the presence of PhTX (‘WT + PhTX’, n = 16) are shown as gray and black arrows, respectively. (D) Histogram of mean EPSC amplitudes (as in C). The red bars indicate transgenic or mutant lines with EPSC amplitudes significantly different from WT in the presence of PhTX (black arrow). (E) Volcano plot of the ratio between the mean EPSC amplitude of a transgenic or mutant line and WT (‘EPSCx/EPSCWT’) in the presence of PhTX (p values from one-way analysis of variance [ANOVA] with Tukey’s multiple comparisons). Transgenic or mutant lines with mean EPSC amplitude changes with p ≤ 0.01 (dashed line) are shown in red. A deletion in the gene thin (CG15105; thinΔA; LaBeau-DiMenna et al., 2012) that was selected for further analysis is shown as a filled red circle. One-way ANOVA with Tukey’s multiple comparisons was performed for statistical testing (C–E).
Figure 1—figure supplement 1

Generation and prioritization of the E3 ligase-encoding gene list.
(A) Flow chart describing the prioritization process of the E3 list. Generation: First, we used the Gene Ontology (GO) search of Flybase (Larkin et al., 2021) to identify genes annotated to encode for proteins with E3 ubiquitin ligase domains within the Drosophila melanogaster genome. This yielded an initial list of 221 genes, including confirmed and putative E3 ligase-encoding genes, similar to previous estimates (Du et al., 2011). Next, we added genes encoding domains contributing to the formation of the E3 complex, including the F-box domain, the Cullin domain, the N-recognin domain, the SKP1 domain, and the U-box domain. Subsequently, we searched human E3 ligase-encoding genes (Li et al., 2008) for D. melanogaster orthologs using the Drosophila RNAi Screening Center Integrative Ortholog Prediction Tool (DIOPT; version 8.0; http://www.flyrnai.org/diopt) (Hu et al., 2011). In total, this approach identified 281 putative E3 ligase-encoding genes in the D. melanogaster genome. Prioritization: We used a combination of four different criteria to create a score (normalized to max.) to prioritize the E3 list for screening the most relevant candidates. First, we prioritized for evolutionary conservation according to the overall DIOPT score of each putative E3 ligase-encoding gene with regard to its human ortholog (Hu et al., 2011) (score 1, ‘ω1’). Second, we prioritized for genes with predicted central nervous system expression based on transcriptomics data from modENCODE (modENCODE Consortium et al., 2009) and FlyAtlas (Chintapalli et al., 2007) (ω2). Third, we prioritized for genes encoding for proteins predicted to interact with synaptic proteins. In short, we created a literature-based list of known synaptic genes and calculated an interaction probability between each putative E3 ligase-encoding gene and all synaptic genes using STRING (von Mering et al., 2005) (ω3). Fourth, we considered the probability of synaptic function predicted by machine-learning based analysis of transcriptomics data (Pazos Obregón et al., 2015; Pazos Obregón et al., 2019) (ω4). The list of putative E3 ligase-encoding genes was sorted according to the sum of the four scores for each gene. (B) Distribution of the total score (summed weights) for all putative E3 ligase-encoding genes. The red bars indicate the lines selected for analysis (arbitrary threshold). In addition, genes encoding E3 ligases with known targets implicated in synaptic transmission or synaptic plasticity based on previously published data were added to our screen. Altogether, we tested 157 out of the 281 genes.
Figure 1—figure supplement 2

Homology between Thin and TRIM family proteins.
(A) Schematic representation of the domain organization of Drosophila Thin isoforms and its closest human TRIM family homologs. thin encodes an E3 ligase with a N-terminal tripartite motif (TRIM), containing one RING-finger domain (black triangle), a zinc-finger domain (B box, partially conserved, gray oval), and coiled-coil region (gray triangle), followed by disordered domains (brown ovals). Four out of five Thin isoforms harbor six C-terminal NHL repeats (red boxes). All TRIM proteins contain a N-terminal TRIM and are grouped into different families based on their C-terminal domain composition (Short and Cox, 2006). TRIM proteins with C-terminal NHL repeats form family C-VII. Hence, Thin’s domain composition is most similar to TRIM proteins of the C-VII family. Within the C-VII TRIM family, TRIM32 is the only member that harbors NHL repeats in addition to the TRIM motif. Other TRIM proteins of this family contain an additional Filamin domain (blue square), which is absent in Thin. Thus, Thin’s domain composition resembles the one of TRIM32, suggesting that TRIM32 is the closest human homolog of Thin. Alignment of RING domains (B) and NHL domains (C) of Thin and human TRIM family C-VII members implies evolutionary conservation of both domains between Thin and TRIM C-VII members (Ozato et al., 2008). The results of our analysis agree with LaBeau-DiMenna et al., 2012.
Figure 2 with 1 supplement

Homeostatic plasticity requires presynaptic thin.
(A) Representative excitatory postsynaptic currents (EPSCs) (individual sweeps and averages are shown in light colors and black, respectively), and mEPSCs (insets) of wild-type (WT) (gray), thinΔA mutants (red), presynaptic thin expression in thinΔA mutants (elavc155-Gal4>UAS-thin; thinΔA, ‘thinΔA pre. rescue’, blue), and postsynaptic thin expression in thinΔA mutants (24B-Gal4>UASthin; thinΔA, ‘thinΔA post. rescue’, green) in the absence and presence of philanthotoxin-443 (PhTX) (‘+PhTX’, darker colors). Stimulation artifacts were blanked for clarity. Note the decreased EPSC amplitudes at PhTX-treated thinΔA mutant neuromuscular junctions (NMJs) and thinΔA post. rescue NMJs, indicating impaired presynaptic homeostatic plasticity (PHP). Mean mEPSC amplitudes (B), EPSC amplitudes (C), quantal content after PhTX treatment normalized to the respective untreated control (D), in the absence (‘−’) and presence (‘+’) of PhTX, as well as baseline quantal content of the indicated genotypes in the absence (‘−’) of PhTX normalized to WT (E). Note that PhTX did not enhance quantal content in thinΔA mutants (D), indicating impaired PHP. Also note the increased quantal content under baseline conditions in thinΔA mutants (E), suggesting increased release. The PHP and baseline synaptic transmission defects are restored upon presynaptic thin expression in the mutant background. Mean ± standard error of the mean (SEM) (WT − PhTX: n = 14, WT + PhTX: n = 13; thinΔA − PhTX: n = 18; thinΔA + PhTX: n = 21; pre. res. − PhTX: n = 11; pre. res.+ PhTX: n = 10; post. res. − PhTX: n = 25; post. res.+ PhTX: n = 24); *p < 0.05; **p < 0.01; ***p < 0.001; n.s.: not significant; two-way analysis of variance (ANOVA) followed by Tukey’s post hoc test (B–D) and one-way ANOVA with Tukey’s multiple comparisons (E).
-
Figure 2—source data 1
Related to Figure 2.
- https://cdn.elifesciences.org/articles/71437/elife-71437-fig2-data1-v2.xlsx
Figure 2—figure supplement 1

Sustained homeostasis is impaired in thin mutants.
(A) Representative excitatory postsynaptic currents (EPSCs) (individual sweeps and averages are shown in light colors and black, respectively), and mEPSCs (insets) of wild-type (WT) (gray), GluRIIASP16 mutants (dark gray), thinΔA mutants (red), and thinΔA, GluRIIASP16 double mutants (dark red). Stimulation artifacts were blanked for clarity. Mean mEPSC amplitudes (B), EPSC amplitudes (C), and quantal content (D) of the indicated genotypes. Note that there is no quantal content increase in thinΔA, GluRIIASP16 compared to thinΔA, indicating impaired presynaptic homeostatic plasticity (PHP). The similarity between mEPSC amplitudes in GluRIIASP16 and thinΔA, GluRIIASP16 mutants may indicate reduced GluR levels in thinΔA mutants. Mean ± standard error of the mean (SEM) (WT: n = 11; GluRIIASP16: n = 13; thinΔA: n = 16; thinΔA, GluRIIASP16: n = 14); *p < 0.05; **p < 0.01; ***p < 0.001; n.s.: not significant; two-way analysis of variance (ANOVA) followed by Tukey’s post hoc test.
-
Figure 2—figure supplement 1—source data 1
Related to Figure 2—figure supplement 1.
Sustained homeostasis is impaired in thin mutants.
- https://cdn.elifesciences.org/articles/71437/elife-71437-fig2-figsupp1-data1-v2.xlsx
Figure 3 with 1 supplement
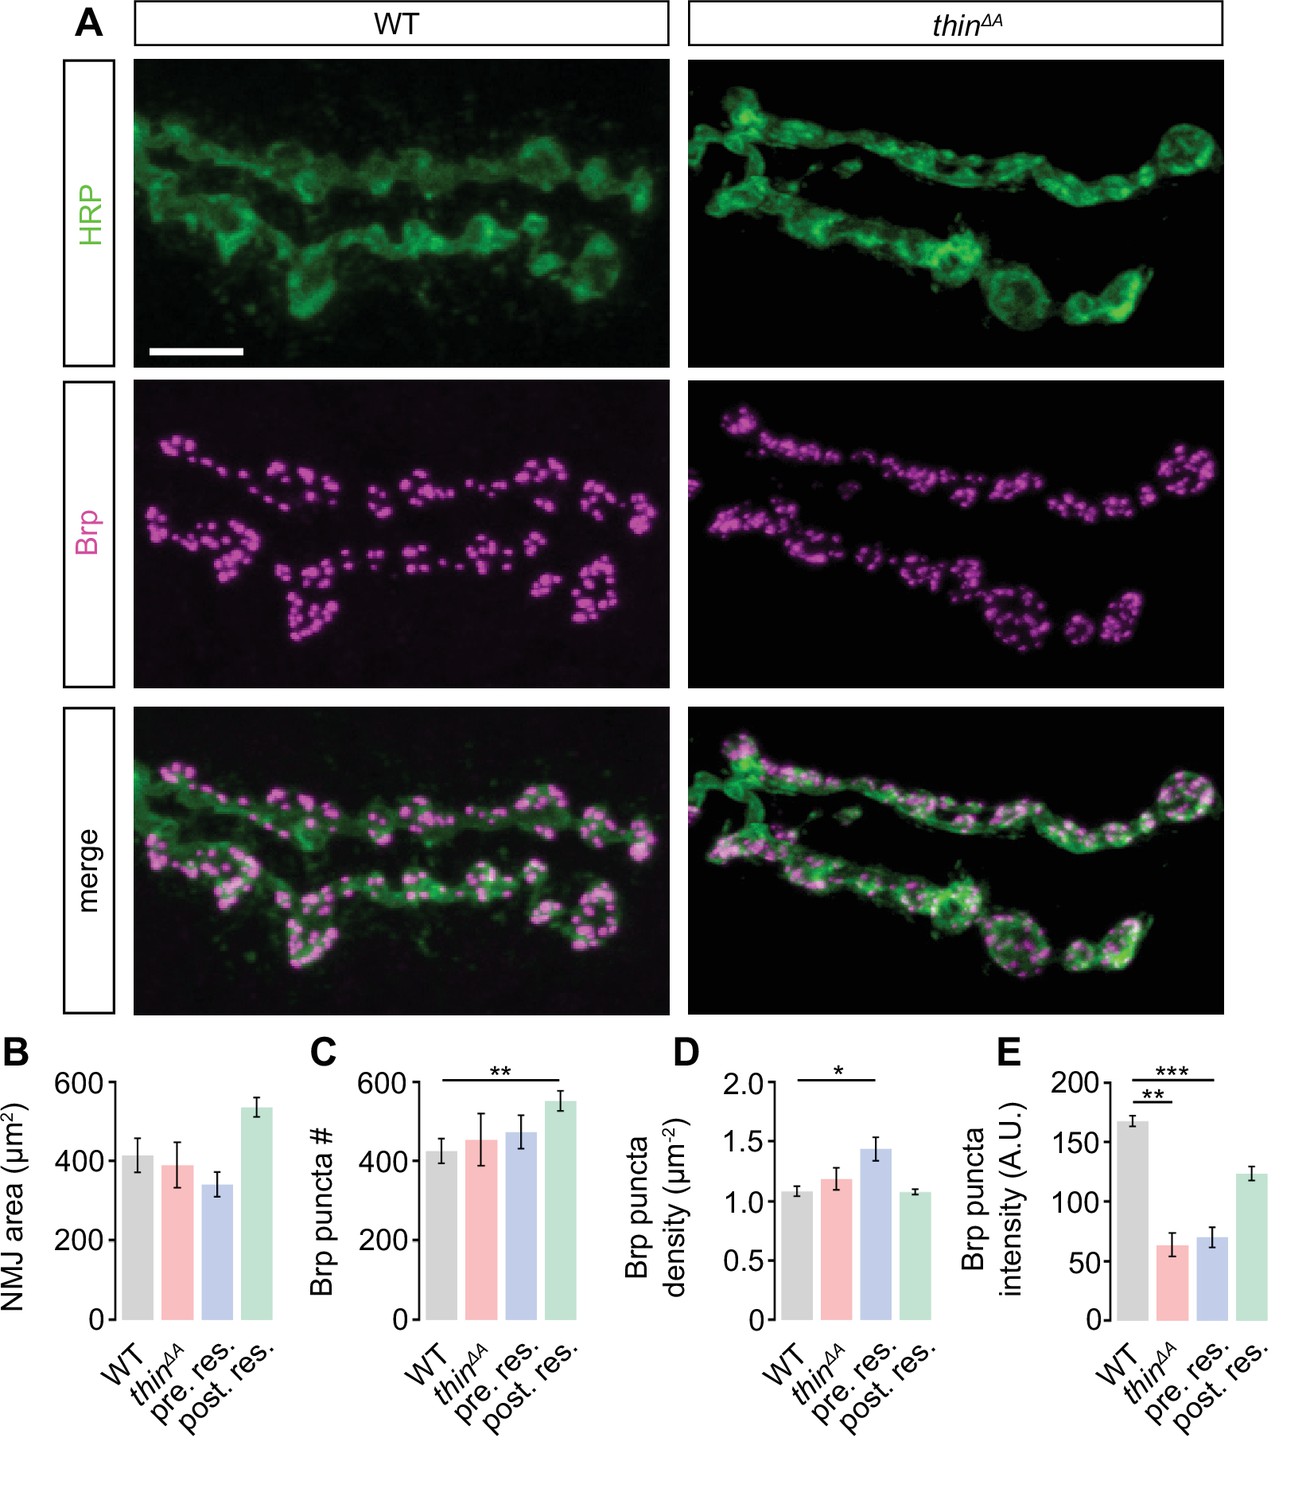
Slight alterations in neuromuscular junction (NMJ) morphology upon genetic thin manipulations.
(A) Maximum intensity projection of a wild-type (WT) (left) and thinΔA mutant NMJ (right) (muscle 6) stained against the Drosophila neuronal membrane marker anti-HRP (‘HRP’) and the active-zone marker Bruchpilot (‘Brp’); scale bar, 10 µm. Mean HRP area per NMJ ‘HRP area’ (B), Brp puncta number per NMJ ‘Brp puncta #’ (C), Brp puncta number/HRP area per NMJ ‘Brp density’ (D), and Brp puncta fluorescence intensity (E) of the indicated genotypes (‘Postsynaptic rescue’: 24B-Gal4>UAS-thin; thinΔA; ‘presynaptic rescue’: elavc155-Gal4>UASthin; thinΔA). Although changes in the recorded parameters may contribute to changes in synaptic physiology, altered NMJ morphology was separable from synaptic physiology (see Results, Discussion, Figure 2, Figure 3—figure supplement 1, Figure 4, Figure 4—figure supplement 1). Mean ± standard error of the mean (SEM); WT: n = 10, thinΔA: n = 8, pre. res.: n = 12; post. res.: n = 13; *p < 0.05; **p < 0.01; ***p < 0.001; n.s.: not significant; Student’s t-test.
-
Figure 3—source data 1
Related to Figure 3.
- https://cdn.elifesciences.org/articles/71437/elife-71437-fig3-data1-v2.xlsx
Figure 3—figure supplement 1

Postsynaptic thin expression does not affect presynaptic homeostatic plasticity (PHP) or baseline synaptic transmission.
(A) Maximum intensity projection of a control (24B-Gal4/+, ‘muscle-Gal4’, left and 24B-Gal4>UAS thin, ‘muscle-Gal4>UAS-thin’, right) neuromuscular junction (NMJ) (muscle 6) stained against the Drosophila neuronal membrane marker anti-HRP (‘HRP’) and the active-zone marker Bruchpilot (‘Brp’); scale bar, 20µm. Mean HRP area per NMJ (‘HRP area’) (B), Brp puncta number per NMJ (‘Brp puncta #’) (C), Brp puncta number/HRP area per NMJ ‘Brp density’ (D), and Brp puncta fluorescence intensity (E) of the indicated genotypes. 24B-Gal4/+: n = 10; 24B-Gal4>UAS-thin: n = 12. (F) Representative excitatory postsynaptic currents (EPSCs) (individual sweeps and averages are shown in light colors and black, respectively), and mEPSCs (insets) of a control NMJ (24B-Gal4/+, ‘muscle Gal4’) in the absence (light gray) and presence of philanthotoxin-443 (PhTX) (‘+PhTX’, dark gray). Stimulation artifacts were blanked for clarity. (G) Same as in (F) for an NMJ overexpressing thin in the muscle (24B-Gal4>UAS thin, ‘muscle-Gal4>UAS-thin’). Mean mEPSC amplitudes (H), EPSC amplitudes (I), and quantal content (J) of control (24B-Gal4/+, ‘mGal4’, gray) and postsynaptic thin overexpression (24B-Gal4>UAS thin, ‘mGal4 >thin’, red) without (light colors) and after PhTX treatment (dark colors). (K) mEPSC amplitude (white) and quantal content (black) in the presence of PhTX normalized to control (without PhTX) of the indicated genotypes. PhTX treatment increased quantal content after postsynaptic thin overexpression, indicating PHP expression. Postsynaptic thin overexpression did not change baseline miniature excitatory postsynaptic potential (mEPSP) or EPSC amplitude. The increase in HRP area (B), Brp number (C), or the decrease in Brp intensity (E) upon postsynaptic thin overexpression thus do not translate into apparent changes in PHP or baseline synaptic transmission. Mean ± standard error of the mean (SEM); 24B-Gal4/+ − PhTX: n = 16, 24B-Gal4/++PhTX: n = 17; 24B-Gal4>UAS thin − PhTX: n = 13, 24B-Gal4>UAS thin + PhTX: n = 23; ***p < 0.001; n.s.: not significant; Student’s t-test for pairwise comparison between control (24B-Gal4/+) and postsynaptic thin overexpression (24B-Gal4>UAS thin).
-
Figure 3—figure supplement 1—source data 1
Related to Figure 3—figure supplement 1.
Postsynaptic thin expression does not affect presynaptic homeostatic plasticity (PHP) or baseline synaptic transmission.
- https://cdn.elifesciences.org/articles/71437/elife-71437-fig3-figsupp1-data1-v2.xlsx
Figure 4 with 1 supplement
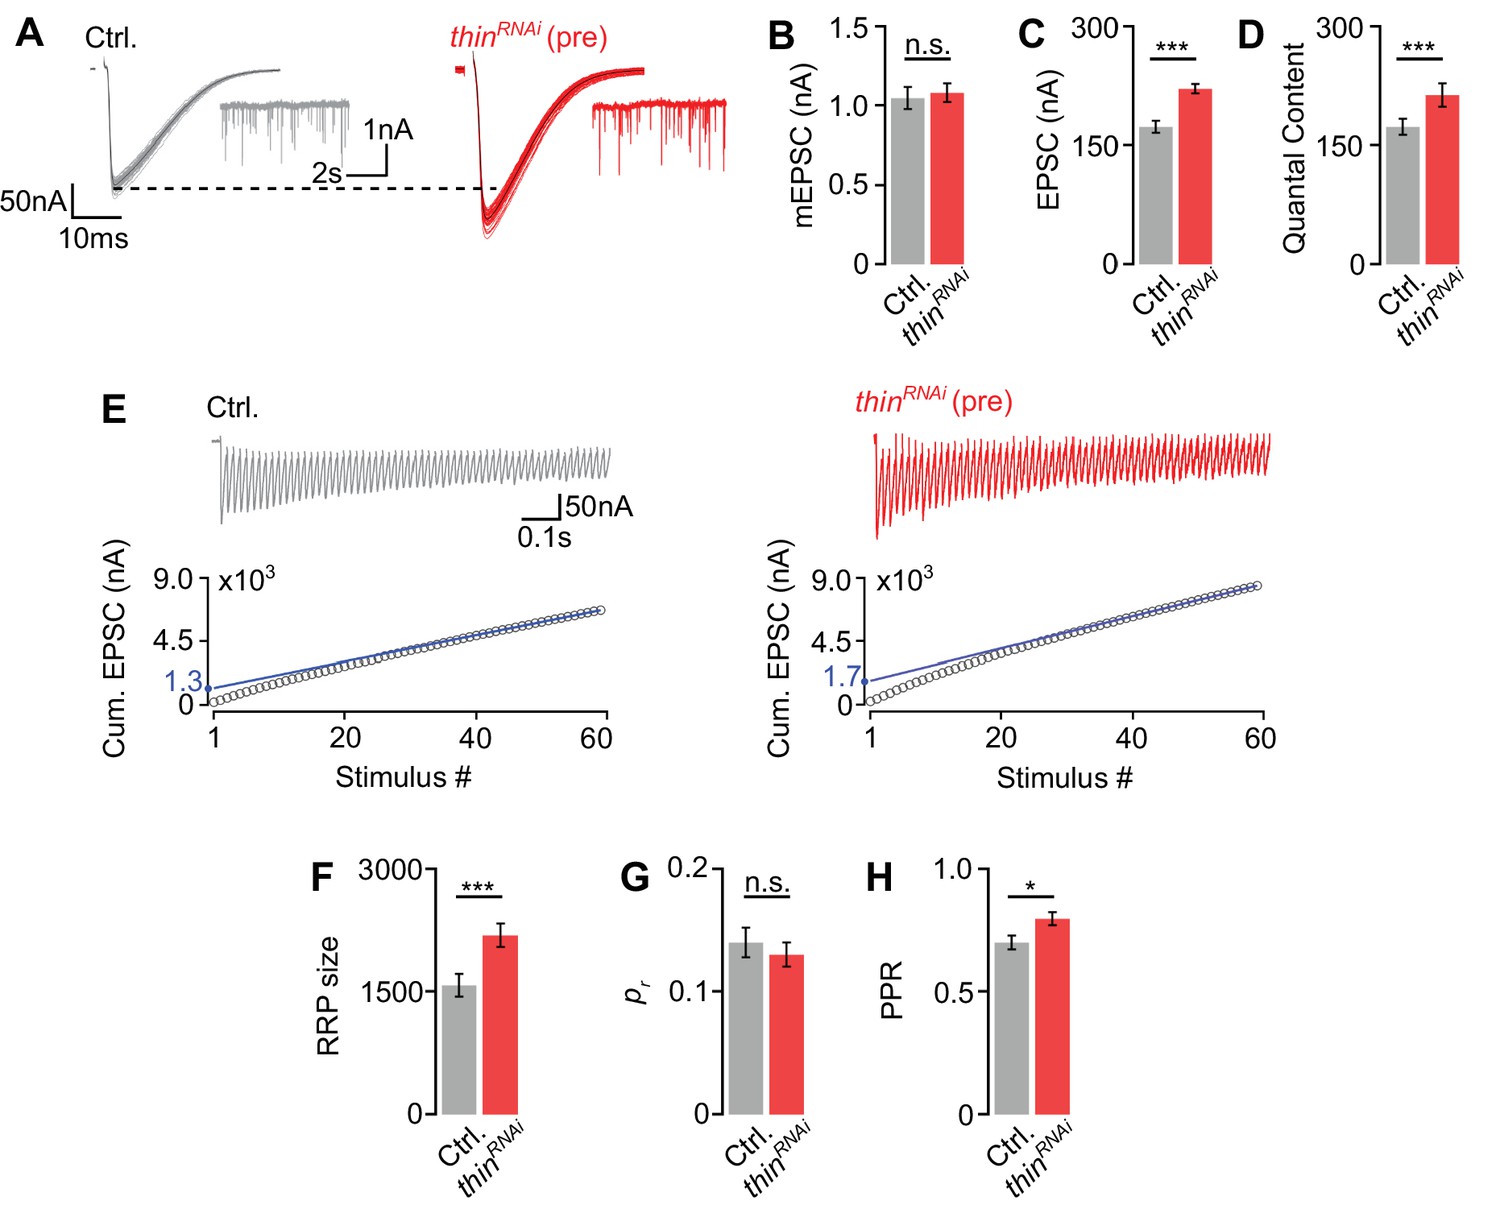
Thin negatively regulates release-ready vesicle number.
(A) Representative excitatory postsynaptic currents (EPSCs) (individual sweeps and averages are shown in light colors and black, respectively), and mEPSCs (insets) of controls (elavc155-Gal4>UAS-mCherryRNAi, ‘Ctrl.’, gray) and presynaptic thinRNAi (elavc155-Gal4>UAS-thinRNAi, ‘thinRNAi (pre)’, red). Mean mEPSC amplitudes (B), EPSC amplitudes (C), and quantal content (D) of the indicated genotypes. (E) Representative EPSC train (60 Hz, 60 stimuli, top) and cumulative EPSC amplitudes (‘cum. EPSC’, bottom) of control and presynaptic thinRNAi. The blue line is a line fit to the last 15 cum. EPSC amplitudes that was back-extrapolated to t = 0 (see Materials and methods). Mean readilyreleasable vesicle pool (RRP) size (cum. EPSC/mEPSC) (F), release probability (‘pr’, EPSC1/cum. EPSC) (G), and paired-pulse ratio (‘PPR’, EPSC2/EPSC1) (H) of the indicated genotypes. Note the increase in EPSC amplitude and RRP size in presynaptic thinRNAi. Mean ± standard error of the mean (SEM); Ctrl.: n = 16, thinRNAi: n = 17; *p < 0.05; ***p < 0.001; n.s.: not significant; Student’s t-test.
-
Figure 4—source data 1
Related to Figure 4.
- https://cdn.elifesciences.org/articles/71437/elife-71437-fig4-data1-v2.xlsx
Figure 4—figure supplement 1

Presynaptic thinRNAi expression blocks presynaptic homeostatic plasticity (PHP) and induces a slight increase in AZ number.
(A) Maximum intensity projection of a control neuromuscular junction (NMJ) (elavc155-Gal4>UAS-mCherryRNAi, ‘Ctrl.’, left) and after presynaptic thinRNAi expression (elavc155-Gal4>UAS-thinRNAi, ‘thinRNAi’, right) (muscle 6) stained against the Drosophila neuronal membrane marker anti-HRP (‘HRP’) and the active-zone marker Bruchpilot (‘Brp’); scale bar, 10 µm. Mean HRP area per NMJ ‘HRP area’ (B), Brp puncta number per NMJ ‘Brp puncta #’ (C), Brp puncta number/HRP area per NMJ ‘Brp density’ (D), and Brp puncta fluorescence intensity (E) of the indicated genotypes. Elavc155-Gal4>UAS-mCherryRNAi: n = 12, elavc155-Gal4>UAS-thinRNAi: n = 16. (F) Representative mEPSCs (top) and excitatory postsynaptic currents (EPSCs) (bottom, individual sweeps and averages are shown in light colors and black, respectively) after presynaptic thinRNAi expression (elavc155-Gal4>UAS-thinRNAi, ‘thinRNAi’) in the absence (left, light red) and presence of the glutamate receptor (GluR) antagonist philanthotoxin-443 (PhTX) (right, dark red). Mean mEPSC amplitudes (G), EPSC amplitudes (H), and quantal content (I) in the absence (‘−’, light red) and presence (‘+’, dark red) of PhTX. Note that PhTX did not enhance quantal content after presynaptic thinRNAi expression, indicating impaired PHP. Mean ± standard error of the mean (SEM); thinRNAi − PhTX: n = 14, thinRNAi + PhTX: n = 13; ***p < 0.001; n.s.: not significant; Student’s t-test.
-
Figure 4—figure supplement 1—source data 1
Related to Figure 4—figure supplement 1.
Presynaptic thinRNAi expression blocks presynaptic homeostatic plasticity (PHP) and induces a slight increase in AZ number.
- https://cdn.elifesciences.org/articles/71437/elife-71437-fig4-figsupp1-data1-v2.xlsx
Figure 5 with 2 supplements
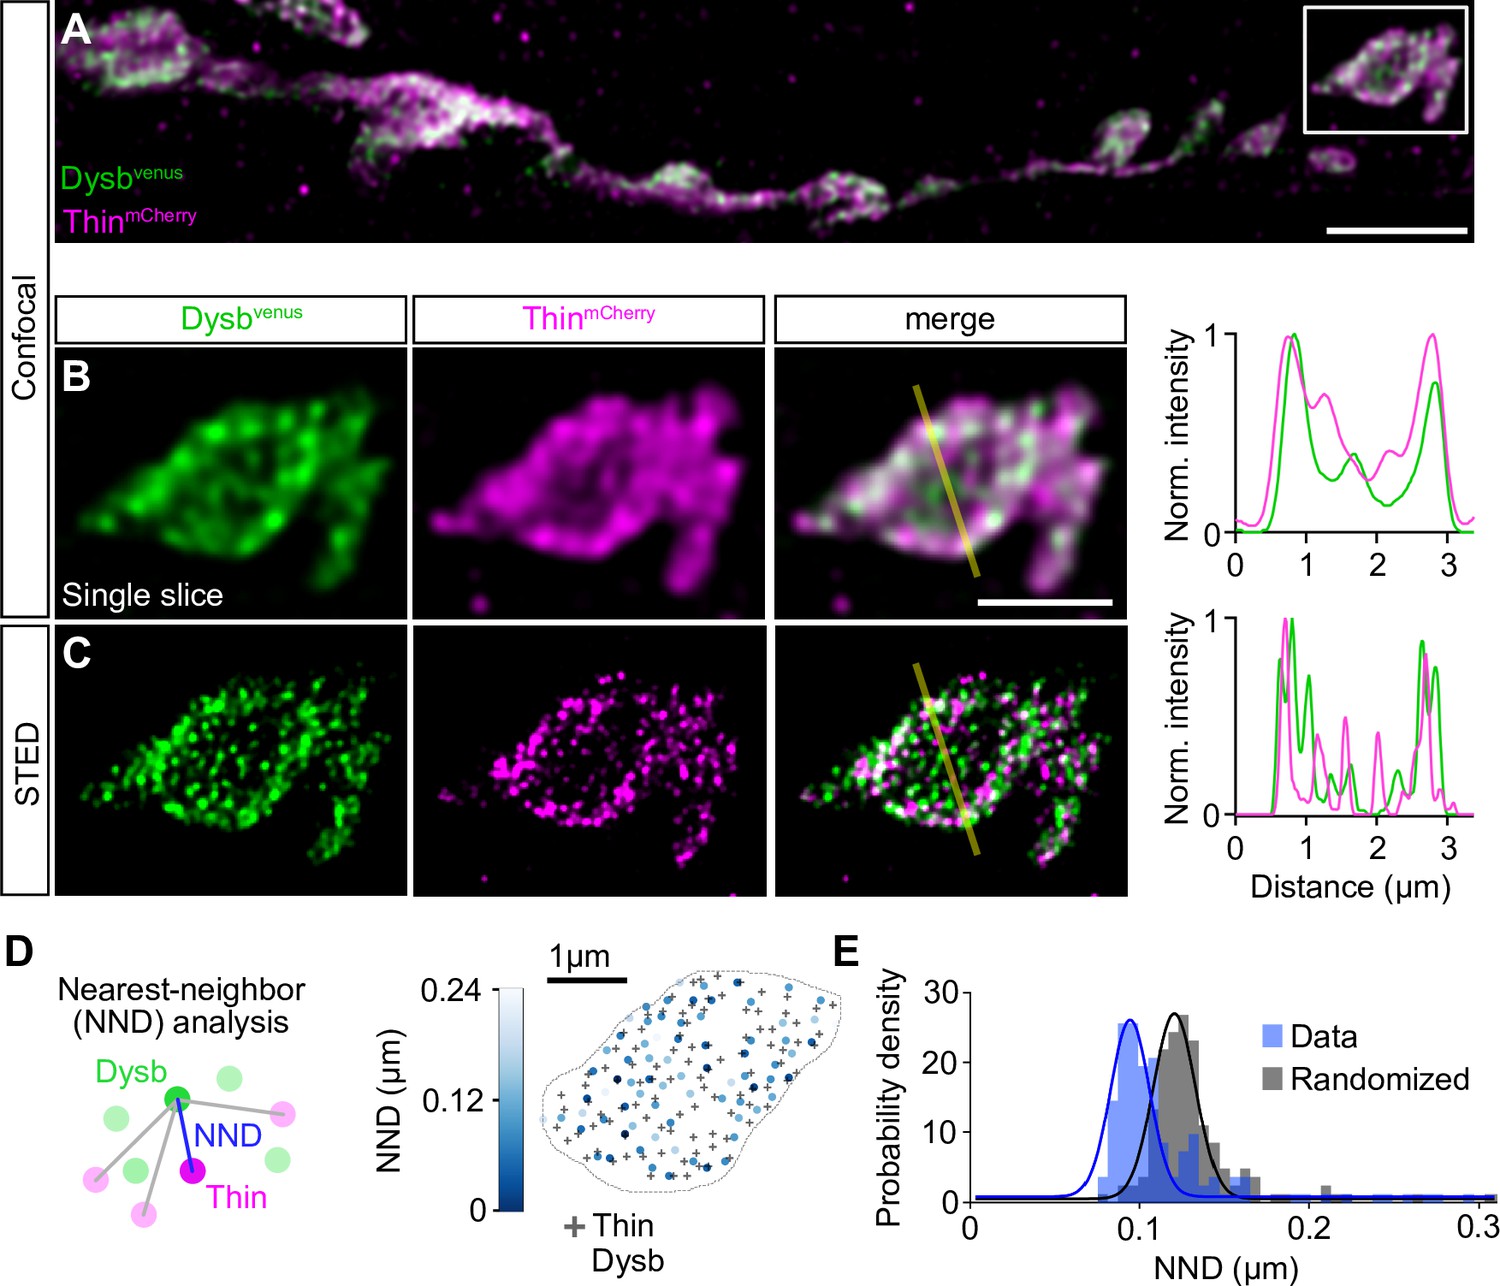
Thin localizes in close proximity to Dysbindin.
(A) Confocal maximum intensity projection of a representative neuromuscular junction (NMJ) branch (muscle 6–7) after presynaptic coexpression (elavc155-Gal4) of venus-tagged Dysbindin (UAS-venus-Dysbindin, ‘Dysbvenus’, green) and mCherry-tagged Thin (UAS-mCherry-thin, ‘ThinmCherry’, magenta) detected with anti-GFP and anti-DsRed, respectively. (B) Single plane of the synaptic bouton highlighted by the white square in (A) with corresponding line profile (right). The yellow line demarks the location of the line profile. (C) gSTED image of the synaptic bouton shown in (B) with corresponding line profile (right). Scale bar, A: 5 µm; B, C: 2 µm. Note the partial overlap between ThinmCherry and Dysbindinvenus at confocal and STED resolution. (D) Left: Schematic of nearest-neighbor (NND) analysis between ThinmCherry and Dysbindinvenus puncta at STED resolution. Right: ThinmCherry puncta (‘+’, maximum locations, see Materials and methods) and the NNDs and locations of Dysbindinvenus puncta (color code denotes NND) of a representative bouton. (E) Histogram of mean ThinmCherry − Dysbindinvenus NND per bouton of the recorded gSTED data (blue), or after randomized punctum distribution (gray, see Materials and methods). N = 10 NMJs, average n = 13 boutons per NMJ for data and simulations. Observed vs. randomized NNDs, p < 0.001; Student’s t-test.
-
Figure 5—source data 1
Related to Figure 5.
- https://cdn.elifesciences.org/articles/71437/elife-71437-fig5-data1-v2.xlsx
Figure 5—figure supplement 1

Dysbindin and Synapsin distribute in the periphery of synaptic boutons, endogenous Thin localizes close to Brp, and presynaptic dysbindin overexpression does not affect neuromuscular junction (NMJ) morphology.
(A) Confocal maximum intensity projection of a representative NMJ branch (muscle 6–7) after presynaptic expression (elavc155-Gal4) of venus-tagged Dysbindin (UAS-venus-dysbindin, ‘Dysbvenus’) stained with anti-GFP (green, ‘Dysbvenus’) and anti-Synapsin (magenta, ‘Synapsin’). (B) Single slice of the synaptic bouton highlighted by the yellow square in (A) with corresponding line profile (right). The yellow line demarks the location of the line profile. (C) gSTED image of the synaptic bouton shown in (B) with corresponding line profile (right). Note the partial overlap between Dysbvenus and the synaptic vesicle marker Synapsin at confocal and STED resolution. Scale bar, A: 4 µm; B, C: 1 µm. (D) Confocal single slice of two representative wild-type (WT) NMJ boutons (muscle 6) stained with the neuronal membrane marker anti-HRP (‘HRP’, blue), the active-zone marker Bruchpilot (anti-Brpnc82, ‘Brp’, green), and anti-Thin (‘LaBeau-DiMenna et al., 2012, magenta). (E) Same staining as in (D) for a thinΔA mutant NMJ. Note that some Thin puncta localize in close proximity to Brp within WT boutons (white arrowheads, D, right), suggesting presynaptic Thin puncta in the vicinity of AZs. A quantitative analysis of the relationship between anti-Thin and presynaptic markers could not be realized because of postsynaptic anti-Thin puncta in the muscle cell (not shown, LaBeau-DiMenna et al., 2012). Little to no anti-Thin signal was detected at thinΔA mutant NMJs (E). Scale bar, 1 µm. (F) Mean HRP area per muscle 6/7 NMJ (‘HRP area’), Brp puncta number per NMJ (‘Brp puncta #’), Brp puncta number/HRP area per NMJ (‘Brp density’), and Brp puncta fluorescence intensity of control (elavc155-Gal4/+, ‘nGal4’, gray) and after presynaptic expression of venus-tagged Dysbindin in WT (elavc155-Gal4>UAS-venus-dysbindin, ‘nGal4>dysb’, blue). Note that all morphological parameters were largely unchanged after presynaptic dysbindin overexpression, implying no major changes in NMJ morphology. Mean ± standard error of the mean (SEM); nGal4: n = 9, nGal4>Dysb: n = 11; n.s.: not significant; Student’s t-test.
-
Figure 5—figure supplement 1—source data 1
Related to Figure 5—figure supplement 1F.
Dysbindin and Synapsin distribute in the periphery of synaptic boutons, endogenous Thin localizes close to Brp, and presynaptic dysbindin overexpression does not affect neuromuscular junction (NMJ) morphology.
- https://cdn.elifesciences.org/articles/71437/elife-71437-fig5-figsupp1-data1-v2.xlsx
Figure 5—figure supplement 2

Thin localizes in close proximity to Dysbindin and Thin degrades Dysbindin in Drosophila S2 cells.
(A) Confocal images (single planes) of Drosophila S2 cells stained with anti-Dysbindin (green) and anti-Thin (magenta) under control conditions (top) and after dysbindin overexpression (UAS-venus-Dysbindin, ‘Dysb OE’, middle). Note the redistribution of Thin upon dysbindin expression resulting in overlapping Thin and Dysbindin fluorescence. Bottom: Excitation of channel 1 (anti-Dysbindin) did not produce significant fluorescence in channel 2 (anti-Thin), implying no major crosstalk between the two channels. (B) Pearson’s correlation coefficient (r) between anti-Dysbindin and anti-Thin fluorescence intensities per pixel after dysbindin overexpression (‘Dsyb OE’) (n = 22). The r density (with Gaussian fit) was obtained from simulated Thin and Dysbindin localizations after sampling random point spread function-sized chunks of the data (see Materials and methods, n = 22). The average observed r = 0.84 is significantly higher than expected from random Thin and Dysbindin localizations. (C) Representative western Blot of S2 cells transfected for 72 hr with constant levels of pUAS-venus-Dysbindin (‘Dysbindinvenus’) and the indicated relative cDNA concentrations of pUAS-HA-thin (‘ThinHA’) normalized to pUAS-venus-dysbindin (‘1×’, ‘2×’). Dysbindinvenus and ThinHA were detected with anti-GFP (‘a-GFP’) and anti-HA (‘a-HA’), respectively. Anti-Tubulin (‘a-Tubulin’) served as a loading control. (D) Quantification of Dysbindinvenus/Tubulin fluorescence intensity at different relative ThinHA concentrations (‘1×’, ‘2×’) relative to Dysbindinvenus (n = 4). Note the decrease in Dysbindinvenus/Tubulin upon thin overexpression. Scale bar, A: 5 µm; B, C: 2 µm.
-
Figure 5—figure supplement 2—source data 1
Related to Figure 5—figure supplement 2.
Thin localizes in close proximity to Dysbindin and Thin degrades Dysbindin in Drosophila S2 cells.
- https://cdn.elifesciences.org/articles/71437/elife-71437-fig5-figsupp2-data1-v2.xlsx
Figure 6
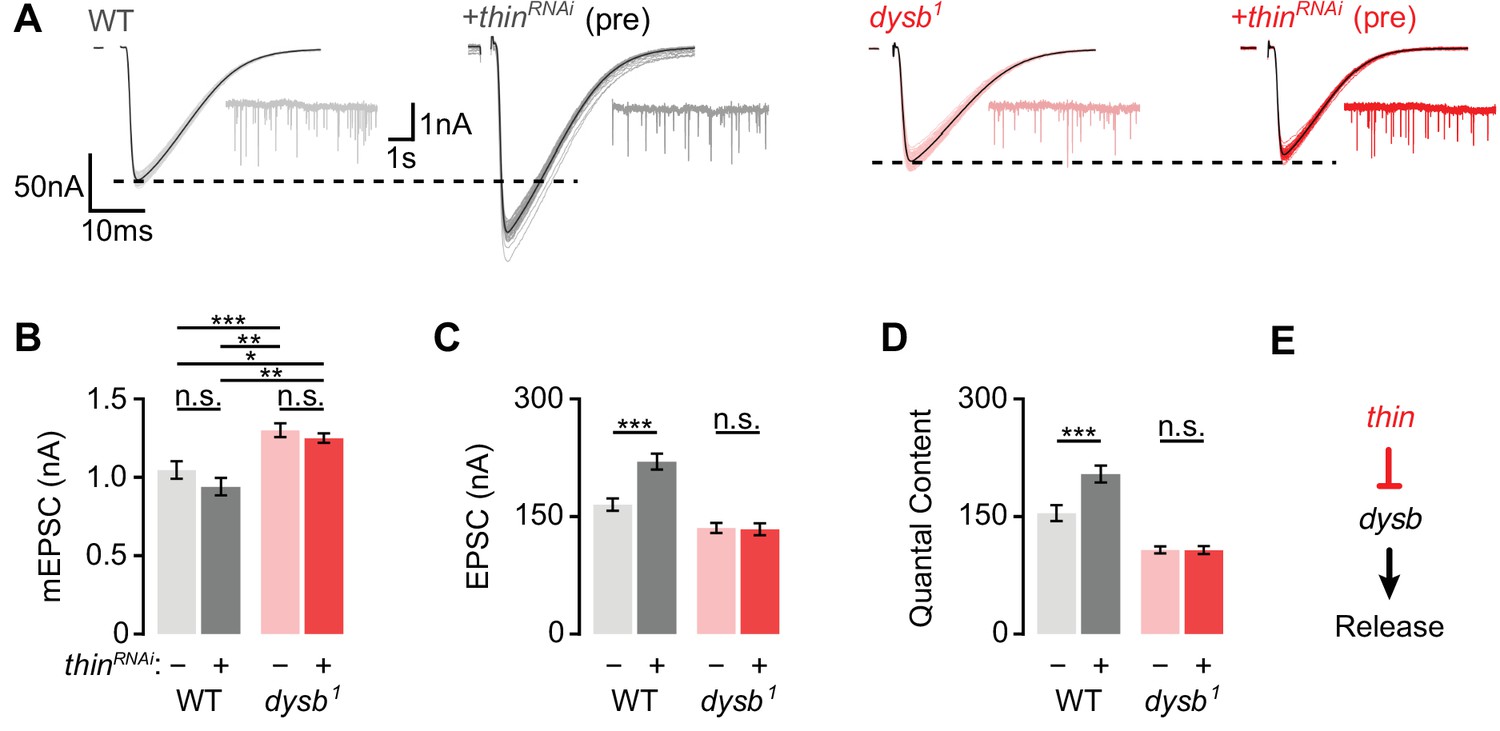
Thin represses release through dysbindin.
(A) Representative excitatory postsynaptic currents (EPSCs) (individual sweeps and averages are shown in light colors and black, respectively), and mEPSCs (insets) of wild-type (WT) (gray) and presynaptic thinRNAi (elavc155-Gal4>UAS-thinRNAi, ‘+thinRNAi (pre)’, dark gray), dysb1 mutants (light red), and presynaptic thinRNAi in the dysb1 mutant background (elavc155-Gal4/Y; UAS-thinRNAi/+; dysb1, ‘+thinRNAi (pre)’, dark red). Mean mEPSC amplitudes (B), EPSC amplitudes (C), and quantal content (D) of the indicated genotypes. Note that presynaptic thinRNAi expression increases EPSC amplitude and quantal content in WT, but not in dysb1 mutants. Mean ± standard error of the mean (SEM); WT: n = 17, elavc155-Gal4>UAS-thinRNAi: n = 17, dysb1: n = 12, elavc155-Gal4/Y; UAS-thinRNAi/+; dysb1: n = 12; *p < 0.05; **p < 0.01; ***p < 0.001; n.s.: not significant; two-way analysis of variance (ANOVA) followed by Tukey’s post hoc test. (E) Working model: Our genetic data support a model in which thin controls neurotransmitter release (‘Release’) through negative regulation of dysbindin (‘dysb’).
-
Figure 6—source data 1
Related to Figure 6.
- https://cdn.elifesciences.org/articles/71437/elife-71437-fig6-data1-v2.xlsx
Tables
Key resources table
| Reagent type (species) or resource | Designation | Source or reference | Identifiers | Additional information |
|---|---|---|---|---|
| Genetic reagent (Drosophila melanogaster) | thinΔA | LaBeau-DiMenna et al., 2012 | ||
| Genetic reagent (Drosophila melanogaster) | UAS-abba | LaBeau-DiMenna et al., 2012 | ||
| Genetic reagent (Drosophila melanogaster) | UAS-mCherry-thin | This study | Stock is available upon request | |
| Genetic reagent (Drosophila melanogaster) | GluRIIASP16 | Petersen et al., 1997 | ||
| Genetic reagent (Drosophila melanogaster) | dysbindin1 | Dickman and Davis, 2009 | ||
| Genetic reagent (Drosophila melanogaster) | UAS-thinRNAi | Perkins et al., 2015 | RRID:BDSC_42826 | |
| Genetic reagent (Drosophila melanogaster) | UAS-mCherryRNAi (P{VALIUM20-mCherry}attP2) | Bloomington Drosophila Stock Center | RRID:BDSC_35785 | |
| Genetic reagent (Drosophila melanogaster) | UAS-venus-dysbindin | Dickman and Davis, 2009 | ||
| Genetic reagent (Drosophila melanogaster) | elavc155-Gal4 | Bloomington Drosophila Stock Center | RRID:BDSC_458 | |
| Genetic reagent (Drosophila melanogaster) | 24B-Gal4 | Bloomington Drosophila Stock Center | RRID:BDSC_1767 | |
| Antibody | anti-Bruchpilot (nc82) (mouse monoclonal) | DSHB, University of Iowa, USA | RRID:AB_2314866 | (1:100) |
| Antibody | anti-GFP (rabbit polyclonal) | Thermo Fisher Scientific | Thermo Fisher Scientific Cat# G10362, RRID:AB_2536526 | IF: (1:500) WB: (1:1000) |
| Antibody | anti-GFP (mouse mono clonal) | Thermo Fisher Scientific | Thermo Fisher Scientific Cat# A-11120, RRID:AB_221568 | (1:500) |
| Antibody | anti-DsRed (mouse monoclonal) | Santa Cruz Biotechnology | Santa Cruz Biotechnology Cat# sc-390909, RRID:AB_2801575 | (1:500) |
| Antibody | anti-SYNORF1 (Synapsin, 3C11) (mouse monoclonal) | DSHB, University of Iowa, USA | RRID:AB_528479 | (1:250) |
| Antibody | anti-Thin (guinea pig polyclonal) | LaBeau-DiMenna et al., 2012 | Larva: (1:200) S2: (1:400) | |
| Antibody | anti-HRP Alexa-Fluor 647 (goat polyclonal) | Jackson ImmunoResearch Labs | Jackson ImmunoResearch Labs Cat# 123-605-021, RRID:AB_2338967 | (1:200) |
| Antibody | Anti-HA (mouse monoclonal) | Biolegend | BioLegend Cat# 901533, RRID:AB_2801249 | (1:1000) |
| Antibody | Anti-BetaTubulin (mouse monoclonal) | DSHB, University of Iowa, USA | DSHB Cat# E7, RRID:AB_528499 | (1:1000) |
| Antibody | Goat anti-Mouse IgG (H+L) Secondary Antibody, HRP (goat polyclonal) | Thermo Fisher Scientific | Thermo Fisher Scientific Cat# 31430, RRID:AB_228307 | (1:2000) |
| Antibody | Goat anti-Rabbit IgG (H+L) Secondary Antibody, HRP (goat polyclonal) | Thermo Fisher Scientific | Thermo Fisher Scientific Cat# 32460, RRID:AB_1185567 | (1:2000) |
| Antibody | Alexa-Fluor anti-mouse 488 (goat polyclonal) | Thermo Fisher Scientific | Thermo Fisher Scientific Cat# A32723, RRID:AB_2633275 | (1:500) |
| Antibody | Alexa Fluor anti-guinea pig 555 (goat polyclonal) | Thermo Fisher Scientific | Thermo Fisher Scientific Cat# A-21435 RRID:AB_2535856 | (1:400) |
| Antibody | Atto 594 conjugated anti-mouse (goat polyclonal) | Sigma-Aldrich | Sigma-Aldrich Cat# 76,085 | (1:100) |
| Antibody | Abberior STAR 635P (goat polyclonal) | Abberior | Abberior Cat# ST635P-1002-500 UG, RRID:AB_2893229 | (1:100) |
| Chemical compound, drug | Bouin’s fixative | Sigma-Aldrich | HT-10132 | |
| Chemical compound, drug | Ethanol | Merck | CAS# 64-17-5 | |
| Chemical compound, drug | ProLong Gold Antifade | Thermo Fisher Scientific | P36930 | |
| Chemical compound, drug | Philanthotoxin-433 | Santa Cruz Biotechnology | Cat# sc-255421 | |
| Chemical compound, drug | Schneider’s Drosophila medium | Gibco | Cat# 21720024 | |
| Chemical compound, drug | FuGENE HD | Promega | Cat# E2311 | |
| Chemical compound, drug | Paraformaldehyde | Merck | HT501128 | |
| Chemical compound, drug | NP-40 | Thermo Fisher Scientific | 85,125 | |
| Chemical compound, drug | Deoxycholate | Sigma-Aldrich | D6750 | |
| Chemical compound, drug | cOmplete | Sigma-Aldrich | 11697498001 | |
| Chemical compound, drug | ECL Prime Western Blotting Detection Reagent | GE Healthcare | Cat# 28980926 | |
| Cell line (D. melanogaster) | Drosophila Schneider 2 (S2) Cells | Thermo Fisher Scientific | Cat# R69007 | |
| Commercial assay, kit | Nitrocellulose membrane | Amersham Hibond GE Healthcare | Cat# 88,018 | |
| Recombinant DNA reagent | pMT-Gal4 | Addgene | RRID:Addgene_53366 | |
| Software, algorithm | Fiji / ImageJ | https://fiji.sc | RRID:SCR_002285 | Version 1.51n |
| Software, algorithm | Clampex | Axon CNS, Molecular Devices | RRID:SCR_011323 | |
| Software, algorithm | Leica Application Suite X | Leica Microsystems | RRID:SCR_013673 | |
| Software, algorithm | Huygens Software | https://svi.nl/HuygensSoftware | RRID:SCR_014237 | |
| Software, algorithm | Igor Pro | WaveMetrics | RRID:SCR_000325 | Version 6.37 |
| Software, algorithm | NeuroMatic | Rothman and Silver, 2018 | RRID:SCR_004186 | Version 3.0c |
| Software, algorithm | NumPy | https://www.numpy.org | RRID:SCR_008633 | |
| Software, algorithm | SciPy | https://www.scipy.org | RRID:SCR_008058 | |
| Software, algorithm | IPython | http://ipython.org | RRID:SCR_001658 | |
| Software, algorithm | Neo | http://neuralensemble.org/neo | RRID:SCR_000634 | |
| Software, algorithm | Shapely | (Gillies, 2007) https://github.com/shapely/shapely | ||
| Software, algorithm | RStudio | (R Studio Team, 2020) http://www.rstudio.com/ | RRID:SCR_000432 | Version 2021.09.0 |
| Software, algorithm | pwr-package | (Champely, 2020) https://github.com/heliosdrm/pwr | ||
| Software, algorithm | GNU Image Manipulation Program | https://www.gimp.org/ | RRID:SCR_003182 | Version 2.8.10 |
| Software, algorithm | Inkscape | http://www.inkscape.org | RRID:SCR_014479 | Version 0.92.2 |
| Software, algorithm | Affinity Designer | https://affinity.serif.com/en-us/designer/ | RRID:SCR_016952 | Version 1.10.4 |
Additional files
-
Transparent reporting form
- https://cdn.elifesciences.org/articles/71437/elife-71437-transrepform1-v2.pdf
-
Supplementary file 1
Summary table of electrophysiology data for the genetic screen.
Data are mean ± SEM. UAS-RNAis were driven in neurons by elavc155-Gal4, and elavc155-Gal4/Y served as the control. We tested 157 putative E3 ligase-encoding genes and 11 E3-associated genes, using 180 lines (UAS-RNAi or mutants; some genes were targeted with multiple lines; mean n = 4 NMJs per line, range 3–12 per line). Control data were continuously collected throughout the genetic screen. See Materials and methods for further details.
- https://cdn.elifesciences.org/articles/71437/elife-71437-supp1-v2.xlsx
Download links
A two-part list of links to download the article, or parts of the article, in various formats.
Downloads (link to download the article as PDF)
Open citations (links to open the citations from this article in various online reference manager services)
Cite this article (links to download the citations from this article in formats compatible with various reference manager tools)
The E3 ligase Thin controls homeostatic plasticity through neurotransmitter release repression
eLife 11:e71437.
https://doi.org/10.7554/eLife.71437


