Sticks and Stones, a conserved cell surface ligand for the Type IIa RPTP Lar, regulates neural circuit wiring in Drosophila
- Division of Biology and Biological Engineering, California Institute of Technology, United States
Figures
Figure 1 with 1 supplement

Binding of Lar and its orthologs to Sns and Nephrin.
All images show live-dissected late-stage 16 embryos. (A, B) Staining with a version of Lar-AP (HS2) that cannot bind to heparan sulfate proteoglycans (HSPGs), visualized with anti-AP antibody. (A) WT embryo; Lar-AP binds weakly to central nervous system (CNS) axons (see Fox and Zinn, 2005). (B) Tub>Sns embryo at the same exposure, showing bright ectopic staining by HS2-AP in the CNS and periphery. (C–F) Lar overexpression in Tub>Lar embryos, visualized with anti-Lar mAb. (C, D) CNS axon staining in WT (C) and Tub>Lar (D). Longitudinal axons are stained in WT; all axons are brightly stained in Tub>Lar. (E, F) Staining in the periphery in WT (E) and Tub>Lar (F). There is no visible staining in WT, while Tub>Lar embryos show widespread staining. (G) Quantitation of CNS staining with anti-Lar in WT and Tub>Lar. (C’–F’) Staining with Sns-AP5 visualized with anti-AP antibody. (C’, D’) CNS staining in WT (C’) and Tub>Lar (D’). Midline glia are weakly stained in WT (C’); note that this pattern does not resemble anti-Lar staining (C). Midline glia (arrow) and exit junctions (arrowheads) are brightly stained in Tub>Lar (D’); note the similarity between the exit junction patterns visualized with anti-Lar (D) and Sns-AP. (E’, F’) Staining in the periphery in WT (E’) and Tub>Lar (F’). Staining in the periphery is increased in intensity in Tub>Lar. (H) Quantitation of CNS staining with Sns-AP in WT and Tub>Lar. (I–K) CNS staining with PTPRF-AP5 in WT (I), Tub>NPHS1 (J), and Tub>Sns (K) embryos. Note that there is very little staining in WT, but bright staining in the entire CNS in Tub>NPHS1 and Tub>Sns. (L) Quantitation of CNS staining in WT, Tub>NPHS1, and Tub>Sns. (M, N) CNS staining with PTPRD-AP5 in WT (M) and Tub>NPHS1 (N). Note midline glial staining in WT; this staining is only slightly increased in intensity in Tub>NPHS1 (arrows). Staining intensity in the remainder of the CNS is increased by several fold, however. (O) Quantitation of CNS staining in WT and Tub>NPHS1. (P, Q) In vitro binding measured with the ECIA assay using either AP or HRP enzymatic activity for detection. (P) 60-mer Lar prey (Lar-mi3) binds to Sns-AP5 bait. Kirre-Fc and Kirre-mi3 preys bind to Sns-AP5 equally. (Q) Both PTPRD-AP5 and PTPRF-AP5 preys bind to Nephrin-Fc (NPHS1-Fc) bait. PTPRD-AP5 and PTPRF-AP5 also bind to Sns-Fc bait. There is no signal with Nephrin-Fc bait and S2 medium prey or Sns-AP5 prey and S2 medium bait. Scale bar, 20 µm.
Figure 1—figure supplement 1
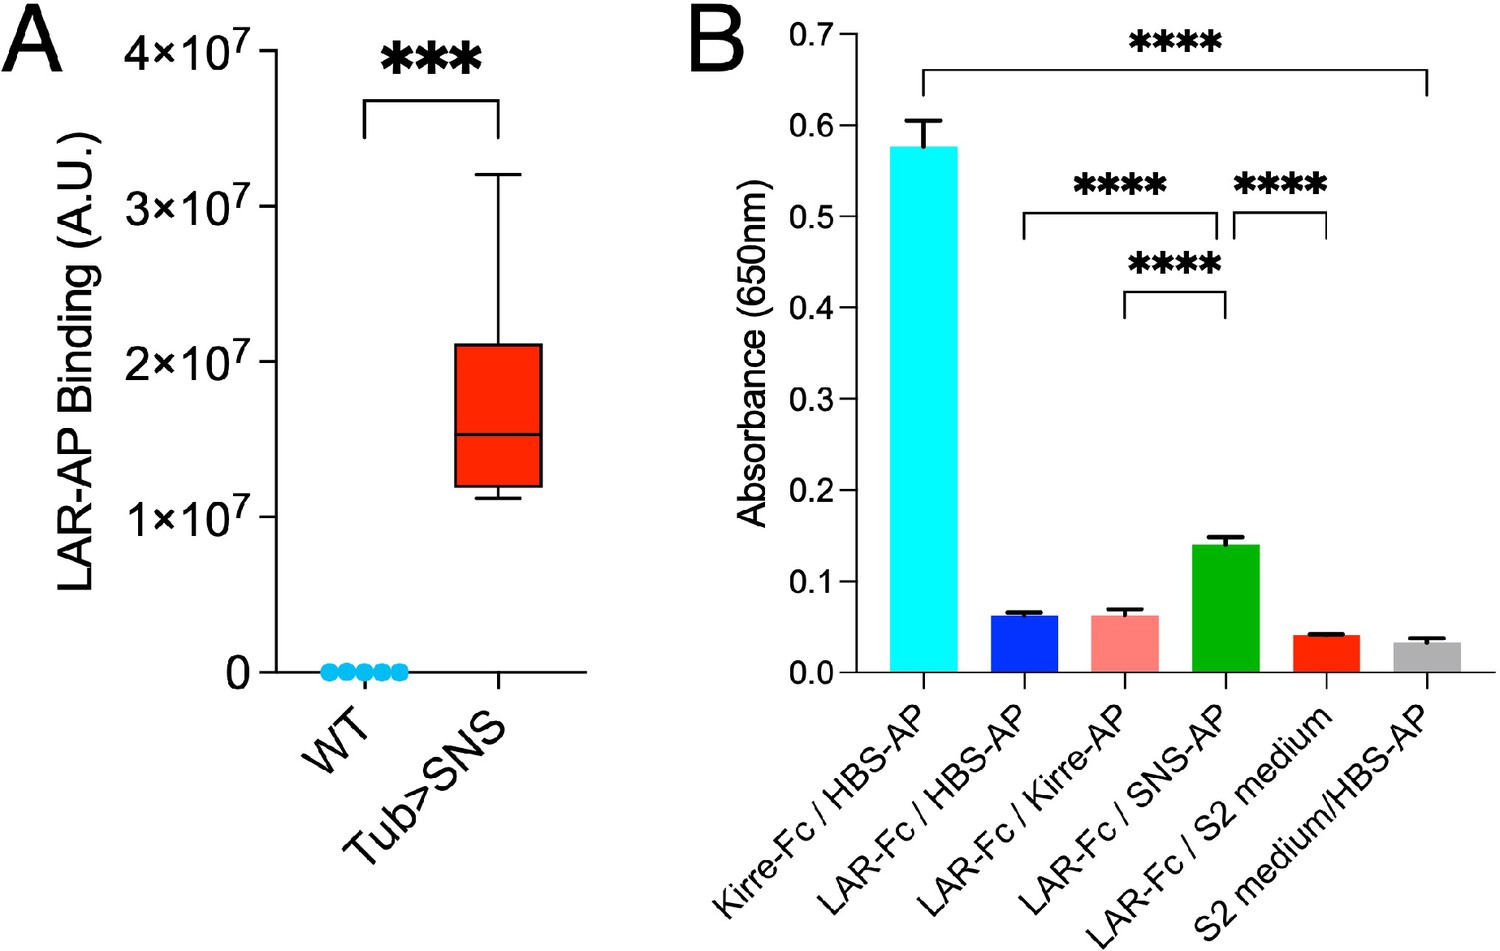
Lar-AP binding quantification and ECIA assay between Hbs, Kirre, and Lar.
(A) Quantification of muscle staining by Lar-AP in WT and Tub>Sns embryos. (B) ECIA assay to measure in vitro binding between Lar and IRM proteins, Hbs and Kirre, using HRP enzymatic activity for detection. Hbs-AP5 and Kirre-Fc bind strongly to each other. Lar-Fc does not bind to Hbs-AP5 or Kirre-AP5 but shows threefold higher binding to Sns-AP5 in this experiment. These results with Lar-Fc are variable; in the experiments shown in Figure 1, Lar-mi3 showed significant binding but Lar-Fc did not. ****p<0.0001; ***p< 0.001.
Figure 2 with 1 supplement

Expression of Lar and Sns reporters in motor neurons.
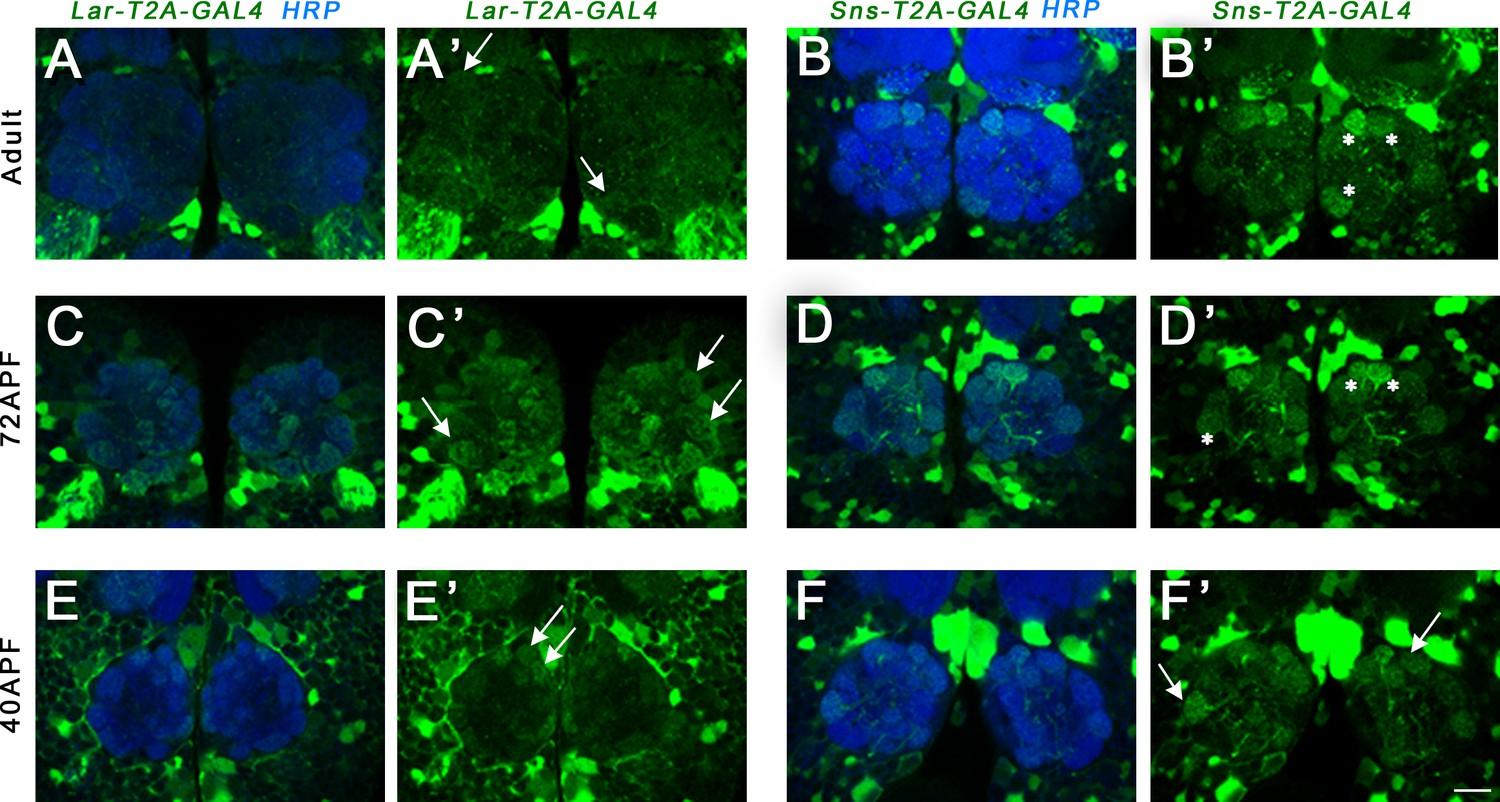
(A–D) Confocal projections of 4–6 optical slices showing EGFP expression driven by either LarMI02154-T2A-GAL4 (Lar>GFP) or SnsMI03001-T2A-GAL4 (Sns>GFP) (green) co-stained with anti-HRP (blue). The bright paired midline cells include motor neurons (A, C, arrows). (E–H’) Confocal projections of larval neuromuscular junctions (NMJs) on muscles 7/6, 13, and 12 (E, F’) and zoomed-in on muscle 7/6 (G, H’), triple-stained with anti-GFP (green), anti-HRP (red), and anti-Dlg (blue). (E’, F’, G’, H’) show GFP signal only. Anti-HRP labels neuronal membranes, and anti-Dlg labels the subsynaptic reticulum at 1b boutons. Lar>GFP and Sns>GFP expression is seen in both 1b and 1s boutons (green), while only Sns>GFP is seen in type II boutons (F’, arrows). (I, J) Projection of optical slices through an entire larval hemisegment showing Lar>GFP (I) and Sns>GFP (J) expression in both 1b and 1s motor neurons. Individual muscles are numbered. Dorsal is to the right. Note that Lar>GFP is equally expressed in most axons and NMJs, while Sns>GFP is expressed at lower levels in axons and NMJs of motor neurons projecting to dorsal muscles. (K, L) Close-up of NMJs on muscles 3 and 4 showing both Lar>GFP (K) and Sns>GFP (L) expression in 1b and 1s NMJs on those muscles. Scale bar, 20 µm. See Figure 2—figure supplement 1 for further characterization of Lar and Sns expression in the larval ventral nerve cord (VNC) and central nervous system (CNS).
Figure 2—figure supplement 1
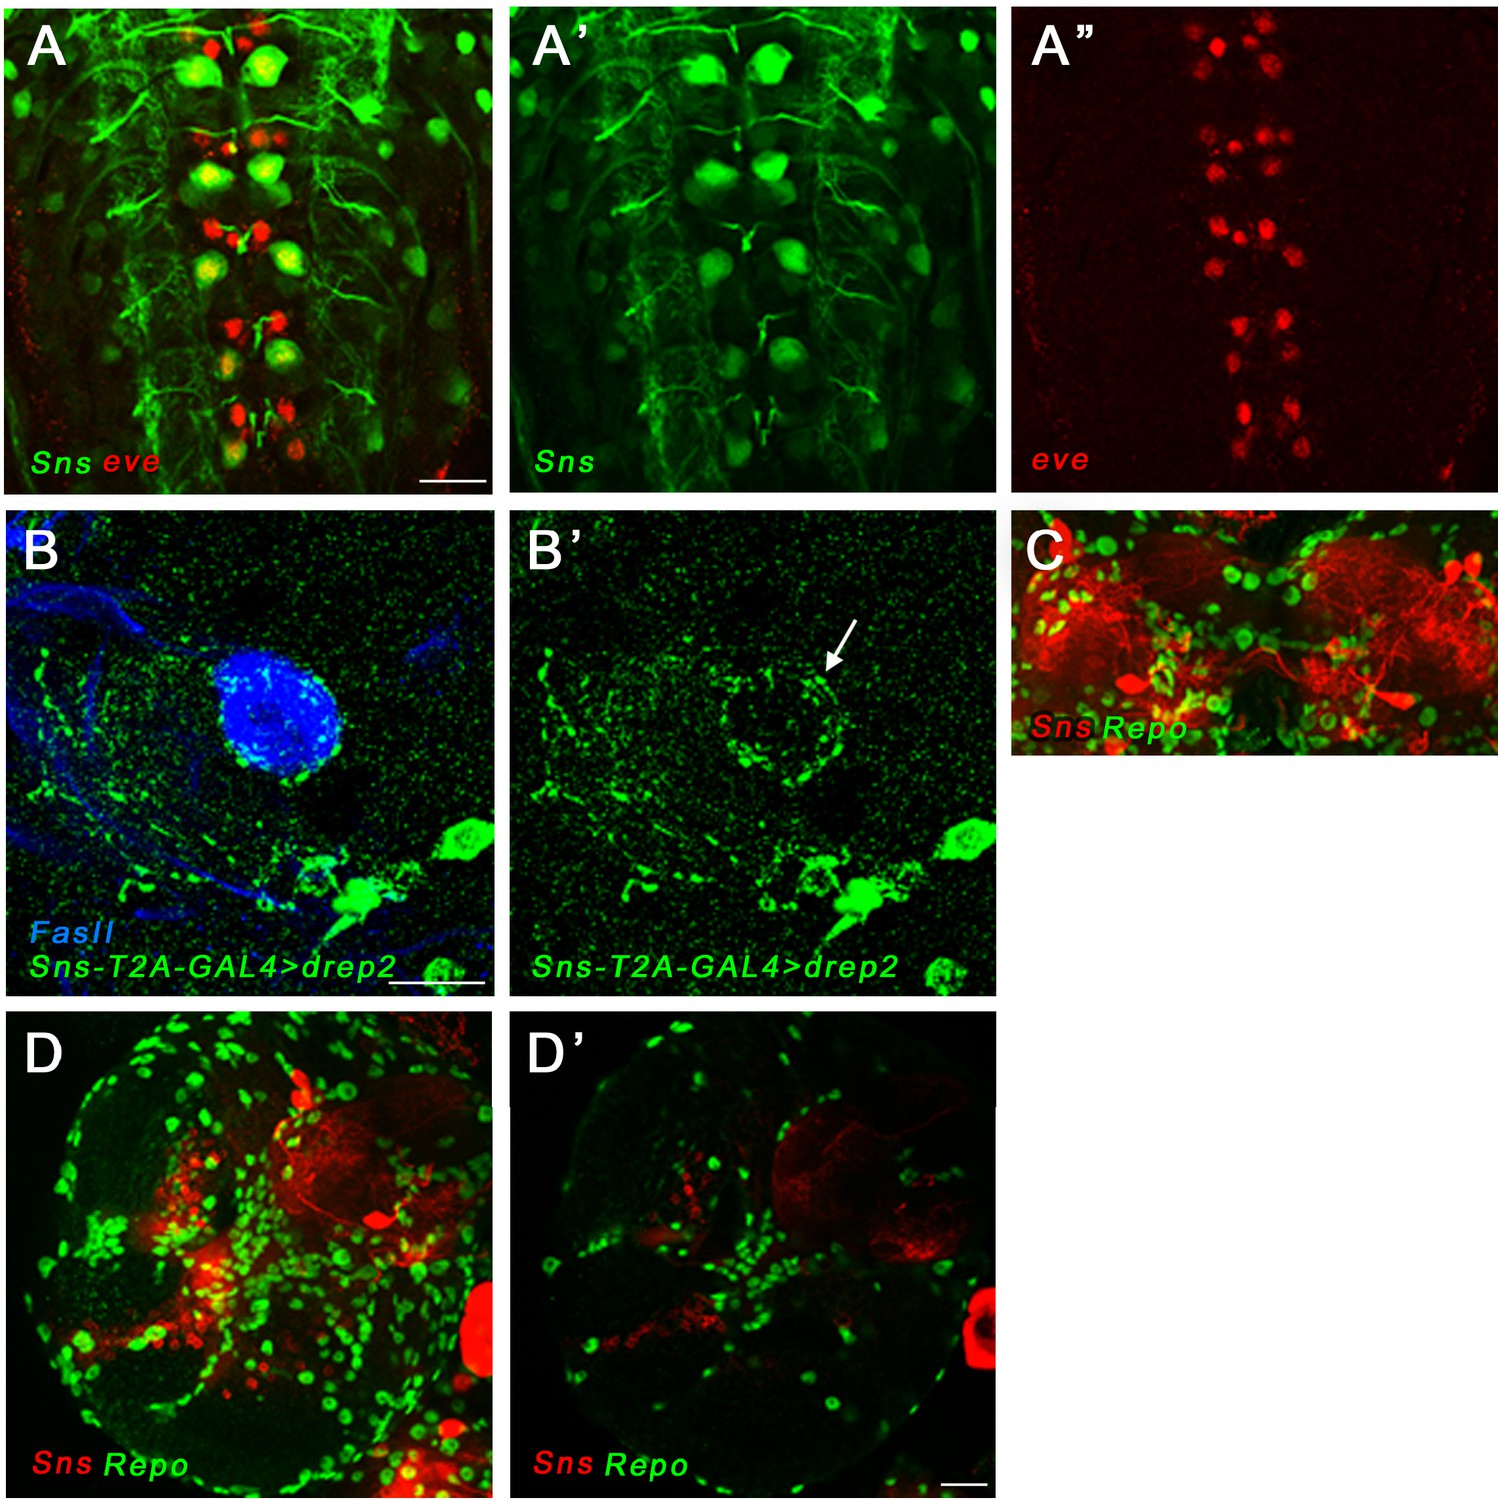
Lar and Sns reporter expression in the larval ventral nerve cord (VNC) and brain.
(A–A’’) Sns expression visualized by EGFP reporter expression driven by SnsMI03001-T2A-GAL4 (Sns>GFP; green), co-stained with Even-skipped antibody (Eve) in the larval VNC. Projection of four optical slices is shown. Sns is expressed in Eve-positive RP2/MNISN-1s neurons. (B, B’) Dendritic projections of Sns-expressing neurons seen by driving Drep2 (dendrite-specific marker) with Sns-GAL4 (green), co-stained with FasII antibody to label the mushroom body neuropil (blue). Dendritic projections of Sns-expressing neurons are seen enveloping the dorsal lobe of the mushroom body (B’, arrow). (C–D’) Sns is not expressed in glial cells. (C) Projection of confocal slices through the mushroom body showing no Sns co-expression in Repo-positive glial cells (green). Sns is visualized by driving mCD8-RFP reporter expression using Sns-GAL4 (red). (D, D’) Projection of confocal slices through the entire larval brain, showing no Sns expression in glial cells. Single slice is shown in D’. Scale bar, 20 µm.
Figure 3 with 2 supplements
Lar/sns transheterozygotes have the same phenotypes as Lar mutants and Sns knockdowns.
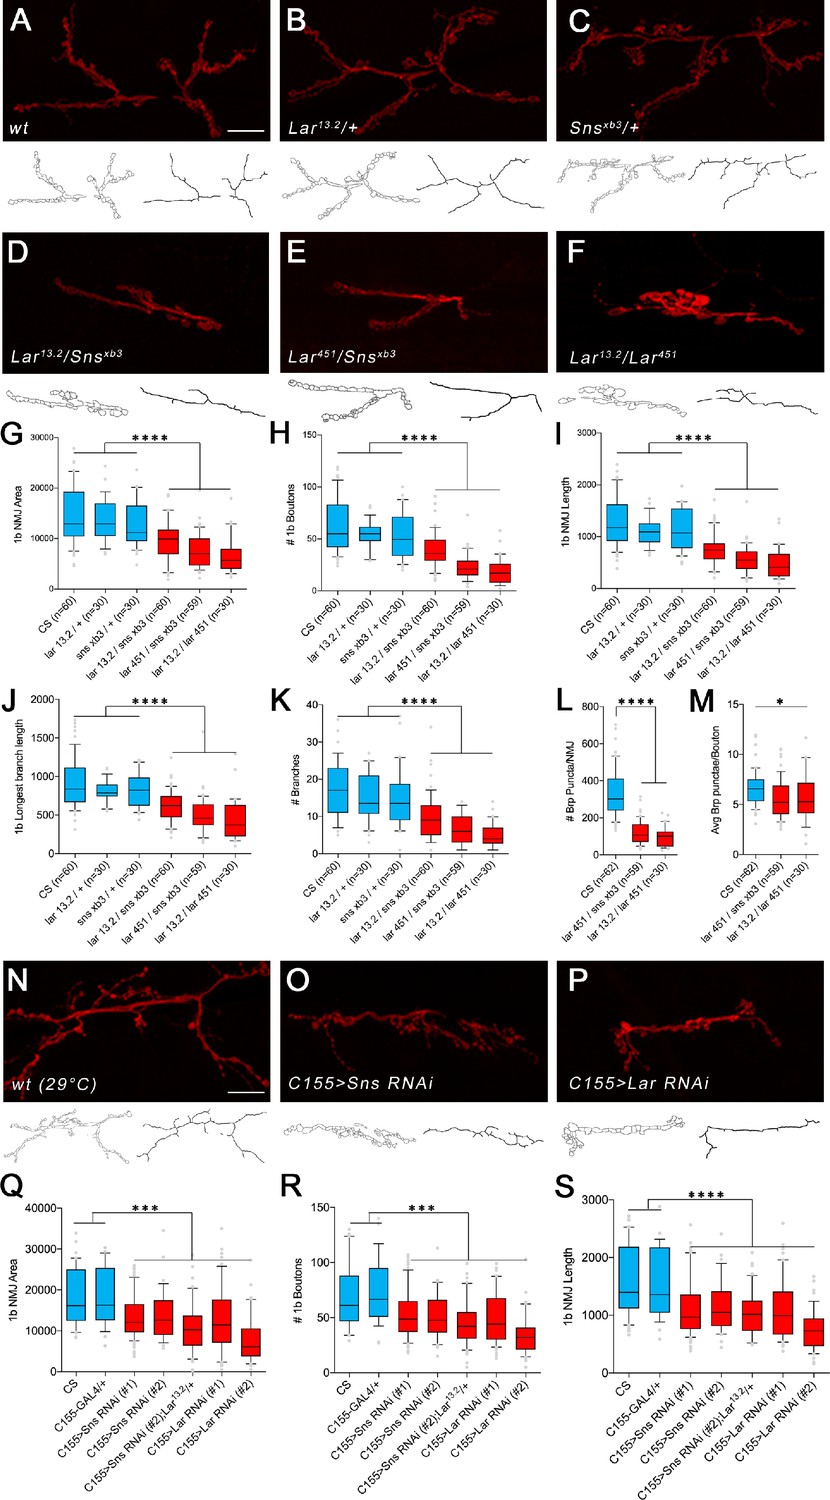
Neuromuscular junctions (NMJs) were analyzed using a published Fiji macro (Nijhof et al., 2016) that uses HRP to outline boutons and measures NMJ area, perimeter, length, longest branch length, number of branches, number of boutons, and Bruchpilot (Brp) labeled punctae. (A–F) Representative images of the NMJ on muscles 7/6 from WT and heterozygote controls (A–C), Lar/sns transheterozygotes (D, E), and Lar mutants (F). NMJs are labeled with anti-HRP (red). NMJ outlines showing boutons and branch architecture as outputs from the macro are under each NMJ image. (G–K) Quantification of 1b NMJ parameters, showing reduced NMJ size and arborization in Lar/sns transhets and Lar mutants (red) compared to het controls (blue). Data is average from segments A2–A4 from minimum 30 NMJs per genotype. (L, M) Quantification of Brp punctae showing reduced number of active zones in Lar/sns transhets and Lar mutants. (N–P) Representative images of NMJs on muscles 7/6 from animals with RNAi-mediated neuronal knockdown of Lar and Sns. Neuronal Lar or sns RNAi results in the same NMJ abnormalities seen in genetic Lar/sns transhets and Lar mutants. (Q–S) Quantification of NMJ parameters showing reduced 1b NMJ area, number of boutons, and NMJ length upon either Lar or Sns knockdown. A2–A4 segments were analyzed from at least 30 NMJs on muscles 7/6. All datasets were analyzed using one-way ANOVA followed by Tukey’s post-hoc correction. ****p<0.0001; ***p<0.001. Scale bar, 20 µm. See Figure 3—figure supplement 1 for analysis of 1s NMJs.
Figure 3—figure supplement 1
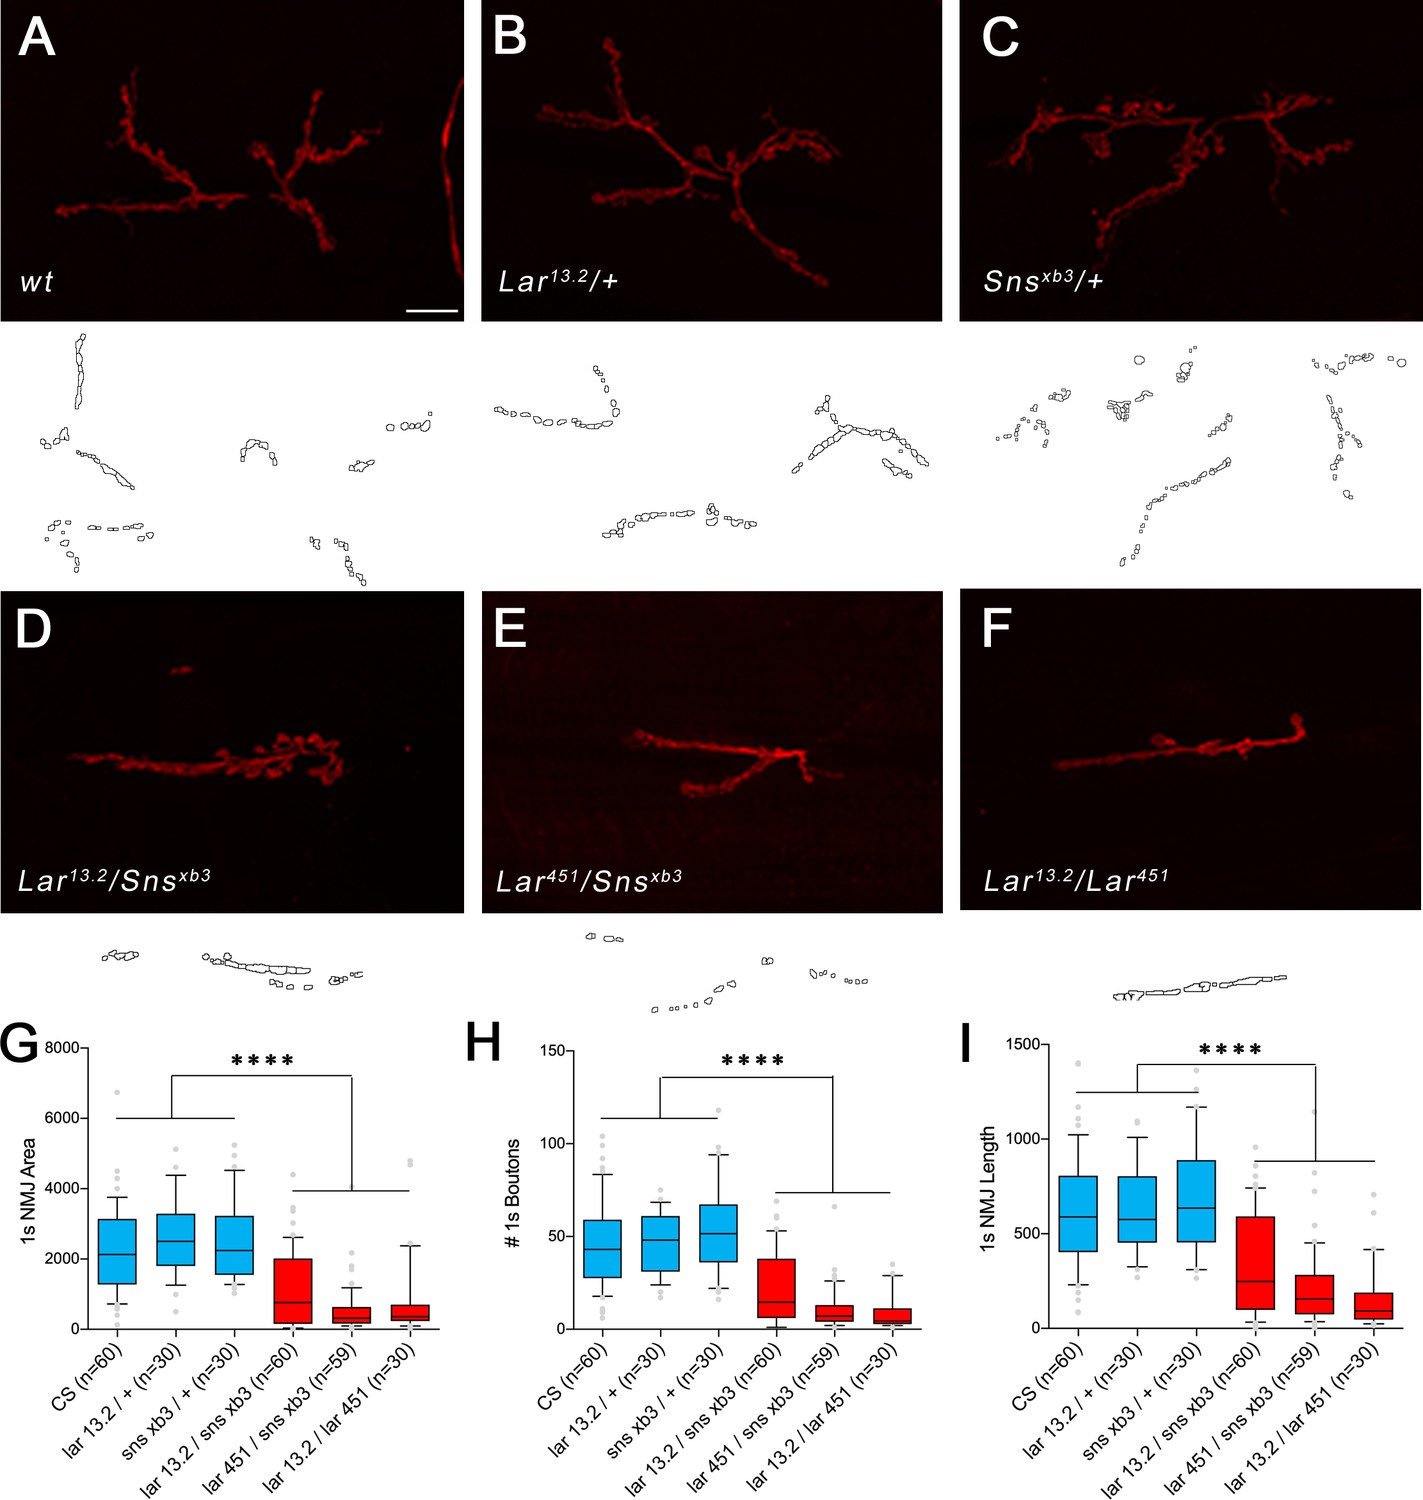
1s neuromuscular junction (NMJ) abnormalities in Lar/sns transhets.
NMJs were analyzed using a published Fiji macro (Nijhof et al., 2016) that uses HRP to outline boutons. NMJ area, length, and number of boutons were quantified specifically for 1s boutons. (A–F) Representative images of the NMJ on muscles 7/6 from control (A–C) and transhet (D–F) animals. NMJs are labeled with HRP (red). NMJ outlines showing 1s boutons and branch architecture as outputs from the Macro are under each NMJ image. (G–I) Quantification of 1s NMJ parameters showing reduced NMJ size and boutons in Lar/Sns transhets and Lar mutants (red) compared to het controls (blue). Data is average from segments A2–A4 from minimum 30 NMJs per genotype. All datasets were analyzed using one-way ANOVA followed by Tukey’s post-hoc correction. ****p<0.0001. Scale bar, 20 µm.
Figure 3—figure supplement 2
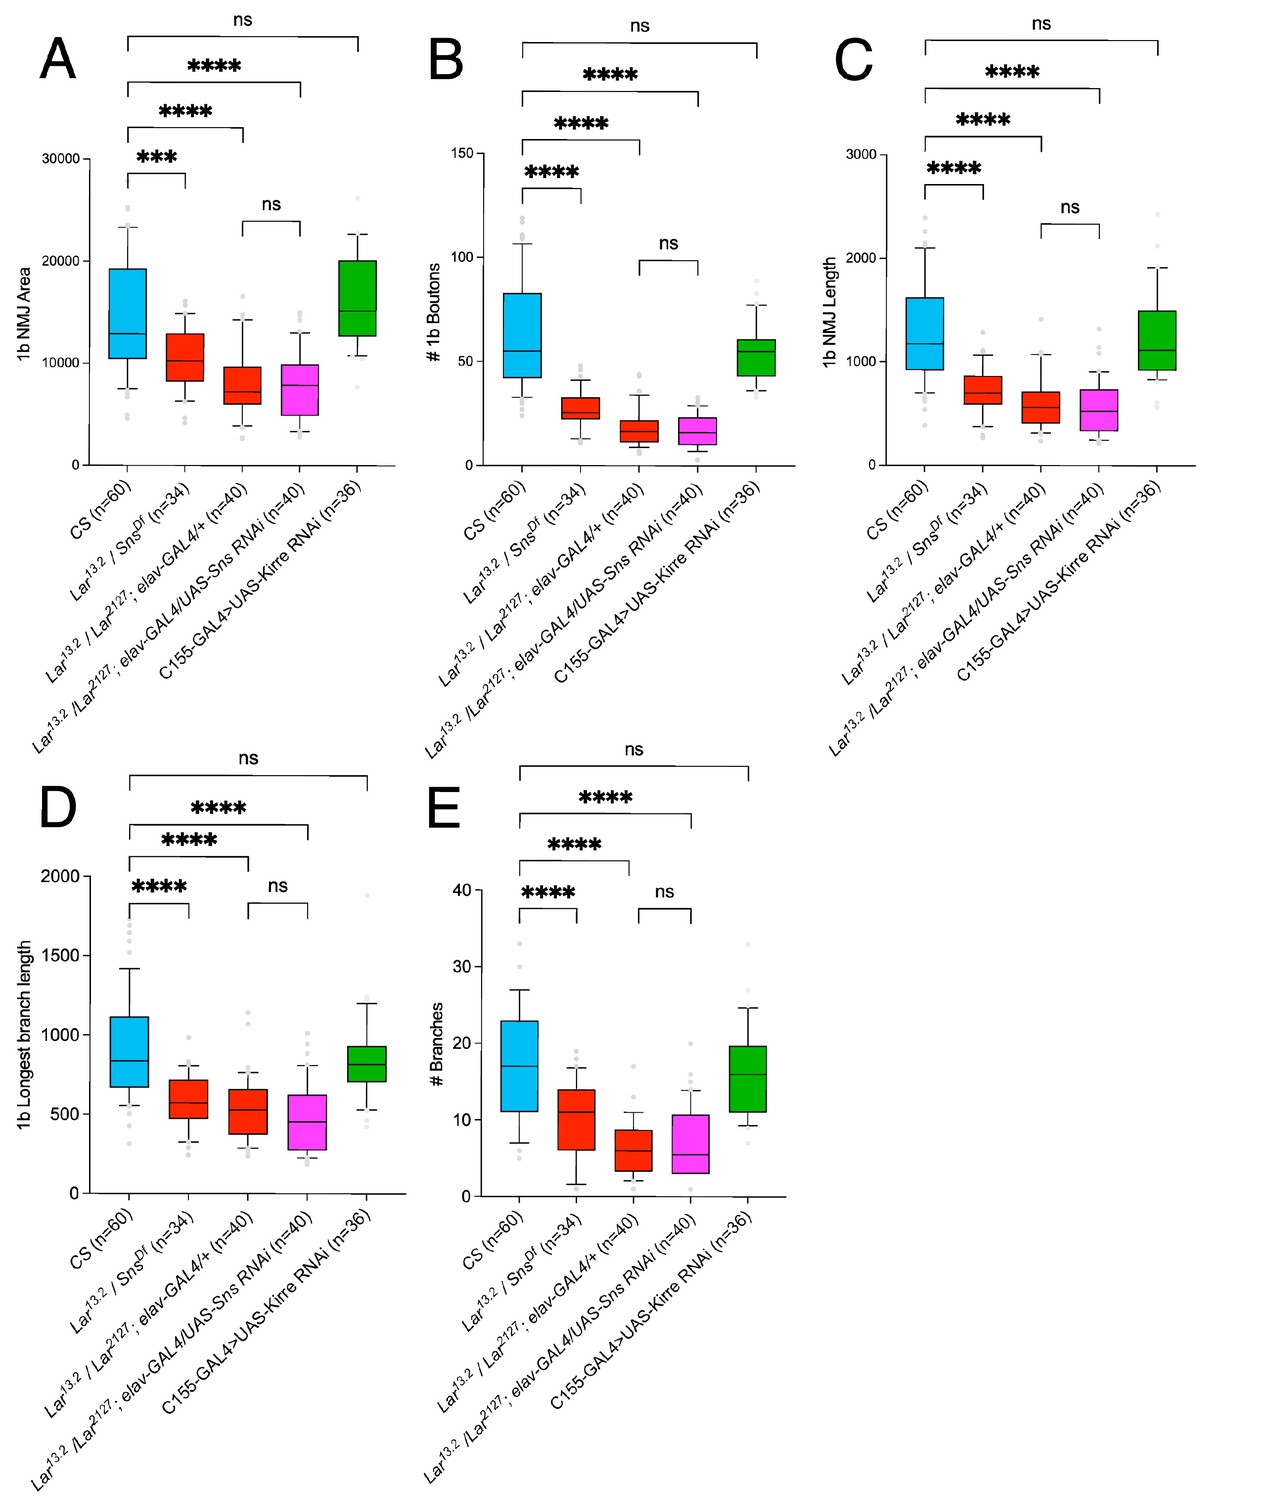
1b neuromuscular junction (NMJ) abnormalities in Lar/sns transhets, Sns RNAi in Lar mutants, and neuronal Kirre RNAi.
1b boutons on the 7/6 NMJ were analyzed as described. (A–E) Quantification of 1b NMJ parameters: (A) NMJ area, (B) number of 1b boutons, (C) total NMJ length, (D) longest 1b branch length, and (E) number of 1b branches. Lar13.2/snsDf transhets show similarly reduced NMJ parameters as observed with other Lar/sns transhets. Addition of sns RNAi to Lar null mutants does not increase the severity of the Lar mutant phenotype. Neuronal knockdown of Kirre does not cause 1b NMJ abnormalities. Data is average from segments A2–A4 from minimum 30 NMJs per genotype. All datasets were analyzed using one-way ANOVA followed by Tukey’s post-hoc correction. ****p<0.0001, **p< 0.01.
Figure 4 with 2 supplements
Lar and Sns act in different neurons to control mushroom body (MB) dorsal and medial lobe development.
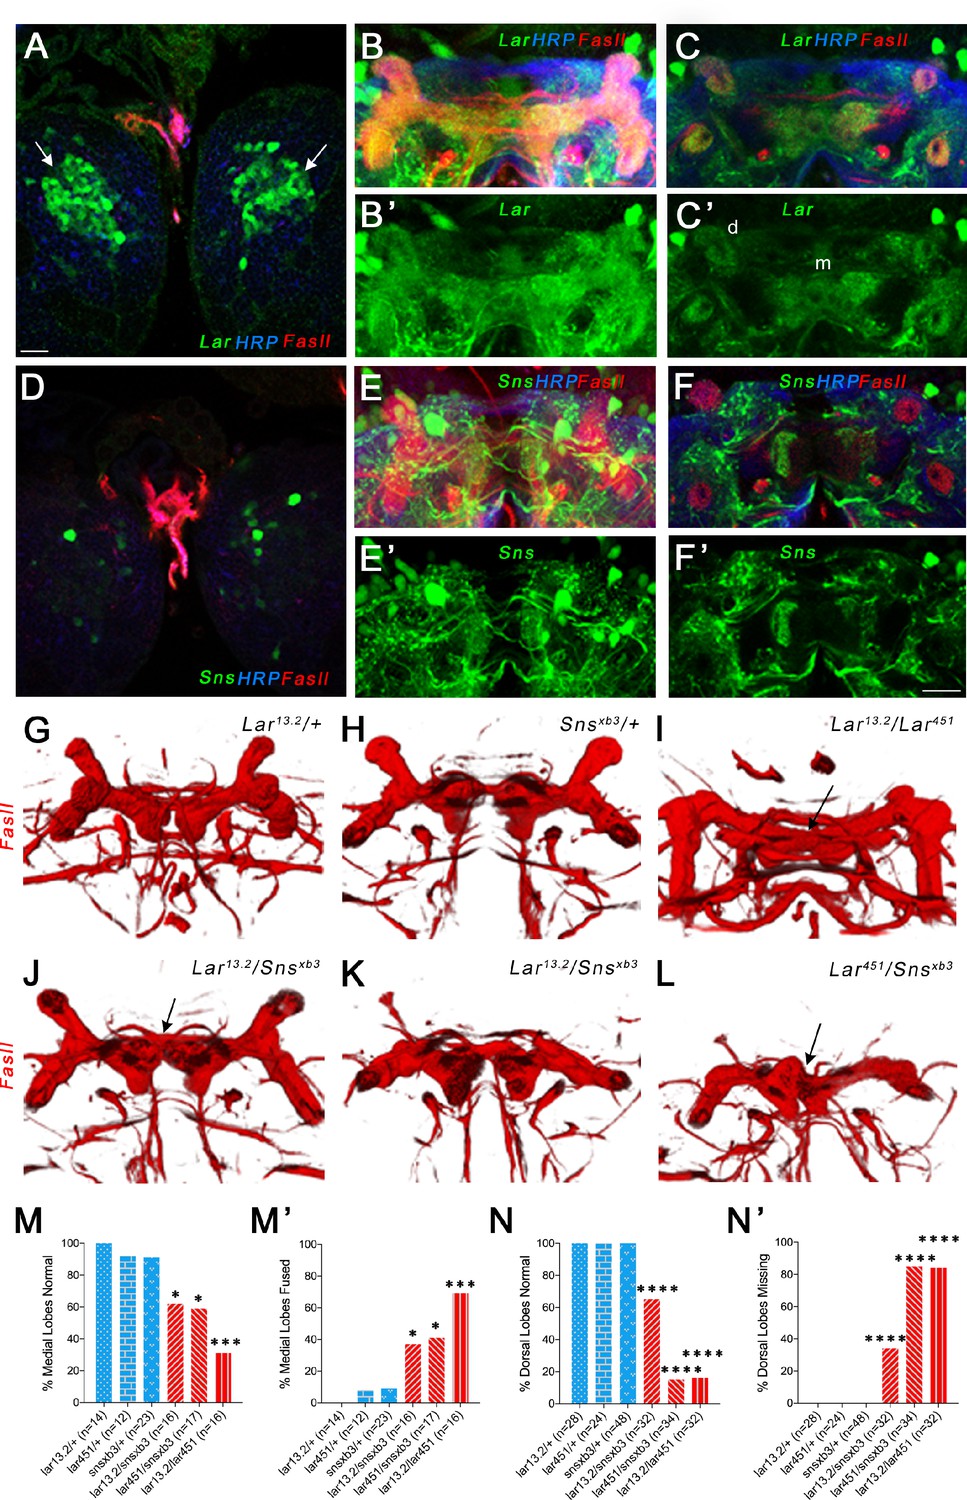
(A–F’) Lar>GFP and Sns>GFP expression in the larval brain. Brains were triple-stained for Lar>GFP (green), FasII (red), and anti-HRP (blue). Anti-FasII labels the MB neuropil; anti-HRP labels neuronal membranes. (A) Lar>GFP expression in Kenyon cells (KCs) (green, arrows). (B, B’) Projection of confocal slices through the entire larval MB showing Lar expression in the MB neuropil. (C, C’) Single optical slice showing Lar expression in the medial (m) and dorsal (d) lobes of the MB. (D) There is no Sns>GFP expression in KCs. (E, E’) Projection of confocal slices through the entire MB showing no overlap between Sns>GFP and the MB neuropil labeled by FasII. (F, F’) Single optical slice through the MB showing no Sns>GFP expression in the MB neuropil. (G–L) Third-instar larval MBs visualized with FasII staining. 3D reconstructions of confocal stacks using Imaris software are shown. (G) and (H) have normal MBs. (I) has missing dorsal lobes and medial lobe fusion (arrow). (J) has a medial lobe fusion phenotype (arrow). (K) has missing dorsal lobes. (L) has missing dorsal lobes and medial lobe fusion (arrow). (M–N’) Quantification of MB phenotypes in heterozygote controls (blue), Lar mutants (red), and Lar/sns transhets (red). In (M) and (N), the percentages of normal MBs are shown; in (M’) and (N’), the percentages of MBs with the phenotype are shown. (M, M’) Medial lobe fusion phenotype, (N, N’) Dorsal lobe branching defect. Data were analyzed using Fisher’s exact test, and each genotype was compared to every other genotype. ****p<0.0001; ***p<0.001; *p<0.05. Scale bar, 20 µm. See Figure 4—figure supplement 1 for single-slice analysis in Lar/sns transhets and Lar and Sns RNAi-mediated MB phenotypes.
-
Figure 4—source data 1
Data for graphs in Figure 4.
Number of animals with normal and fused medial lobes. Number of normal and missing dorsal lobes.
- https://cdn.elifesciences.org/articles/71469/elife-71469-fig4-data1-v2.xlsx
Figure 4—figure supplement 1
Medial lobe fusion in the larval mushroom body in Lar/sns transhets and upon RNAi-mediated Lar and Sns knockdown.
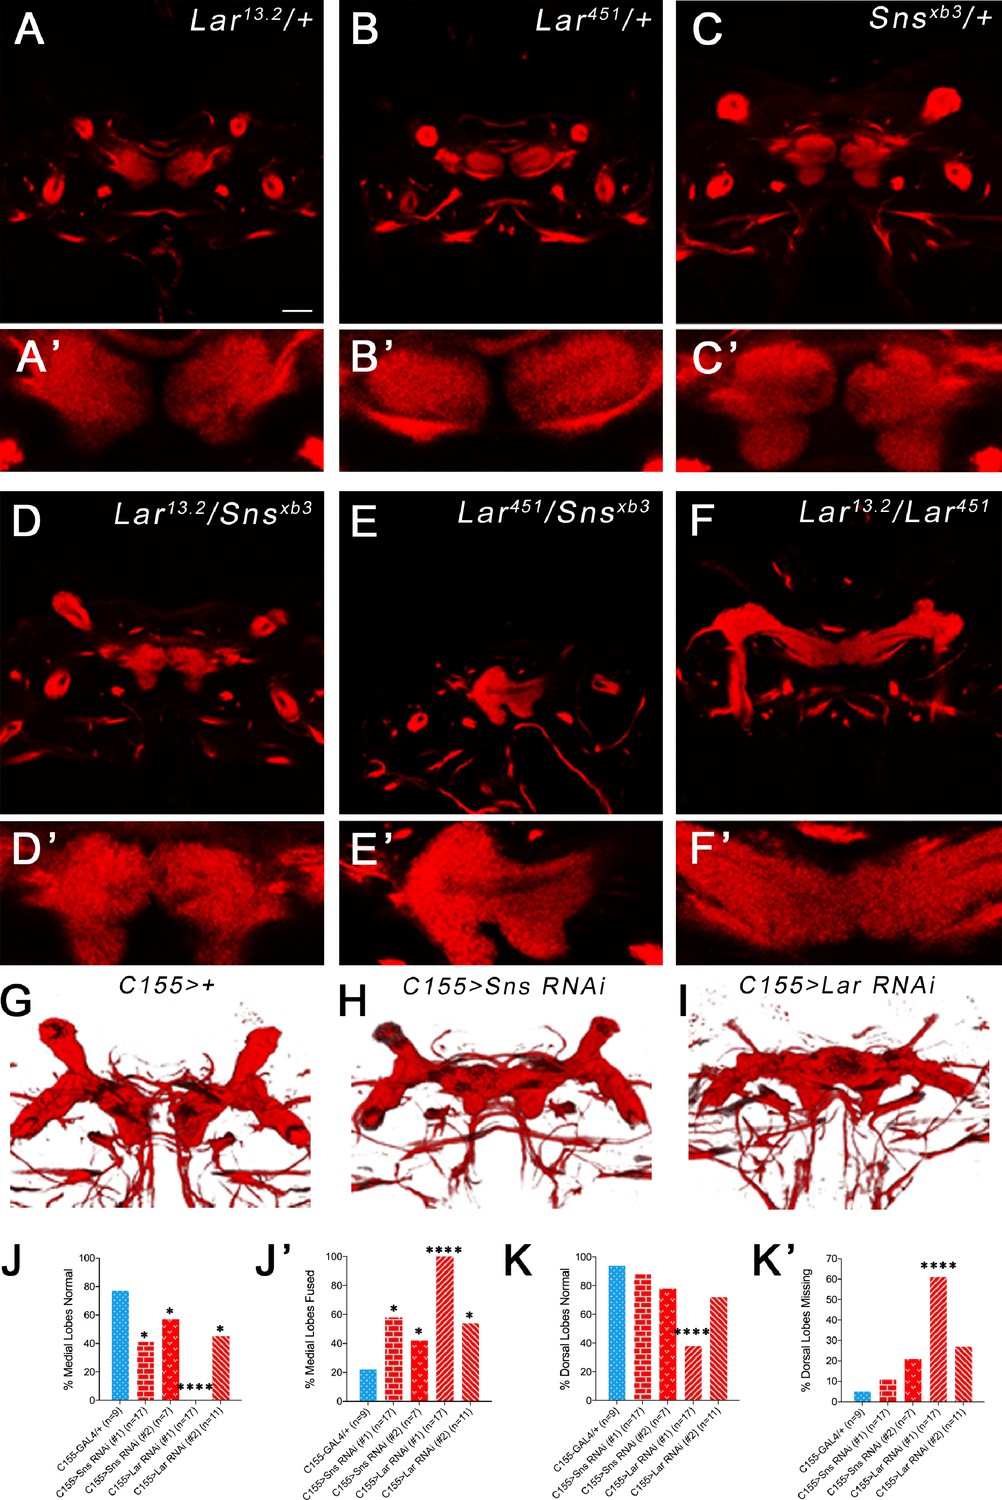
(A–F’) Single optical slices through the medial lobes of control (A–C’) and genetic transhet (D–F’) animals showing normal unfused medial lobes in controls (close-up of medial lobes in A’–C’) and fused medial lobes in transhets (D’–F’). Anti-FasII (red) is used to label the mushroom body neuropil. (G–I) 3D rendering of confocal stacks of FasII-stained larval brains from RNAi knockdown experiments. (J–K’) Quantification of medial lobe fusion and dorsal lobe branching defects upon RNAi-mediated knockdown of Lar and Sns. GAL4 only control in blue and Lar or sns RNAi genotypes in red. Data were analyzed using Fisher’s exact test, and each genotype was compared to every other genotype. ****p<0.0001; *p<0.05. Scale bar, 20 µm.
-
Figure 4—figure supplement 1—source data 1
Data for graphs in Figure 4—figure supplement 1.
Number of animals with normal and fused medial lobes. Number of normal and missing dorsal lobes.
- https://cdn.elifesciences.org/articles/71469/elife-71469-fig4-figsupp1-data1-v2.xlsx
Figure 4—figure supplement 2
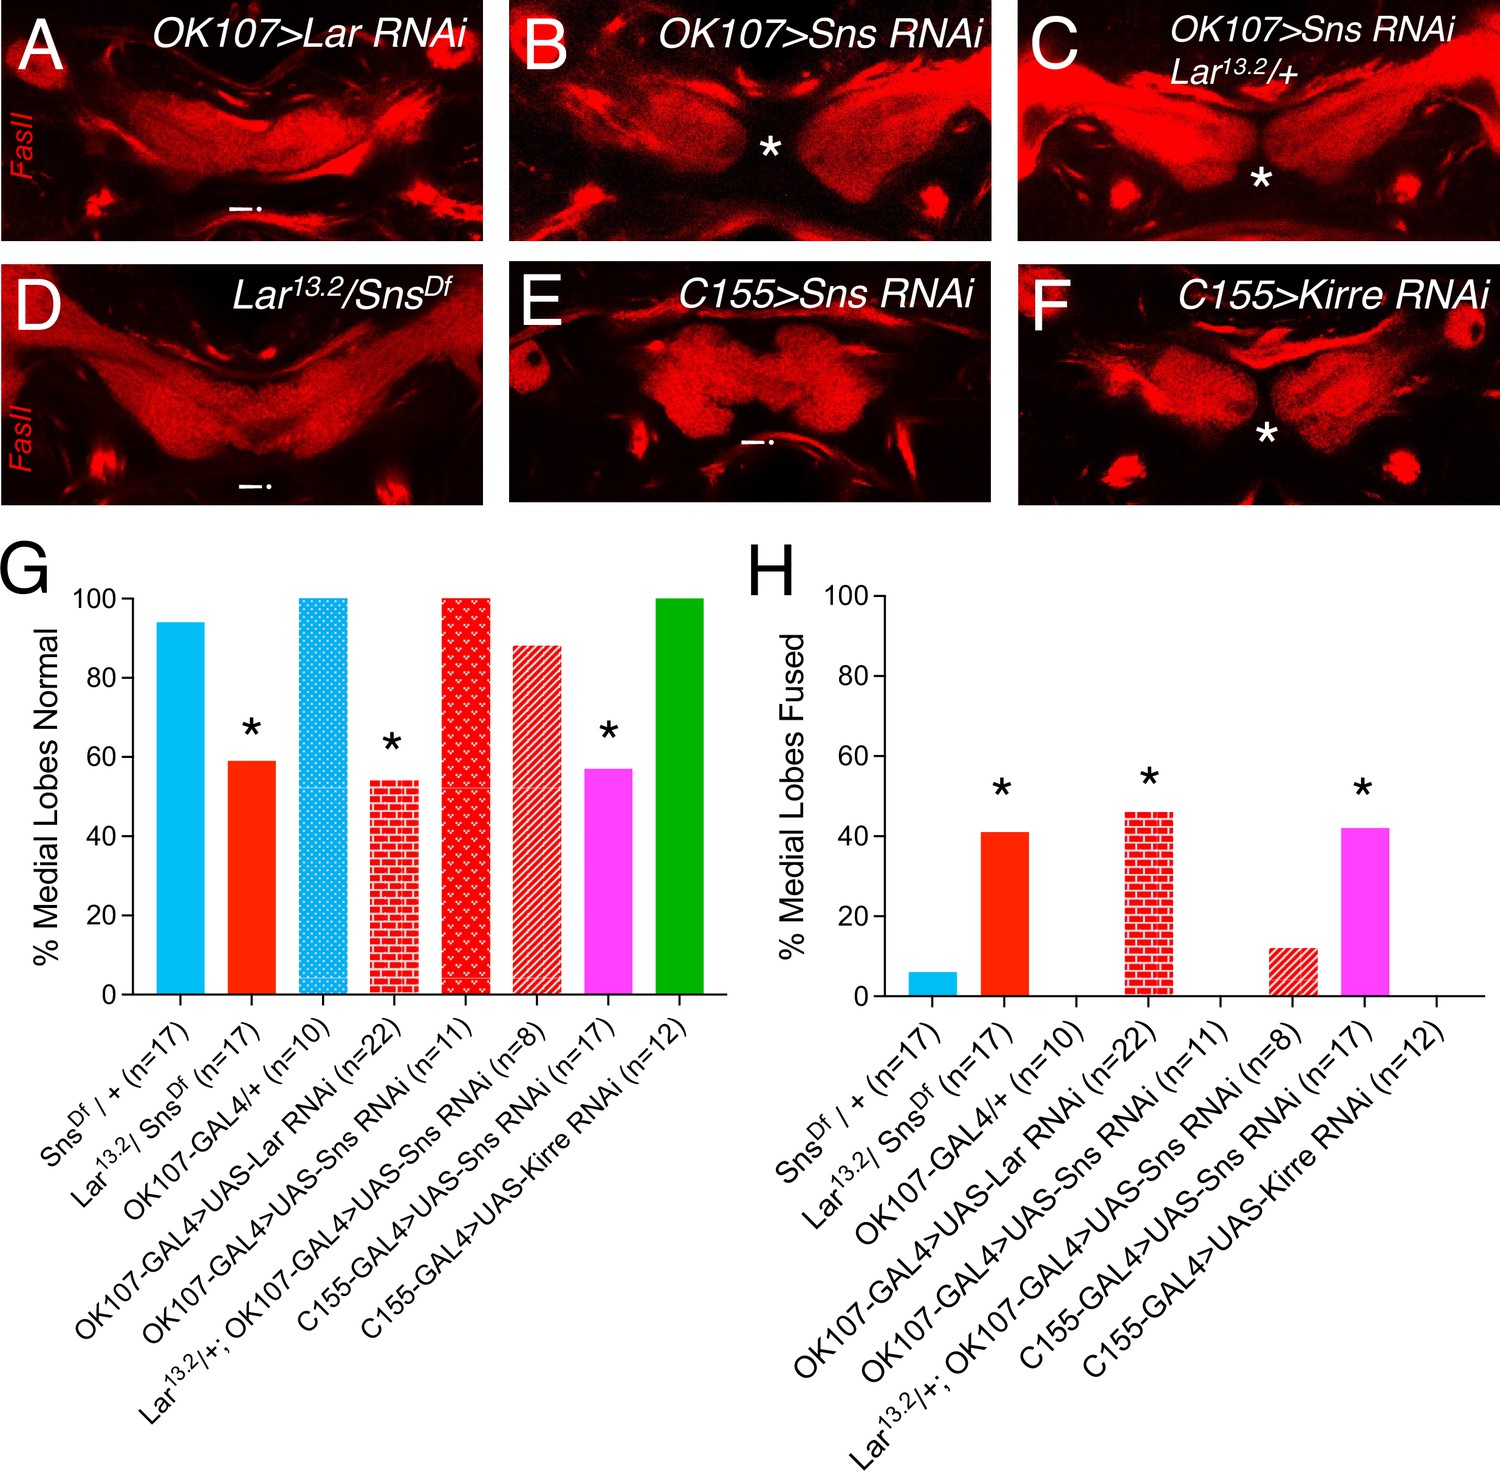
Larval medial lobe fusion in Lar13.2/SnsDf transhets, neuronal Sns and Kirre knockdown, and mushroom body (MB)-specific Lar and Sns RNAi knockdown.
(A–F) Single optical slices through the medial lobes of larval MBs stained with FasII antibody to visualize the MB neuropil. Asterisks denote normal, unfused medial lobes. Arrowheads show fused medial lobes with medial lobe axons crossing the midline. (G, H) Quantification of medial lobe fusion phenotype in Lar13.2/snsDf transhets, neuronal Sns and Kirre knockdown, and cis RNAi for Lar and Sns in MB neurons (OK107-GAL4). Data were analyzed using Fisher’s exact test, and each genotype was compared to every other genotype. *p<0.05.
-
Figure 4—figure supplement 2—source data 1
Data for graphs in Figure 4—figure supplement 2.
Number of animals with normal and fused medial lobes.
- https://cdn.elifesciences.org/articles/71469/elife-71469-fig4-figsupp2-data1-v2.xlsx
Figure 5 with 2 supplements
Lar and Sns expression in the developing pupal mushroom body (MB).
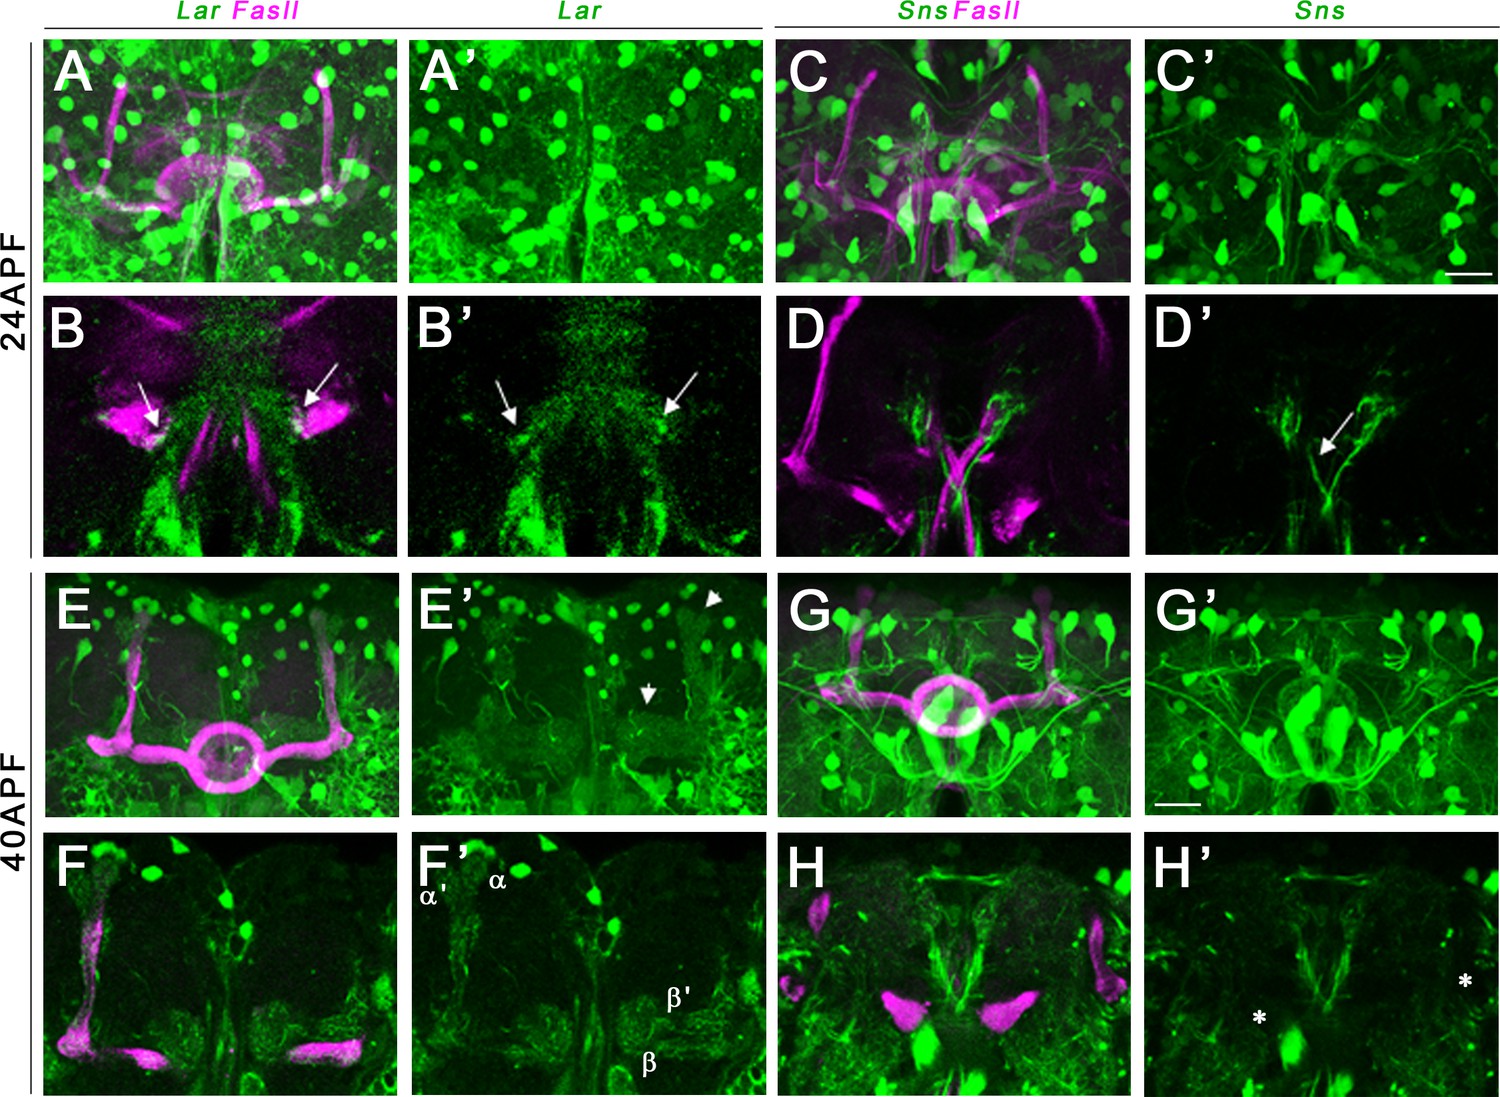
Confocal projections and single optical slices showing Lar and Sns expression in the 24 hr after puparium formation (APF) (A–D’) and 40 hr APF (E–H’) pupal MB, co-stained with FasII antibody (magenta). Projections of the entire MB are shown in (A, A’, C, C’, E, E’, G, and G’). The rest are single optical slices. Lar expression is seen in the growth cones of developing β lobe axons (B, B’, arrows). No Sns expression is seen in the 24 hr APF MB (C–D’). Sns expression is seen in neuronal projections at the midline (D’, arrow). (E–F’) Lar expression is seen in α, α′, β, and β′ lobes in the 40 hr APF MB (arrows in E’; F, F’, single slice showing all four lobes with Lar expression). (G–H’) No Sns expression is seen in the 40 hr APF MB (asterisks in H’ denote unlabeled α, α′, β, and β′ lobes). Scale bars, 20 µm. See Figure 5—figure supplement 1 for Lar and Sns expression in 72 hr APF and adult brains and Figure 5—figure supplement 2 for Lar and Sns expression in the pupal and adult antennal lobes.
Figure 5—figure supplement 1
Lar and Sns expression in the 72 hr after puparium formation (APF) and adult mushroom body (MB).
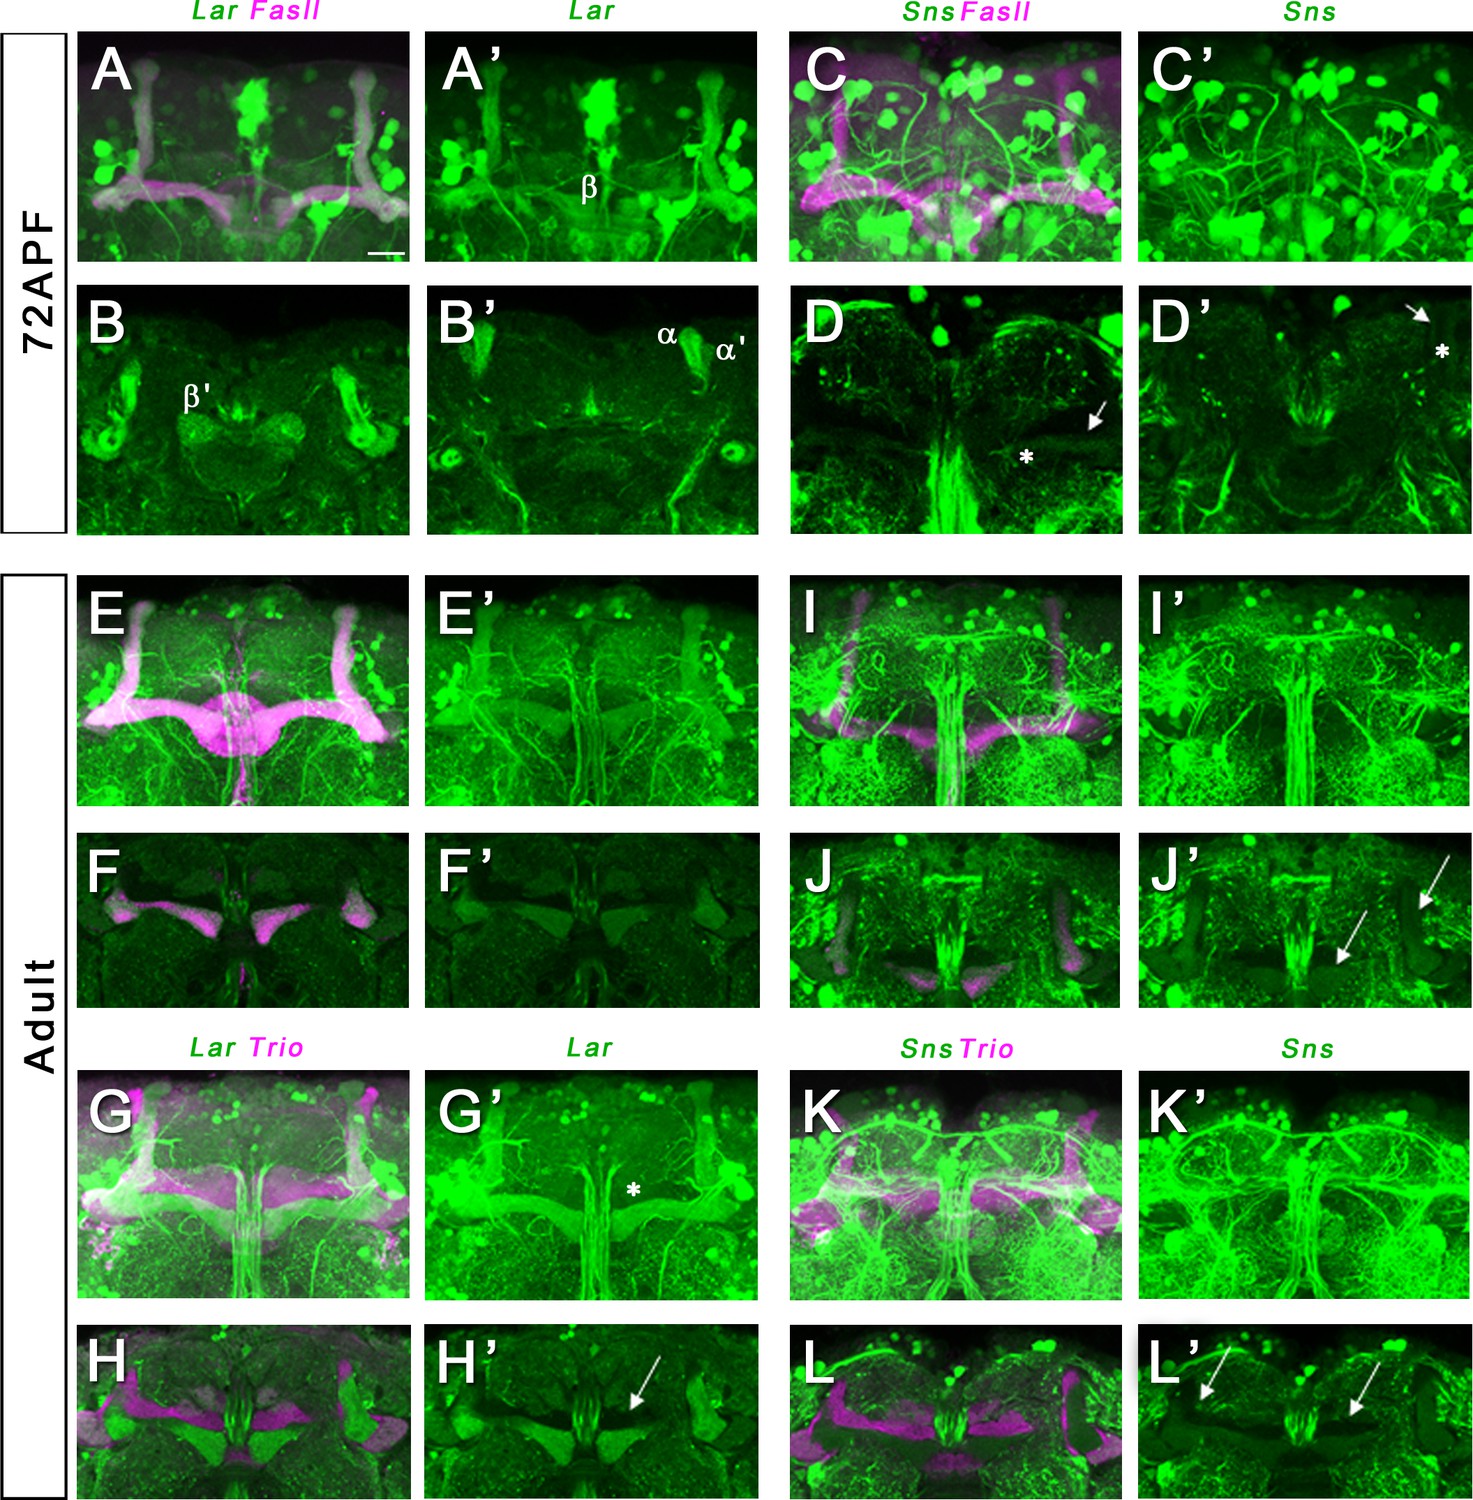
Confocal projections and single optical slices showing Lar and Sns expression in the 72 hr APF (A–D’) and adult (E–L’) MB, co-stained with FasII antibody (magenta). Projections of the entire MB are shown in A, A’, C, C’, E, E’, G, G’, I, I’, K, and K’. The rest are single optical slices. (A–B’) Strong Lar expression is seen in all lobes of the 72 hr APF MB. (C–D’) Weak Sns expression is seen in α and β lobes of the 72 hr APF MB (D–D’, arrows). Expression is seen only in older axons in the α and β lobes with hollow cores in the center of the lobes (D–D’, asterisks). Lar continues to be strongly expressed in α and β lobes of the adult MB (E–H’). (F–F’) Single optical slice from the adult MB showing strong Lar>GFP expression in the α and β lobes, co-localizing with FasII staining. (G, G’) Projection of confocal slices showing the entire adult MB, double-stained for GFP (green) and Trio (magenta). Trio labels the γ, α′, and β′ lobes of the adult MB. (H, H’) Single optical slice showing no detectable Lar>GFP expression in the Trio-expressing α′ and β′ lobes (H’, arrow). Weak expression is seen in the γ lobe (G’, asterisk). (J, J’) Single optical slice showing faint Sns expression in the α and β lobes (J’, arrows). (L, L’) Single optical slice showing no Sns expression in the γ, α′, and β′ lobes (L’, arrows).
Figure 5—figure supplement 2
Lar and Sns expression in the adult and developing pupal antennal lobes (ALs).
Single optical slices showing either Lar>GFP or Sns>GFP (green) expression in the ALs, co-stained with anti-HRP (blue) to label the AL neuropil. (A, A’) Weak Lar>GFP expression seen in several glomeruli of the adult AL (A’, arrows). (B, B’) Strong Sns>GFP expression seen in three glomeruli of the adult AL (B’, asterisks). (C, C’) Strong Lar>GFP expression seen in several glomeruli in the 72 hr after puparium formation (APF) AL (C’, arrows). (D, D’) Sns>GFP is expressed at high levels in some glomeruli in the 72 hr APF AL (D’, asterisks). (E, E’) Weak Lar>GFP expression is seen in several glomeruli in the 40 hr APF AL (E’, arrows). (F, F’) Sns>GFP is strongly expressed in several glomeruli in the 40 hr APF AL (F’, arrows). Scale bar, 20 µm.
Figure 6 with 1 supplement

Lar and Sns are required for normal lobe development in the adult mushroom body (MB).
(A–F) 3D reconstructions of confocal stacks from anti-FasII-stained adult brains using Imaris software. (A–C) Heterozygote controls showing normal α and β lobes of the adult MB. Asterisks show the ends of normal β lobes, which stop short of the midline and remain separated. (D–F) Lar/sns transheterozygotes and Lar mutants, showing abnormal MB architecture, with missing α lobes and β lobes fused across the midline. (G, G’) Quantification of β lobe midline fusion phenotype. Heterozygote controls (blue) show completely normal unfused β lobes. Lar/sns transheterozygotes and Lar mutants (red) have fused β lobes. (H, H’) Quantification of α lobe branching defect. Heterozygote controls (blue) have intact α lobes, while Lar/sns transhets and Lar mutants (red) have missing α lobes. In (G) and (H), the percentages of normal MBs are shown; in (G’) and (H’), the percentages of MBs with the phenotype are shown. (I–N) 3D reconstructions of confocal stacks from adult brains stained with FasII and Trio antibody to visualize the entire MB with all lobes. (I–K) Heterozygote controls show normal MB lobes. (L–N) Lar/sns transheterozygotes and Lar mutants show abnormal MB architecture, with fused β and β′ lobes and missing α and α′ lobes. (O, O’) Quantification of β′ lobe midline fusion phenotype showing normal β′ lobes in heterozygote controls (blue) and almost completely fused β′ lobes in Lar/sns transheterozygotes and Lar mutants (red). (P, P’) Quantification of α′ lobe branching defect. Heterozygote controls (blue) have completely normal α′ lobes while Lar/sns transhets and Lar mutants (red) are missing most α′ lobes. In (O) and (P), the percentages of normal MBs are shown; in (O’) and (P’), the percentages of MBs with the phenotype are shown. Data were analyzed using Fisher’s exact test, and each genotype was compared to every other genotype. ****p<0.0001; **p<0.01.
-
Figure 6—source data 1
Data for graphs in Figure 6.
Number of animals with normal and fused β and β′ lobes. Number of normal and missing α and α′ lobes.
- https://cdn.elifesciences.org/articles/71469/elife-71469-fig6-data1-v2.xlsx
Figure 6—figure supplement 1
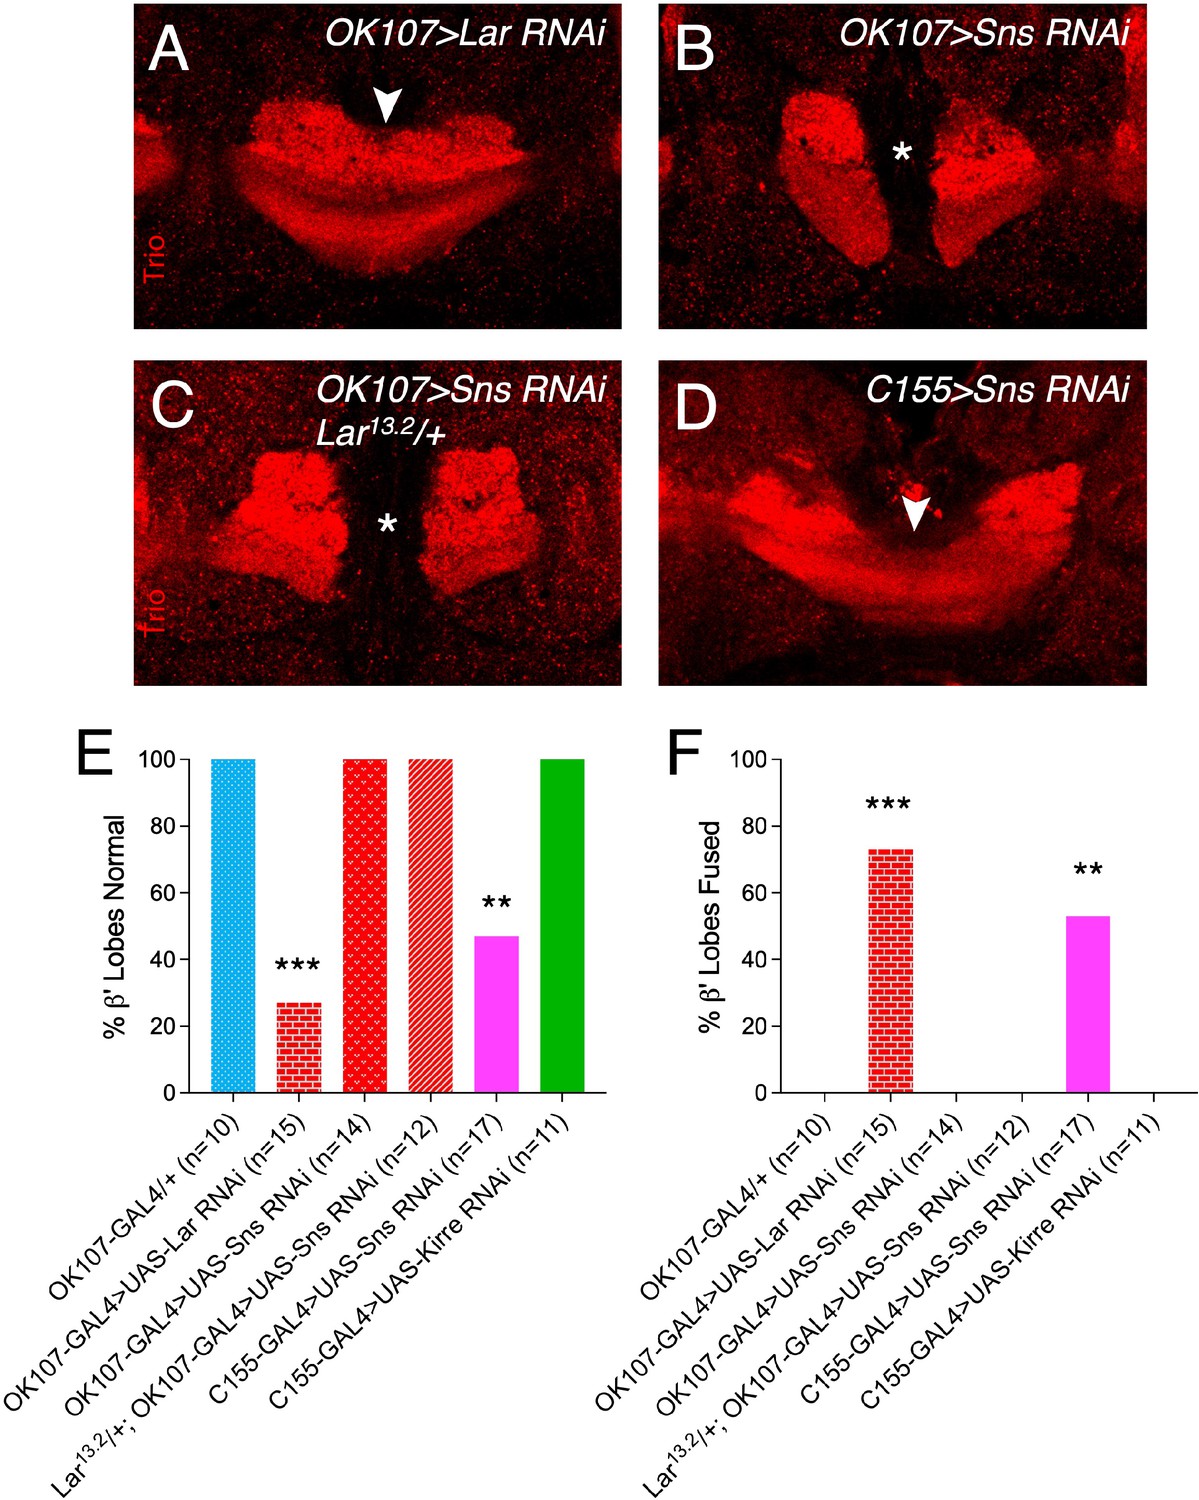
Adult β′ lobe fusion in mushroom body (MB)-specific Lar and Sns RNAi knockdown and pan-neuronal Sns and Kirre knockdown.
(A–D) Single optical slices through β′ lobes of the adult MB stained with Trio antibody to label α′/β′ lobes. Asterisks denote normal β′ lobes. Arrowheads show β′ lobe axons crossing the midline. (E, F) Quantification of β′ lobe midline fusion phenotype upon pan-neuronal Sns and Kirre RNAi knockdown and cis Lar and Sns knockdown in all MB neurons only (OK107-GAL4). Data were analyzed using Fisher’s exact test, and each genotype was compared to every other genotype. ***p<0.001; **p<0.01.
-
Figure 6—figure supplement 1—source data 1
Data for graphs in Figure 6—figure supplement 1.
Number of animals with normal and fused β′ lobes.
- https://cdn.elifesciences.org/articles/71469/elife-71469-fig6-figsupp1-data1-v2.xlsx
Figure 7 with 2 supplements
Lar and Sns expression in the developing pupal optic lobes (OLs).
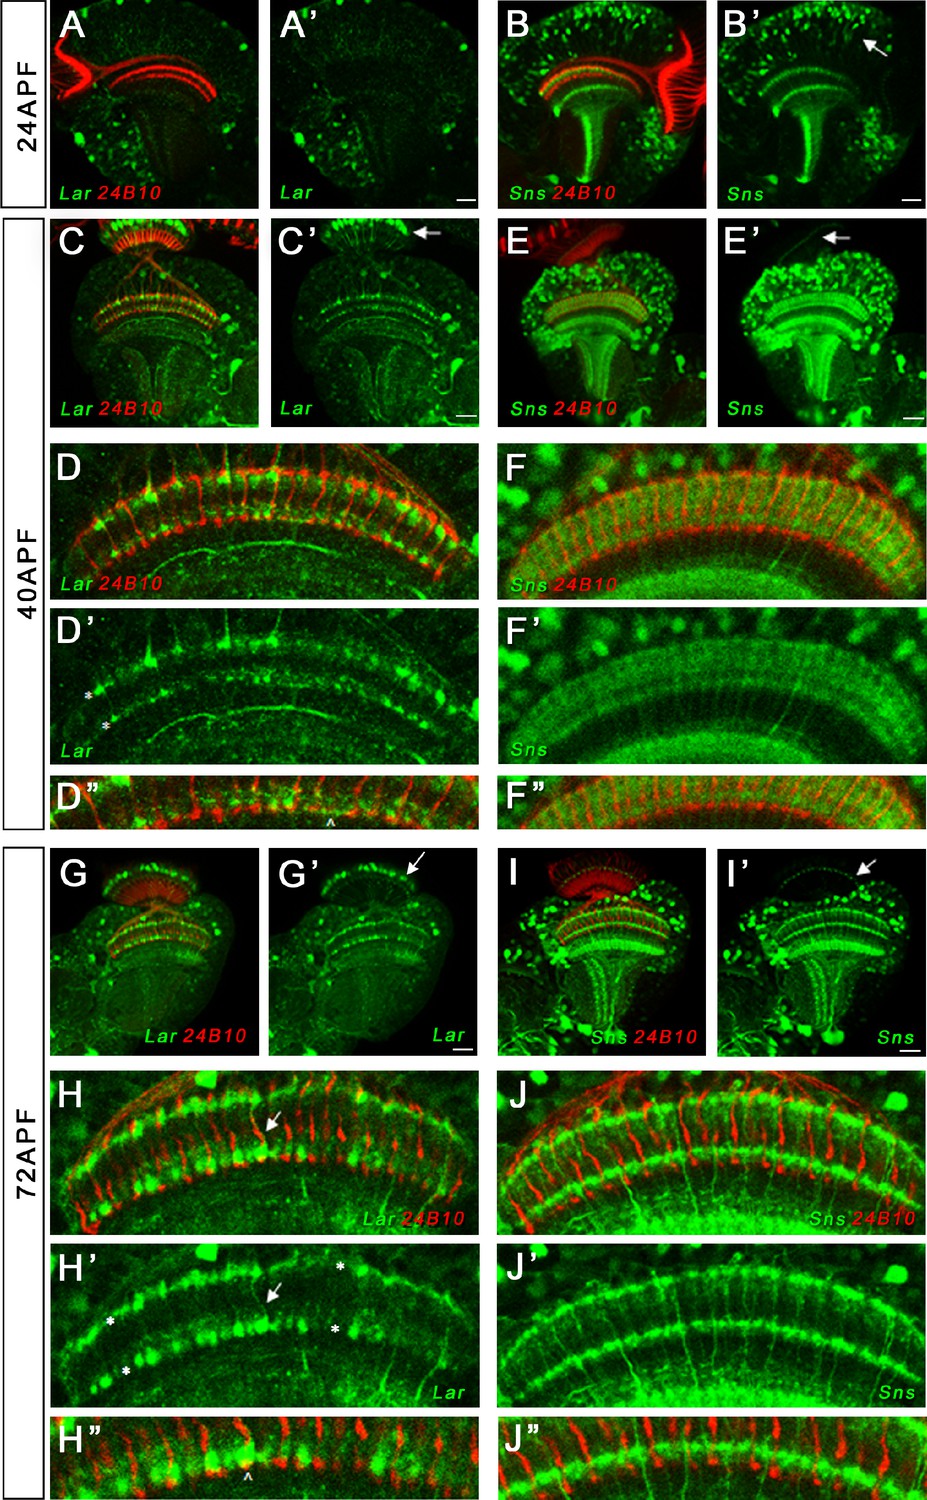
Single optical slices showing Lar and Sns (green) expression in 24 hr after puparium formation (APF), 40 hr APF, and 72 hr APF OL, co-stained with anti-Chaoptin (24B10 mAb, red). (A, A’) Weak Lar>GFP expression is seen in the medulla neuropil at 24 hr APF. (B, B’) At this timepoint, Sns>GFP is expressed at high levels in neuronal cell bodies in the medullary cortex (B’, arrow) and in specific layers in the medulla and lobula. (C, C’) Strong Lar>GFP expression is seen in L1 lamina neuron cell bodies (C’, arrow), which arborize in layers M1 and M5 of the medulla in the 40 hr APF OL. (D–D’’) Close-up of the distal medulla showing L1 lamina neuron arbors in M1 and M5 layers of the medulla (D’, asterisks). Faint Lar expression is seen in the M6 layer of the medulla (D’’, arrowhead). (E, E’) Sns>GFP expression increases at 40 hr APF, with many more neurons expressing Sns in the medullary cortex. Sns>GFP expression can be seen in several layers in the distal as well as the proximal medulla. (F–F’’) Close-up of the distal medulla showing Sns>GFP expression in layers M1 through M5 of the medulla. Sns is not expressed in R7 photoreceptors. (G–H’’) Strong Lar>GFP expression seen in L1 cell bodies (G’, arrow) and layers M1 and M5 of the medulla (H’, asterisks). Strong Lar expression is seen in close proximity to R7 axons and terminals (H, H’, arrows; H’’, arrowhead). (I–J’’) Sns>GFP is expressed at very high levels in the 72 hr APF OL. Specific Sns expression is seen in M1, M5, and M10 layers of the medulla and a few layers in the lobula (I, I’). Sns expression is also seen in the lamina. Note the dots at the top of the lamina (arrows in E’ and I’), which match the morphologies of C2 endings. C2 arborizes in layers M1, M5, and M10 of the medulla. (J–J’’) Close-up of the distal medulla showing Sns expression in M1 and M5 layers. Scale bar, 20 µm. See Figure 7—figure supplement 1 for Lar and Sns expression in the adult OL and Sns expression in a C2-like arborization pattern. See Figure 7—figure supplement 2 for further characterization of Lar and Sns OL expression.
Figure 7—figure supplement 1
Expression of Lar and Sns in the adult optic lobe (OL).
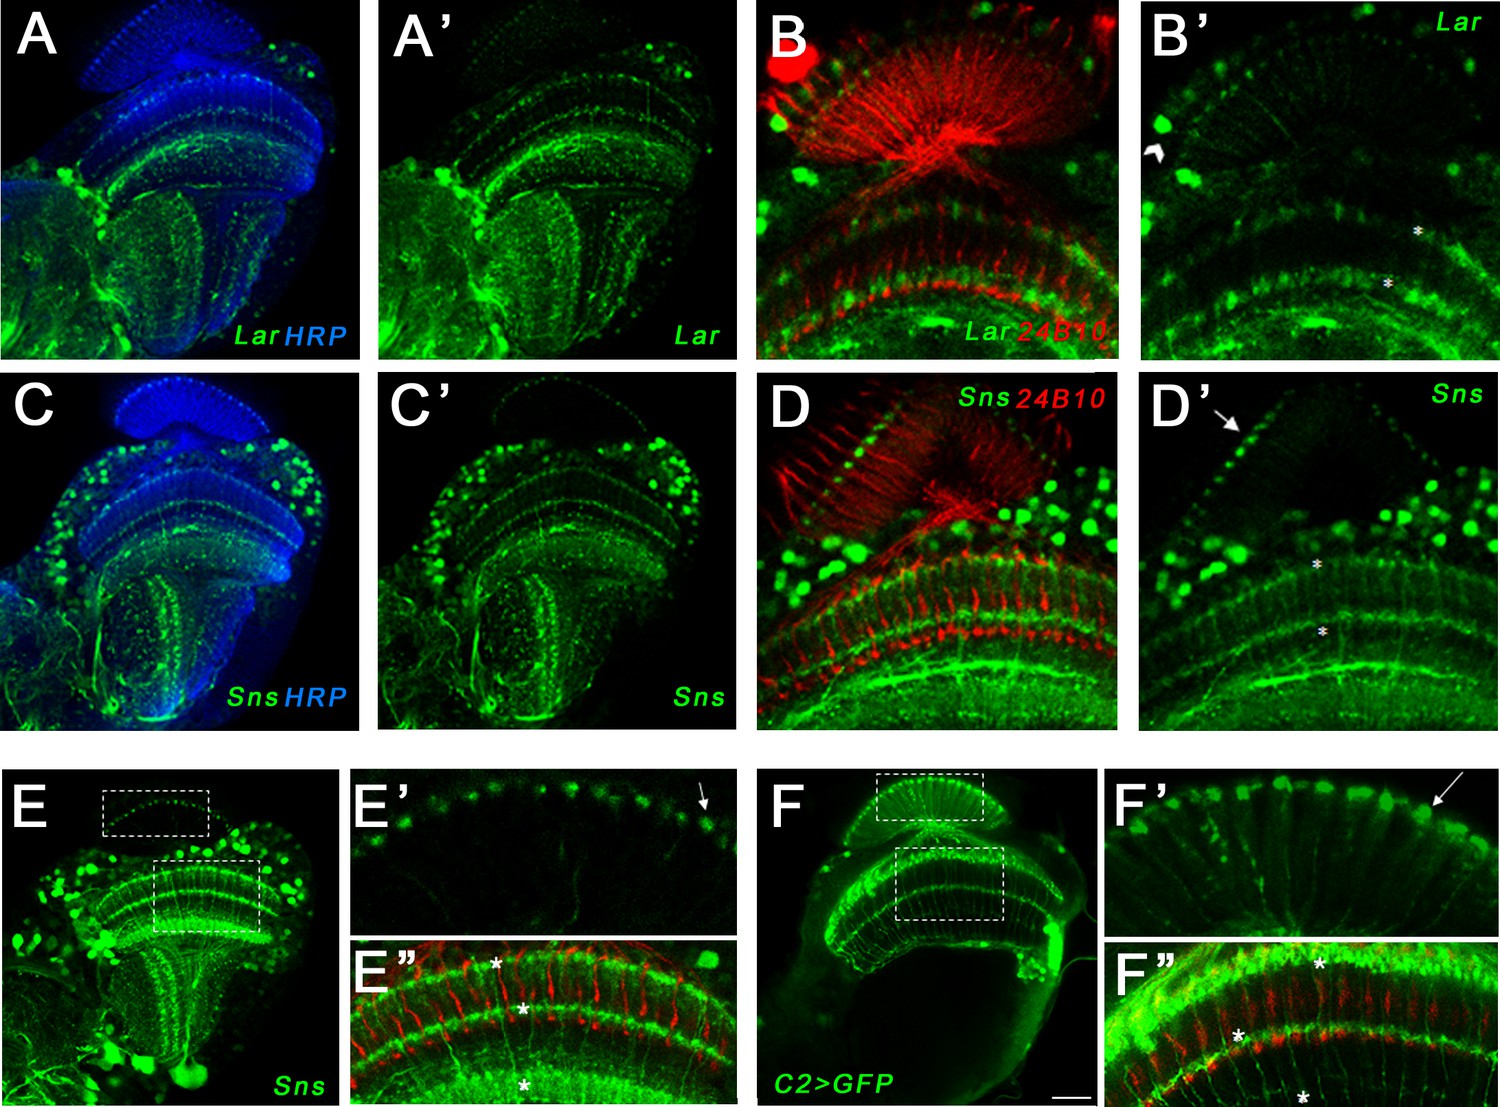
Confocal projections and single optical slices showing Lar>GFP and Sns>GFP expression in the adult OL. Brains were double-stained for GFP (green) and either anti-HRP (blue) or Chaoptin (24B10; red), which labels photoreceptor axons. (A, A’) Single optical slice showing Lar expression (green) in the adult fly OL. (B, B’) Single optical slice showing Lar>GFP expression in L1 Lamina neurons (B’, arrowhead) and in layers M1 and M5 (asterisks in B’) of the adult medulla. (C–D’) Single optical slices showing Sns>GFP expression (green) in the adult OL. Strong Sns>GFP expression is seen in layers M1 and M5 of the adult medulla (D’, asterisks). Sns expression is also seen in the same dot-like pattern at the top of the lamina neuropil as seen in the pupal OL (D’, arrow). Sns>GFP does not appear to colocalize with 24B10, suggesting that it is not in R7 or R8 photoreceptors. (E–E’’) Single optical slice showing Sns expression in the 72 hr after puparium formation (APF) OL. Entire OL is shown in (E). (E’) shows close-up of the lamina. Note the dot-like endings of Sns-expressing neurons in the lamina neuropil. These endings most closely resemble those of C2 neurons (Tuthill et al., 2013). (E’’) Sns reporter expression seen in M1, M5, and M10 layers of the medulla (asterisks), resembling C2 arborization pattern in the medulla (Tuthill et al., 2013). (F–F’’) Single optical slice showing the projection pattern of C2 neurons in the adult OL. A split-GAL4 driver (Tuthill et al., 2013) was crossed to UAS-GFP reporter to visualize the arborization pattern. The dot-like endings at the top of the lamina neuropil (F’, arrow) are similar to the dot-like endings seen with Sns in (E’). C2 neurons arborize in M1, M5, and M10 layers of the medulla (F’’, asterisks), similar to Sns (E’’). Scale bar, 20 µm.
Figure 7—figure supplement 2
Dendritic projections of Sns neurons in the adult optic lobe (OL), Lar>GFP expression in the 24 hr after puparium formation (APF) retina and LarMiMIC expression in L1 lamina neurons.
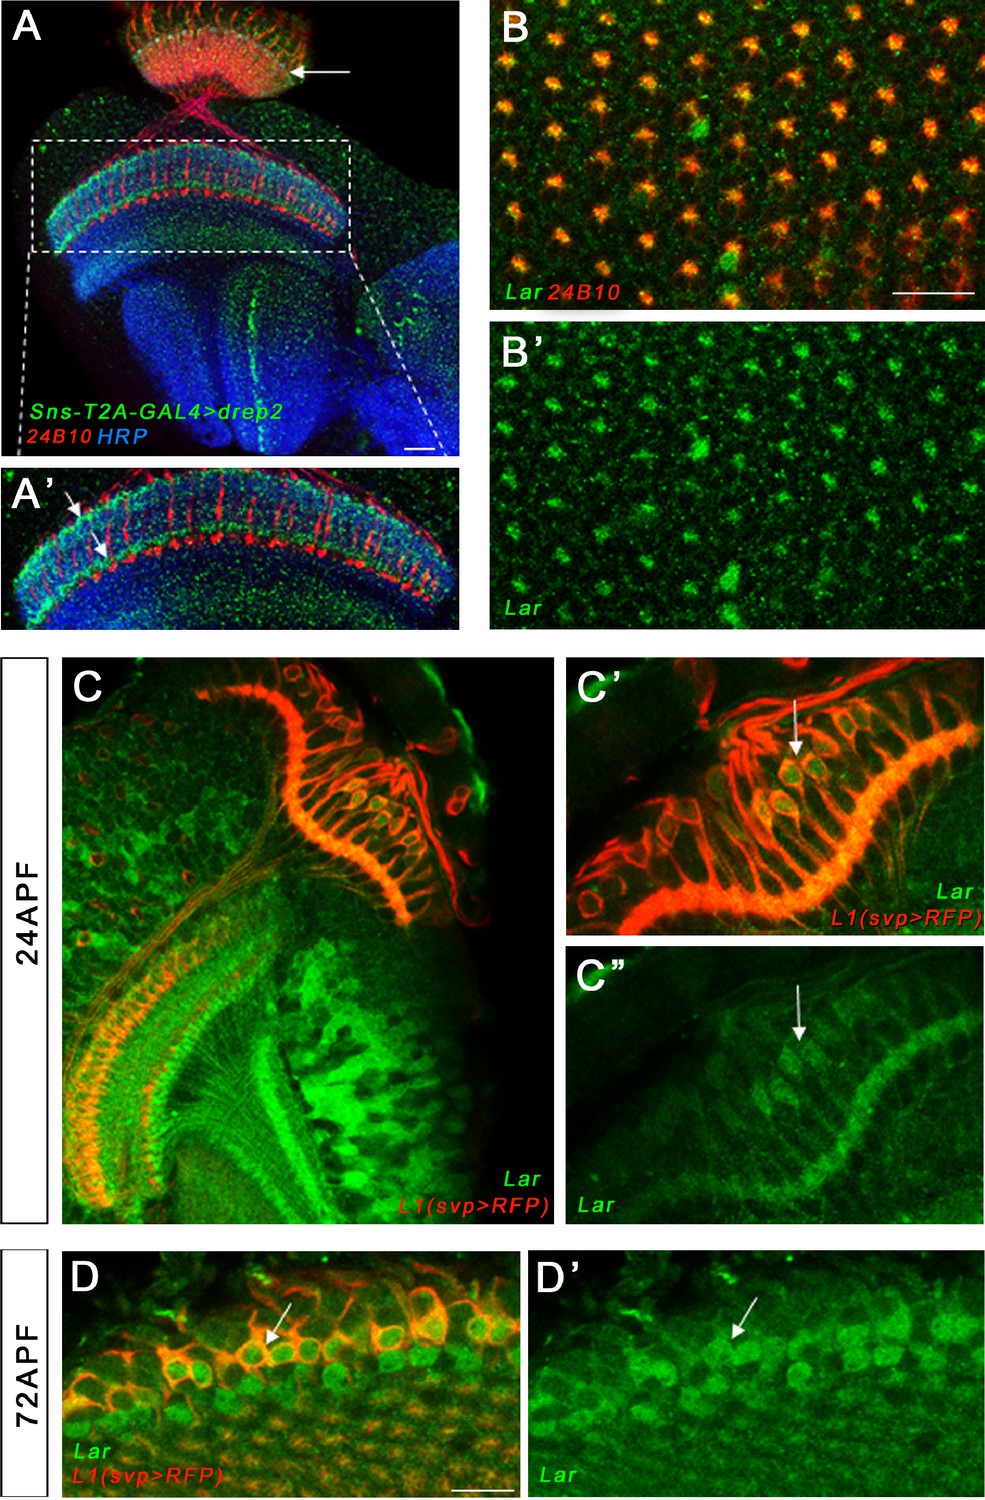
(A, A’) Single optical slice showing dendritic projections of Sns-expressing neurons visualized by Sns-GAL4>Drep2 (dendrite-specific marker, green), co-stained with 24B10 (red) and anti-HRP (blue). Specific dendritic projections can be seen in M1 and M5 layers of the medulla (A’, arrows) and at the top of the lamina neuropil (A, arrow). C2 is known to receive synapses in M1, M5, and the lamina. A single layer is seen in the lobula. (B, B’) Lar expression is seen in a top-down view of the 24 hr APF retina, co-stained with 24B10, (red). R7 and R8 photoreceptor cell bodies lie in the center of each ommatidium. Lar expression is seen in R7 and/or R8 cell bodies in the center of the ommatidia as well as in at least one outer photoreceptor (R1–R6). Single optical slice focused on the central R7/R8 photoreceptors is shown. (C–D’) LarMIMIC expression was visualized by GFP immunostaining. We used an L1 Lamina neuron-specific driver (svp-GAL4) and UAS-mCD8-RFP reporter to visualize L1 neurons in the pupal OL. LarMiMIC co-localized with RFP-expressing L1 lamina neurons in the 24 hr APF and 72 hr APF pupal lamina (C’–D’, arrows). Scale bar, 20 µm.
Figure 8 with 1 supplement
R7 photoreceptors have identical targeting defects in Lar mutants and Lar/sns transheterozygotes.
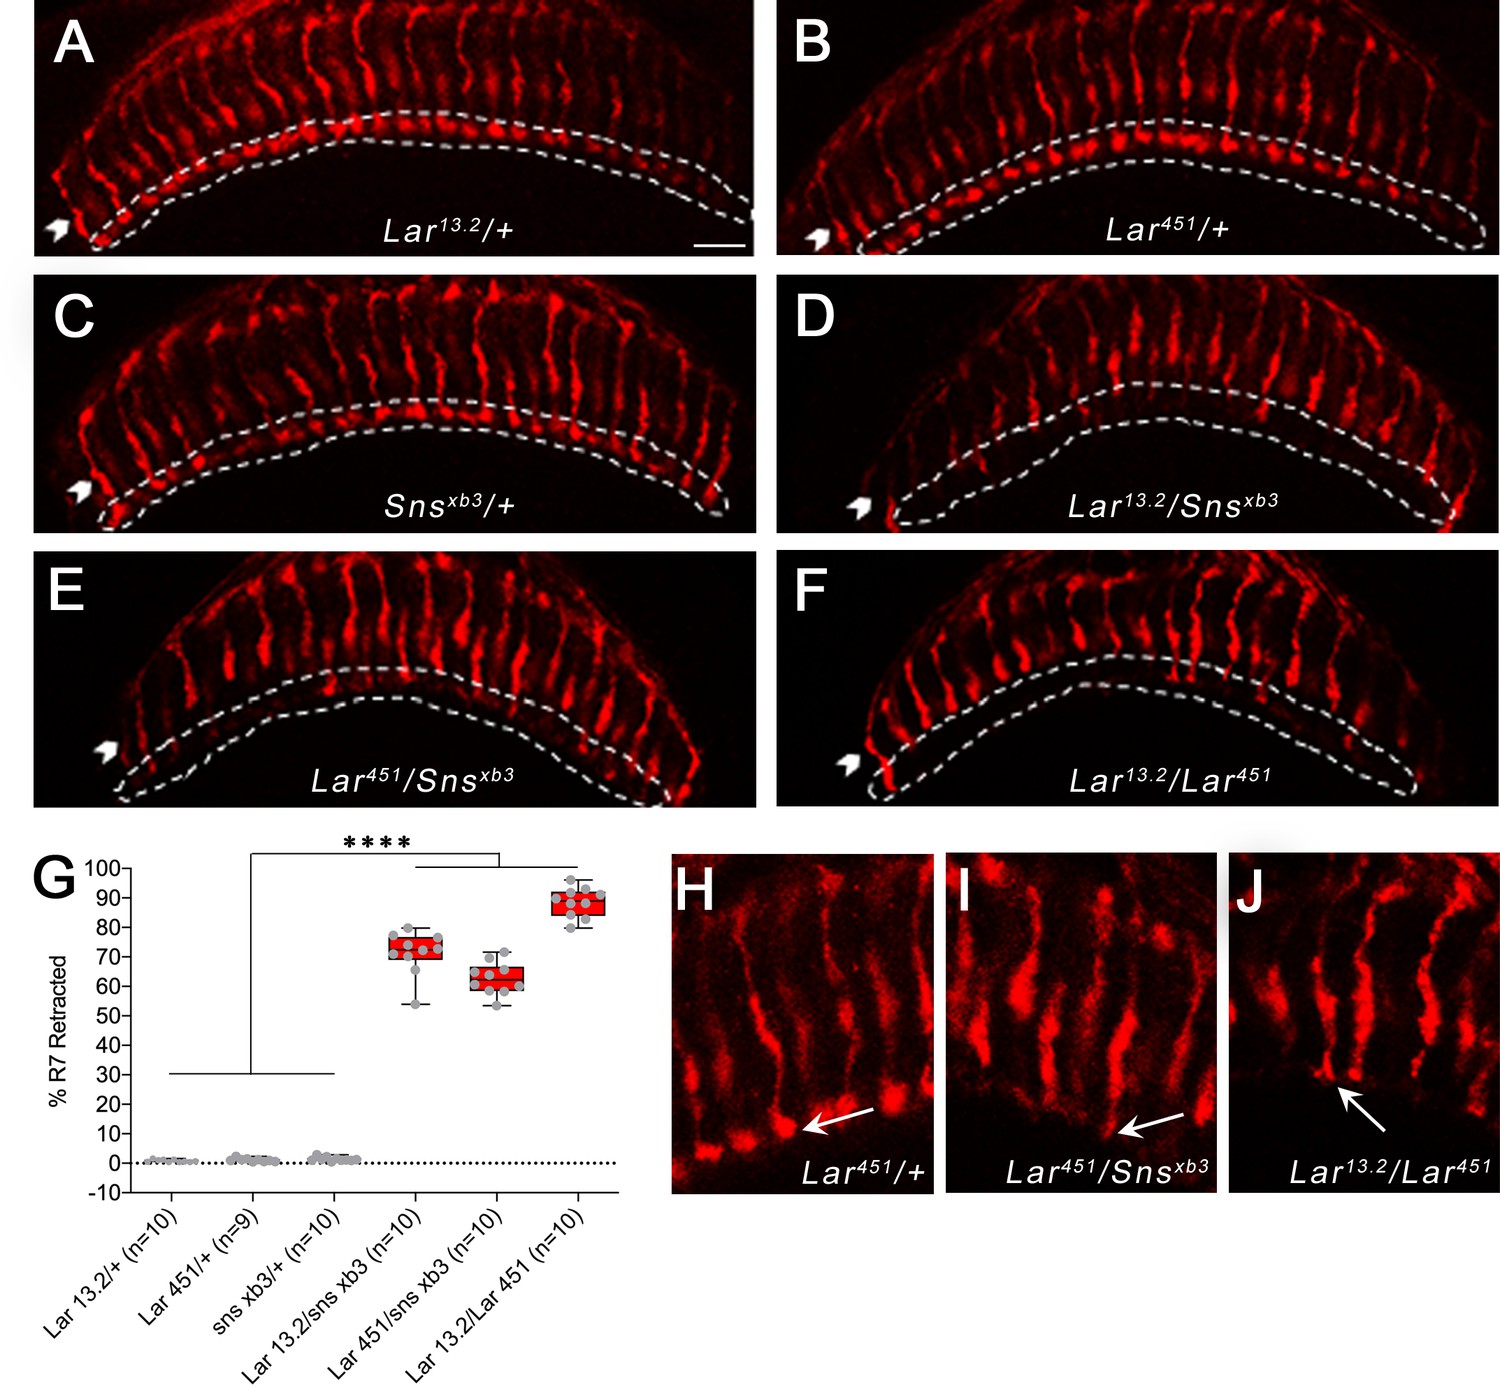
(A–F) Single optical slices of adult optic lobes (OLs) showing R7 and R8 photoreceptors labeled for Chaoptin (24B10, red). R7 photoreceptor axons end in the M6 layer of the medulla (outlined in white), while R8 axons end in M3 layer (arrowheads). (A–C) Heterozygote controls showing normal R7 targeting in the M6 layer. (D–F) Lar/sns transheterozygotes and Lar mutants, showing abnormal R7 targeting, with most R7 axons retracting to the M3 layer. (G) Quantification of R7 axon retractions in control and mutant animals. R7 axons were counted in at least 10 optical slices per OL. Each data point is the average of 10–12 optical slices per OL. The data were analyzed using one-way ANOVA followed by Tukey’s post-hoc correction. ****p<0.0001. (H–J) Single optical slices showing the morphology of R7 terminals in Lar451/+ control, Lar451/snsxb3 transheterozygotes, and Lar mutants. Control animals show normal rounded bouton-shaped R7 terminals (H, arrow). Some R7 terminals that do not retract and stay in the M6 layer have abnormal R7 terminal morphologies, with thin and spear-shaped terminals (I, J, arrows). Scale bar, 20 µm.
Figure 8—figure supplement 1

Abnormal R7 projection examples upon pan-neuronal Sns RNAi knockdown.
(A–D) Single optical slices of adult optic lobes (OLs) from four different animals showing R7 and R8 photoreceptors labeled for Chaoptin (24B10, red) upon neuronal Sns RNAi knockdown. A small number of R7 axon retractions are seen upon Sns RNAi knockdown (asterisks). Some R7 axons abnormally innervate neighboring R7 columns (arrows).
Tables
Key resources table
| Reagent type (species) or resource | Designation | Source or reference | Identifiers | Additional information |
|---|---|---|---|---|
| Genetic reagent (Drosophila melanogaster) | Canton S (CS) | Bloomington Drosophila Stock Center (BDSC) | BDSC #64349 | |
| Genetic reagent (D. melanogaster) | Tubulin-GAL4 | BDSC | BDSC #5138 | |
| Genetic reagent (D. melanogaster) | elavC155-GAL4 | BDSC | BDSC #458 | |
| Genetic reagent (D. melanogaster) | OK107-GAL4 | BDSC | BDSC #854 | |
| Genetic reagent (D. melanogaster) | UAS-2xEGFP | BDSC | BDSC #6874 | |
| Genetic reagent (D. melanogaster) | UAS-mCD8-GFP | BDSC | BDSC #32185 | |
| Genetic reagent (D. melanogaster) | snsMIMIC-MI03001 | BDSC | BDSC #35916 | |
| Genetic reagent (D. melanogaster) | larMIMIC-MI02154 | BDSC | BDSC #35972 | |
| Genetic reagent (D. melanogaster) | snsEY08142 | BDSC | BDSC #17434 | |
| Genetic reagent (D. melanogaster) | Sns-T2A-GAL4 | This paper | Lab of Dr. Kai Zinn | |
| Genetic reagent (D. melanogaster) | Lar-T2A-GAL4 | This paper | Lab of Dr. Kai Zinn | |
| Genetic reagent (D. melanogaster) | UAS-sns-RNAi | Vienna Drosophila Resource Center (VDRC) | VDRC #109442 | |
| Genetic reagent (D. melanogaster) | UAS-sns-RNAi | VDRC | VDRC #877 | |
| Genetic reagent (D. melanogaster) | UAS-lar-RNAi | Developmental Studies Hybridoma Bank (DSHB) | DSHB #40938 | |
| Genetic reagent (D. melanogaster) | UAS-lar-RNAi | DSHB | DSHB #34965 | |
| Genetic reagent (D. melanogaster) | UAS-kirre-RNAi | DSHB | DSHB #67340 | |
| Genetic reagent (D. melanogaster) | snsxb3 | PMID #10859168 | Gift of Susan Abmyer | |
| Genetic reagent (D. melanogaster) | snsDf | DSHB | DSHB #23165 | |
| Genetic reagent (D. melanogaster) | lar13.2 | PMID #8598047 | DSHB #8774 | |
| Genetic reagent (D. melanogaster) | lar451 | PMID #11683994 | ||
| Genetic reagent (D. melanogaster) | lar2127 | PMID# 11683993 | ||
| Antibody | Rabbit anti-GFP (rabbit polyclonal) | Thermo Fisher | #A11122 | (1:500) |
| Antibody | Rabbit anti-RFP (rabbit polyclonal) | Rockland Inc. | #600-401-379 | (1:500) |
| Antibody | Mouse anti-Dlg (mouse monoclonal) | DSHB | #4F3 | (1:100) |
| Antibody | Mouse anti-Bruchpilot (mouse monoclonal) | DSHB | #nc82 | (1:10) |
| Antibody | Mouse anti-Chaoptin (mouse monoclonal) | DSHB | #24B10 | (1:10) |
| Antibody | Mouse anti-FasII (mouse monoclonal) | DSHB | #1D4 | (1:3) |
| Antibody | Mouse anti-Trio (mouse monoclonal) | DSHB | #9.4A | (1:20) |
| Antibody | Mouse anti-Lar (mouse monoclonal) | DSHB | #9D8 | (1:3) |
| Antibody | Mouse anti-Repo (mouse monoclonal) | DSHB | #8D12 | (1:10) |
| Antibody | Mouse anti-Evenskipped (mouse monoclonal) | DSHB | #3C10 | (1:10) |
| Antibody | Mouse anti-human IgG (Fc specific) (mouse monoclonal) | Bio-Rad | #MCA647G | (1:200) |
| Antibody | Rabbit anti-alkaline phosphatase (AP) (rabbit polyclonal) | AbD Serotec | (1:1000) | |
| Antibody | Mouse anti-AP:biotin (mouse monoclonal) | eBioscience, Thermo Fisher | #13-9870-82 | (1:200) |
| Antibody | Goat anti-HRP-Alexa 488 (goat polyclonal) | Jackson ImmunoResearch | #123-545-021 | (1:50) |
| Antibody | Goat anti-HRP-Alexa 594 (goat polyclonal) | Jackson ImmunoResearch | #123-585-021 | (1:50) |
| Antibody | Goat anti-mouse-Alexa 488 (goat polyclonal) | Thermo Fisher | #A110029 | (1:500) |
| Antibody | Goat anti-mouse-Alexa 568 (goat polyclonal) | Thermo Fisher | #A11031 | (1:500) |
| Antibody | Goat anti-rabbit-Alexa 488 (goat polyclonal) | Thermo Fisher | #A11008 | (1:500) |
| Antibody | Goat anti-rabbit-Alexa 568 (goat polyclonal) | Thermo Fisher | #A11036 | (1:500) |
| Antibody | Goat anti-mouse-AP (goat polyclonal) | Jackson ImmunoResearch | #115-055-003 | (1:200) |
| Peptide, recombinant protein | Streptavidin:HRP | Thermo Fisher | #N100 | (1:500) |
| Commercial assay or kit | Ultra-TMB | Thermo Fisher | #34028 | |
| Commercial assay or kit | BluePhos | Seracare | #5120-0059 |
Additional files
Download links
A two-part list of links to download the article, or parts of the article, in various formats.
Downloads (link to download the article as PDF)
Open citations (links to open the citations from this article in various online reference manager services)
Cite this article (links to download the citations from this article in formats compatible with various reference manager tools)
Sticks and Stones, a conserved cell surface ligand for the Type IIa RPTP Lar, regulates neural circuit wiring in Drosophila
eLife 11:e71469.
https://doi.org/10.7554/eLife.71469


