Unsupervised detection of fragment length signatures of circulating tumor DNA using non-negative matrix factorization
- Department of Health Technology, Section of Bioinformatics, Technical University of Denmark, Denmark
- Department of Molecular Medicine, Aarhus University, Denmark
- Department of Clinical Medicine, Aarhus University, Denmark
- Department of Medical Epidemiology and Biostatistics, Karolinska Institute, Sweden
- Cancer Research Institute Gent (CRIG), Ghent University, Belgium
- Department of Human Structure and Repair, Ghent University, Belgium
- Department of Urology, Regional Hospital of West Jutland, Denmark
- Department of Urology, Aarhus University Hospital, Denmark
- Bioinformatics Research Centre, Aarhus University, Denmark
Figures
Figure 1

Discovering fragment length signatures using non-negative matrix factorization.
The cell-free DNA (cfDNA) pool contains a mixture of fragments from different sources such as tumor cells and background (mainly cells of hematopoietic origin). After performing paired-end sequencing of cfDNA, we estimate fragment length histograms for each sample by aligning reads to the reference genome. We next generate a matrix with fragment length frequencies such that rows and columns represent samples and fragment lengths, respectively. After normalizing the rows of this matrix, we then factorize it into two non-negative matrices: (1) The signature matrix is aligned with columns and expresses the preference of each cfDNA source for different fragment lengths and (2) the weight matrix, which is aligned with rows, and contains the estimated contributions of each source to each sample.
Figure 2 with 7 supplements

Non-negativematrix factorization (NMF) on shallow whole-genome sequencing (sWGS) and deep targeted sequencing of cell-freeDNA (cfDNA) from prostate cancer patients.
(a) sWGS fragment length histograms for 86 prostate cancer patients; colors reflect ctDNA fractions estimated from driver variant allele fractions obtained from targeted sequencing performed on the same samples. (b) Fragment length signatures inferred using NMF with two components on the sWGS dataset. (c) Lengths of fragments containing a driver mutation (red dots), lengths of fragments overlapping the mutated position but not containing the mutation (green line) and tumor fragment length signature estimated by NMF (blue line). (d) ctDNA fractions estimated using driver allele frequencies from targeted data versus weights of the second NMF component estimated on sWGS data (signature#2 in panel b). (e) ctDNA fractions estimated using driver allele frequencies from targeted data versus weights of the second NMF component estimated on the same targeted data. (f) Correlation of tumor signature weights estimated using NMF and ichorCNA with ctDNA fractions for different levels of downsampling of the sWGS data.
Figure 2—figure supplement 1
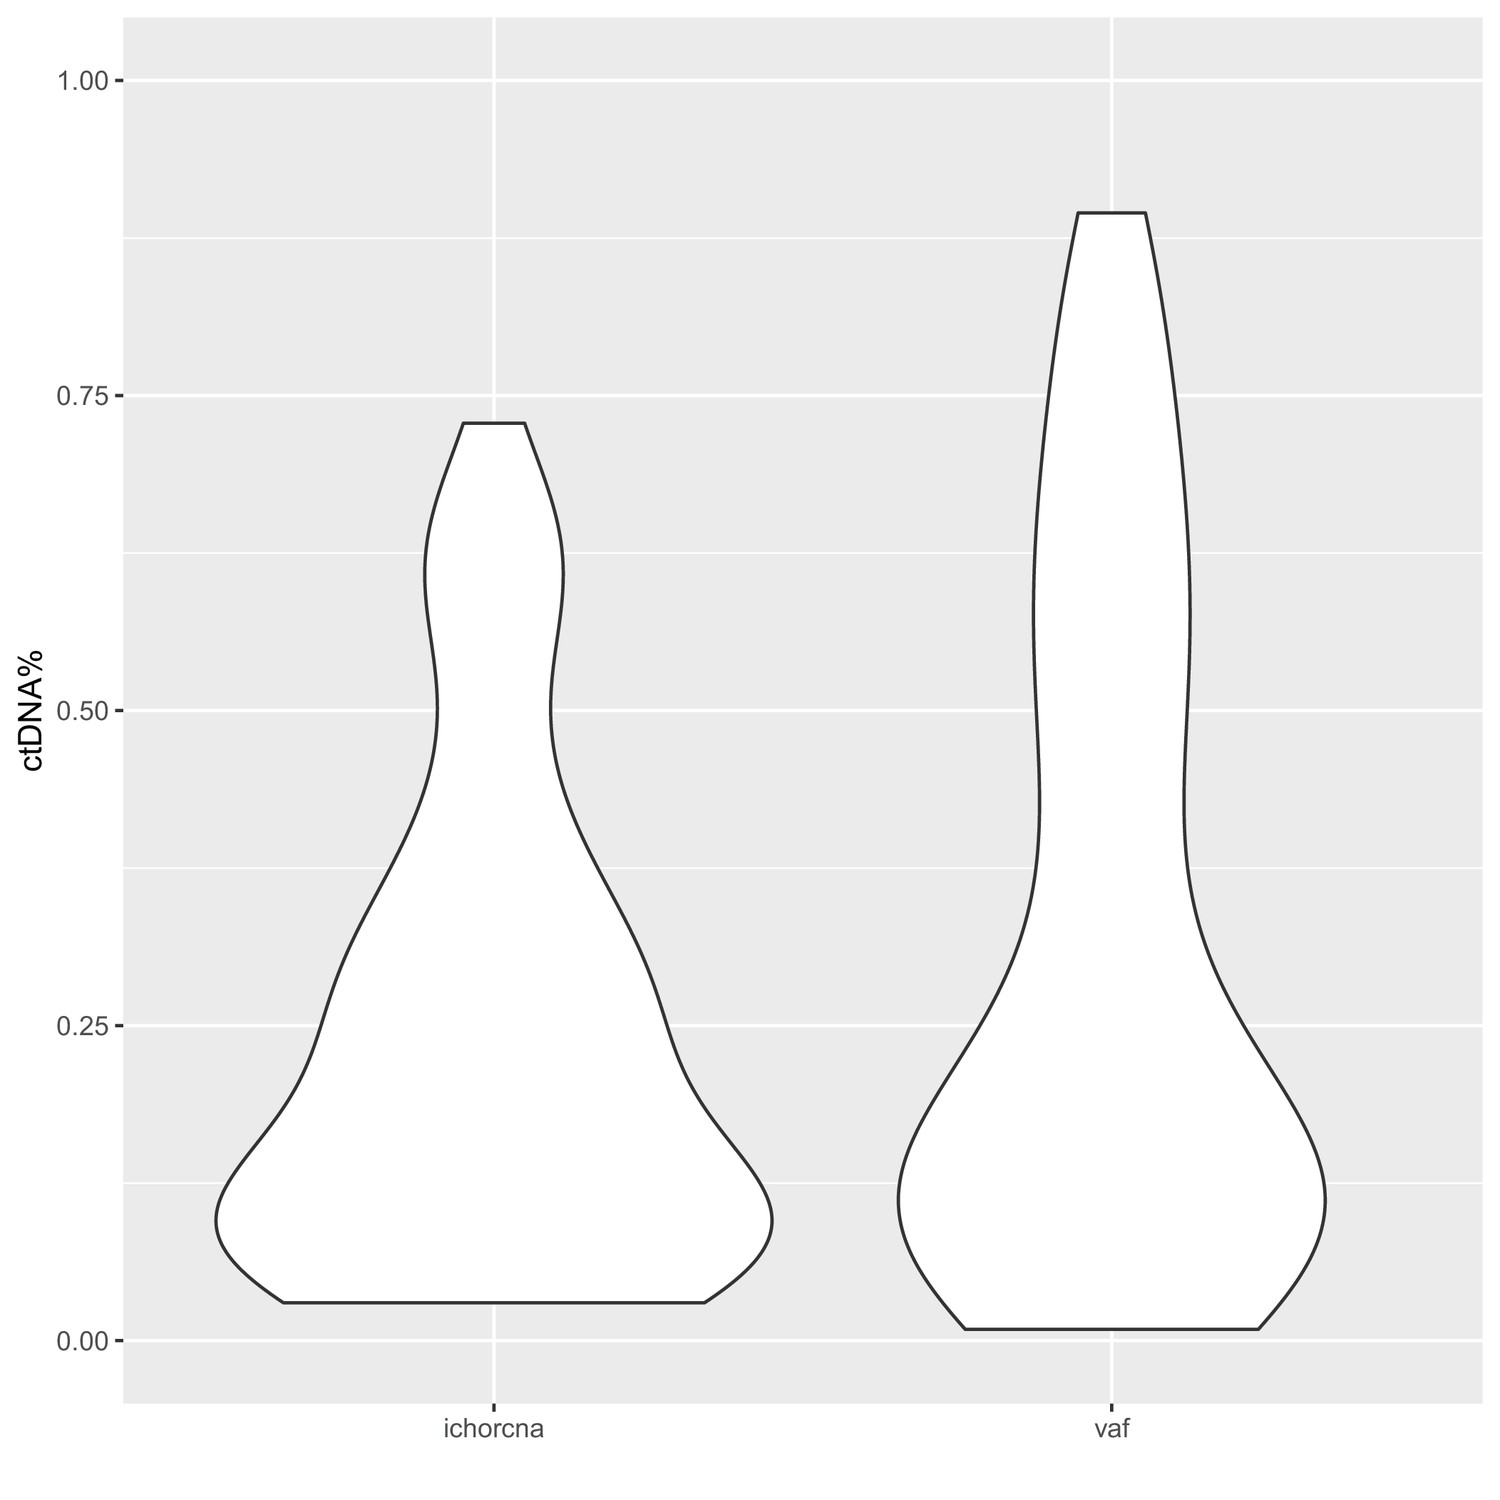
Distribution of sample ctDNA% in the metastatic castration-resistant prostate cancer (mCRPC) cohort.
Circulating tumor DNA (ctDNA) fractions were determined either based on copy-number variants (‘ichorcna’) or using variant allele fractions (‘vaf’) of putative driver variants identified using deep, targeted sequencing.
Figure 2—figure supplement 2
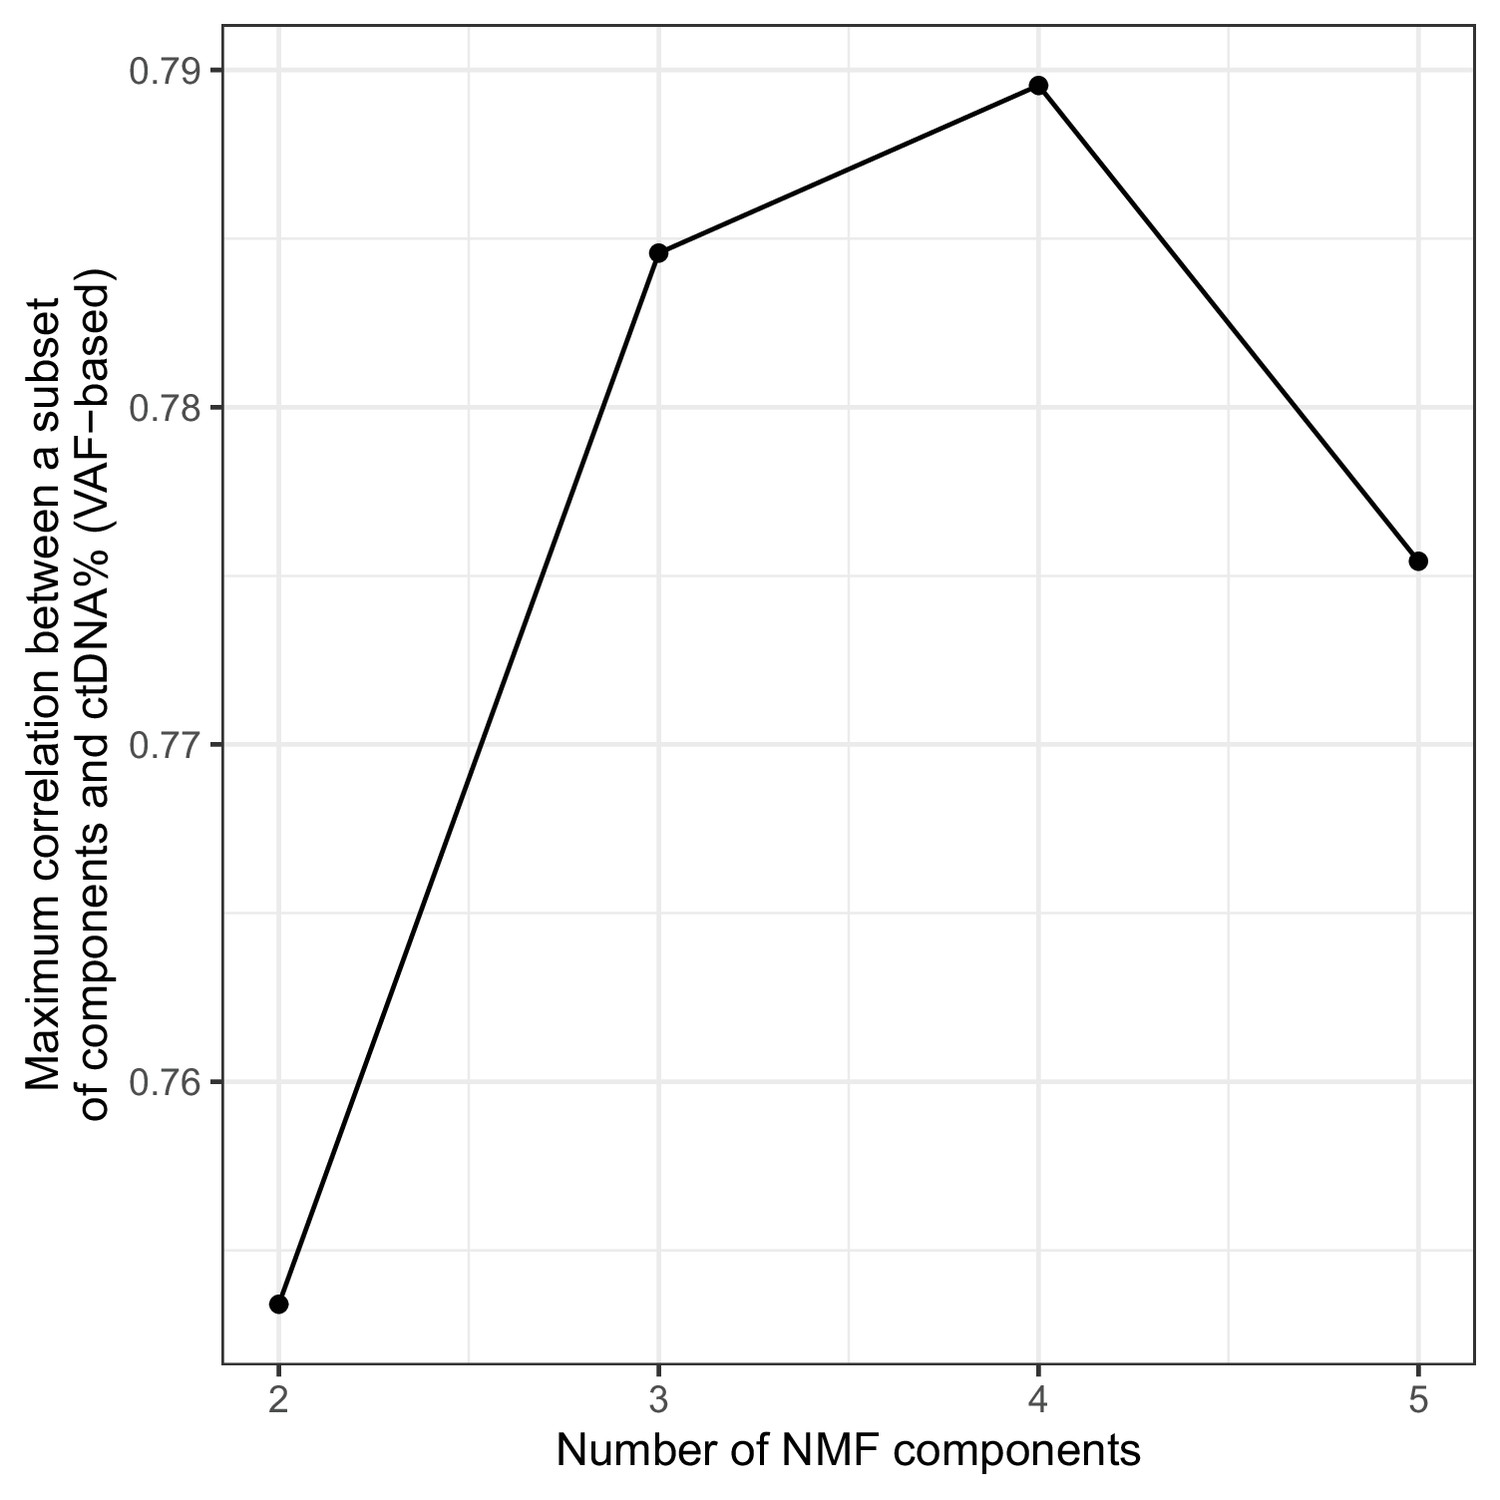
Optimal number of non-negative matrix factorization (NMF) components on sWGS data from the metastatic castration-resistant prostate cancer (mCRPC) cohort.
NMF was run with different numbers of components (x-axis) and for each fitted model, the maximum correlation between the summed weights of any subset of components and the ctDNA% (VAF-based) obtained.
Figure 2—figure supplement 3
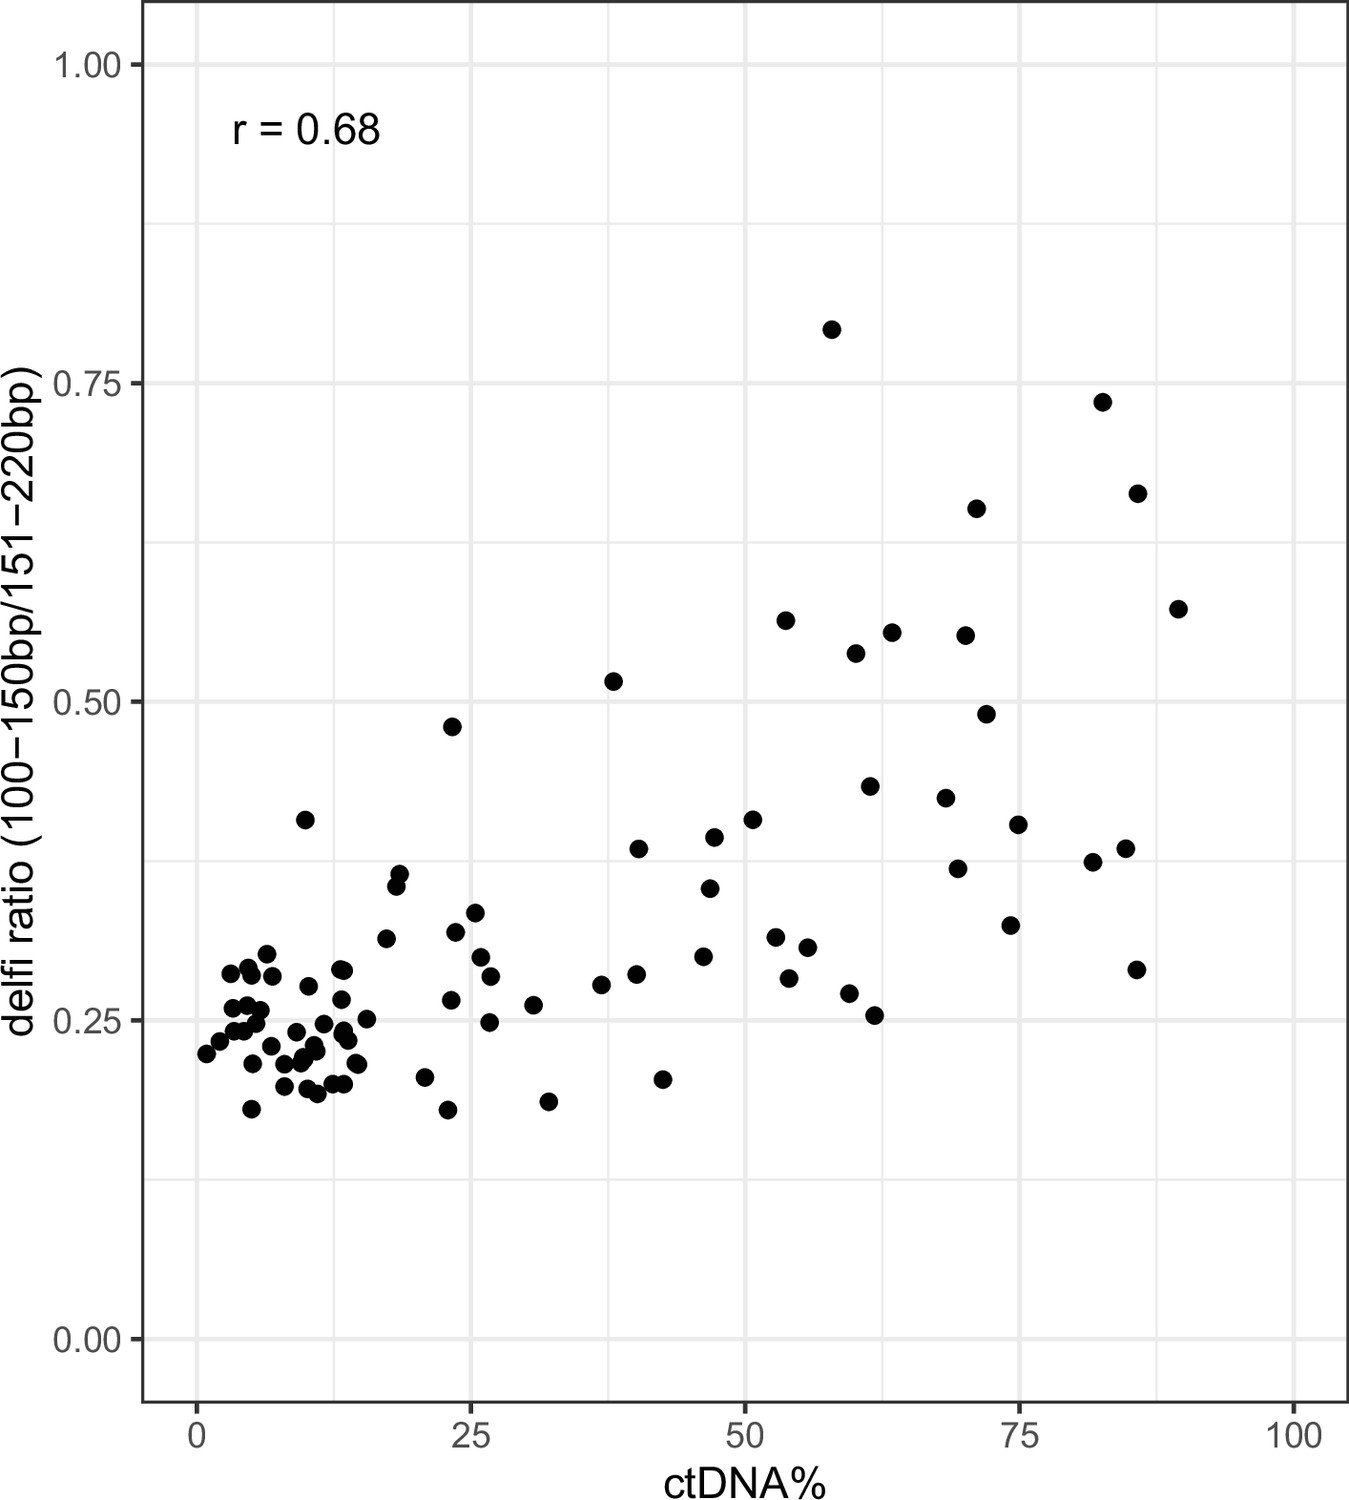
Ratio of short (100–150 bp) to long (151–220 bp) fragments vs ctDNA% (VAF-based) on shallow whole-genome sequencing (sWGS) data from the metastatic castration-resistant prostate cancer (mCRPC) cohort.
Figure 2—figure supplement 4
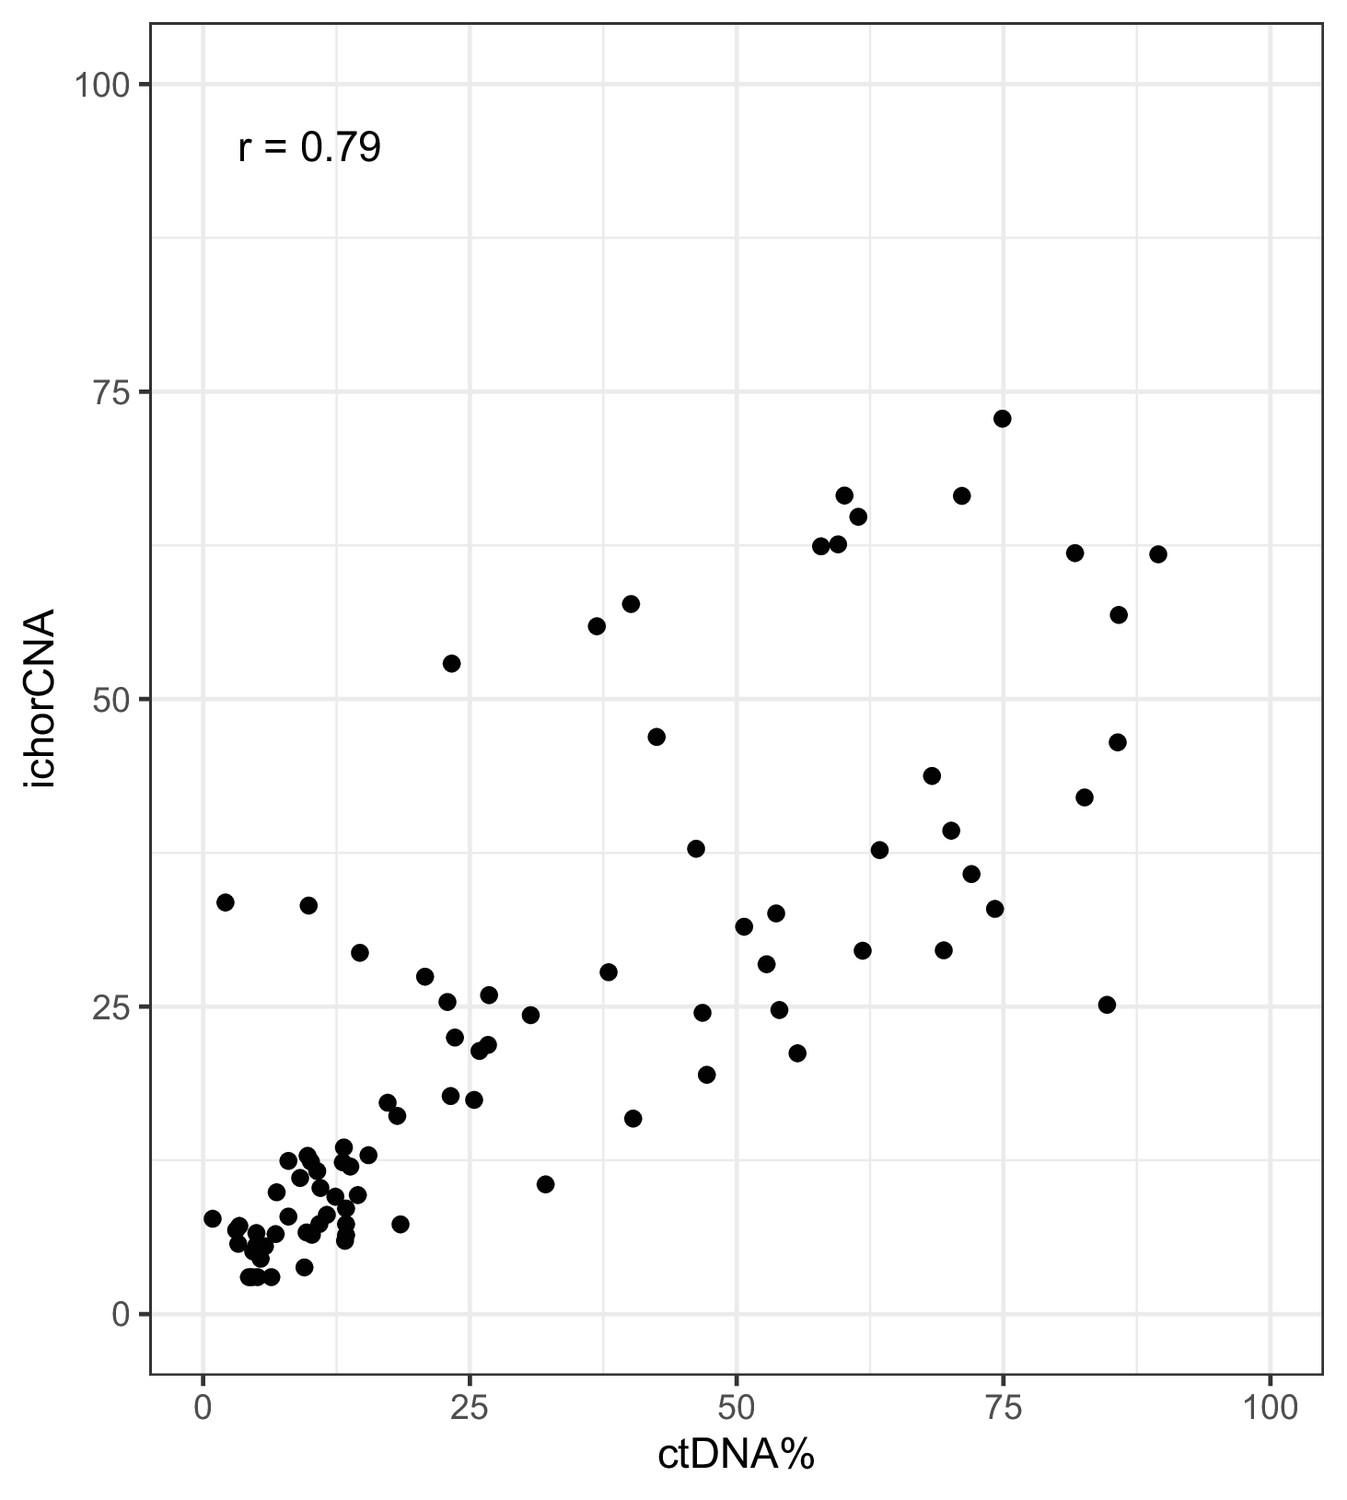
ichorCNA ctDNA% estimates vs ctDNA% (VAF-based) on shallow whole-genome sequencing (sWGS) data from the metastatic castration-resistant prostate cancer (mCRPC) cohort.
Figure 2—figure supplement 5
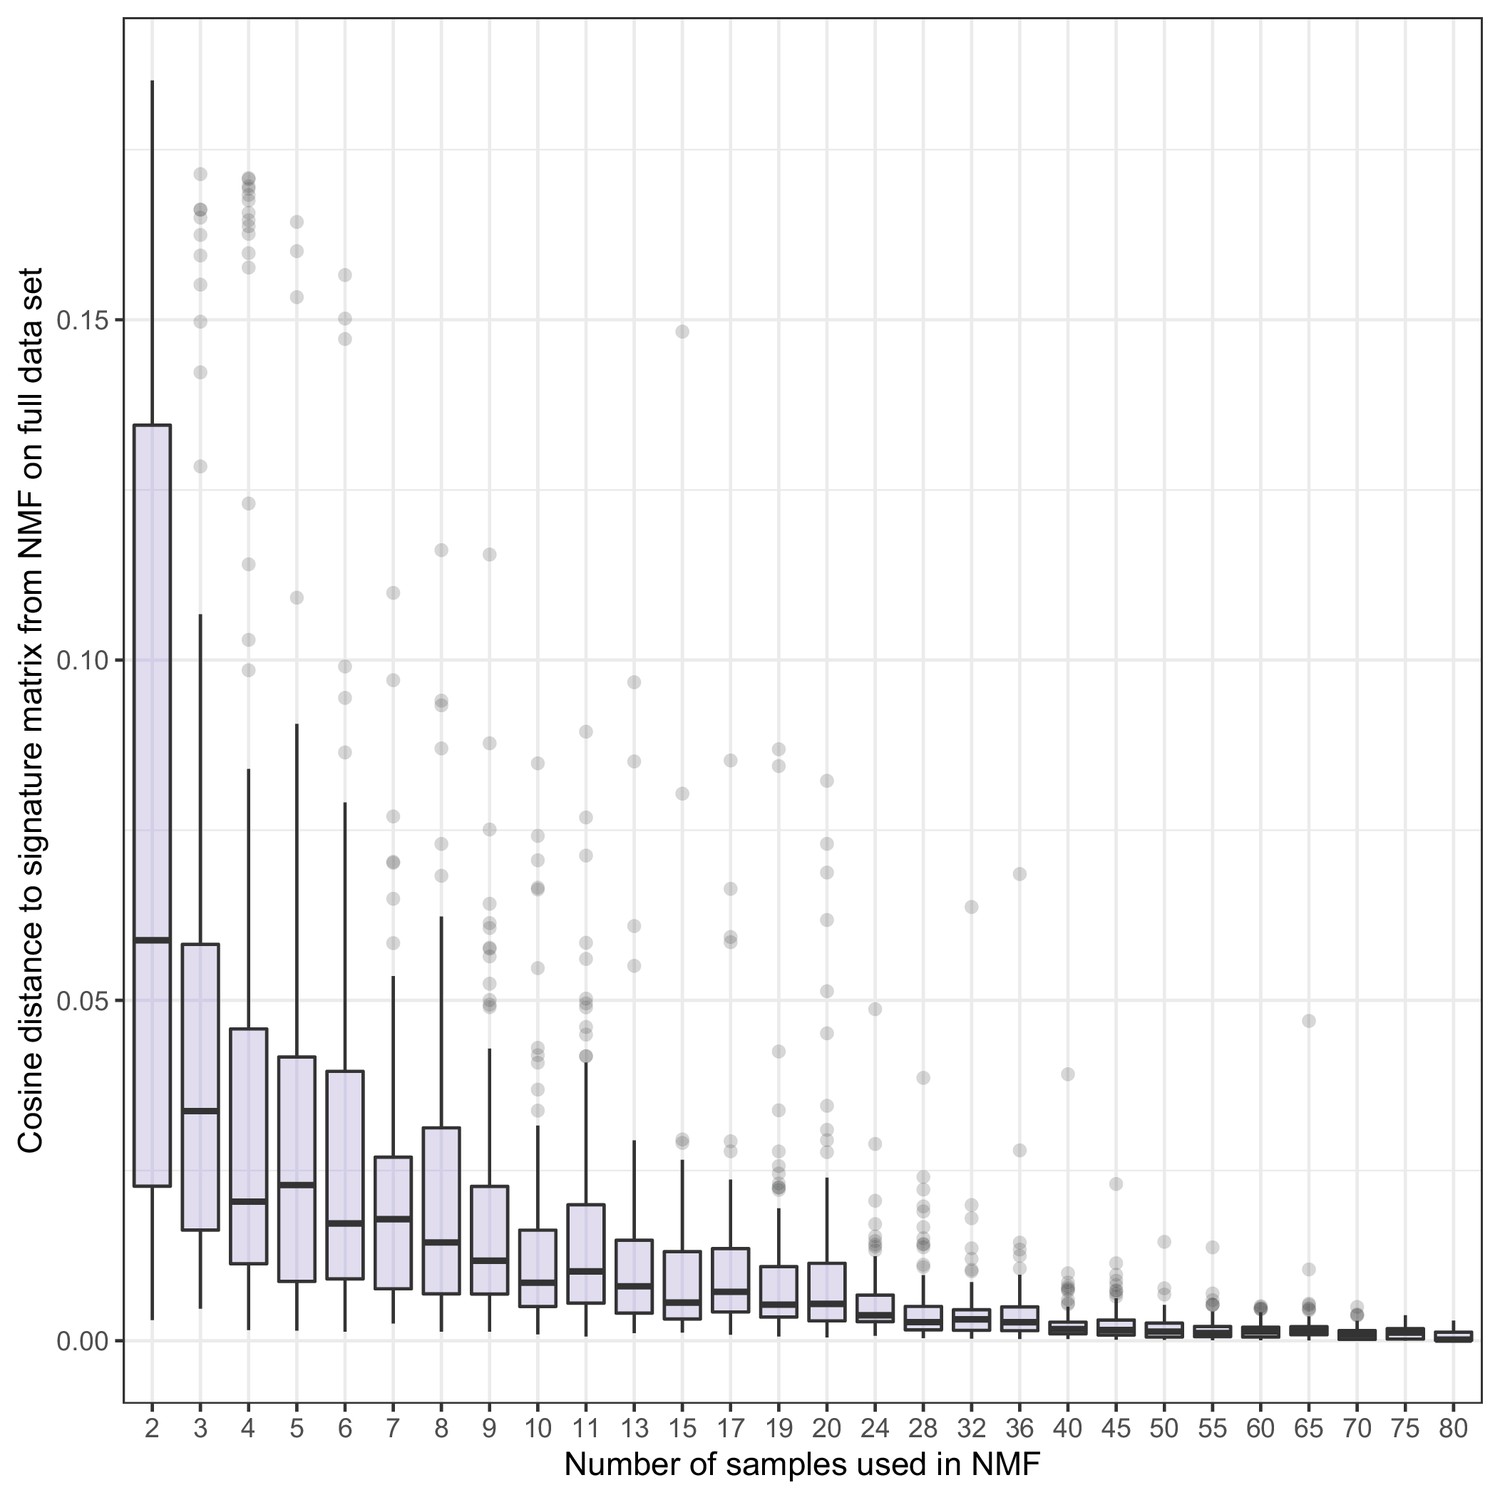
Stability of NMF fragment length signatures.
Non-negative matrix factorization (NMF) signatures were estimated for random subsets of samples of different sizes on the shallow whole-genome sequencing (sWGS) data from the metastatic castration-resistant prostate cancer (mCRPC) cohort. Boxplots show the distribution of maximum cosine similarities between signatures estimated on the reduced datasets and those estimated using the full dataset. For each number of samples, we conducted 100 replicates.
Figure 2—figure supplement 6
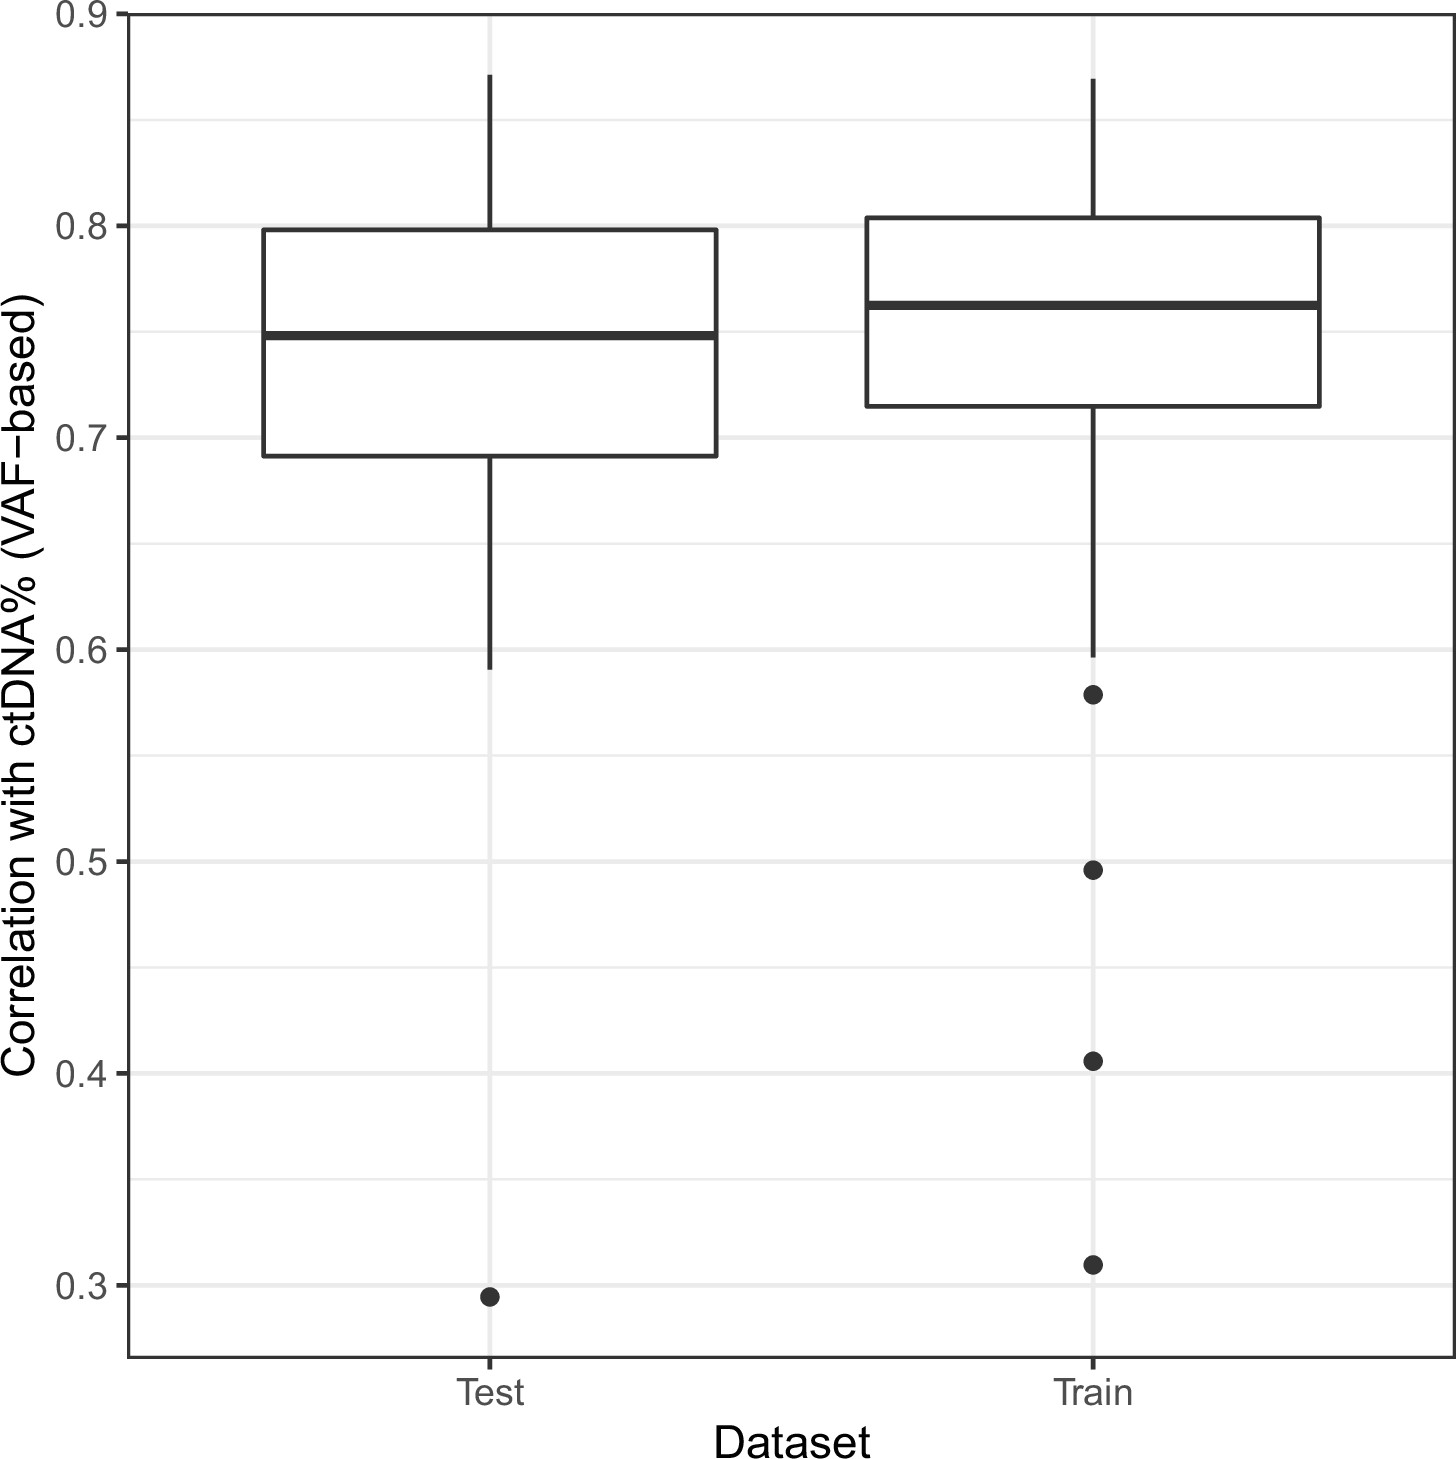
Correlation of non-negative matrix factorization (NMF) tumor signature weights with ctDNA% on hold-out data.
The shallow whole-genome sequencing (sWGS) dataset from the mCRPC cohort was randomly split into halves multiple times. For each partitioning, NMF trained on one half of the data (‘Train’) was used to predict signature weights on the other half (‘Test’). Boxplots show the correlations between signature weights and ctDNA% (VAF-based).
Figure 2—figure supplement 7
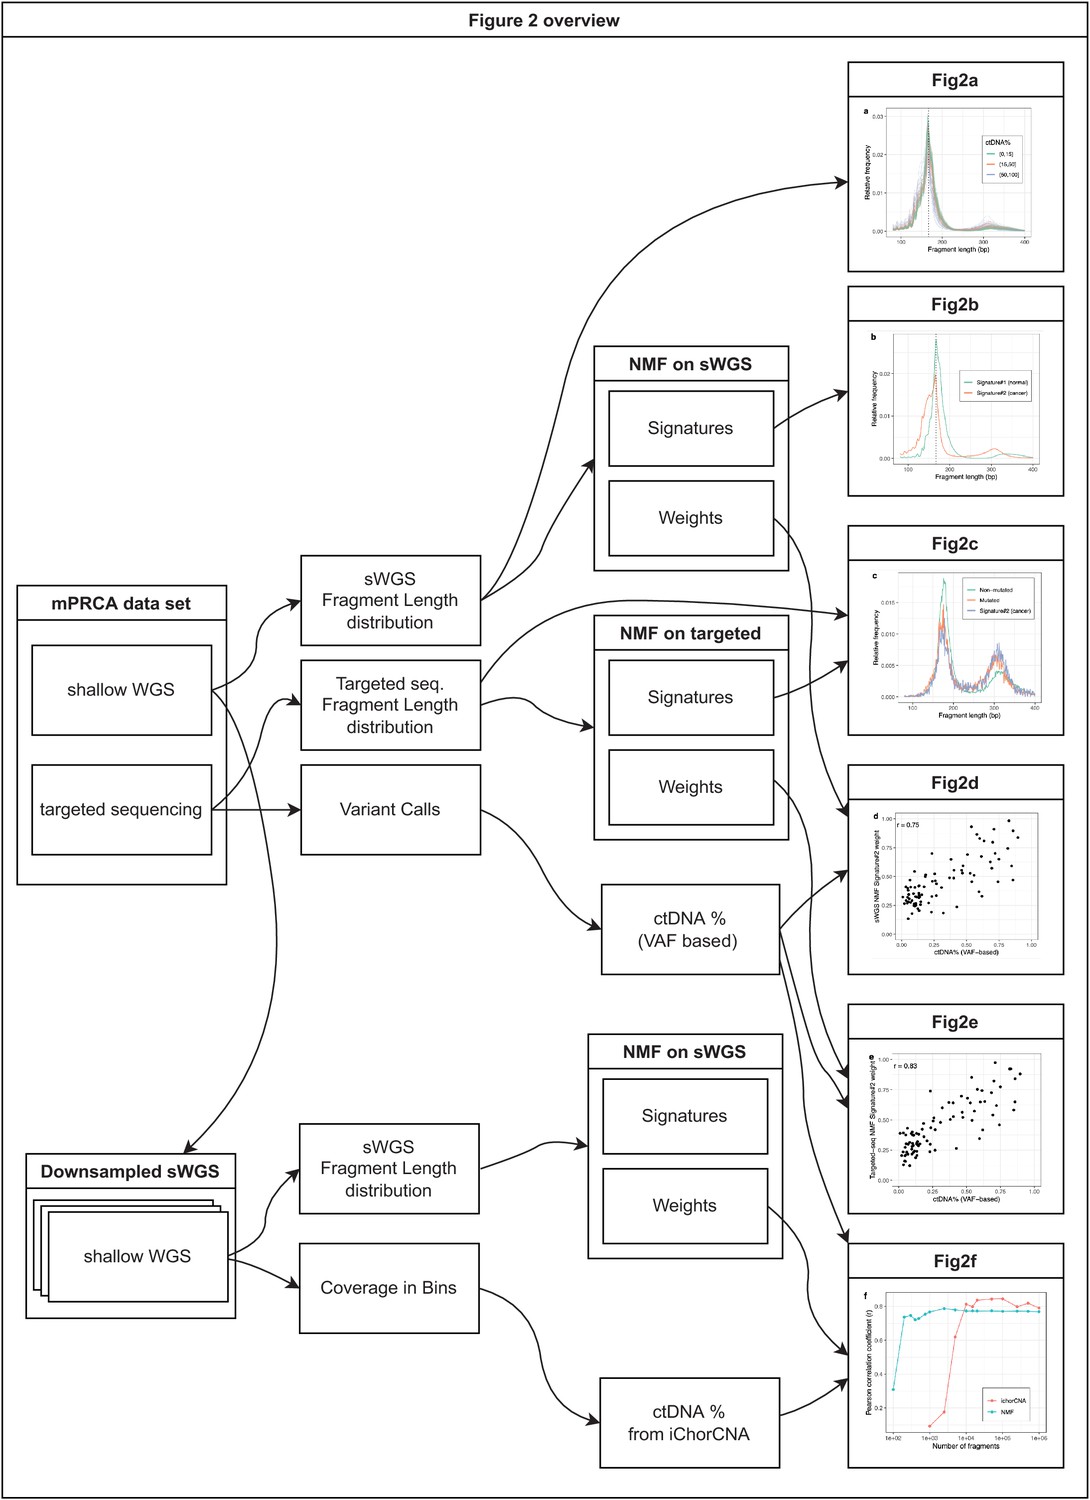
Overview of the analyses on metastatic castration-resistant prostate cancer (mCRPC) data presented in Figure 2.
The figure shows which datasets and analyses were used to produce each of the 6 panels in Figure 2.
Figure 3 with 5 supplements

Non-negative matrix factorization (NMF) on cell-free DNA (cfDNA) shallow whole-genome sequencing (sWGS) from the DELFI study.
(a) sWGS fragment length histograms for the 533 DELFI samples; colors indicate case-control status of the sample. (b) Fragment length signatures inferred using NMF with two components on the sWGS dataset. (c) AUCs obtained when discriminating cases versus controls using a linear Support Vector Machine (SVM) on the sample component weights across different numbers of components in the NMF model. Boxplots are based on repeating the Cross Validation 50 times. (d) Chromatin state fragment length signatures estimated using fragment length histograms from 250 kb bins along the genome aggregated across all control samples. (e) Ratio of short (100–150 bp) to long (151–220 bp) fragments (‘DELFI ratio’) or weight of the first NMF component (signature#1 in panel d) versus ENCODE ATACseq from a Lymphoblastoid cell-line for 250 kb genomic bins. (f) AUCs obtained when discriminating cases versus controls using a linear SVM on ‘DELFI ratio’ or weight of the first NMF components from panel d (red) or panel b (blue) inferred in bins along the genome for different bin sizes.
Figure 3—figure supplement 1
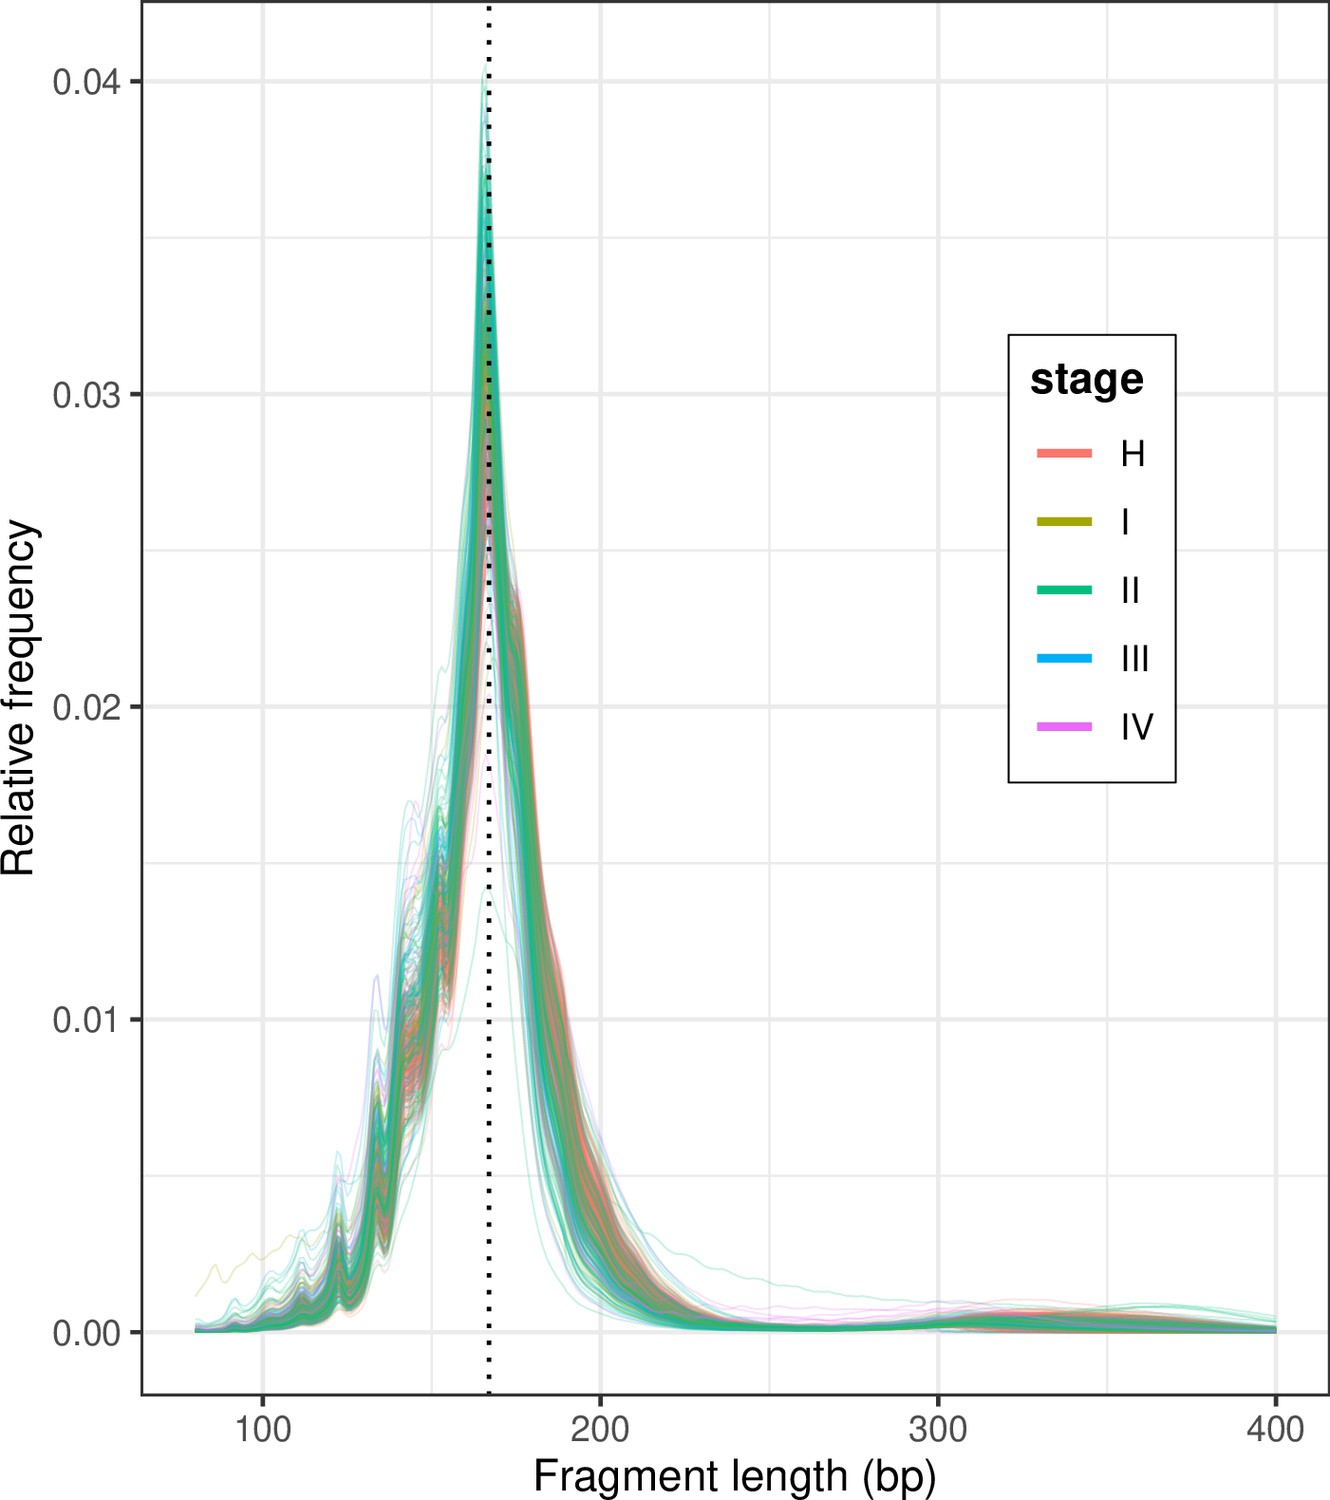
Shallow whole-genome sequencing (sWGS) fragment length histograms for the 533 DELFI samples stratified by stage; ‘H’ indicates healthy controls.
Figure 3—figure supplement 2
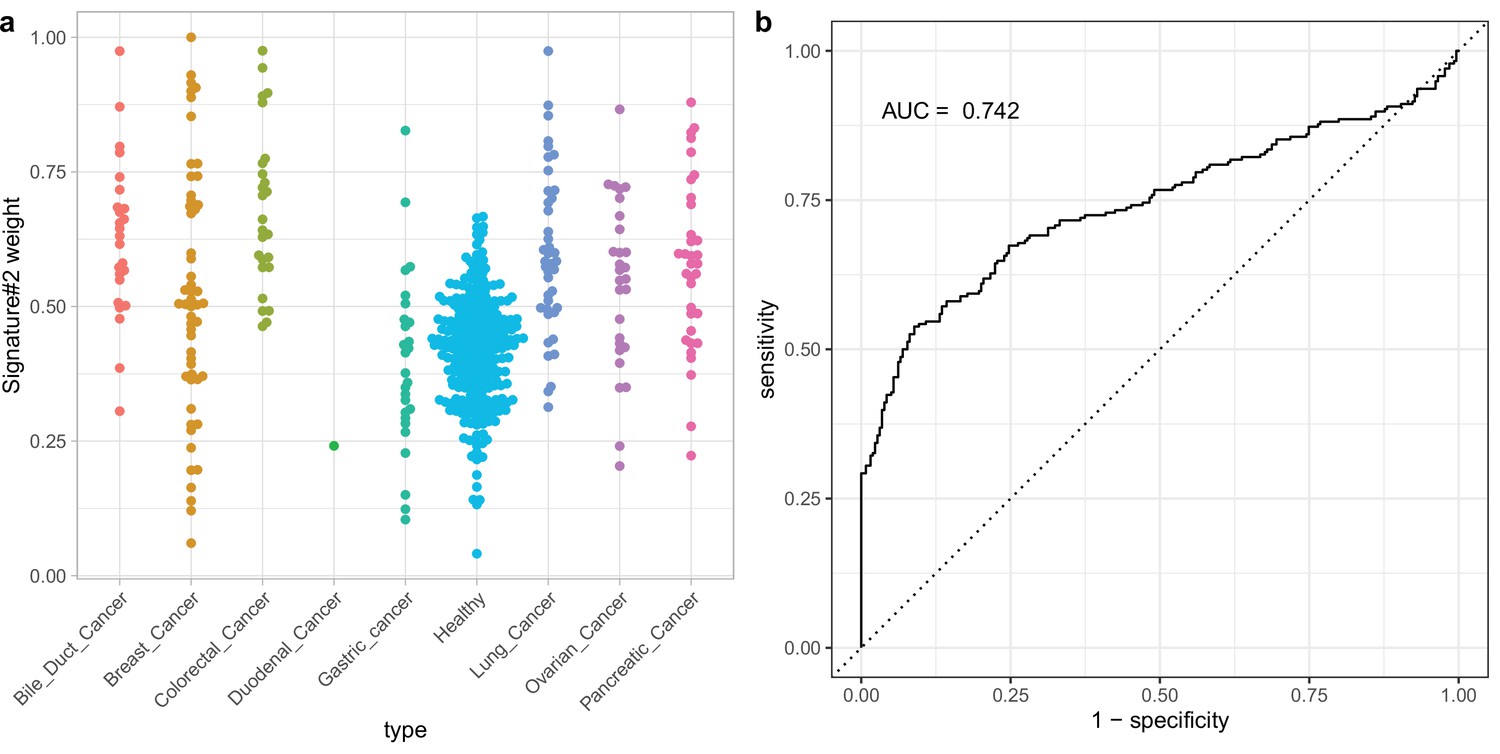
Using non-negative matrix factorization (NMF) with two fragment length signatures for classification on DELFI data stratified by cancer type.
(a) The distribution of Signature #1 weights for different cancer types. (b) ROC curve for cancer vs control classification using Signature #1.
Figure 3—figure supplement 3
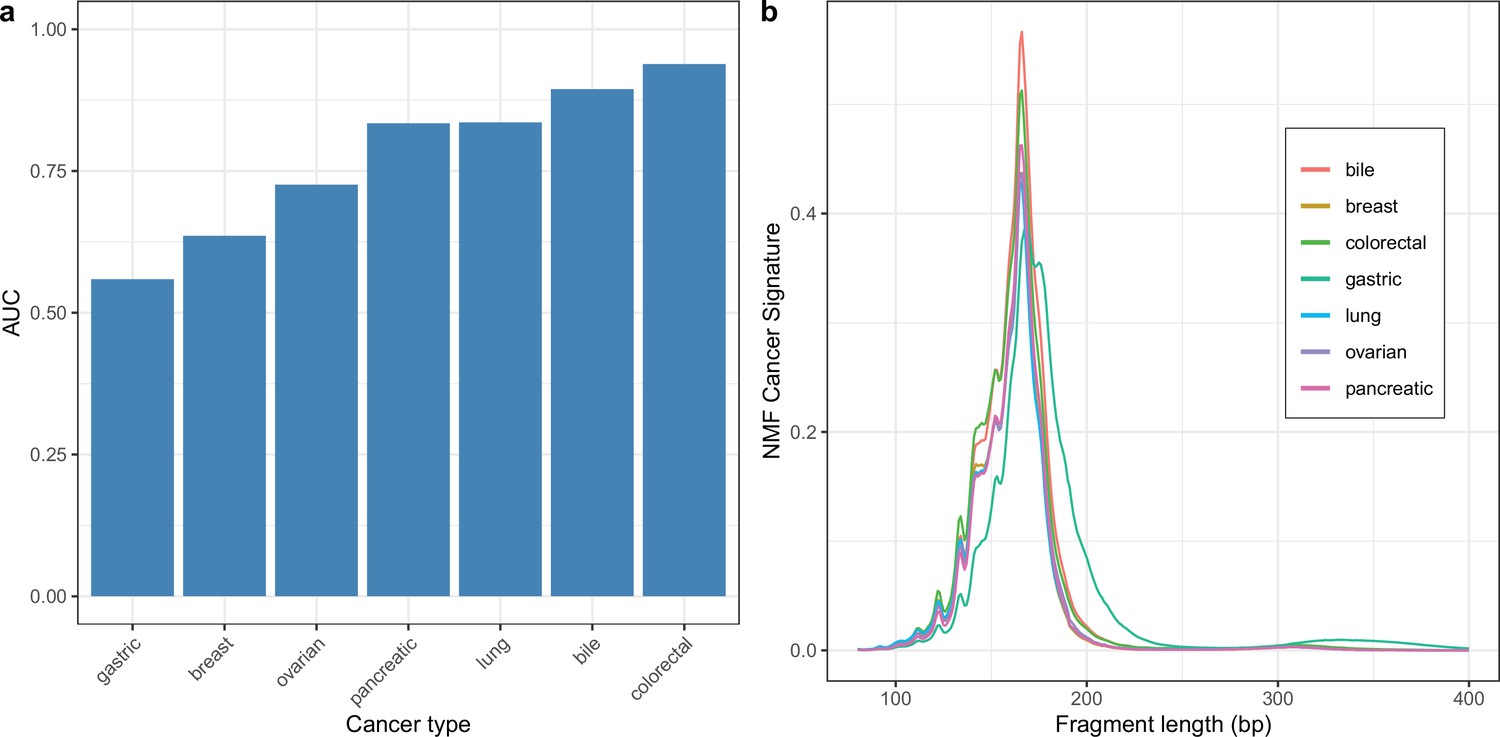
Cancer type specific non-negative matrix factorization (NMF) models.
Two component NMF models were trained separately for each cancer type by combining samples for that cancer type with healthy controls (a) AUCs for discriminating cases vs controls across cancer types. (b) Estimated tumor signatures for each cancer type.
Figure 3—figure supplement 4
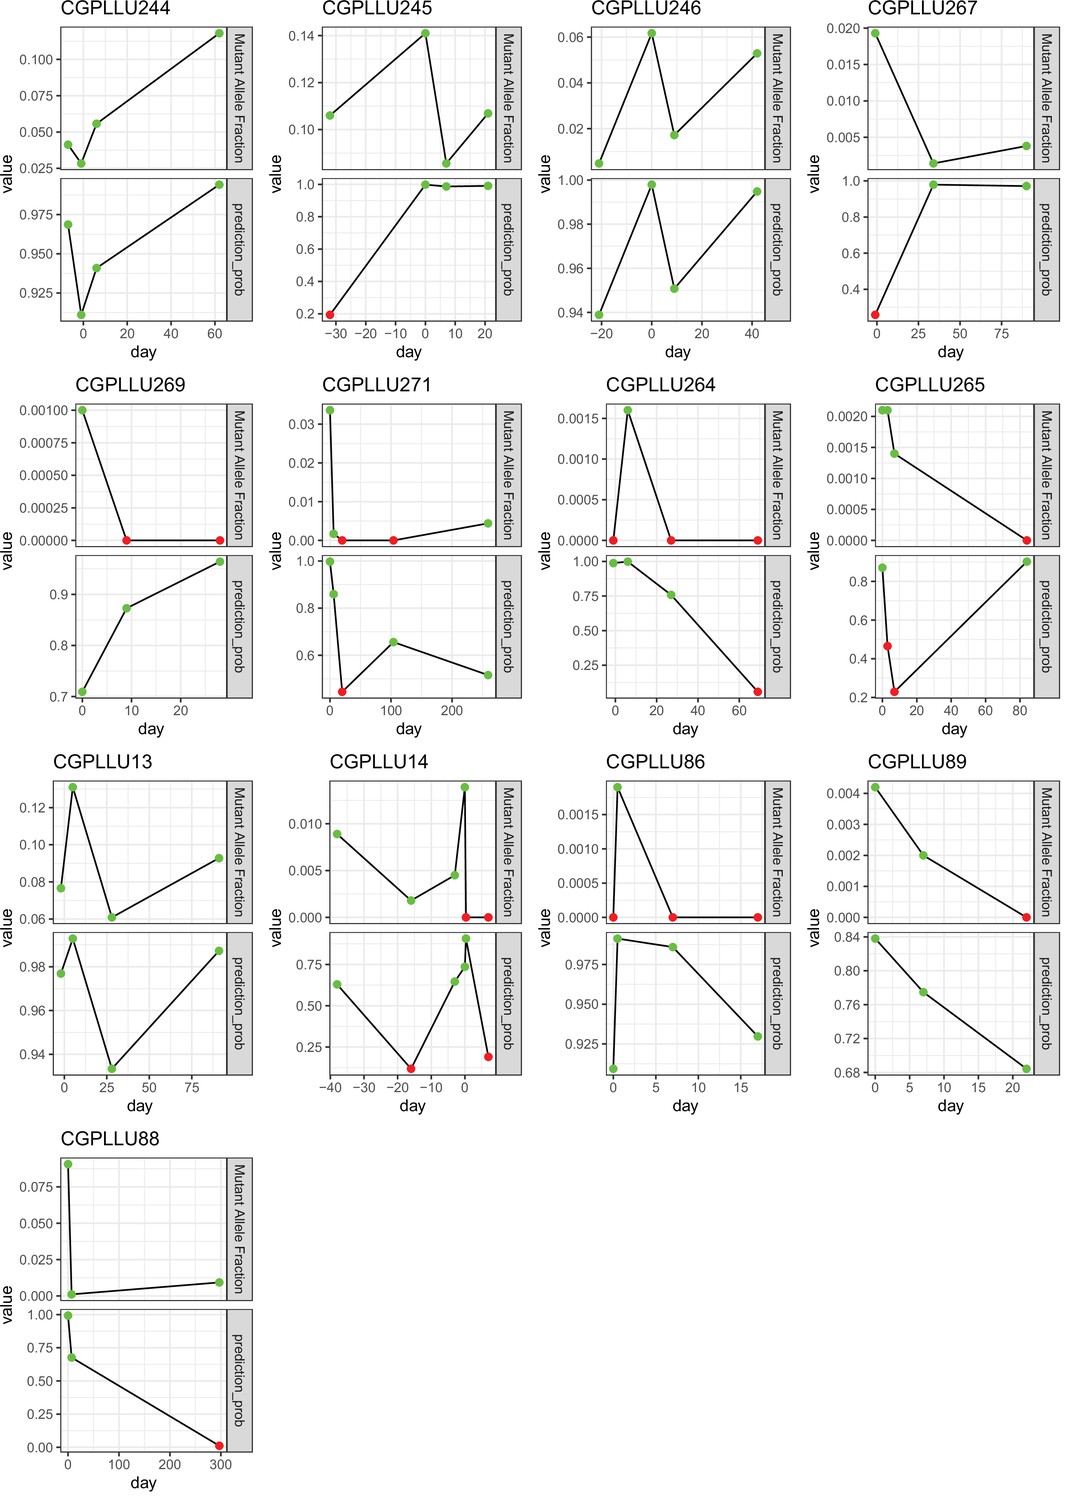
Using a Support Vector Machine (SVM) trained on 30 non-negative matrix factorization (NMF) components to classify sequential samples.
Each subplot shows an individual with at least three samples. The days on the x-axis are relative to the operation date. Top facet shows the variant allele frequency of the EGFR or ERBB2 mutation with the largest frequency, red color indicates that the mutation was not seen in that sample. Bottom facet shows the prediction probability given by the SVM, green color indicates a probability (of being a case) above 50%, red color below 50%.

Additional files
-
Supplementary file 1
Fragment length distributions in mCRPC cohort.
Sheet 1 contains raw fragment length distributions from WGS data along with ctDNA% estimates. Sheet 2 contains raw fragment length distributions from targeted data.
- https://cdn.elifesciences.org/articles/71569/elife-71569-supp1-v2.xlsx
-
Transparent reporting form
- https://cdn.elifesciences.org/articles/71569/elife-71569-transrepform1-v2.pdf
-
Source code 1
Source code and data to produce Figure 2.
- https://cdn.elifesciences.org/articles/71569/elife-71569-code1-v2.gz
-
Source code 2
Source code and data to produce Figure 3.
- https://cdn.elifesciences.org/articles/71569/elife-71569-code2-v2.gz
-
Source code 3
Scripts used for the analysis of the DELFI data.
This includes a script to train NMF, a script to estimate the weight of NMF components and a script to train and evaluate a linear SVM model.
- https://cdn.elifesciences.org/articles/71569/elife-71569-code3-v2.gz
Download links
A two-part list of links to download the article, or parts of the article, in various formats.
Downloads (link to download the article as PDF)
Open citations (links to open the citations from this article in various online reference manager services)
Cite this article (links to download the citations from this article in formats compatible with various reference manager tools)
Unsupervised detection of fragment length signatures of circulating tumor DNA using non-negative matrix factorization
eLife 11:e71569.
https://doi.org/10.7554/eLife.71569


