The role of action potential changes in depolarization-induced failure of excitation contraction coupling in mouse skeletal muscle
- Wright State University, Department of Neuroscience, Cell Biology, and Physiology, United States
- Wright State University, Department of Biological Sciences, United States
- University of Maryland School of Medicine, Departments of Pathology/Biochemistry & Molecular Biology, United States
- Wright State University, Department of Physics, United States
Figures
Figure 1

Relationships between resting potential, action potential (AP) peak, ΔF/F, and force generation.
(A) A plot of extensor digitorum longus (EDL) twitch force versus time following infusion of various concentrations of external K+ (n = 3 muscles for each K+ concentration, error bars = SD). Force for each muscle was normalized to the initial force. (B) Individual muscle forces after 40 min in high K+ (same experiments used to generate data in A) normalized to baseline force in 3.5 mM K+ for the same muscle, plotted versus mean resting membrane potential recorded in a separate set of experiments 20–40 min following infusion of high K+ solution (for resting potential measurements n is the following: 3.5 mM K+: 6 muscles, 49 fibers, 10 mM K+: 5 muscles, 50 fibers, 12 mM K+: 4 muscles, 36 fibers, 14 mM K+: 4 muscles, 32 fibers, 16 mM K+: 3 muscles, 32 fibers). The external K+ concentration is indicated by the symbol used for each muscle. (C) Plot of mean AP peak for individual muscles versus mean resting potential for the same muscle at K+ concentrations ranging from 3.5 mM to 16 mM. The plot was generated using the same muscles studied to generate the mean resting potential plotted in (B). (D) The APs and the corresponding change in fluorescence signal (ΔF/F) for fibers with various resting potentials. A dotted vertical line has been drawn on each voltage trace to mark the end of the stimulus artifact. Note the difference in time scales for the AP and ΔF/F traces. (E) Plot of mean ΔF/F versus mean resting potential for each muscle studied. (F) Plot of mean ΔF/F versus mean AP peak for each of the muscle studied.
Figure 2
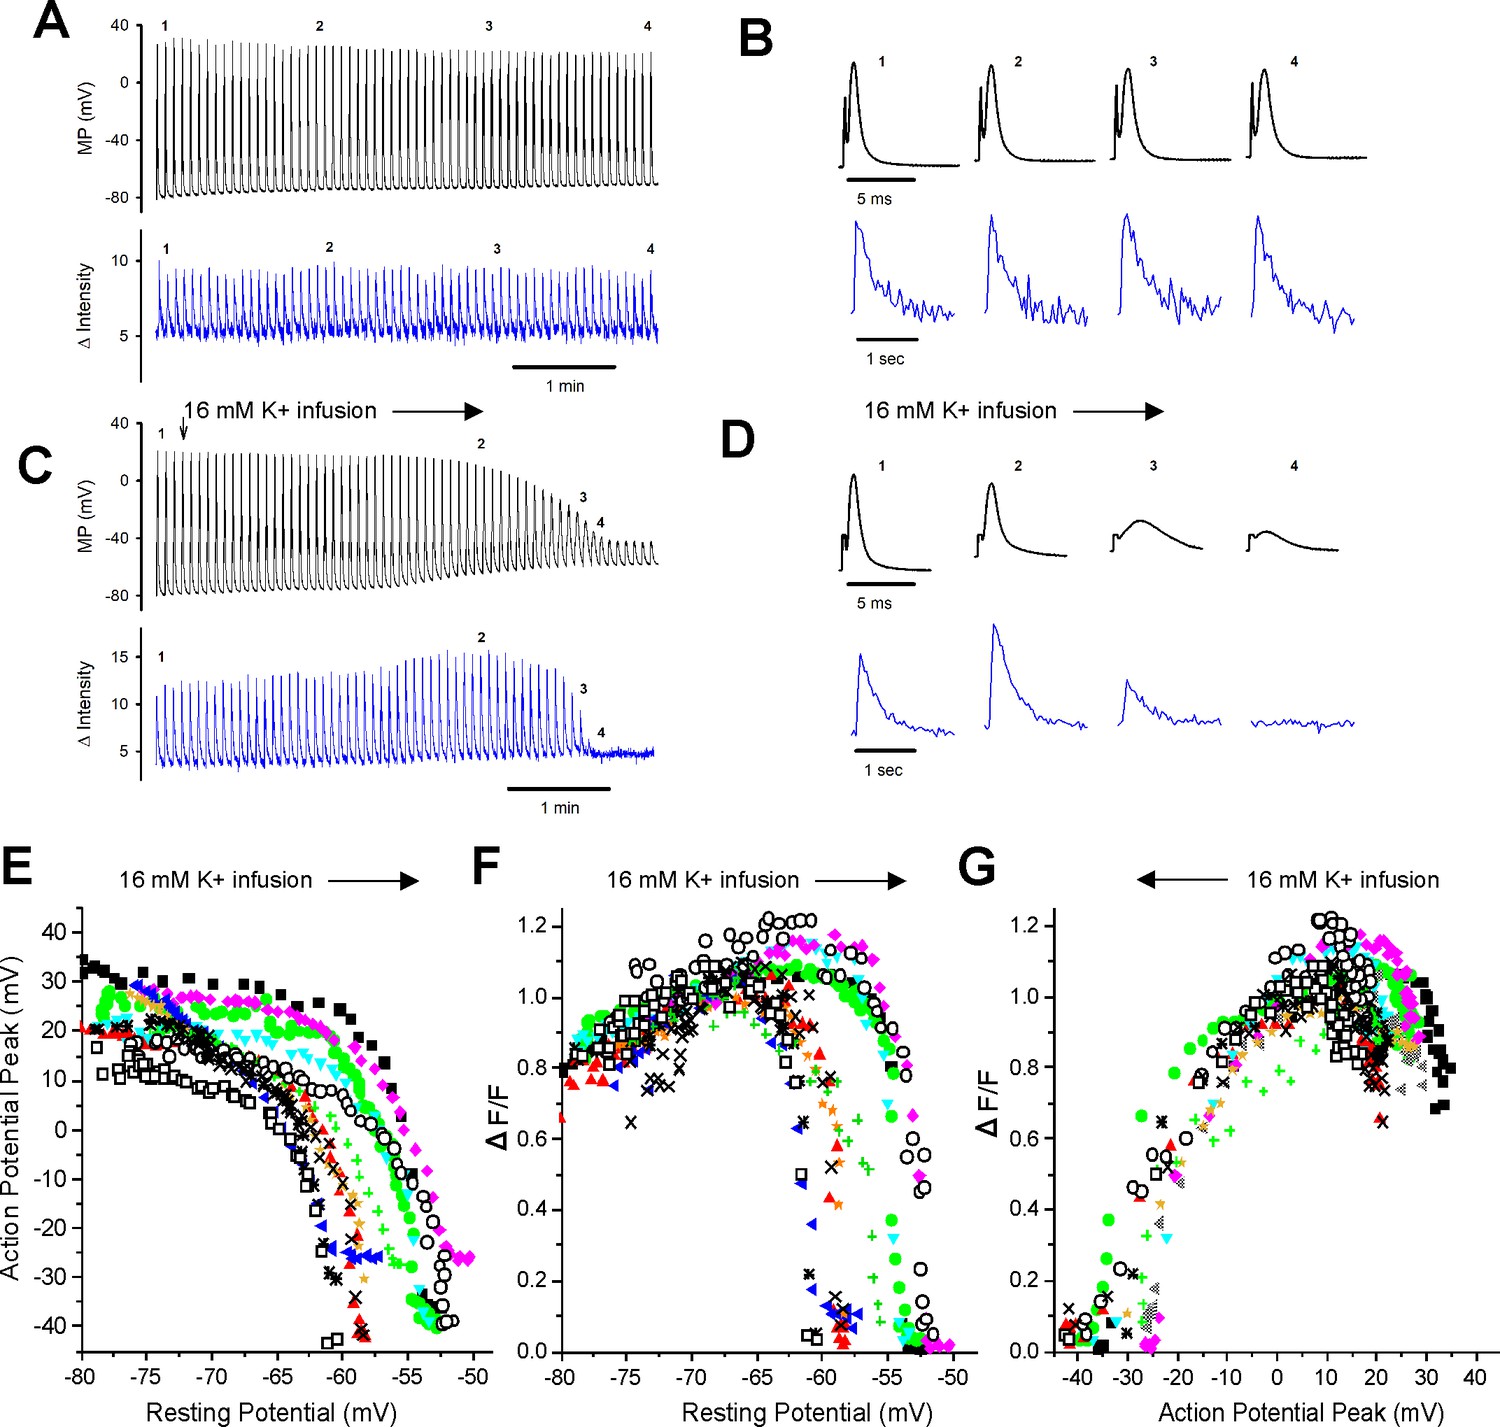
Failure of the intracellular Ca2+ transient in individual fibers during depolarization of the resting potential.
(A) The action potentials (APs) and ΔF/Fs during a 7 min recording for a fiber expressing GCAMP6f in 3.5 mM K+. The stimulus artifact in the AP traces has been eliminated for clarity. The trace shown is not continuous. A 5 ms block of time is shown for each AP, and a 1 s block of time is shown for each ΔF/F. The time base indicated is for the time between APs and ΔF/F. (B) The APs and corresponding ΔF/F for the four time points indicated in (A) on an expanded time scale. (C) APs and ΔF/F for a fiber during infusion of solution containing 16 mM K+ (indicated by the vertical and horizontal arrows). (D) The APs and corresponding ΔF/F for the four time points indicated in (C) on an expanded time scale. (E) Plot of AP peak versus resting potential during infusion of 16 mM K+ for 12 fibers. (F) Plot of ΔF/F versus resting potential for the 12 fibers shown in (E). The ΔF/F present at a resting potential of –70 mV was normalized to a value of 1 for each fiber. (G) Plot of normalized ΔF/F versus AP peak for the 12 fibers studied.
Figure 3 with 1 supplement
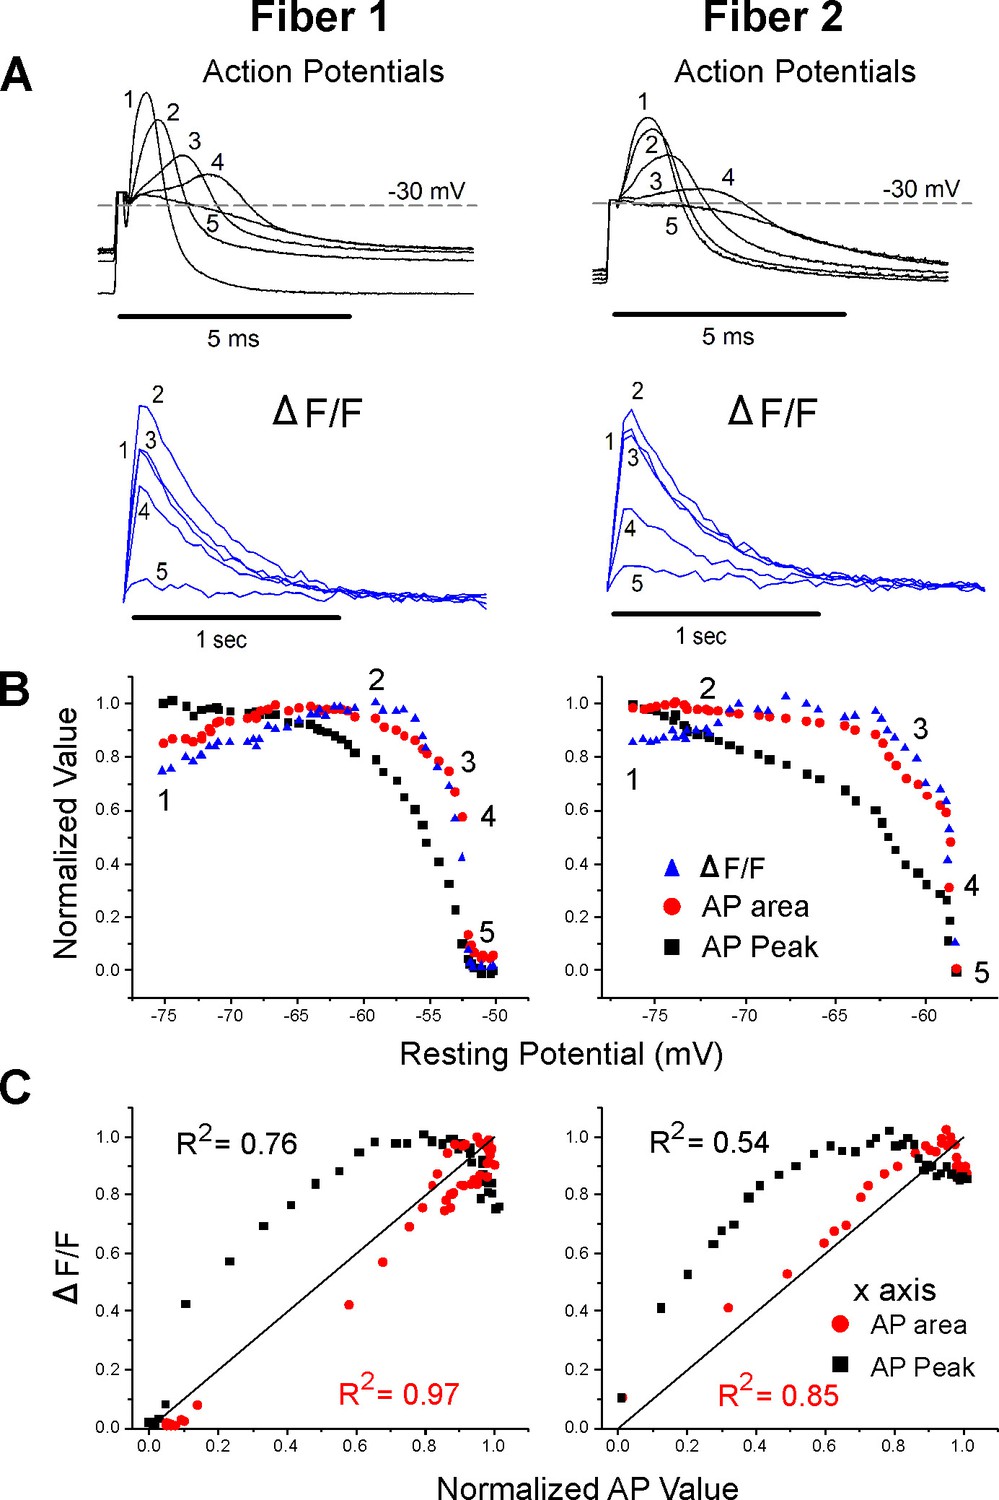
Correlation between ΔF/F and action potential (AP) area.
(A) The AP traces and ΔF/F recorded from two muscle fibers during infusion of 16 mM K+. A horizontal line at –30 mV represents the cutoff for measurement of AP area and normalized AP peak. APs peaking below –30 mV had peaks and areas set to 0. Below the AP, traces are the corresponding ΔF/F. The stimulus artifact has been truncated in the AP traces for clarity. (B) Plots of normalized AP peak, normalized AP area, and normalized ΔF/F versus resting potential for two fibers. The numbers 1–5 on each plot represent the points corresponding to the five AP and ΔF/F traces shown in (A). (C) Plots of the normalized ΔF/F versus either AP area or AP peak for the two fibers in (A) and (B). The line of identity is drawn on each plot as a reference. The R2 value for each relationship is shown on the graph.
Figure 3—video 1
Failure of the Ca2+ transient in a mouse extensor digitorum longus (EDL) fiber during infusion of 16 mM K+.
A video of a fiber taken over close to 3 min during infusion of 16 mM K+. The impaled fiber in the middle of a ×40 field of view of an EDL muscle expressing GCAMP6f was stimulated to fire an action potential (AP) every 5 s by current injection via an intracellular electrode located to the left of the image (the electrode is too dim to be seen). Initially ΔF/F is stable during infusion of 16 mM K+, but toward the end of the video, ΔF/F begins to decrease. The decrease is uneven such that ΔF/F first fails in the region of the fiber to the right, furthest from the stimulating electrode. The portion of the fiber flashing decreases until only a small region in the vicinity of the stimulating electrode flashes. Finally, no flash is triggered by current injection.
Figure 4
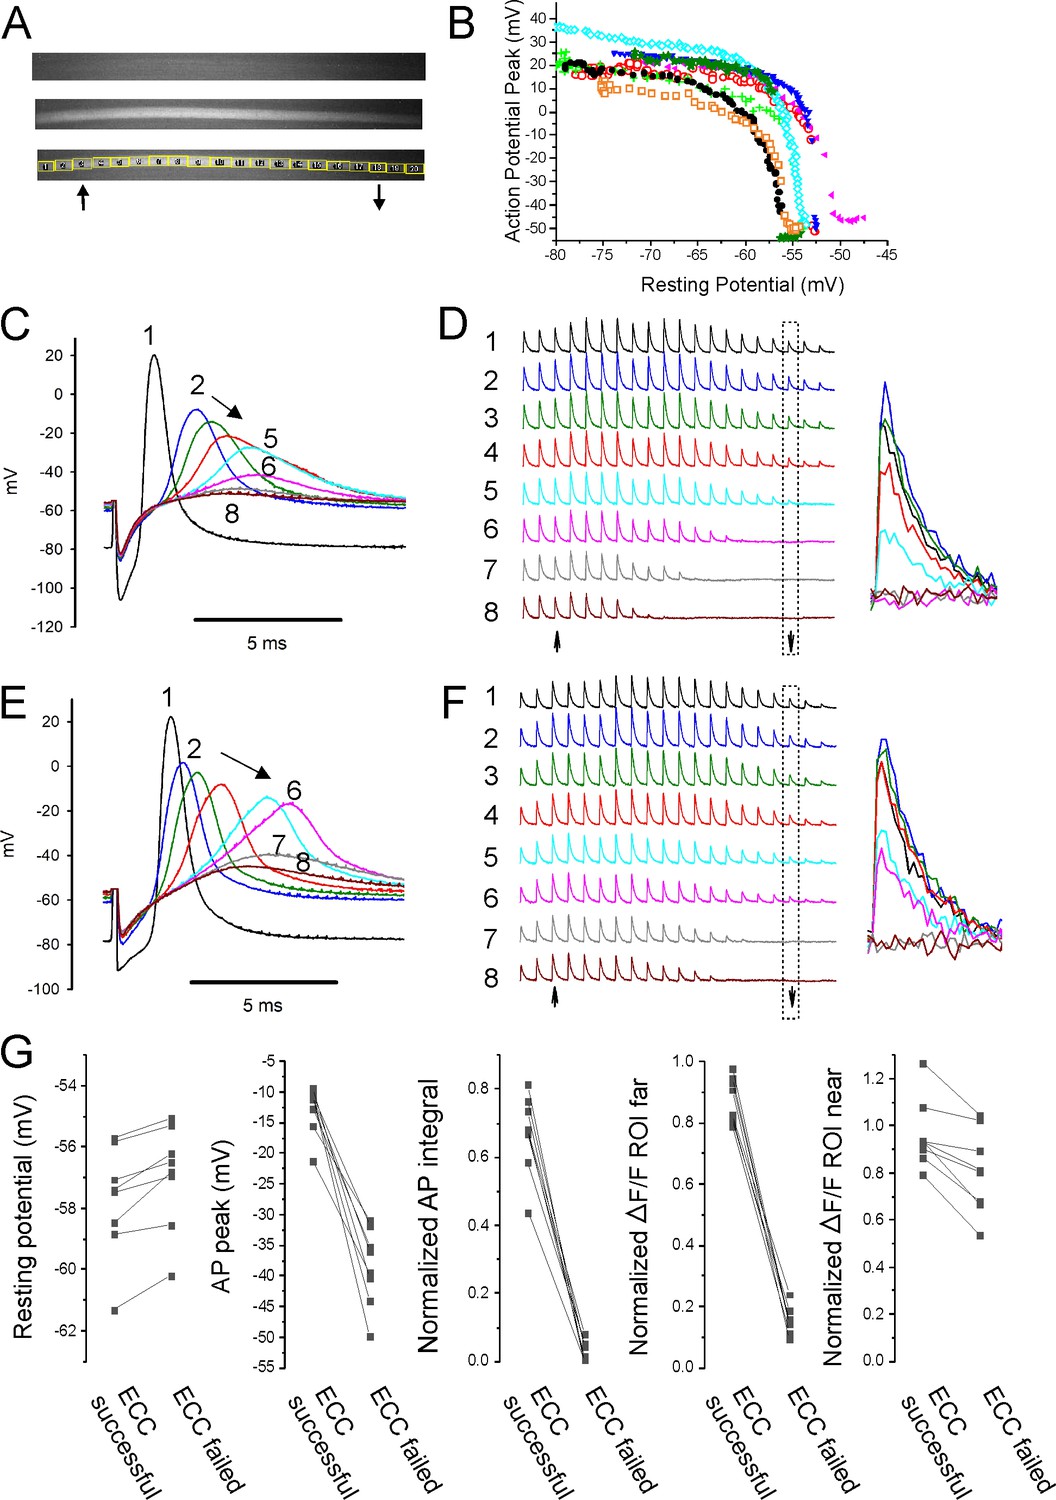
Failure of action potential (AP) conduction contributes to depolarization-induced failure of excitation-contraction coupling (ECC).
(A) A fiber expressing GCAMP6f at 5×. The top image is the fiber at rest. The middle image shows the signal along the length of the fiber triggered by an AP. The bottom image shows the regions of interest (ROIs) placed along the length of the fiber. The up arrow indicates the position of the stimulating electrode, and the down arrow indicates the position of the recording electrode. (B) Plot of AP peak 1.6 mm from the stimulating electrode versus resting potential during infusion of 16 mM K+ for eight representative fibers from eight different muscles. (C) Eight superimposed APs from a fiber during infusion of 16 mM K+. (D) The ΔF/F at the 20 ROIs along the length of the fiber in (C) for each of the eight APs shown in (C). The upward-pointing arrow indicates the position of the stimulating electrode, the downward-pointing arrow indicates the position of the recording electrode. The dashed boxes indicate the ΔF/F at the ROI of the recording electrode. At the right are shown the eight superimposed ΔF/Fs for the ROI at the recording electrode. In the example shown, in stimulations 1–3 ECC was judged to have succeeded, in stimulations 4 and 5 it was indeterminate, and in stimulations 6–8 it failed. (E, F) APs and the corresponding ΔF/F for a second fiber. In (F), it was judged that in stimulations 1–4 ECC was successful, in 5 and 6 it was indeterminate, and 7 and 8 it failed. (G) Plots of muscle means from eight mice for parameters when ECC succeeded versus when ECC failed. Each point represents an average of 2–6 muscle fibers from a muscle. For plots of ΔF/F, ROI far was located at the recording electrode and ROI near was located at the stimulating electrode.
Figure 5
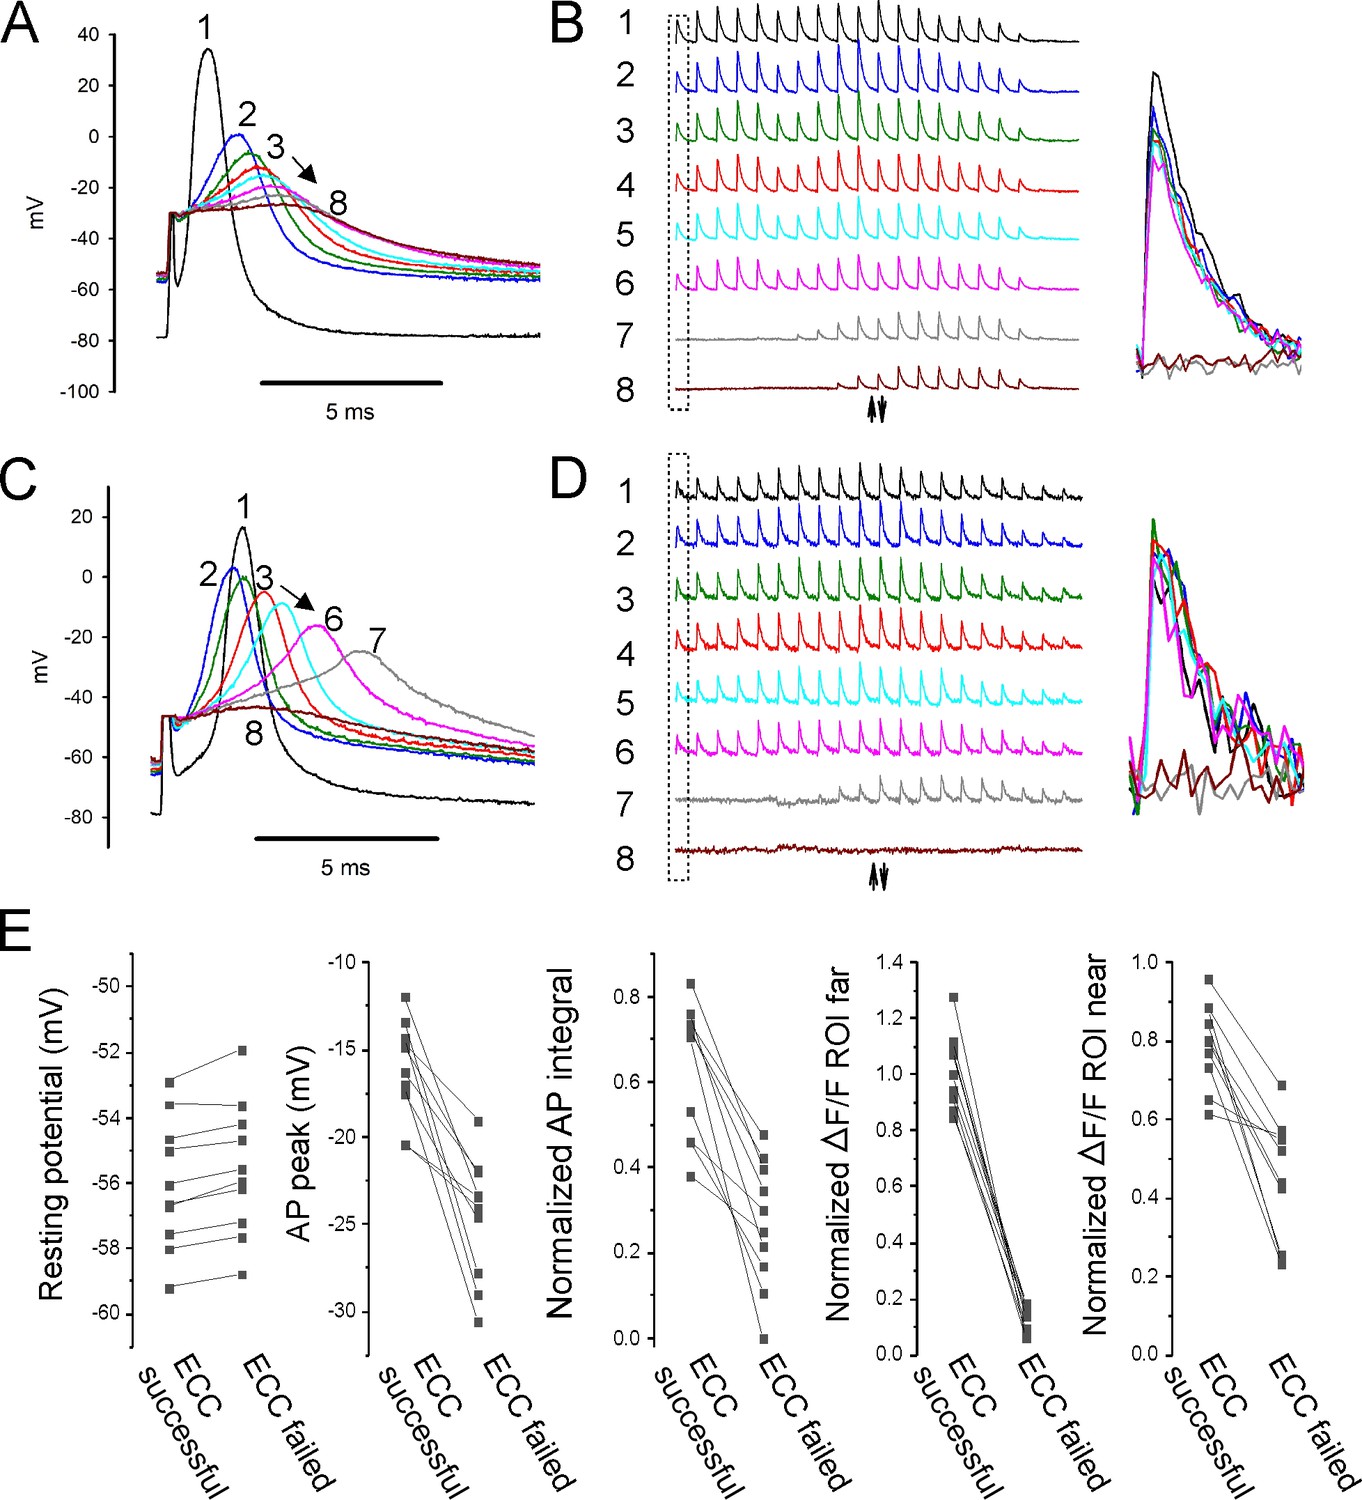
Properties of action potentials (APs) near the stimulating electrode that predict successful excitation-contraction coupling (ECC).
(A, C) Eight superimposed, selected APs from two fibers during infusion of 16 mM K+. (B, D) The ΔF/F at the 20 regions of interest (ROIs) along the length of the fibers for each of the eight APs shown in (A, C). The upward-pointing arrow indicates the position of the stimulating electrode, the downward-pointing arrow indicates the position of the recording electrode. The dashed boxes indicate the ΔF/F furthest from the stimulating electrode. At the right are shown the eight superimposed ΔF/Fs for the ROI furthest from the stimulating electrode. In both (B) and (D), ECC was judged to have succeeded in stimulations 1–6, there were no indeterminate stimulations, and ECC was judged to have failed in stimulations 7 and 8. (E) Plots of muscle means from 10 mice for parameters when EEC succeeded versus when ECC failed. Each point represents an average of 2–5 muscle fibers from a muscle.
Figure 6
Sarcoplasmic reticulum (SR) Ca2+ release can be evoked after depolarization-induced failure of excitation-contraction coupling (ECC).
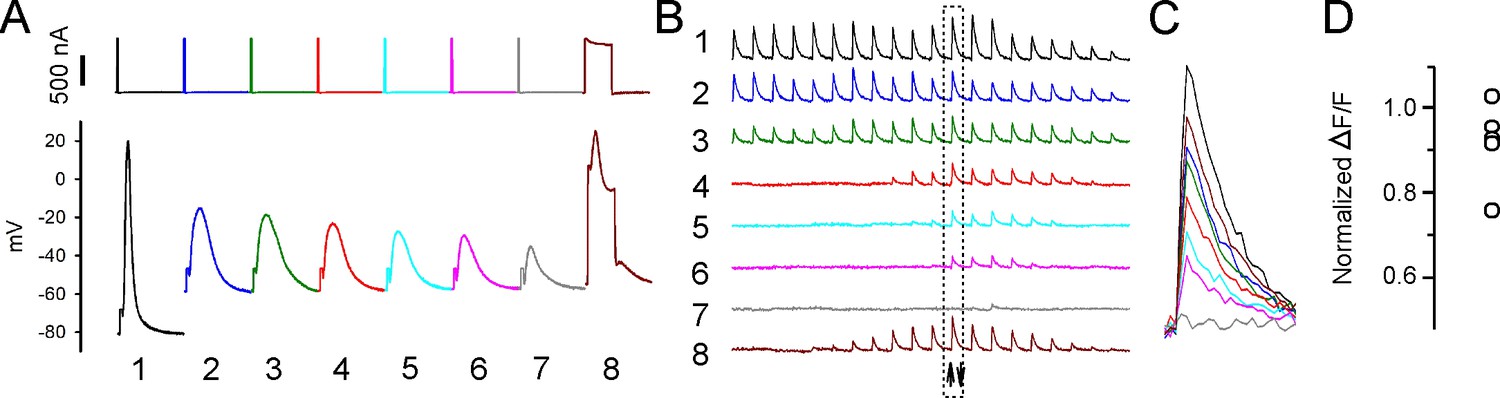
(A) Shown are eight current injections and the corresponding action potentials (APs) in a fiber during infusion of 16 mM K+. Following >90% reduction in ΔF/F at the site of current injection, the duration of the current injection was increased to 5 ms to trigger an artificial ‘AP’ in stimulation #8. The ‘AP’ peak triggered is similar to the peak of the AP in that fiber prior to infusion of 16 mM K+ (stimulation #1). (B) The ΔF/F at the 20 regions of interest (ROIs) along the length of the fiber for each of the eight APs shown in (A). The upward-pointing arrow indicates the position of the stimulating electrode, the downward-pointing arrow indicates the position of the recording electrode. The dashed boxes indicate the ΔF/F closest to the stimulating electrode. (C) Eight superimposed ΔF/Fs for the ROI closest to the stimulating electrode. In the example shown, the 5 ms injection of current triggered a ΔF/F that was 87% of that triggered by an AP in that fiber at a resting potential of –70 mV. (D) Plot of muscle means from five muscles for ΔF/F triggered by a 5 ms current injection normalized to ΔF/F for APs from the same fibers at a resting potential of –70 mV.
Tables
Key resources table
| Reagent type (species) or resource | Designation | Source or reference | Identifiers | Additional information |
|---|---|---|---|---|
| Strain, strain background (Mus musculus) | GCAMP6f mice | Jackson Labs | Stock: cat #028865 crossed with cat# 030218 | |
| Chemical compound, drug | N-benzyl-p-toluenesulfonamide (BTS) | TCI America | Prod. #: B3082 | 0.05 mM |
| Software, algorithm | Spike2 | http://ced.co.uk/downloads/latestsoftware | Version 8 |
Additional files
Download links
A two-part list of links to download the article, or parts of the article, in various formats.
Downloads (link to download the article as PDF)
Open citations (links to open the citations from this article in various online reference manager services)
Cite this article (links to download the citations from this article in formats compatible with various reference manager tools)
The role of action potential changes in depolarization-induced failure of excitation contraction coupling in mouse skeletal muscle
eLife 11:e71588.
https://doi.org/10.7554/eLife.71588


