A nascent polypeptide sequence modulates DnaA translation elongation in response to nutrient availability
- Science for Life Laboratory and Department of Molecular Biosciences, The Wenner-Gren Institute, Stockholm University, Sweden
- Department of Cell and Molecular Biology, Uppsala University, Sweden
Figures
Figure 1 with 2 supplements
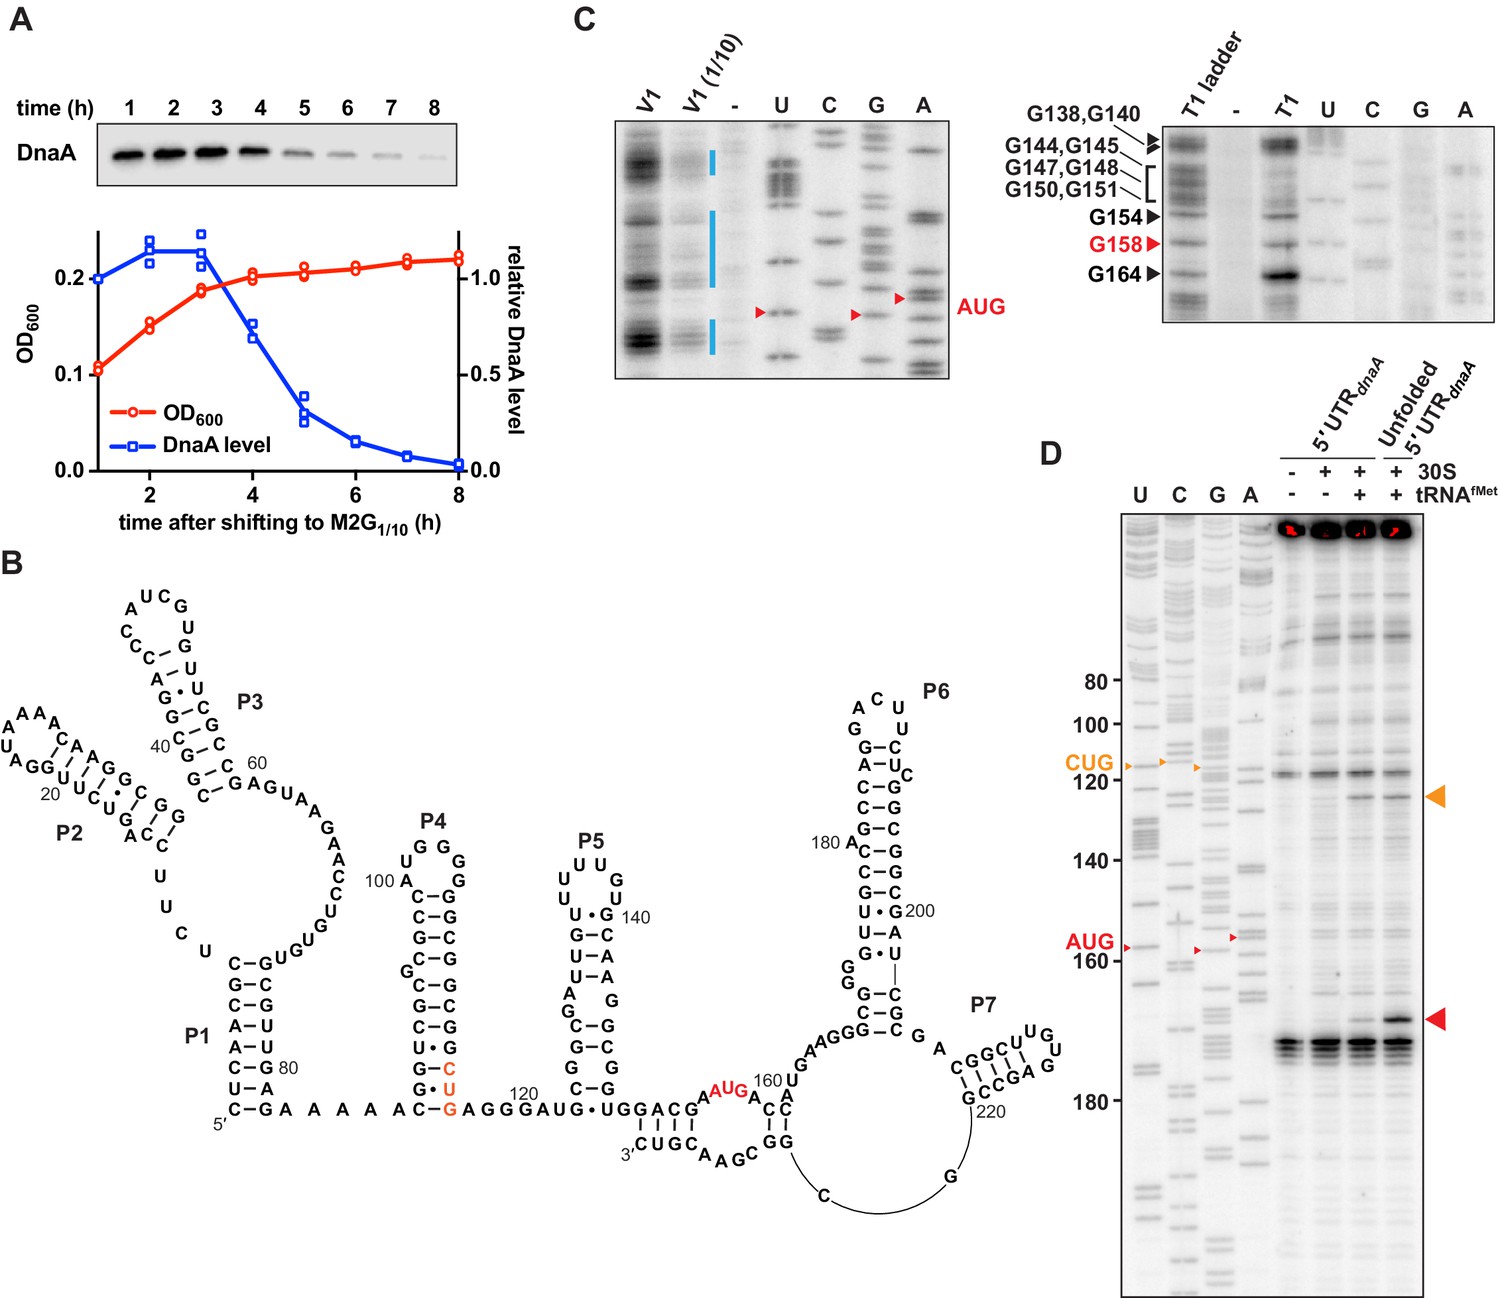
Caulobacter dnaA mRNA assumes a complex secondary structure that inhibits pre-initiation complex formation.
(A) Growth curve (red) and DnaA abundance (blue) measured during a carbon exhaustion experiment. Wild-type Caulobacter was grown in a defined minimal medium (M2G1/10) containing 0.02% glucose as the sole carbon source. DnaA levels were determined by western blot and band intensities quantified relative to the first time point (t = 1 hr). Averages of three independent replicates are shown with error bars representing standard errors. (B) Secondary structure of the mRNA region encompassing the 5'UTR and the first 26 codons of the dnaA open reading frame. The reported AUG start codon and the alternative CUG codon are highlighted in red and orange, respectively. See Figure 1—figure supplement 2A for an alternative secondary structure differing in the way the 3'-terminal RNA portion folds back on the start codon region. (C) RNA probing gels showing the dnaA mRNA region containing the translation start site and the RBS. Upon partially digesting a synthetic in vitro transcribed RNA with V1 (left gel) or T1 (right gel) RNases, primer extension (32P-5'-end-labelled primer B; Figure 1—figure supplement 2A) was used to detect cleavage positions. V1 and V1 (1/10) lanes: samples treated with different concentrations of RNase V1; T1 lane: sample treated with T1 RNase; T1 ladder lane: RNase T1 treatment under denaturing conditions; -: mock-treated RNA; U, C, G, A lanes: sequencing reactions using the 32P-5'-end-labelled primer B. The bands corresponding to the start codon nucleotides are indicated in red. The blue lines indicate the dsRNA regions. Complete gels are shown in Figure 1—figure supplement 1C and D. (D) Toeprinting assay showing the sites of pre-initiation complex formation in the dnaA 5'UTR. The reverse transcription step was performed using 32P-5'-end-labelled primer A (Figure 1—figure supplement 2A). Inclusion of Escherichia coli 30S ribosomes and tRNAfMet are indicated on the top of the gel. Unfolded 5'UTR lane, assay performed using a heat-unfolded in vitro transcribed RNA. U, C, G, A lanes: sequencing reactions using the 32P-5'-end-labelled primer A. The large red and orange triangles indicate the reverse transcriptase stops induced by the 30S initiation complexes formed at the AUG and CUG codons, respectively. The AUG and CUG codons are indicated on the sequencing lanes with small red and orange triangles, respectively.
-
Figure 1—source data 1
Source data for Figure 1.
- https://cdn.elifesciences.org/articles/71611/elife-71611-fig1-data1-v1.zip
Figure 1—figure supplement 1
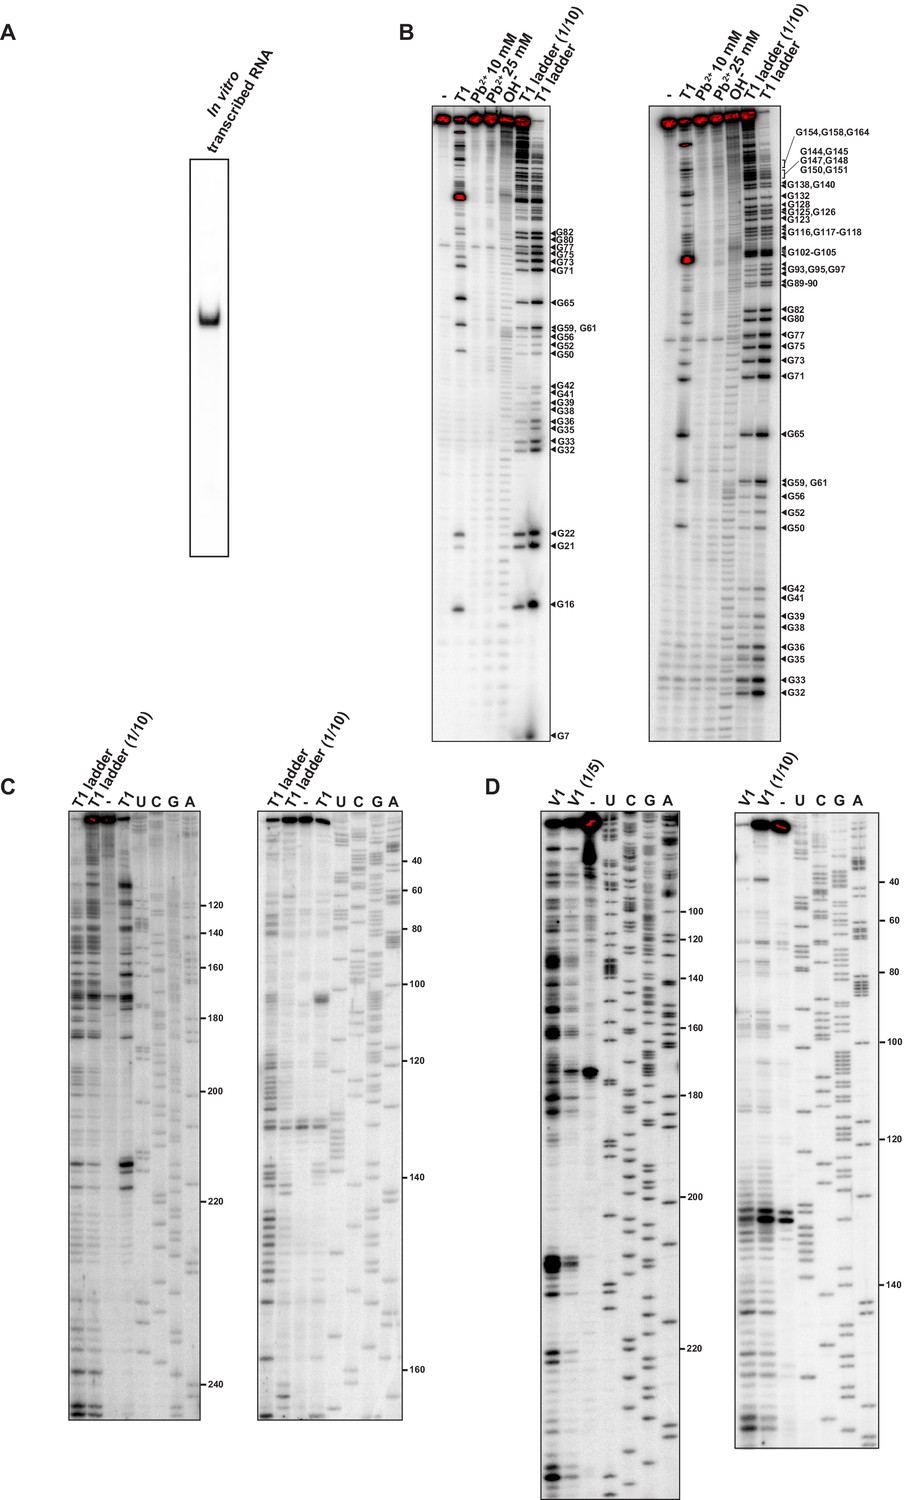
Structural characterisation of the dnaA mRNA leader.
(A) Native 6% PAGE of the in vitro transcribed 32P-5'-end-labelled RNA comprising the 5'UTR and the first 118 nt of the dnaA coding region (total RNA length 273 nt). (B) The 32P-5'-end-labelled RNA was subjected to RNase T1 and Pb2+ structure probing, as described in Materials and methods. Cleavage products were separated on a 12% denaturing polyacrylamide gel and detected by phosphorimager. -: mock-treated RNA; OH-: alkaline ladder; T1 ladder and T1 ladder (1/10) lanes: RNase T1 treatment under denaturing conditions using different concentrations of the probe. The gel on the left was run for 2 hr, and the one on the right for 4 hr. (C, D) RNase T1 and V1 structure probing gels obtained using primer extension. The reverse transcription step was performed with two different 32P 5'-end-labelled primers (Figure 1—figure supplement 2A): primer A (left gel) or primer B (right gel). Reverse transcription products were separated on a 12% sequencing gels and detected by phosphorimager. Lanes representing T1 or V1 treatment are indicated, with diluted enzyme concentrations shown (e.g., 1/5, etc.), and U, C, G, A are sequencing reactions using the same primers. -: mock-treated RNA. The probing data (B–D) gave structural information from positions 7–234.
-
Figure 1—figure supplement 1—source data 1
Source data for Figure 1—figure supplement 1.
- https://cdn.elifesciences.org/articles/71611/elife-71611-fig1-figsupp1-data1-v1.zip
Figure 1—figure supplement 2
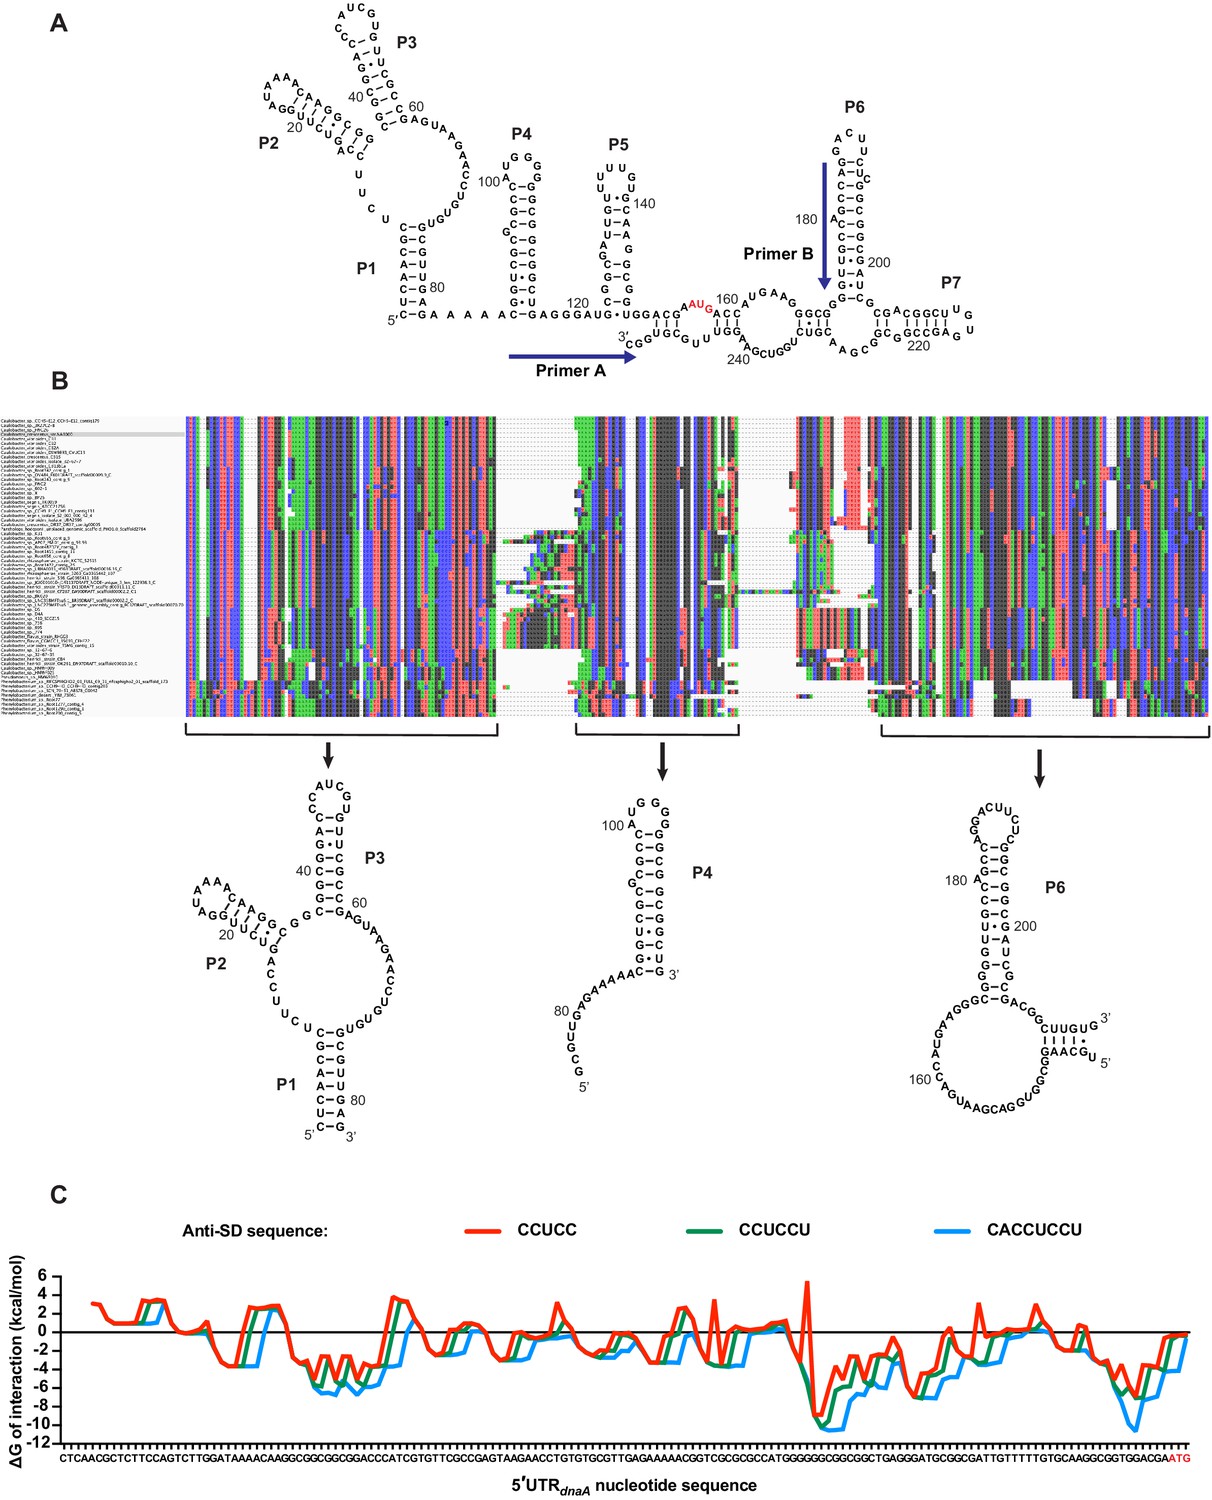
Structure conservation of the dnaA mRNA leader and predicted interaction with Caulobacter’s 16S rRNA.
(A) Alternative model for the secondary structure of the mRNA region encompassing the 5'UTR and the first 98 nucleotides of the dnaA open reading frame. The AUG start codon is highlighted in red. Primers A and B, used for probing and toeprinting assays, are represented on the structure. (B) Alignment of the 66 sequences identified in the Caulobacteraceae family (MUSCLE). The BLAST hits were used to search for conserved structural elements using CMfinder. The co-variance-based software predicted the existence of three conserved structural domains corresponding to the helixes P1–P3, P4, and P6. (C) Energy of interaction between an 8 nt sliding window of the 5'UTR and the anti-Shine–Dalgarno (anti-SD) sequence of Caulobacter’s 16S rRNA. The ΔG of interaction was calculated using the RNAcofold tool of the ViennaRNA package. Three different anti-SD sequences were considered: CCUCC (red), CCUCCU (green), and CACCUCCU (blue).
-
Figure 1—figure supplement 2—source data 1
Source data for Figure 1—figure supplement 2.
- https://cdn.elifesciences.org/articles/71611/elife-71611-fig1-figsupp2-data1-v1.zip
Figure 2
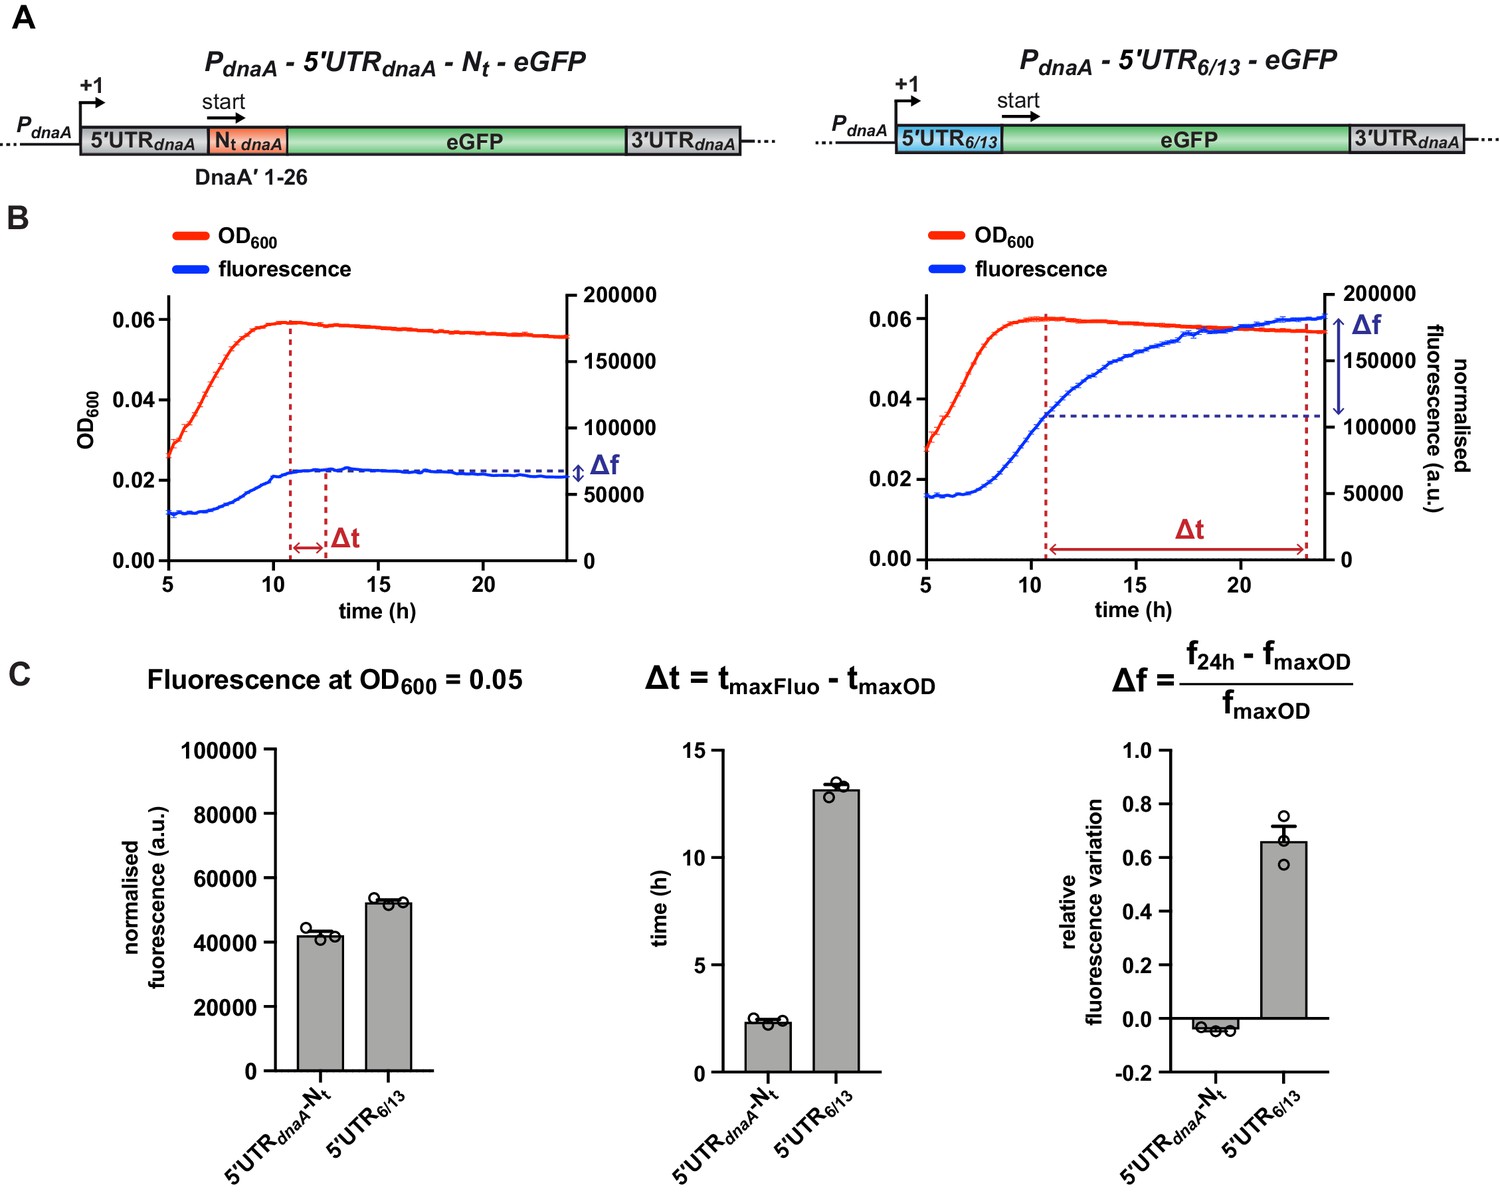
A fluorescent reporter system monitors the post-transcriptional regulation of dnaA during carbon starvation.
(A) Schematic illustration of the plasmid-borne reporter constructs. In the 5'UTR-Nt construct (left-hand side), the dnaA promoter (PdnaA), the dnaA 5'UTR (5'UTRdnaA; grey), and the first 26 codons of dnaA open reading frame (Nt dnaA; orange) were translationally fused to the eGFP gene (green), followed by dnaA intrinsic terminator (3'UTRdnaA; grey). In the 5'UTR6/13 construct (right-hand side), the 5'UTRdnaA-Nt dnaA module was substituted with the non-nutritionally regulated 5'UTR6/13 (light blue). (B) Culture fluorescence was measured to monitor eGFP synthesis during growth in M2G1/10 for 24 hr using a microplate reader. Background correction was performed at each time point by subtracting the fluorescence of a strain carrying a pMR10 empty plasmid (pMR10-BG, Supplementary file 1A). The normalised fluorescence (blue curve) was obtained by dividing with the OD600 (red curve) at each time point. (C) Values of fluorescence intensity at OD600 = 0.05, Δt and Δf calculated using the kinetic profiles in (B). The parameters Δt and Δf are defined by the equations reported on top of the bar graphs and are graphically represented in (B). Averages of three independent replicates are shown with error bars representing standard errors.
Figure 3 with 3 supplements

Most of the dnaA 5'UTR sequence is not required for the response to carbon starvation.
(A) Stabilising (orange) and destabilising (light blue) mutations introduced in stem P5 by site-directed mutagenesis of the 5'UTR-Nt reporter construct. The start codon and the putative RBS are indicated in red and green, respectively. (B–D) Values of fluorescence intensity at OD600 = 0.05, Δt and Δf calculated for the mutants in (A). (E) 5'UTR truncation mutants. Sites of truncation (T1–T4) are depicted on the mRNA secondary structure. The start codon and the putative Shine–Dalgarno (SD)-like sequence are indicated in red and green, respectively. The non-canonical CUG codon is coloured in orange. (F–H) Values of fluorescence intensity at OD600 = 0.05, Δt and Δf calculated for the truncation mutants in (E). See Figure 3—figure supplement 1A and B for growth curves and fluorescence kinetic profiles. All data are shown as averages of three independent replicates with error bars representing standard errors.
Figure 3—figure supplement 1
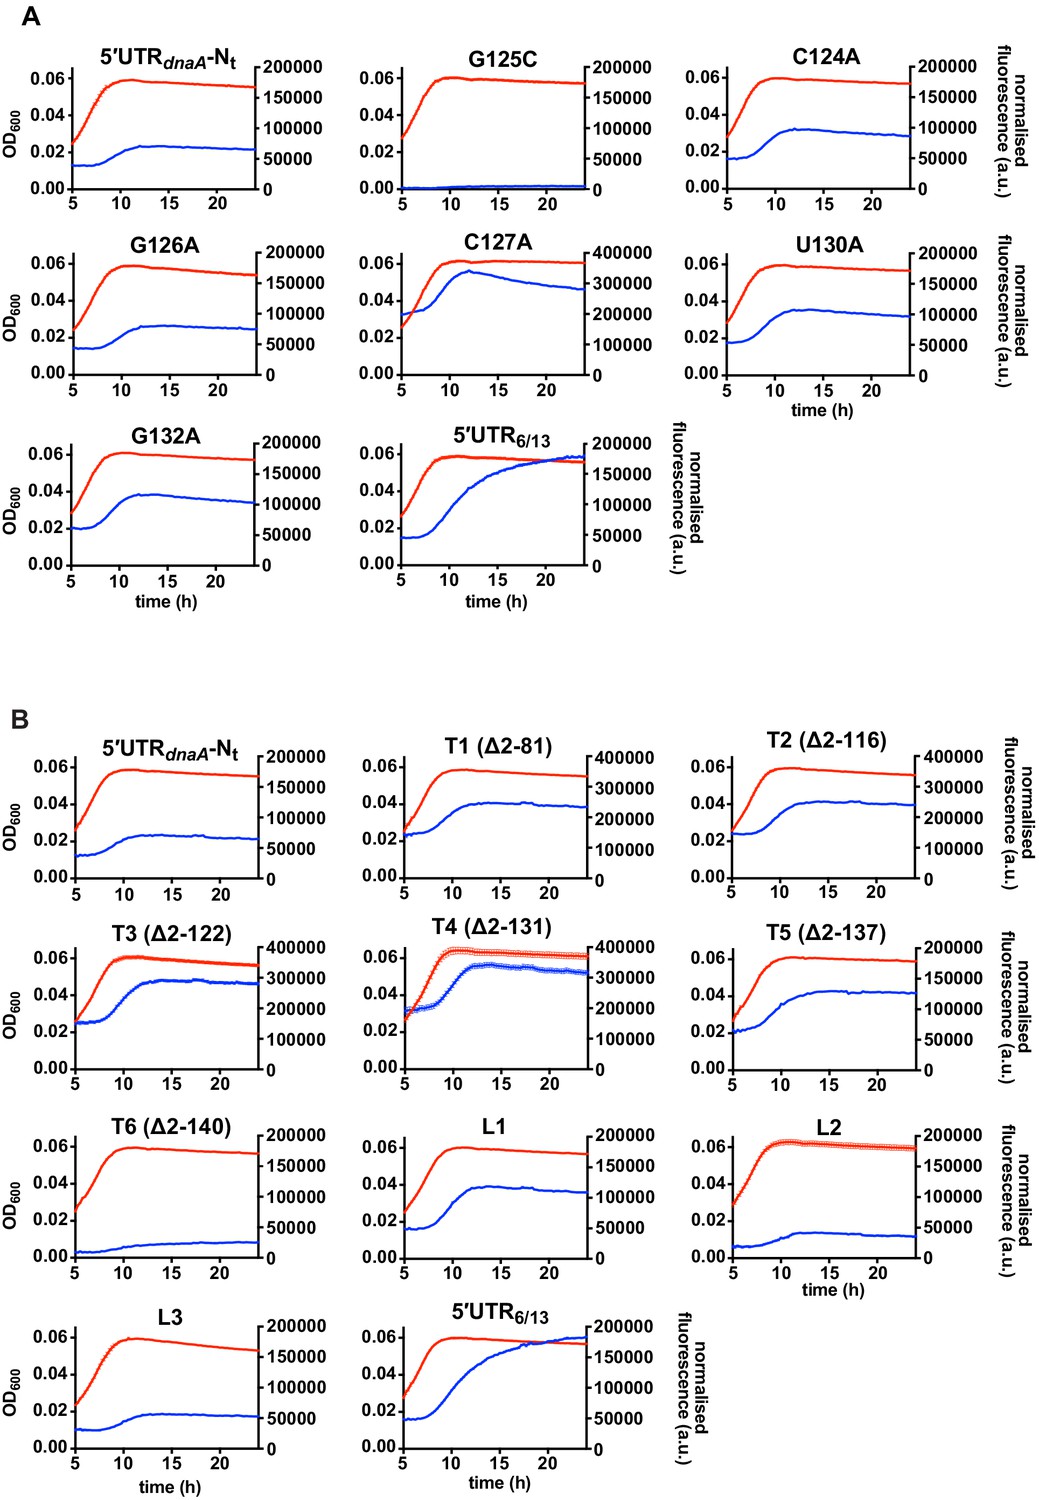
Fluorescence kinetic profiles and growth curves of the reporter strains carrying mutations in the 5'UTR of the dnaA mRNA.
(A) Reporter strains carrying mutations that stabilise (G125C) or destabilise (C124A, G126A, C127A, U130A, G132A) stem P5. (B) Reporter strains with 5'UTR truncations (T1–T6, Figure 3E and Figure 3—figure supplement 3) or loop P5 mutations (L1–L3, Figure 3—figure supplement 3). The profiles of the 5'UTR-Nt and 5'UTR6/13 strains are shown for comparison. Averages of three independent replicates are shown with error bars representing standard errors.
Figure 3—figure supplement 2
The reported AUG start codon is the only functional translation start site in vivo.
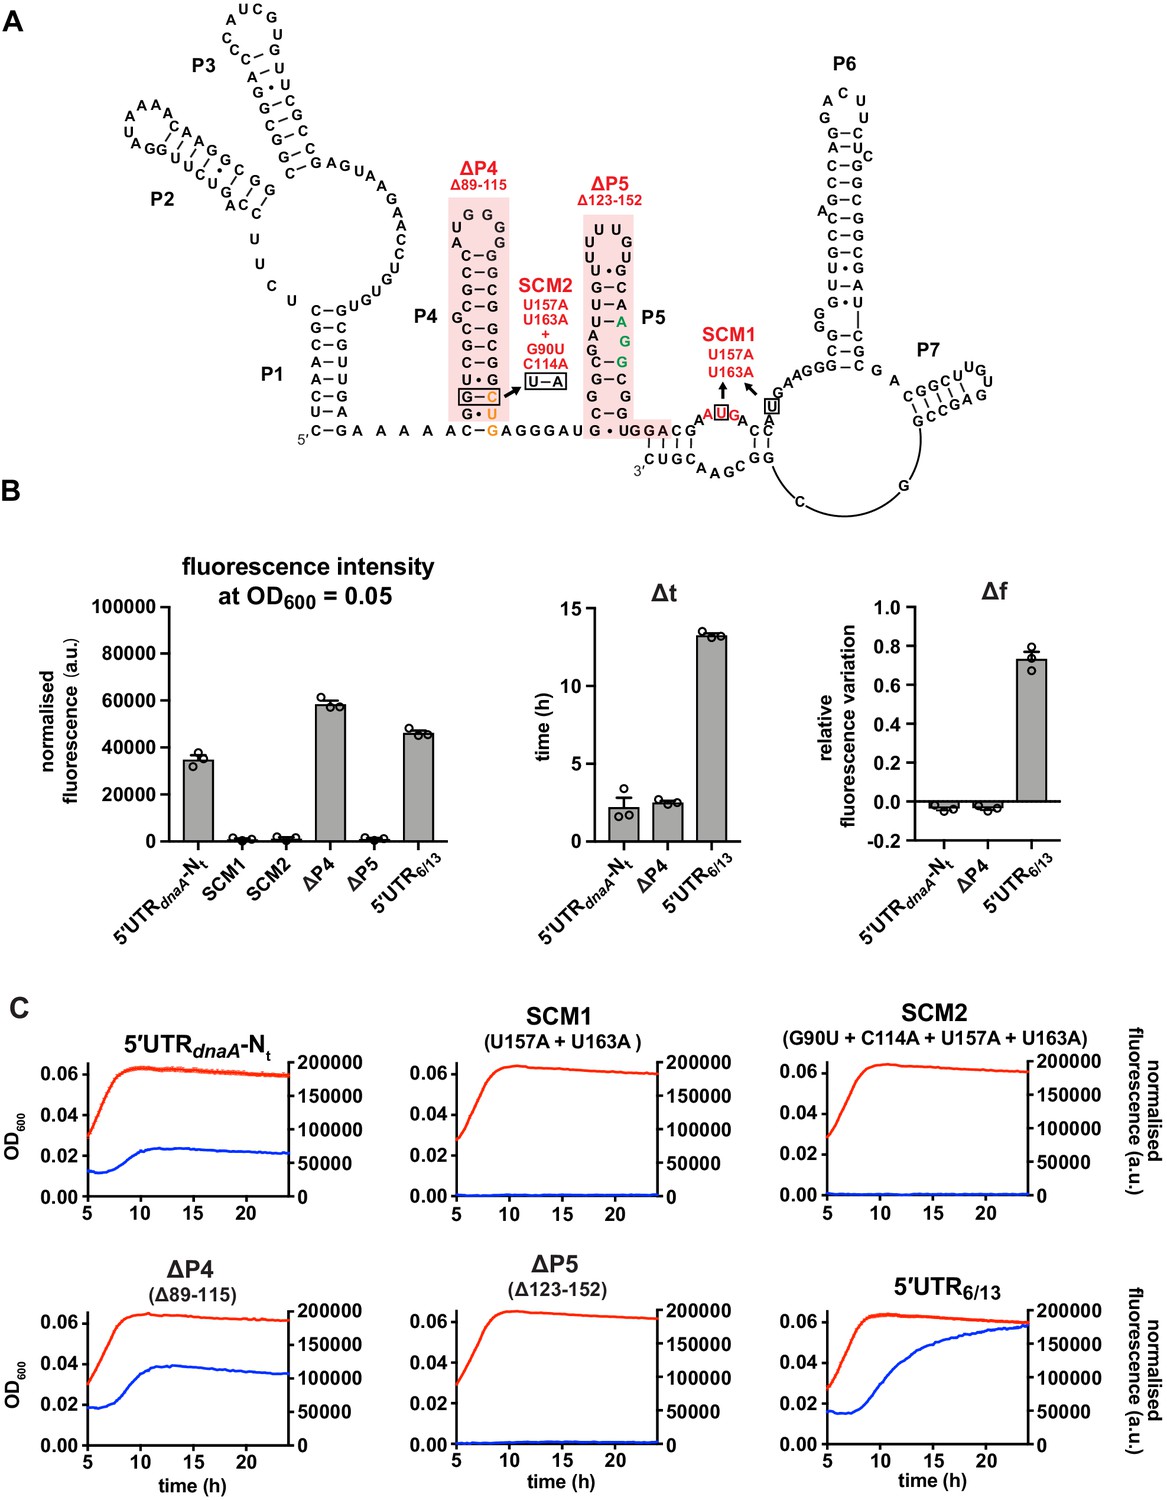
(A) Start codon mutant 1 (SCM1) disrupts the canonical AUG start site (red). In the double mutant SCM2, the upstream CUG codon (orange) is additionally mutated to AUG. ΔP4 and ΔP5: deletions of secondary elements P4 and P5 as indicated (shaded in red). The ΔP5 mutation preserves the frame between the CUG and AUG codons. The putative Shine–Dalgarno (SD)-like sequence is shown in green. (B) Values of fluorescence intensity at OD600 = 0.05, Δt and Δf calculated for the reporter mutant strains in (A). (C) Growth curves and fluorescence kinetic profiles of the reporter mutant strains in (A). Averages of three independent replicates are shown with error bars representing standard errors.
Figure 3—figure supplement 3
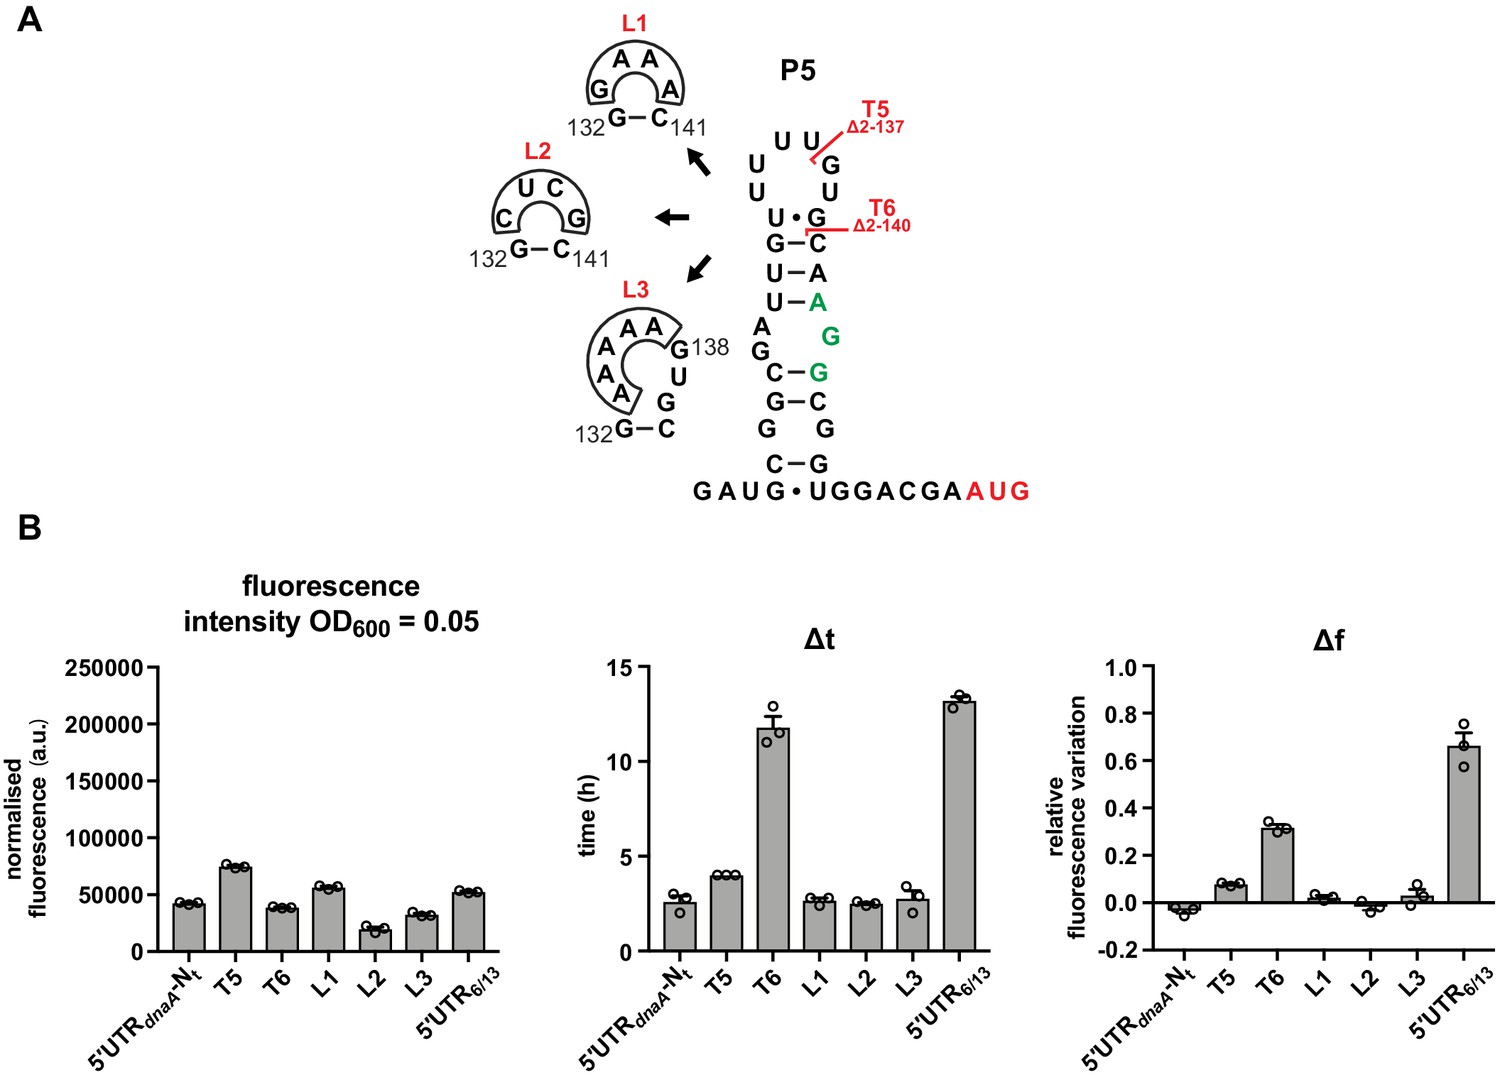
The loop region of P5 does not have a role in DnaA translation regulation.
(A) Schematics of T5 and T6 5'UTR truncation mutants, and the loop P5 mutations (L1–L3). The start codon and the putative Shine–Dalgarno (SD)-like sequence are coloured in red and green, respectively. (B) Values of fluorescence intensity at OD600 = 0.05, Δt and Δf calculated for the mutant strains in (A). For the fluorescence kinetic profiles, see Figure 3—figure supplement 1B. Averages of three independent replicates are shown with error bars representing standard errors.
Figure 4 with 3 supplements

The mRNA region encoding the N-terminus of DnaA mediates the nutritional control of translation independently of the choice of the 5'UTR.
(A) Schematic illustration of the reporter constructs utilised to study the role of the mRNA region encoding DnaA Nt in the translational response to carbon starvation. In the 5'UTRx-Nt constructs (top), the dnaA promoter (PdnaA) was fused to one of three possible 5'UTRs (5’UTRx = 5'UTRdnaA, 5'UTR6/13, and 5'UTRlac; grey) followed by the first 26 codons of dnaA open reading frame (Nt dnaA; orange) and the eGFP gene (green). In the 5'UTRx-ΔNt constructs (bottom), the Nt module is absent. (B) Growth curves and fluorescence kinetic profiles of the 5'UTRx-Nt (red and blue) and 5'UTRx-ΔNt (orange and green) constructs. (C) Δt and Δf values of the 5'UTRx-Nt and 5'UTRx-ΔNt reporter constructs. (D) The 5'UTRdnaA-2 x Nt reporter construct was obtained by duplicating the Nt module (orange). (E) Values of fluorescence intensity at OD600 = 0.05, Δt and Δf calculated for the 2 x Nt strain. The relative growth curves and fluorescence kinetic profiles are shown in Figure 4—figure supplement 1. All data are shown as averages of three independent replicates with error bars representing standard errors.
Figure 4—figure supplement 1
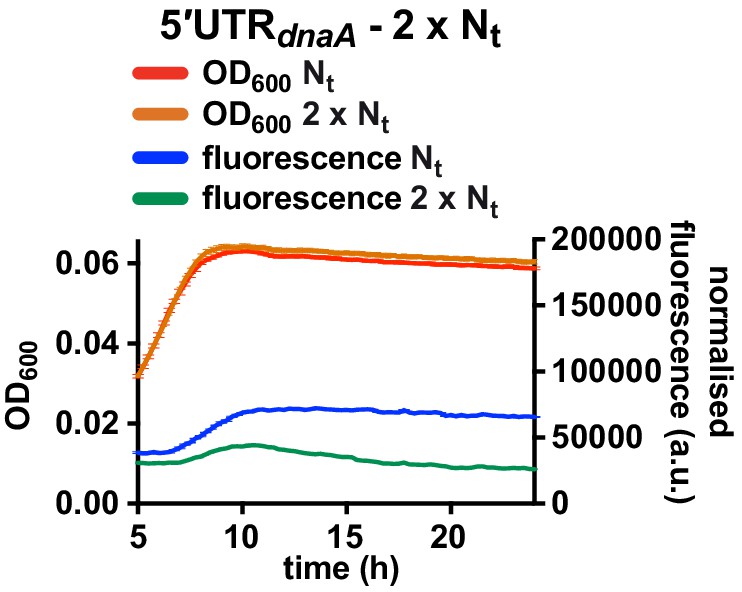
Fluorescence kinetic profile and growth curve of the 2 x Nt reporter strain.
Comparison between the 5'UTR-Nt (red and blue) and the 2 x Nt (orange and green) reporter strains (see Figure 4D and E). Averages of three independent replicates are shown with error bars representing standard errors.
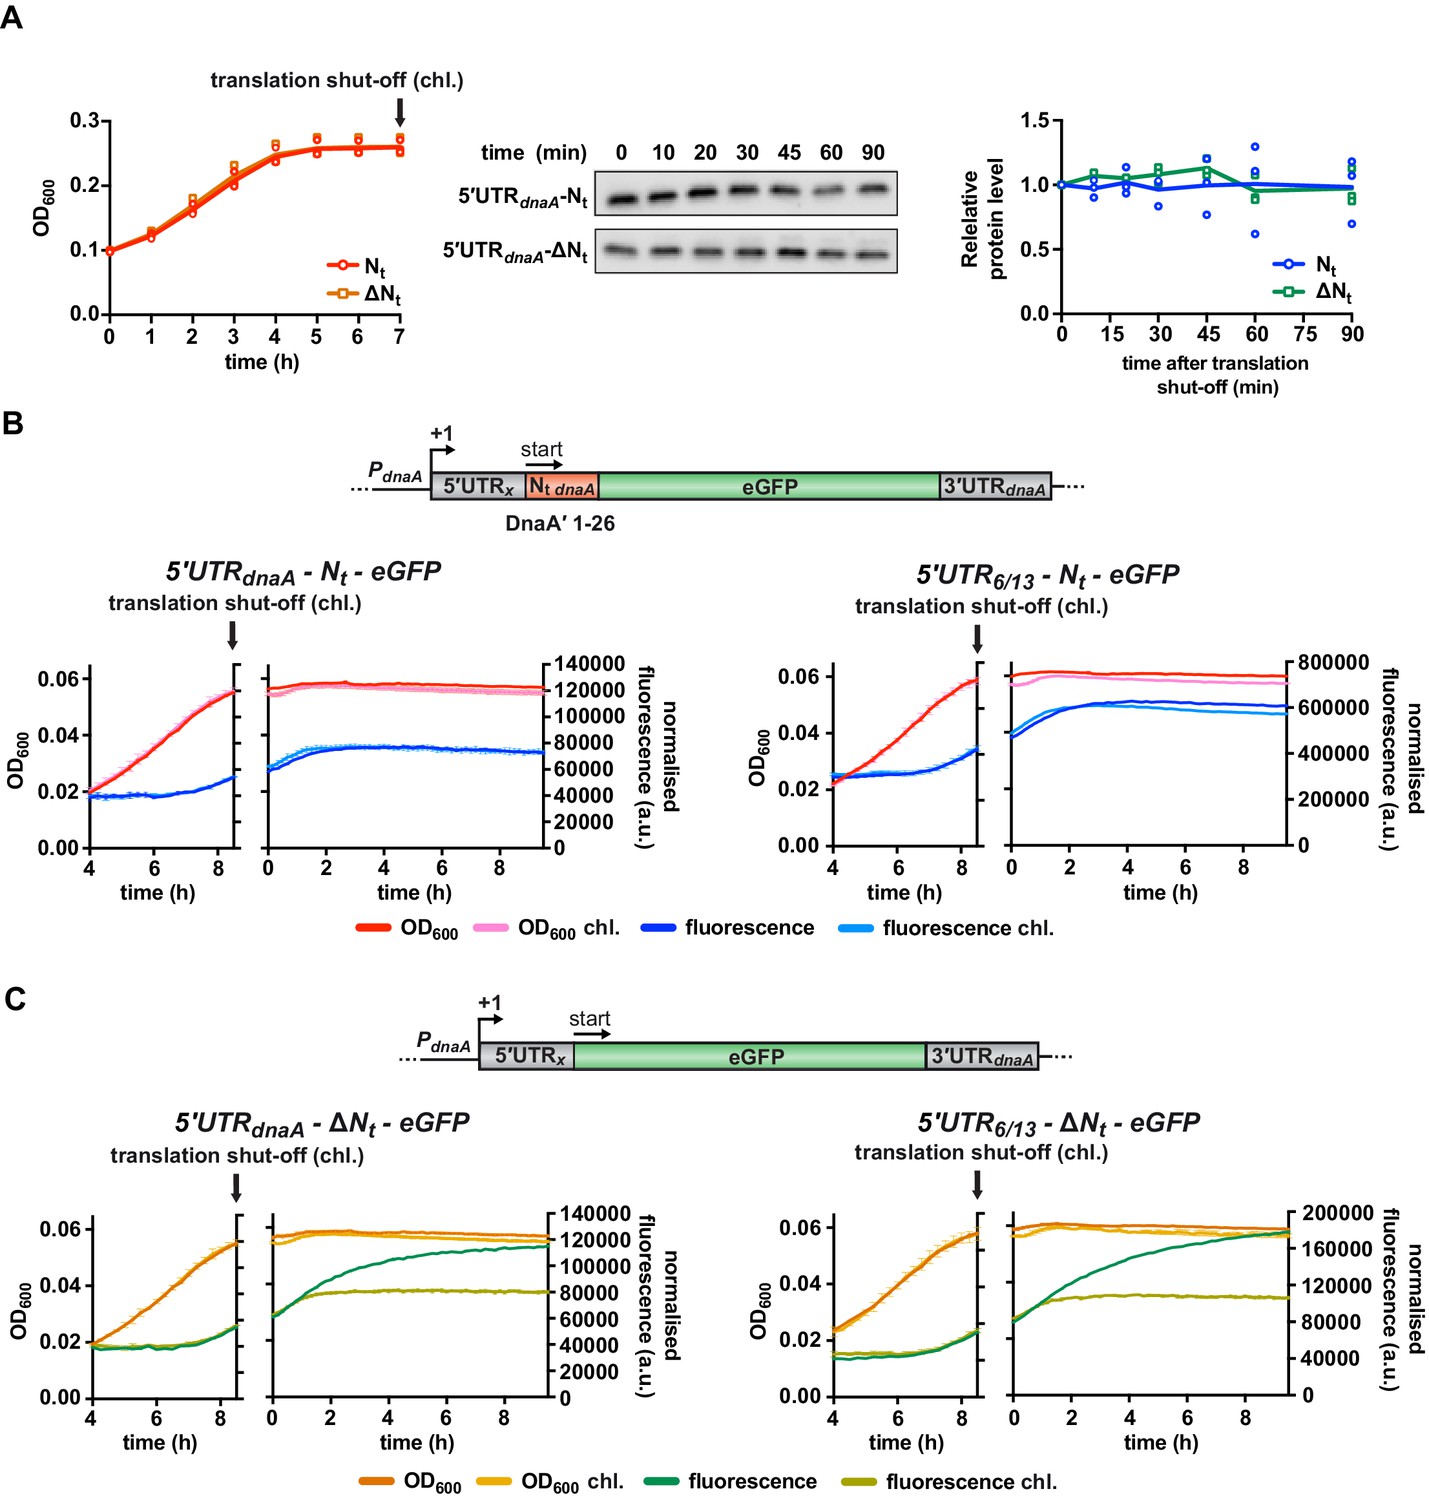
Figure 4—figure supplement 2
The presence of DnaA Nt at the N-terminus of eGFP does not change protein stability.
(A) Western blot-based translation shut-off assay. The 5'UTRdnaA-Nt and 5'UTRdnaA-ΔNt reporter strains were cultured in M2G1/10 medium for 7 hr until growth arrested (left panel). Translation was shut off by adding chloramphenicol (100 µg/mL), and the decrease in eGFP abundance was monitored for 90 min by western blot (middle panel). Right panel: quantification of band intensities. Averages of three independent replicates are shown with error bars representing standard errors. (B, C) eGFP translation shut-off assay using fluorescence as a read-out of protein abundance. Reporter strains were grown on M2G1/10 in a plate reader for 8.5 hr (i.e., onset of carbon starvation). Translation was stopped by adding chloramphenicol (100 µg/mL) to the culture. Bulk culture fluorescence was measured at regular intervals over 10 hr. (B) Fluorescence kinetic profiles of the 5'UTRx-Nt strains (5'UTRx = 5'UTRdnaA or 5'UTR6/13) in the presence (light blue) or absence (dark blue) of chloramphenicol treatment. (C) Fluorescence kinetic profiles of the 5'UTRx-ΔNt strains (5'UTRx = 5'UTRdnaA or 5'UTR6/13) in the presence (light green) or absence (dark green) of chloramphenicol treatment. Averages of three independent replicates are shown with error bars representing standard errors.
-
Figure 4—figure supplement 2—source data 1
Source data for Figure 4—figure supplement 2.
- https://cdn.elifesciences.org/articles/71611/elife-71611-fig4-figsupp2-data1-v1.zip
Figure 4—figure supplement 3
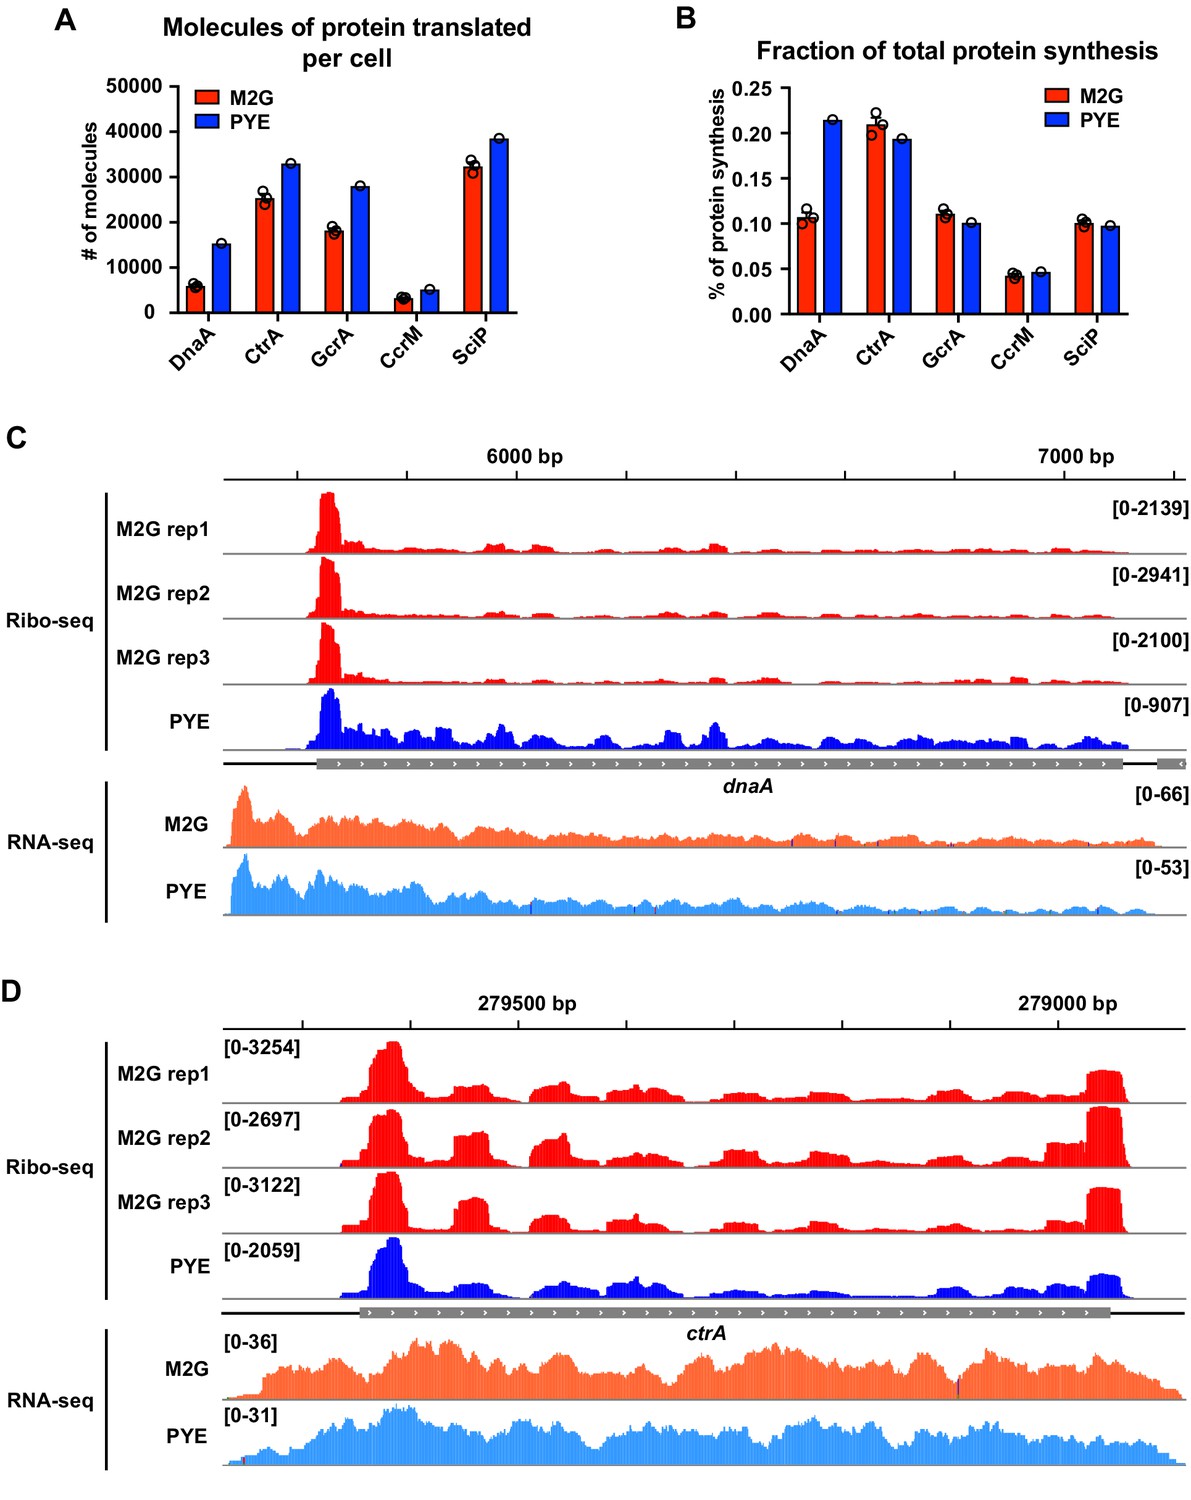
Ribosome profiling data indicating a role of Nt in the growth medium-dependent regulation of DnaA translation.
Quantification of (A) the absolute number of DnaA molecules translated per cell and (B) the fraction of total protein synthesis as reported by Aretakis et al., 2019. Average ribosome densities measured by ribosome profiling in M2G (red, n = 3) and PYE (blue, n = 1) were used for the quantifications (see Aretakis et al., 2019 for details). The Caulobacter cell cycle master regulators CtrA, GcrA, CcrM, and SciP are shown as a comparison. (C, D) Ribosome footprint density along dnaA and ctrA ORFs. Ribosome occupancy profiles measured in M2G (n = 3) and PYE (n = 1) are shown in red and blue, respectively. Normalised RNA-seq coverage plots in M2G and PYE are shown in orange and light blue, respectively (n = 1). Genomic coordinates are reported on the top of each panel. Ribosome profiling data in M2G are from Aretakis et al., 2019. Ribosome profiling data in PYE and RNA-seq data are from Schrader et al., 2014. The RNA-seq and ribosome profiling coverage plots were generated using IGV.
Figure 5 with 3 supplements
A specific amino acid sequence motif in the N-terminus of DnaA inhibits translation elongation under carbon starvation.
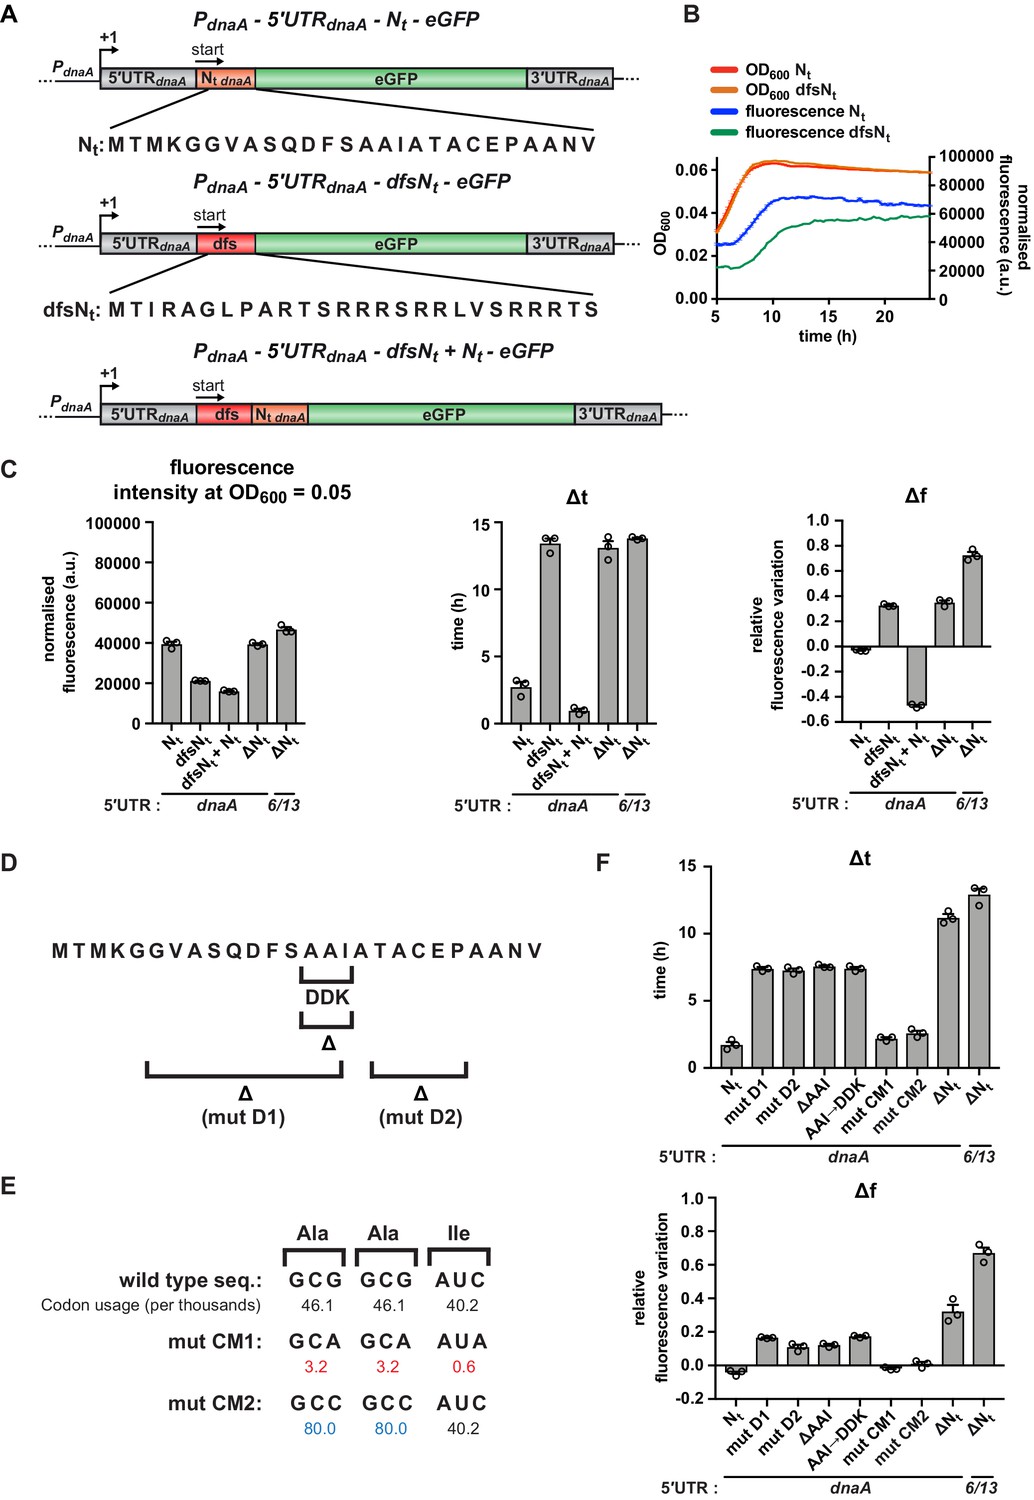
(A) Schematic illustration of the double frameshift mutant reporter constructs. Top: wild-type amino acid sequence of DnaA Nt in the context of the 5'UTRdnaA-Nt reporter construct. Middle: the double frameshift mutation alters the reading frame of Nt (dfsNt module, in red), without affecting the eGFP frame. Bottom: the 5'UTRdnaA-dfsNt+ Nt construct was generated by introducing the aforementioned double frameshift mutation in the first Nt module of the 2 x Nt construct (Figure 4D). (B) Comparison of fluorescence kinetic profiles between the 5'UTR-Nt (blue) and the dfsNt (green) reporter strains. (C) Values of fluorescence intensity at OD600 = 0.05, Δt and Δf calculated for the reporter strains in (A). (D) Illustration of deletions D1, D2, and ΔAAI, and the amino acid substitution AAI→DDK. (E) Illustration of the AAI motif codon mutations CM1 and CM2. Top: the wild-type codon sequence encoding the AAI motif, along with the values of codon usage. In mutant CM1 and CM2, the AAI motif is encoded by codons that present either lower (values in red) or higher (values in blue) usage. (F) Values of Δt and Δf calculated for the mutant reporter strains illustrated in (D) and (E). Data are reported as averages of three independent replicates with error bars representing standard errors.
Figure 5—figure supplement 1
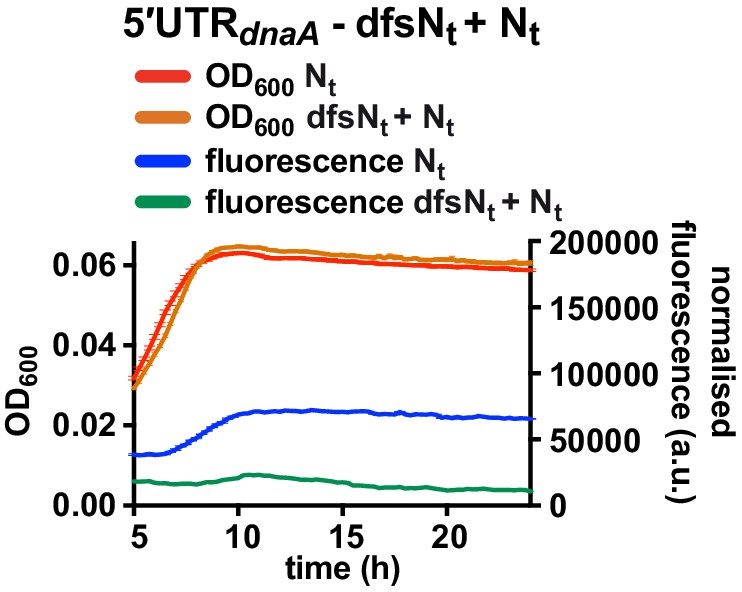
Fluorescence kinetic profile and growth curve of the dfsNt+ Nt reporter strain.
Comparison between the 5'UTR-Nt (red and blue) and the dfsNt+ Nt (orange and green) reporter strains (see Figure 5A and C). Averages of three independent replicates are shown with error bars representing standard errors.
Figure 5—figure supplement 2
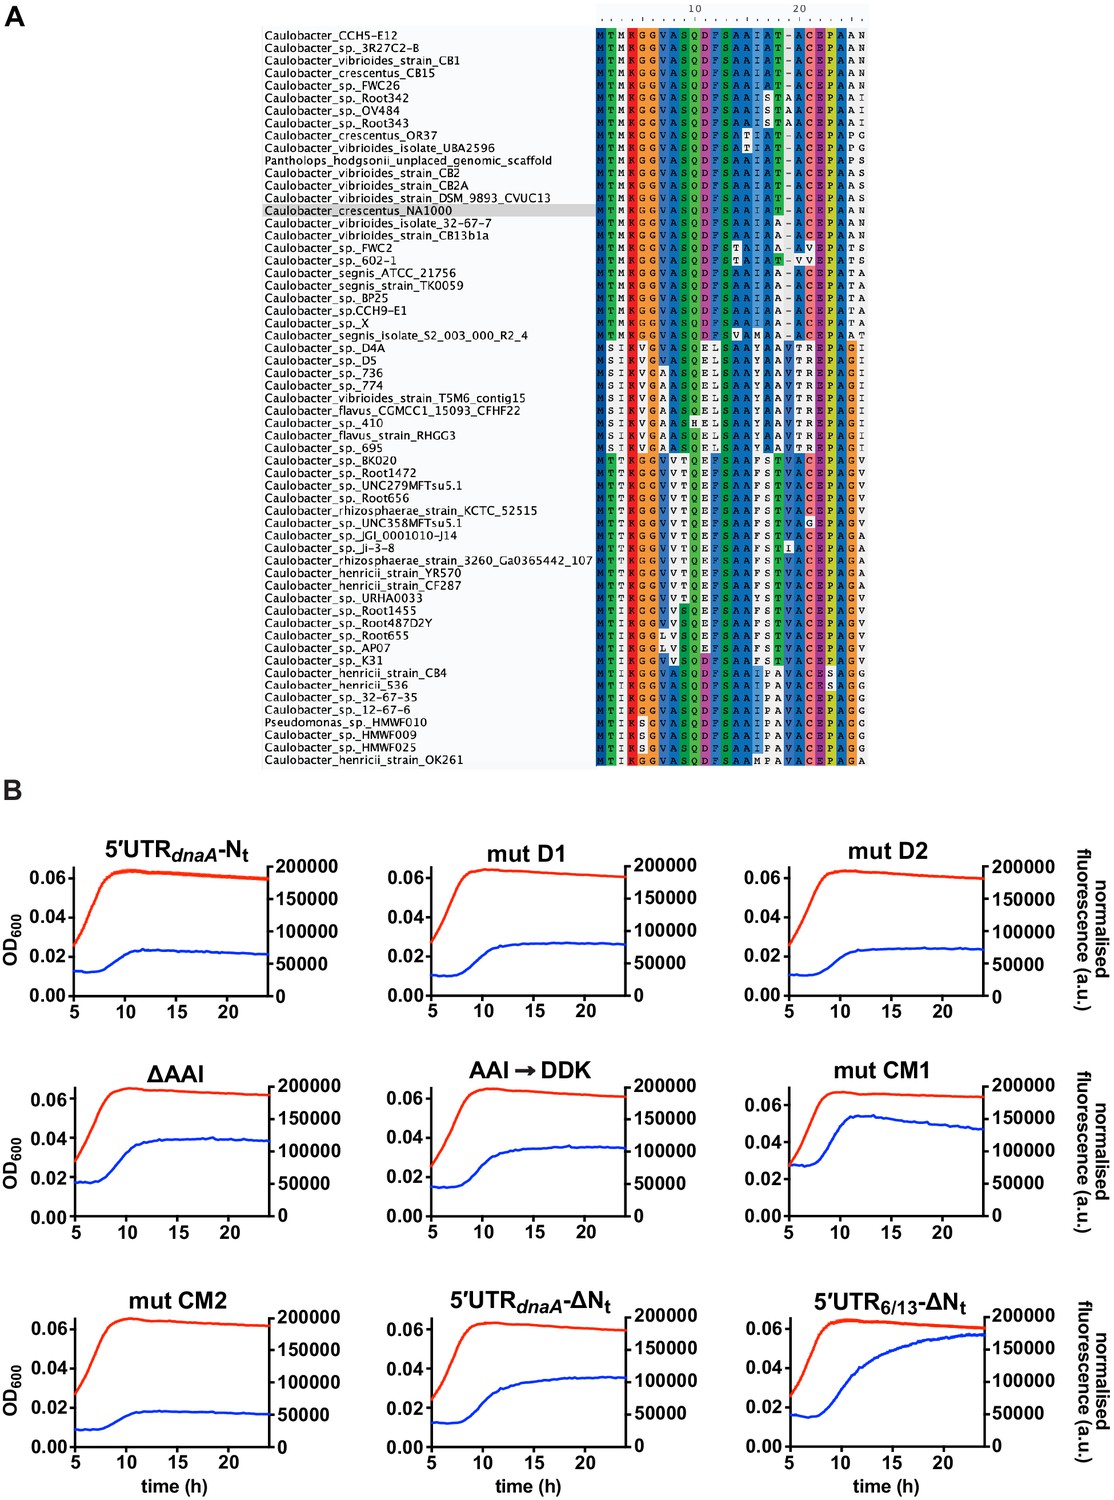
Fluorescence kinetic profiles and growth curves of the reporter strains carrying mutations in DnaA Nt.
(A) Amino acid sequence conservation of DnaA Nt. 59 homologous sequences from the Caulobacteraceae family were aligned using MUSCLE. Caulobacter crescentus NA1000 sequence is highlighted in grey. (B) Fluorescence kinetic profiles of the reporter strains carrying the deletions D1, D2, ΔAAI, the amino acid substitution AAI→DDK and the codon mutations CM1 and CM2 (see Figure 5D–F). The profiles of the 5'UTR-Nt, 5'UTR-ΔNt, and 5'UTR6/13 strains are shown for comparison. Averages of three independent replicates are shown with error bars representing standard errors.
Figure 5—figure supplement 3
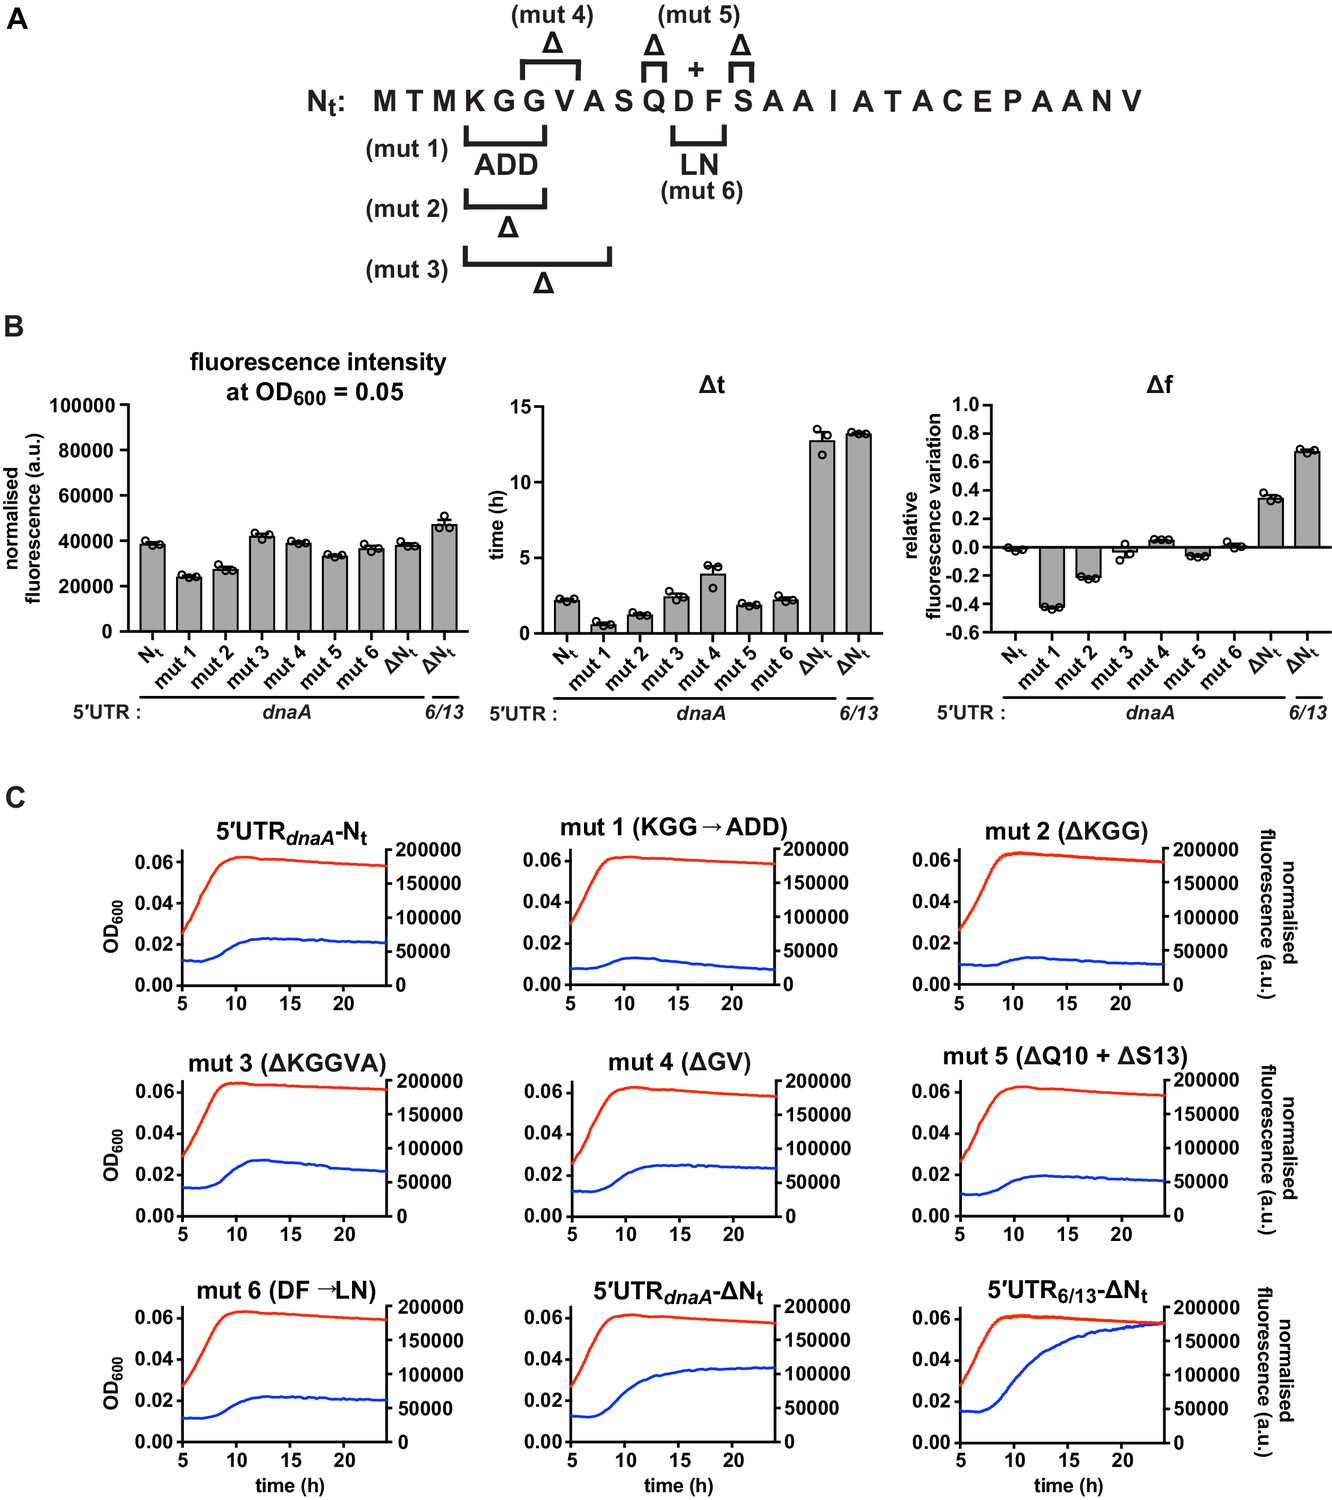
Additional mutations in the Nt amino acid sequence.
(A) Schematic illustration mutations mut 1–6. (B) Values of fluorescence intensity at OD600 = 0.05, Δt and Δf calculated for the mutant reporter strains illustrated in (A). (C) Growth curves and fluorescence kinetic profiles of reporter strains shown in (A), with profiles of the 5'UTR-Nt and 5'UTR6/13 strains for comparison. Averages of three independent replicates are shown with error bars representing standard errors.
Figure 6 with 1 supplement
Starvation-induced inhibition of DnaA translation elongation by an autonomously operating nascent chain sequence element.
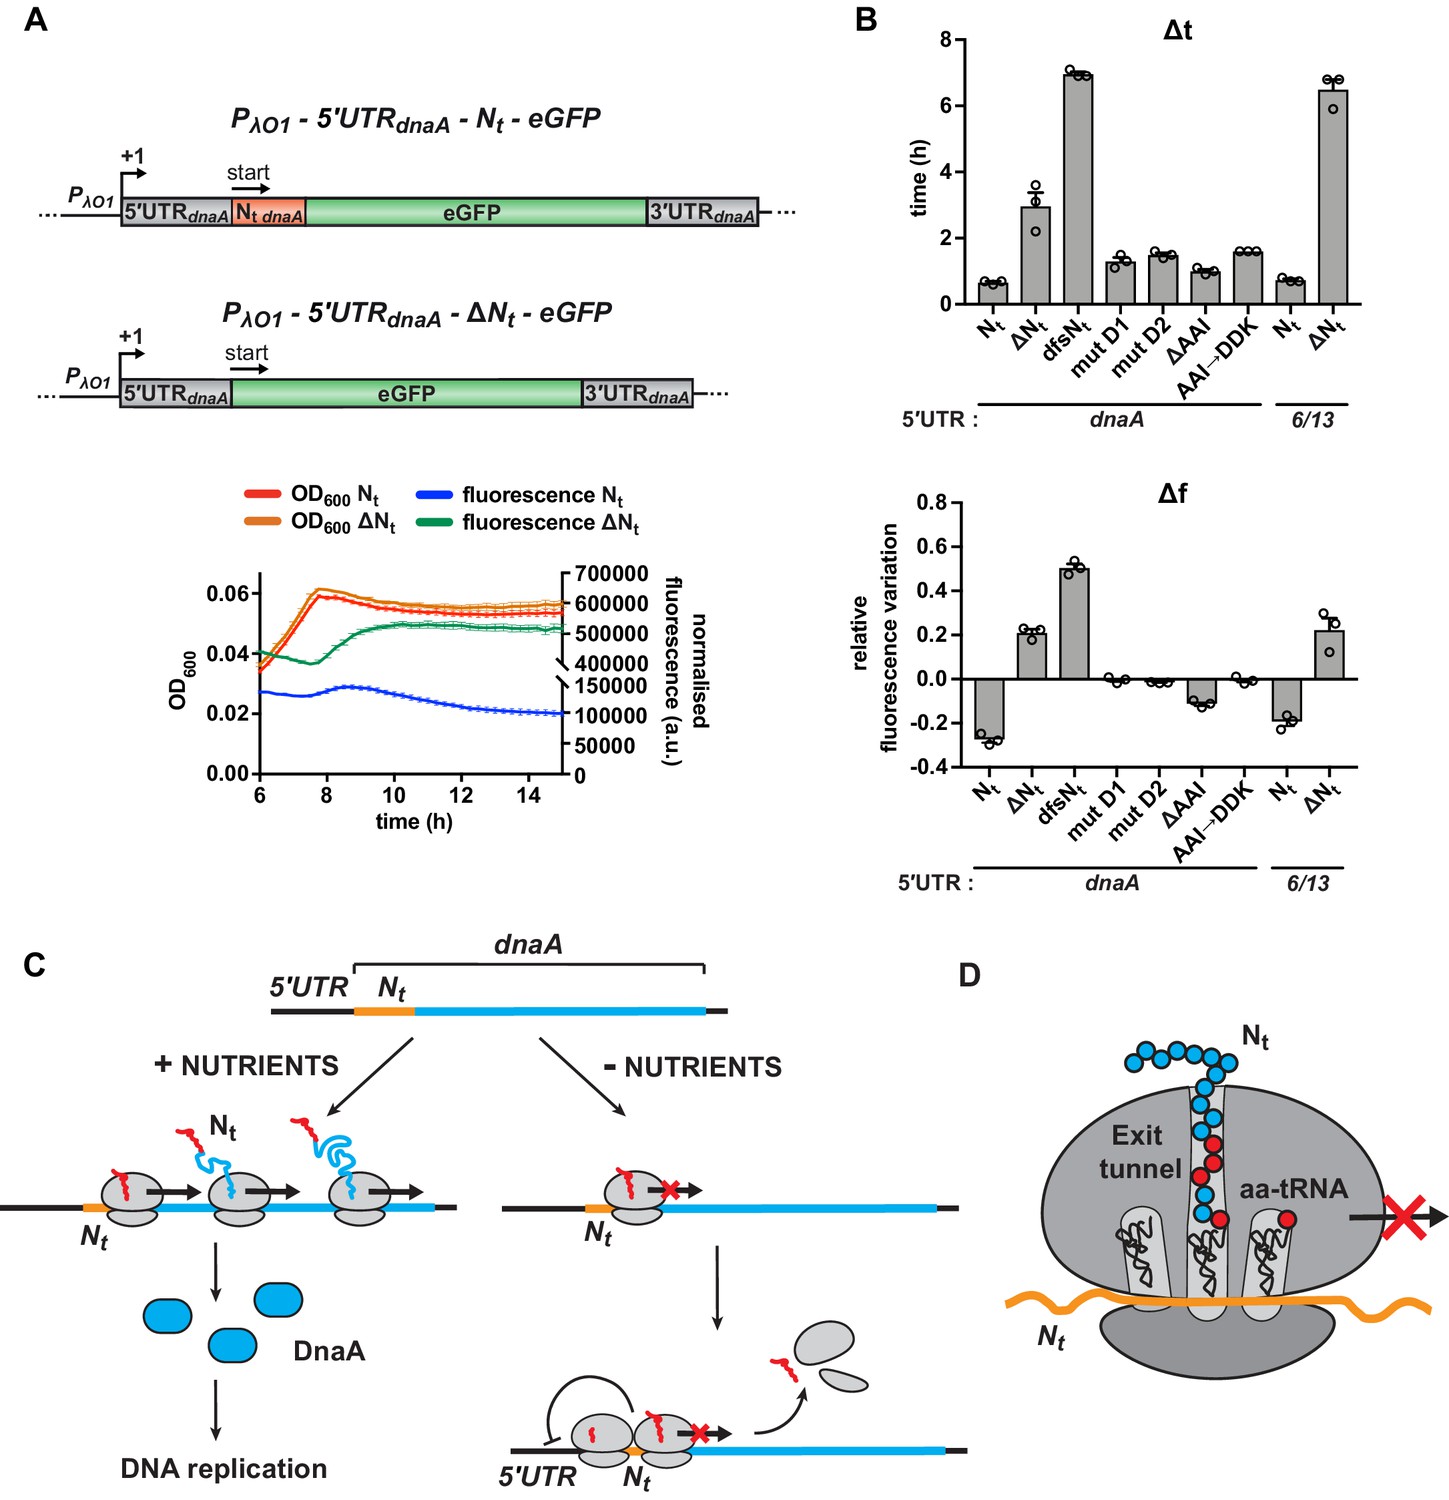
(A) Schematic illustration of the reporter constructs utilised to study DnaA Nt functionality in the heterologous host E. coli. In the 5'UTRdnaA-Nt constructs (top), the IPTG-inducible Lambda promoter O1 (PλO1) was fused to the 5'UTRdnaA (grey) followed by Caulobacter’s Nt (Nt dnaA - orange) and eGFP (green). The 5'UTRdnaA-ΔNt constructs (below) lack the Nt module. The constructs were cloned into the low-copy plasmid pZE12 and transformed into E. coli MG1655. The E. coli reporter strains were grown for 15 hr in M9 medium supplemented with 0.02% glucose in a microplate reader. Normalised culture fluorescence was measured to monitor eGFP synthesis in the reporter strains (5'UTRdnaA-Nt versus 5'UTRdnaA-ΔNt, lower panel). (B) Values of Δt and Δf calculated for the strains in (A), the Nt mutants and the 5'UTR6/13 reporter strains. The relative growth curves and fluorescence kinetic profiles are shown in Figure 6—figure supplement 1. Background subtraction, fluorescence normalisation, and Δt and Δf quantifications were performed as described for the Caulobacter reporter strains. Data are reported as averages of three independent replicates with error bars representing standard errors. (C) The proposed model for the regulation dnaA translation under carbon starvation. In the presence of nutrients (left-hand side), dnaA mRNA is efficiently translated, leading to accumulation of active DnaA (light blue) that, in turn, triggers DNA replication initiation. Under carbon starvation (right-hand side), translation rate decreases during the first stages of the elongation phase at a specific sequence located downstream of the translation start site (Nt ; orange). The resulting ribosome traffic jams possibly stimulate disassembly of the leading ribosome from the mRNA and/or inhibit new cycles of translation initiation. The regulatory nascent polypeptide (Nt) is shown in red. (D) The downregulation of dnaA translation requires specific amino acid residues (in red) encoded in the region downstream of the start codon (Nt; orange). These specific amino acids arrest translation after or while being added to the growing DnaA nascent polypeptide (Nt).
Figure 6—figure supplement 1
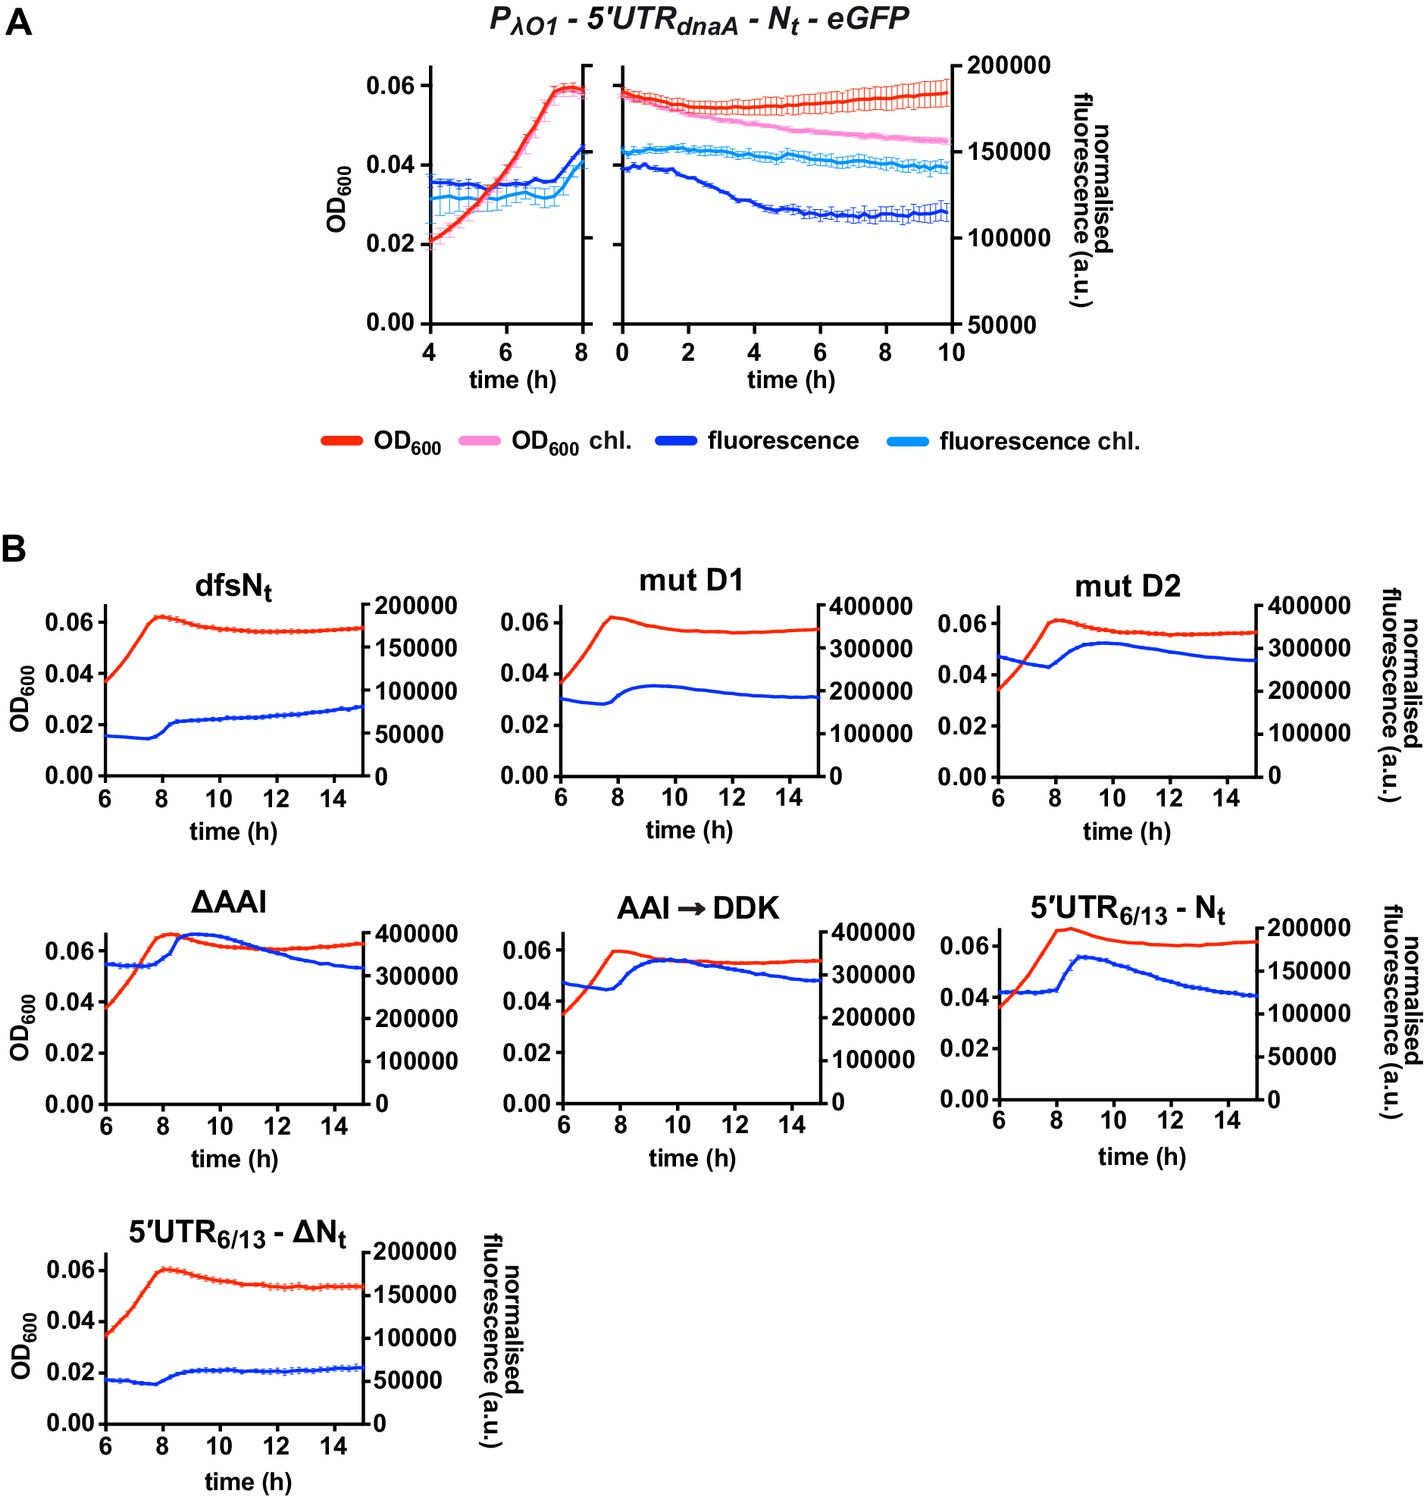
The presence of DnaA Nt at the N-terminus of eGFP does not change protein stability in the E. coli reporter.
(A) eGFP translation shut-off assay using fluorescence as a read-out of protein abundance. The 5'UTRdnaA-Nt E. coli reporter strain was grown on M29G1/10 in a plate reader for 8 hr. Translation was stopped by adding chloramphenicol (200 µg/mL) to the culture. Bulk culture fluorescence was measured at regular intervals over 10 hr. The fluorescence kinetic profile and growth curve of the sample treated with chloramphenicol are illustrated in light blue and pink, respectively, while the ones of the untreated sample are shown in dark blue and red, respectively. (B) Fluorescence kinetic profiles and growth curves of the 5'UTR6/13 and 5'UTR6/13-Nt E. coli reporter strains and of the Nt mutants. Averages of three independent replicates are shown with error bars representing standard errors.
Tables
Key resources table
| Reagent type (species) or resource | Designation | Source or reference | Identifiers | Additional information |
|---|---|---|---|---|
| Gene (Caulobacter crescentus) | dnaA CCNA_00008 | GenBank | YP_002515383.1 | |
| Strain, strain background (Caulobacter crescentus) | NA1000 | Michael Laub, Massachusetts Institute of Technology | Electrocompetent cells | |
| Strain, strain background (Escherichia coli) | DH5α | Michael Laub, Massachusetts Institute of Technology | Chemical competent cells. | |
| Strain, strain background (Escherichia coli) | MG1655 | Michael Laub, Massachusetts Institute of Technology | ||
| Antibody | Anti-DnaA (rabbit polyclonal) | Jonas et al., 2011 | (1:5,000) | |
| Antibody | Anti-GFP (rabbit polyclonal) | Thermo Fisher Scientific | Cat# A11122 RRID: AB_221569 | (1:20,000) |
| Antibody | Anti-rabbit IgG (H + L) secondary antibody, HRP (goat polyclonal) | Thermo Fisher Scientific | Cat# 31460 RRID: AB_228341 | (1:5,000) |
| Recombinant DNA reagent | pMR10 (plasmid) | Michael Laub, Massachusetts Institute of Technology (Roberts et al., 1996) | ||
| Recombinant DNA reagent | pMCS (plasmid) | Martin Thanbichler, MPI Marburg (Thanbichler et al., 2007) | ||
| Recombinant DNA reagent | pZE12-luc (plasmid) | Victor Sourjik, MPI Marburg (Lutz and Bujard, 1997) | ||
| Sequence-based reagent | fw 1 (DNA oligonucleotide) | This paper (synthesised by Sigma-Aldrich-Merck) | Amplification of the DNA template for in vitro transcription. GAAATTAATACGACTCACTATAGCTCAACGCTCTTCCAGTCTTGG | |
| Sequence-based reagent | fw 2 (DNA oligonucleotide) | This paper (synthesised by Sigma-Aldrich-Merck) | Amplification of the DNA template for sequencing reaction. CAAATATTTACAAAGGCCGATCAGGG | |
| Sequence-based reagent | primer A (DNA oligonucleotide) | This paper (synthesised by Sigma-Aldrich-Merck) | Probing, toeprinting, and amplification of the DNA template for in vitro transcription and sequencing reaction. CACCCAGCTCACGCTTCAAAG | |
| Sequence-based reagent | primer B (DNA oligonucleotide) | This paper (synthesised by Sigma-Aldrich-Merck) | Probing. GAGAAGTCCTGGCTGGCAAC | |
| Chemical compound, drug | Kanamycin | Carl Roth | Cat# T832.5 CAS: 25389-94-0 | 1 μg/mL (PYE and M2G liquid) 30 μg/mL (LB liquid) 25 μg/mL (LB plates) |
| Chemical compound, drug | Ampicillin | Carl Roth | Cat# K029.4 CAS: 69-52-3 | 50 μg/mL (LB liquid) 100 μg/mL (LB plates) |
| Chemical compound, drug | Chloramphenicol | Carl Roth | Cat# 3886.1 CAS: 56-75-7 | 100 µg/mL (translation shut-off in Caulobacter) 200 µg/mL (translation shut-off in E. coli) |
| Chemical compound, drug | IPTG | Sigma-Aldrich | Cat# PHG0010 CAS 367-93-1 | 1 mM |
| Chemical compound, drug | [γ-P32]-ATP (10 mCi/mL, 3000 Ci/mmol) | Perkin Elmer | Cat# BLU002A CAS: 2964-07-0 | |
| Chemical compound, drug | Pb2+ acetate | Sigma-Aldrich-Merck | Cat# 215902 CAS: 6080-56-4 | Chemical probe |
| Commercial assay or kit | SuperSignal Femto West reagent | Thermo Fisher Scientific | Cat# 34094 | |
| Commercial assay or kit | Calf Intestinal Alkaline Phosphatase (CIAP) | Invitrogen | Cat# 18009-019 | |
| Commercial assay or kit | T4 Polynucleotide Kinase (PNK) | Thermo Fisher Scientific | Cat# EK0031 | |
| Commercial assay or kit | RNase T1 | Invitrogen | Cat# AM2283 | |
| Commercial assay or kit | RNase V1 | Invitrogen | Cat# AM2275 | |
| Commercial assay or kit | Megascript Kit | Life Technologies | Cat# AM1330 | |
| Commercial assay or kit | SuperScript IV reverse transcriptase | Invitrogen | Cat# 18090010 | |
| Commercial assay or kit | Sequenase Cycle Sequencing Kit | Affymetrix | Cat# 78500 | |
| Software, algorithm | mFold | Zuker, 2003 http://www.unafold.org/ | RRID: SCR_008543 | |
| Software, algorithm | ViennaRNA (RNAfold, RNAcofold) | Gruber et al., 2008 http://rna.tbi.univie.ac.at/ | RRID:SCR_008550 | |
| Software, algorithm | CMfinder | Zasha Weinberg, Leipzig University (Yao et al., 2006) | Version 0.4.1.4 | |
| Software, algorithm | Fiji (ImageJ) | Rueden et al., 2017 https://fiji.sc/ | RRID:SCR_002285 | |
| Software, algorithm | Image Lab | Bio-Rad https://www.bio-rad.com/en-ca/product/image-lab-software | RRID:SCR_014210 | Version 6.0 |
| Software, algorithm | NCBI BLAST (BLASTn, BLASTp, tBLASTn) | Altschul et al., 1990 https://blast.ncbi.nlm.nih.gov/ | RRID:SCR_004870 | |
| Software, algorithm | mafft | Katoh and Standley, 2013 https://mafft.cbrc.jp/alignment/software/ | RRID:SCR_011811 | Version 7.427 |
| Software, algorithm | IQTREE | Nguyen et al., 2015 http://www.iqtree.org/release/v1.6.10 | Version 1.6.10 | |
| Software, algorithm | SeaView | Gouy et al., 2010 http://doua.prabi.fr/software/seaview | RRID:SCR_015059 | Version 5.0.4 |
| Software, algorithm | R (including splines package) | R Project https://www.R-project.org/ | RRID:SCR_001905 | |
| Software, algorithm | GraphPad Prism | https://www.graphpad.com | RRID:SCR_002798 | Version 7.0 |
| Software, algorithm | Bowtie | Langmead et al., 2009 http://bowtie-bio.sourceforge.net/index.shtml | RRID:SCR_005476 | Version 1.2.2 |
| Software, algorithm | SAMtools | Li et al., 2009 http://htslib.org/ | RRID:SCR_002105 | |
| Software, algorithm | Integrative Genomics Viewer (IGV) | Robinson et al., 2011 http://www.broadinstitute.org/igv/ | RRID:SCR_011793 | Version 2.10.2 |
| Other | Yeast tRNA | Invitrogen | Cat# AM7119 | |
| Other | E. coli30S subunit | Romilly et al., 2019 | ||
| Other | E. coli initiator tRNAfMet | Romilly et al., 2019 | ||
| Other | 12% Mini-PROTEAN TGX Stain-Free gels | Bio-Rad | Cat# 4568046 | |
| Other | Trans-Blot Turbo System | Bio-Rad | Cat# 1704150EDU | |
| Other | LI-COR Odyssey Fc imaging system | LI-COR | https://www.licor.com/bio/odyssey-fc/ | |
| Other | G-50 Microspin columns | GE Healthcare | Cat# 27-5330-01 | |
| Other | Personal Molecular Imager (PMI) system | Bio-Rad | Cat# 170-9400 | |
| Other | 96-well transparent plates with flat-bottom and lid | Greiner Bio-One | Cat# 655182 | |
| Other | Spark multimode microplate reader | TECAN | https://lifesciences.tecan.com/multimode-plate-reader |
Additional files
-
Supplementary file 1
pMR10 and pZE12 reporter plasmids construction.
- https://cdn.elifesciences.org/articles/71611/elife-71611-supp1-v1.docx
-
Supplementary file 2
List of bacterial strains generated in this study.
- https://cdn.elifesciences.org/articles/71611/elife-71611-supp2-v1.docx
-
Transparent reporting form
- https://cdn.elifesciences.org/articles/71611/elife-71611-transrepform1-v1.docx
Download links
A two-part list of links to download the article, or parts of the article, in various formats.
Downloads (link to download the article as PDF)
Open citations (links to open the citations from this article in various online reference manager services)
Cite this article (links to download the citations from this article in formats compatible with various reference manager tools)
A nascent polypeptide sequence modulates DnaA translation elongation in response to nutrient availability
eLife 10:e71611.
https://doi.org/10.7554/eLife.71611


