Multi-omic rejuvenation of human cells by maturation phase transient reprogramming
- Epigenetics Programme, Babraham Institute, United Kingdom
- Imaging Facility, Babraham Institute, United Kingdom
- Chronomics Limited, United Kingdom
- Laboratory for Epigenetic Mechanisms/Chromosome Dynamics Lab, Instituto Gulbenkian de Ciência, Portugal
- Wellcome Trust Sanger Institute, Hinxton, United Kingdom
- Centre for Trophoblast Research, University of Cambridge, United Kingdom
Figures
Figure 1 with 1 supplement
Transiently reprogrammed cells reacquire their initial cellular identity.
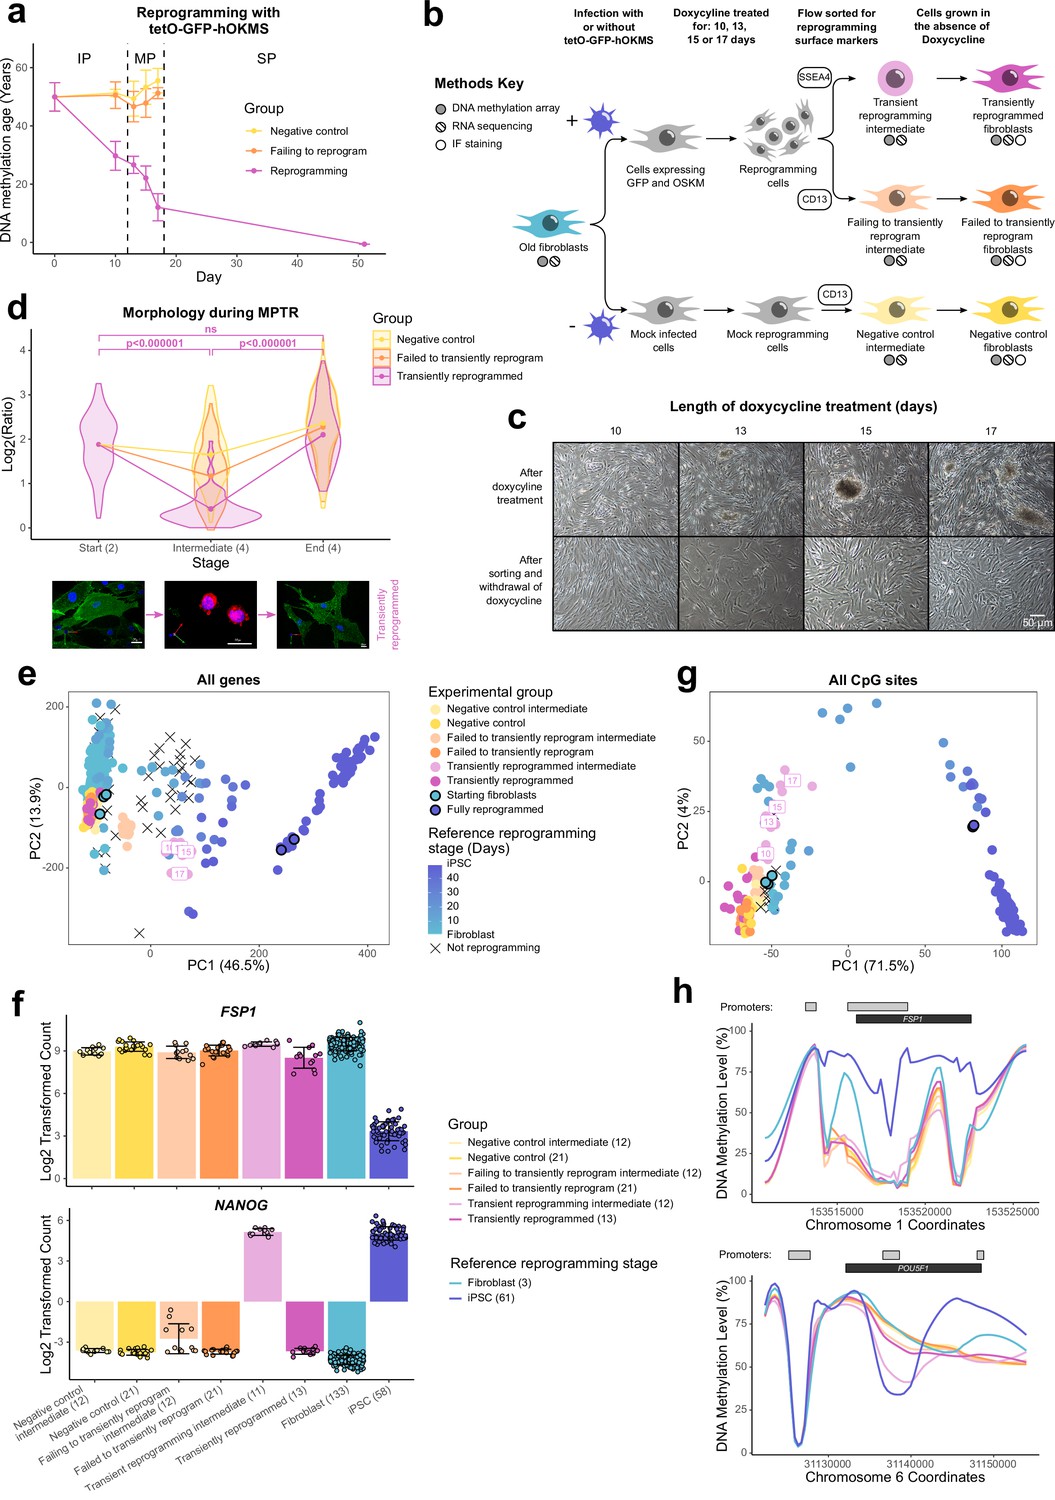
(A) Mean DNA methylation age (calculated using the multi-tissue clock; Horvath, 2013) throughout the reprogramming process where cells were transduced with our tetO-GFP-hOKMS vector and treated continuously with 2 µg/ml of doxycycline. Reprogramming is divided in three distinct phases: initiation phase (IP), maturation phase (MP), and stabilization phase (SP). DNA methylation age decreased substantially during the MP of reprogramming in cells that were successfully reprogramming (magenta line) but not in control cells (yellow and orange lines represent non-transduced cells and cells expressing hOKMS but failing to reprogram as indicated by cell surface markers, respectively). Points represent the mean and error bars the standard deviation. N=3 biological replicates per condition, where fibroblasts were derived from different donors. N=2 biological replicates for the iPSC time point (day 51). (B) Experimental scheme for maturation phase transient reprogramming (MPTR). The tetO-GFP-hOKMS reprogramming construct was introduced into fibroblasts from older donors by lentiviral transduction. Alternatively, cells were ‘mock infected’ as a negative control. Following this, cells were grown in the presence of 2 µg/ml doxycycline to initiate reprogramming. At several time points during the MP, cells were flow sorted and successfully reprogramming cells (CD13− SSEA4+) and cells that were failing to reprogram (CD13+ SSEA4−) were collected for analysis. These were termed ‘transient reprogramming intermediate’ and ‘failing to transiently reprogram intermediate,’ respectively. Sorted cells were also further cultured, and grown in the absence of doxycycline for at least 4 weeks—these were termed ‘transiently reprogrammed’ (CD13− SSEA4+) or ‘failed to transiently reprogram’ (CD13+ SSEA4−). (C) Phase-contrast microscope images of cells after doxycycline treatment (transient reprogramming intermediate) and after withdrawal of doxycycline (transiently reprogrammed) as described in (B). The morphology of some cells changed after doxycycline treatment. These cells appeared to form colonies, which became larger with longer exposure to doxycycline. After sorting, these cells were cultured in medium no longer containing doxycycline, and appeared to return to their initial fibroblast morphology. (D) Roundness ratio of cells before, during, and after MPTR (with 13 days of reprogramming). Roundness ratio was calculated by dividing maximum length by perpendicular width. Fibroblasts became significantly rounder during MPTR and returned to a more elongated state upon the completion of MPTR. Values from individual cells have been represented as violin plots. Points represent mean values and are connected with lines. Significance was calculated with a Tukey’s range test. Representative 3D renderings of cells (generated using Volocity) before, during, and after successful transient reprogramming are included below the plot. CD13 is colored in green, SSEA4 is colored in red, and DAPI staining is colored in blue. White scale bars represent a distance of 20 µm. (E) Principal component analysis of transient reprogramming and reference reprogramming sample transcriptomes (light blue to dark blue and black crosses, data from Banovich et al., 2018, Fleischer et al., 2018 and our novel Sendai reprogramming data set). Reference samples form a reprogramming trajectory along PC1. In the Sendai reprogramming reference data set, cells that were not reprogramming (CD13+ SSEA4−) were also profiled and clustered midway along PC1 suggesting some transcriptional changes had still occurred in these cells. Transient reprogramming samples moved along this trajectory with continued exposure to doxycycline (light magenta points) and returned to the beginning of the trajectory after withdrawal of doxycycline (magenta points). Control samples (yellow and orange points) remained at the beginning of the trajectory throughout the experiment. (F) Mean gene expression levels for the fibroblast specific gene FSP1 and the iPSC specific gene NANOG. Transiently reprogrammed samples expressed these genes at levels similar to control fibroblasts. Bars represent the mean and error bars the standard deviation. Samples transiently reprogrammed for 10, 13, 15, or 17 days were pooled. The number of distinct samples in each group is indicated in brackets. (G) Principal component analysis of transient reprogramming (magenta points) and reference reprogramming sample methylomes (light blue to dark blue and black crosses, data from Banovich et al., 2018, Ohnuki et al., 2014 and our novel Sendai reprogramming data set). Reference samples formed a reprogramming trajectory along PC1. Transient reprogramming samples moved along this trajectory with continued exposure to doxycycline (light magenta points) and returned to the beginning of the trajectory after withdrawal of doxycycline (magenta points). Control samples (yellow and orange points) remained at the beginning of the trajectory throughout the experiment. (H) Mean DNA methylation levels across the fibroblast-specific gene FSP1 and the iPSC-specific gene POU5F1 (encoding OCT4). Transiently reprogrammed samples had methylation profiles across these genes that resemble those found in fibroblasts. Gray bars and black bars indicate the locations of Ensembl annotated promoters and genes, respectively. Samples transiently reprogrammed for 10, 13, 15, or 17 days were pooled for visualization purposes. The number of distinct samples in each group is indicated in brackets. iPSC, induced pluripotent stem cell; MPTR, maturation phase transient reprogramming.
Figure 1—figure supplement 1

Transiently reprogrammed cells reacquire their initial cellular identity.
(A) Mean DNA methylation age (calculated using multiple epigenetic clocks; Hannum et al., 2013; Horvath et al., 2018; Weidner et al., 2014; Yang et al., 2016; Lu et al., 2019a; Levine et al., 2018) throughout the reprogramming process where cells were transduced with our tetO-GFP-hOKMS vector and treated continuously with 2 µg/ml of doxycycline. Reprogramming is divided into three distinct phases: initiation phase (IP), maturation phase (MP), and stabilization phase (SP). DNA methylation age according to the skin and blood clock decreased substantially during the MP of reprogramming in cells that were successfully reprogramming (magenta line) but not in control cells (yellow and orange lines represent non-transduced cells and cells expressing hOKMS but failing to reprogram as indicated by cell surface markers, respectively). DNA methylation age decreased substantially during the SP for other epigenetic clocks and was unaffected by reprogramming for the epiTOC clock. Points represent the mean and error bars the standard deviation. N=3 biological replicates per condition, where fibroblasts were derived from different donors. N=2 biological replicates for the iPSC time point (day 51). (B) The percentage of cells measured in each quadrant during the flow sort for successfully reprogramming cells (top panel). Cells were classified as CD13 only (CD13+ SSEA4−), double negative (‘DN,’ CD13− SSEA4−), double positive (‘DP, CD13+ SSEA4+), or SSEA4 only (CD13− SSEA4+). Cells that were collected are color coded (light yellow=negative control intermediate, light orange=failed to transiently reprogram intermediate, and light magenta=transient reprogramming intermediate). Bars represent the mean and error bars the standard deviation. Representative flow cytometry plots (bottom panel) show where gates were placed for determining the presence/absence of surface markers. (C) Representative 3D renderings of cells (generated using Volocity) that failed to transiently reprogram or were negative controls at the start, intermediate, and end stages of MPTR. CD13 is colored in green, SSEA4 is colored in red, and DAPI staining is colored in blue. White scale bars represent a distance of 20 µm. (D) Principal component analysis (PCA) of the transcriptomes of the samples generated in this study (without reference data sets). PC1 separates the starting fibroblasts from fully reprogrammed iPSCs. Transient reprogramming intermediate samples cluster closer to iPSCs than fibroblasts. Upon completion of transient reprogramming, samples cluster again with fibroblasts. (E) PCA of the DNA methylomes of the samples generated in this study (without reference data sets). PC1 separates the starting fibroblasts from fully reprogrammed iPSCs. Transient reprogramming intermediate samples cluster in between iPSCs and fibroblasts. Upon completion of transient reprogramming, samples cluster again with fibroblasts. iPSC, induced pluripotent stem cell.
Figure 2 with 1 supplement

Epigenetic memory at enhancers and persistent fibroblast gene expression may allow cells to return to their initial identity.
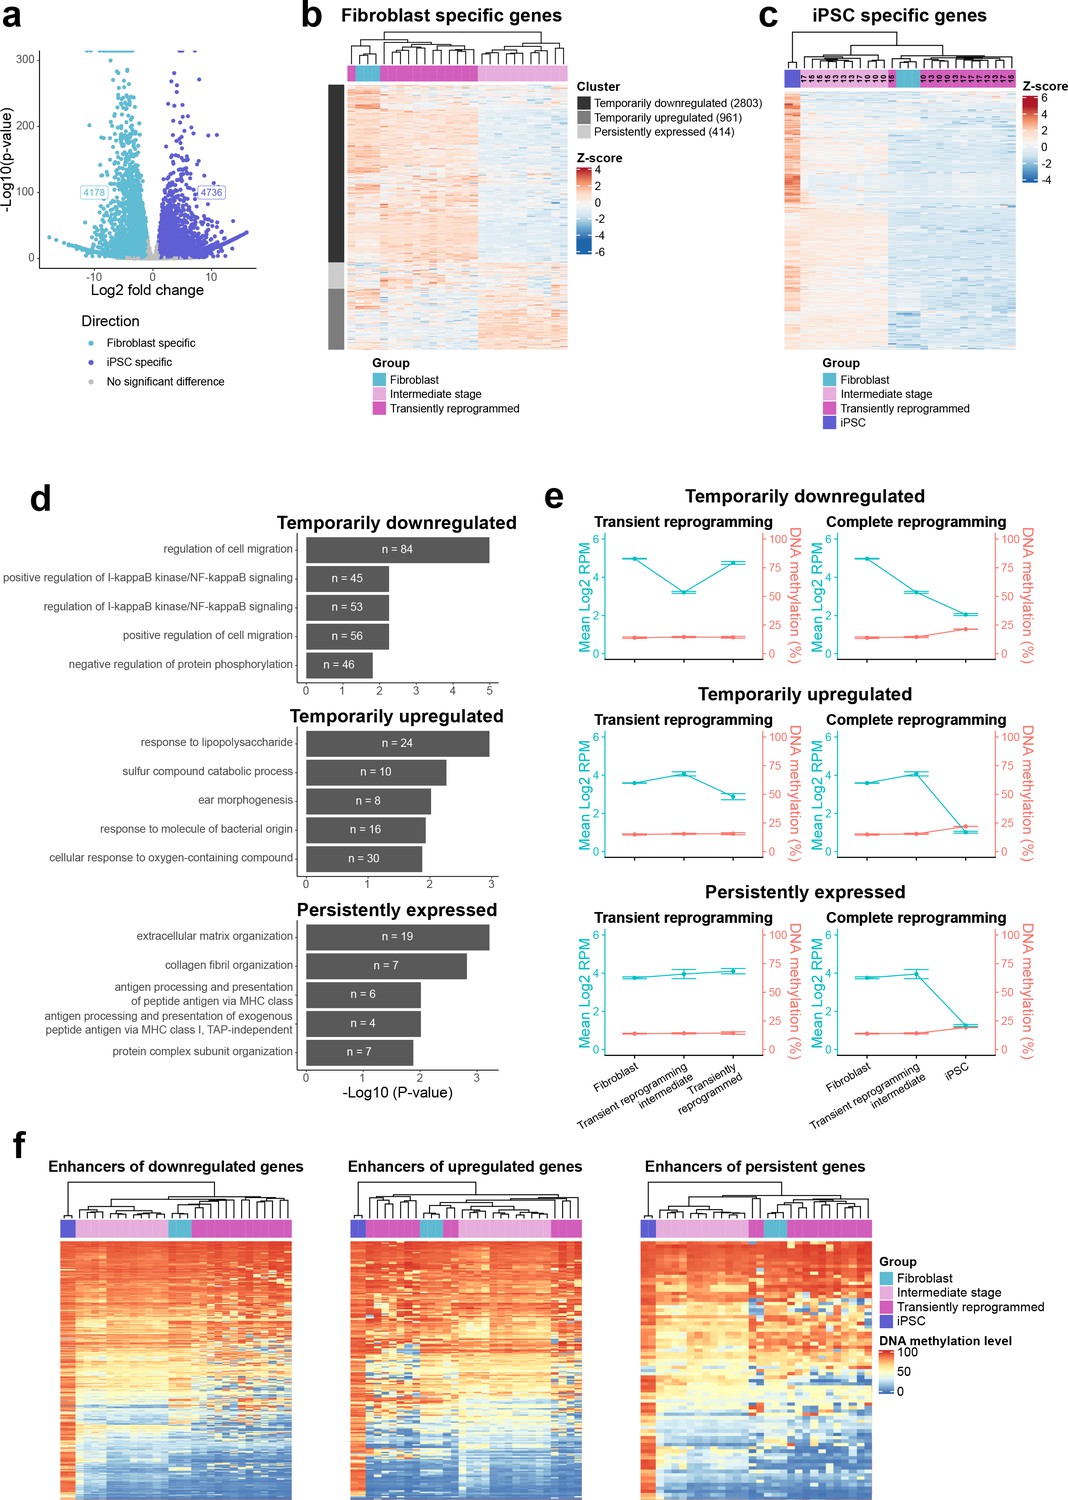
(A) The mean expression levels of fibroblast-specific and iPSC-specific gene sets during transient reprogramming and complete reprogramming. Error bars represent the standard deviation. (B) Heatmap examining the expression of fibroblast-specific genes in cells before (light blue group), during (light magenta group, transient reprogramming intermediate cells), and after (magenta group, transiently reprogrammed fibroblasts) transient reprogramming as well as in iPSCs (dark blue group). The number of days of reprogramming is indicated above the heatmap where applicable. The majority of fibroblast genes are downregulated at the intermediate stages of transient reprogramming. However, some fibroblast genes are persistently expressed or temporarily upregulated at this stage. (C) Mean DNA methylation levels across enhancers linked to the three clusters of fibroblast genes during transient reprogramming and complete reprogramming. DNA methylation levels across enhancers remain unchanged during transient reprogramming regardless of the expression of their associated genes. In comparison, DNA methylation levels across these regions increase during complete reprogramming. Error bars represent the standard deviation. (D) Heatmap examining the DNA methylation levels of fibroblast-specific enhancers in cells before (light blue group), during (light magenta group), and after (magenta group) transient reprogramming as well as in iPSCs (dark blue group). Each sample was plotted as a single column, whether reprogrammed for 10, 13, 15, or 17 days. Fibroblast enhancers became hypermethylated during complete reprogramming but were still demethylated at the intermediate stages of transient reprogramming. Fibroblast-specific enhancers were defined as enhancers that are active in fibroblasts but no longer active in iPSCs (become inactive, poised, or repressed) based on Ensembl regulatory build annotations. (E) The mean expression and enhancer methylation levels of example genes during transient reprogramming and complete reprogramming. MMP1 is a gene that demonstrates epigenetic memory as it is temporarily downregulated during transient reprogramming and its enhancer remains demethylated. COL1A2 is a gene that demonstrates transcriptional persistence as it remains expressed throughout transient reprogramming. iPSC, induced pluripotent stem cell.
Figure 2—figure supplement 1
Epigenetic memory at enhancers and persistent fibroblast gene expression may allow cells to return to their initial identity.
(A) Volcano plot showing the differentially expressed genes between iPSCs and fibroblasts. Differentially expressed genes were determined with DESeq2 (p≤0.05 and log2 fold change≤1). In this comparison, upregulated genes were classed as iPSC-specific genes and downregulated genes were classed as fibroblast-specific genes. (B) Heatmap examining the expression of fibroblast-specific genes in cells before (light blue group), during (light magenta group, transient reprogramming intermediate cells), and after (magenta group, transiently reprogrammed fibroblasts) transient reprogramming. Fibroblast genes were divided into three clusters, which displayed different expression patterns during transient reprogramming. The number of genes within each cluster is shown in brackets. (C) Heatmap examining the expression of iPSC-specific genes in cells before (light blue group), during (light magenta group, transient reprogramming intermediate cells), and after (magenta group, transiently reprogrammed fibroblasts) transient reprogramming as well as in iPSCs (dark blue group). The number of days of reprogramming is indicated above the heatmap where applicable. (D) Mean DNA methylation levels across promoters linked to the three clusters of fibroblast genes during transient reprogramming and complete reprogramming. DNA methylation levels across promoters remained lowly methylated during transient reprogramming and complete reprogramming regardless of the expression of their associated genes. Error bars represent the standard deviation. (E) Heatmaps examining the DNA methylation levels of enhancers linked to the three clusters of fibroblast genes in cells before (light blue group), during (light magenta group), and after (magenta group) transient reprogramming as well as in iPSCs (dark blue group). For all three clusters, a subset of enhancers was still demethylated at the intermediate stages of transient reprogramming but became hypermethylated during complete reprogramming. iPSC, induced pluripotent stem cell.
Figure 3 with 1 supplement
Transient reprogramming reverses age-associated changes in the transcriptome and partially restores fibroblast migration speed.
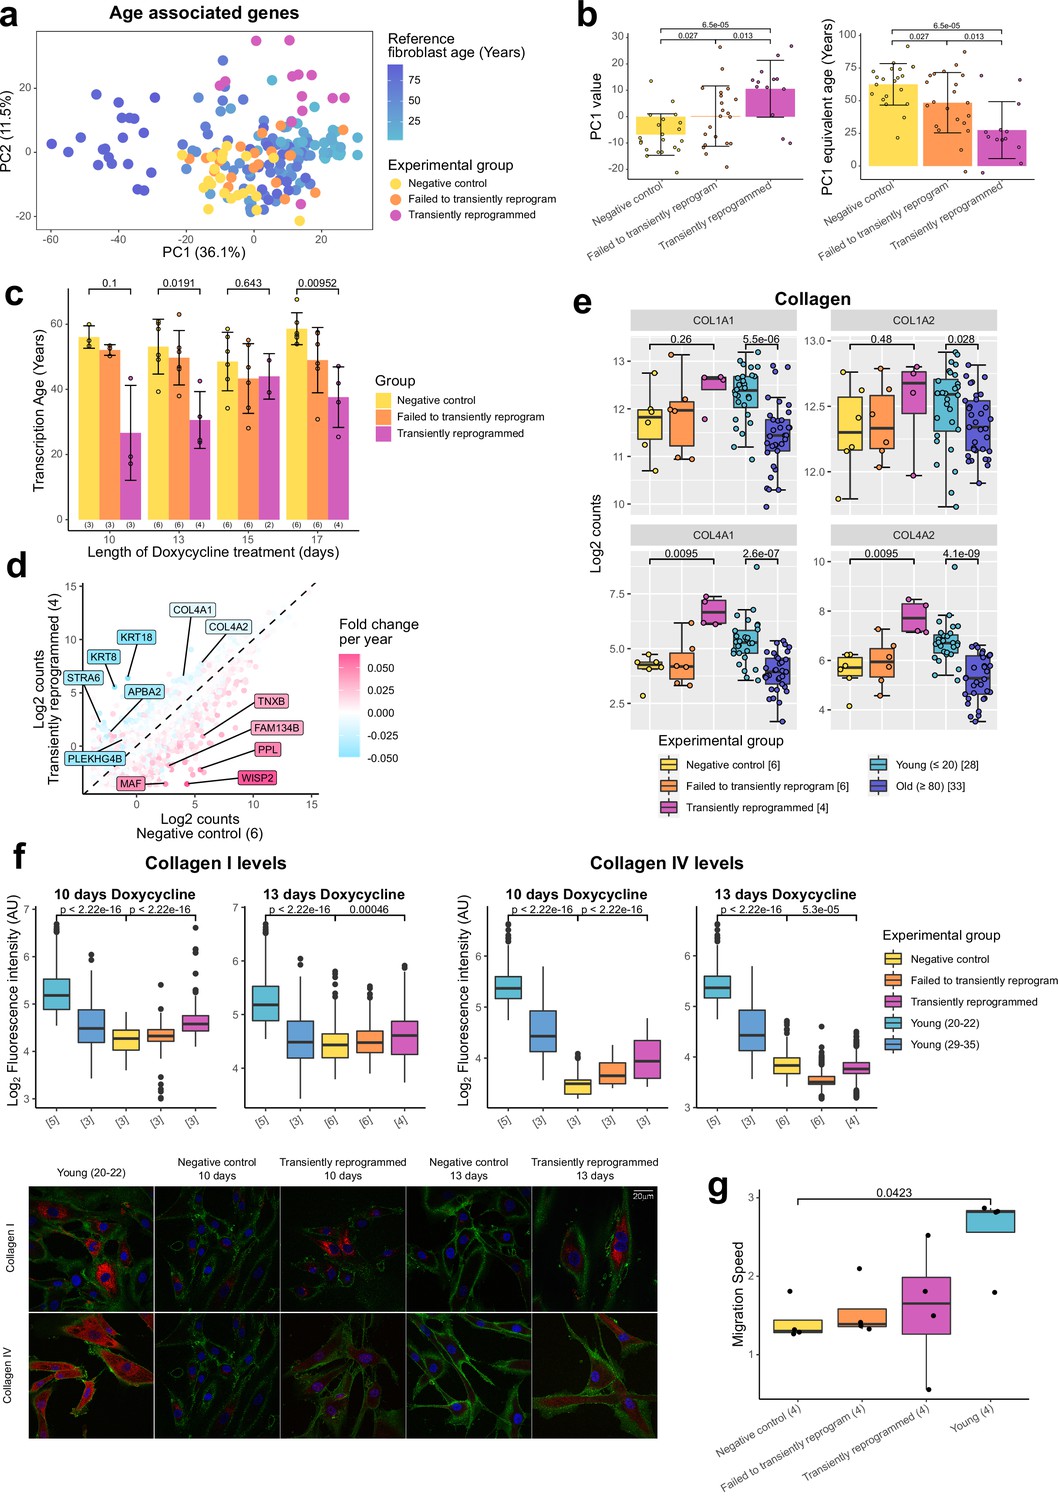
(A) Principal component analysis (PCA) of fibroblast aging-associated gene expression levels in transient reprogramming (magenta) and reference aging fibroblast samples (light blue-dark blue). Reference samples formed an aging trajectory along PC1. Transiently reprogrammed samples located closer to young fibroblasts than negative control samples did (yellow and orange), suggesting they were transcriptionally younger. (B) PC1 values from the PCA of fibroblast aging-associated gene expression levels and their equivalent age based on the reference aging fibroblast samples. PC1 values were greater in transiently reprogrammed samples than negative control and failed to transiently reprogram samples and as result these samples appear to be younger. Bars represent the mean and error bars represent the standard deviation. (C) Mean transcription age calculated using a custom transcriptome clock (median absolute error = 12.57 years) for negative control samples (yellow), samples that expressed OSKM but failed to reprogram based on cell surface markers (orange) and cells that were successfully transiently reprogrammed (magenta) as described in Figure 1B for 10, 13, 15, or 17 days. The number of distinct samples in each group is indicated in brackets. Bars represent the mean and error bars the standard deviation. Statistical significance was calculated with Mann-Whitney U-tests. (D) The mean expression levels of all genes in transiently reprogrammed samples with 13 days of reprogramming compared to those in corresponding negative control samples. In addition, genes have been color coded by their expression change with age. Genes that upregulate with age were downregulated with transient reprogramming and genes that downregulate with age were upregulated with transient reprogramming. Notable example genes have been highlighted. The number of distinct samples in each group is indicated in brackets. (E) The expression levels of collagen genes that were restored to youthful levels after transient reprogramming with 13 days of reprogramming. Bars represent the mean and error bars the standard deviation. The number of distinct samples in each group is indicated in square brackets. Significance was calculated with a two-sided Mann-Whitney U-test. (F) Boxplots of the protein levels of collagen I and IV in individual cells after transient reprogramming for 10 or 13 days calculated based on fluorescence intensity within segmented cells following immunofluorescence staining. Boxes represent upper and lower quartiles and central lines the median. The protein levels of collagen I and IV increased after transient reprogramming. The number of distinct samples in each group is indicated in square brackets. Representative images are included (bottom panel). CD44 is colored in green, collagen I and IV are colored in red, and DAPI staining is colored in blue. Significance was calculated with a two-sided Mann-Whitney U-test. (G) The migration speed of fibroblasts in a wound healing assay. Migration speed was significantly lower in negative control fibroblasts from middle-aged donors compared to fibroblasts from young donors (aged 20–22). Transient reprogramming improved the migration speed in some samples but had no effect in others. Technical replicates were averaged, and the mean values have been presented as boxplots where the boxes represent the upper and lower quartiles and the central lines the median. Significance was calculated with a Tukey’s range test.
Figure 3—figure supplement 1

Transient reprogramming reverses age-associated changes in the transcriptome and partially restores fibroblast migration speed.
(A) Results of the tenfold cross validation comparing predicted age to actual age for a custom transcriptome clock. (B) Mean transcription age calculated using a custom transcriptome clock (median absolute error=12.57 years) for initiation phase transiently reprogrammed fibroblasts (Sarkar et al., 2020). The number of distinct samples in each group is indicated in brackets. Bars represent the mean and error bars the standard deviation. (C) Mean transcription age calculated using the retrained BiT age clock (median absolute error=5.55 years) for negative control samples (yellow), samples that expressed OSKM but failed to reprogram based on cell surface markers (orange), and cells that were successfully transiently reprogrammed (magenta) for 10, 13, 15, or 17 days. The number of distinct samples in each group is indicated in brackets. Bars represent the mean and error bars the standard deviation. Statistical significance was calculated with Mann-Whitney U-tests. (D) The expression levels of notable genes that were restored to youthful levels after transient reprogramming with 13 days of reprogramming. Bars represent the mean and error bars the standard deviation. The number of distinct samples in each group is indicated in square brackets. (E) Migration speed of the technical replicates in a wound healing assay. Matched samples from the same starting population of fibroblasts (biological replicates) have been grouped (separated by dashed lines). In addition, the migration speeds of fibroblasts from four young control donors have been provided for comparison. In two cases, transient reprogramming improved the migration speed of fibroblasts and in two cases transient reprogramming appeared to have no effect on migration speed.
Figure 4 with 1 supplement
Optimal transient reprogramming can reverse age-associated changes in the epigenome.
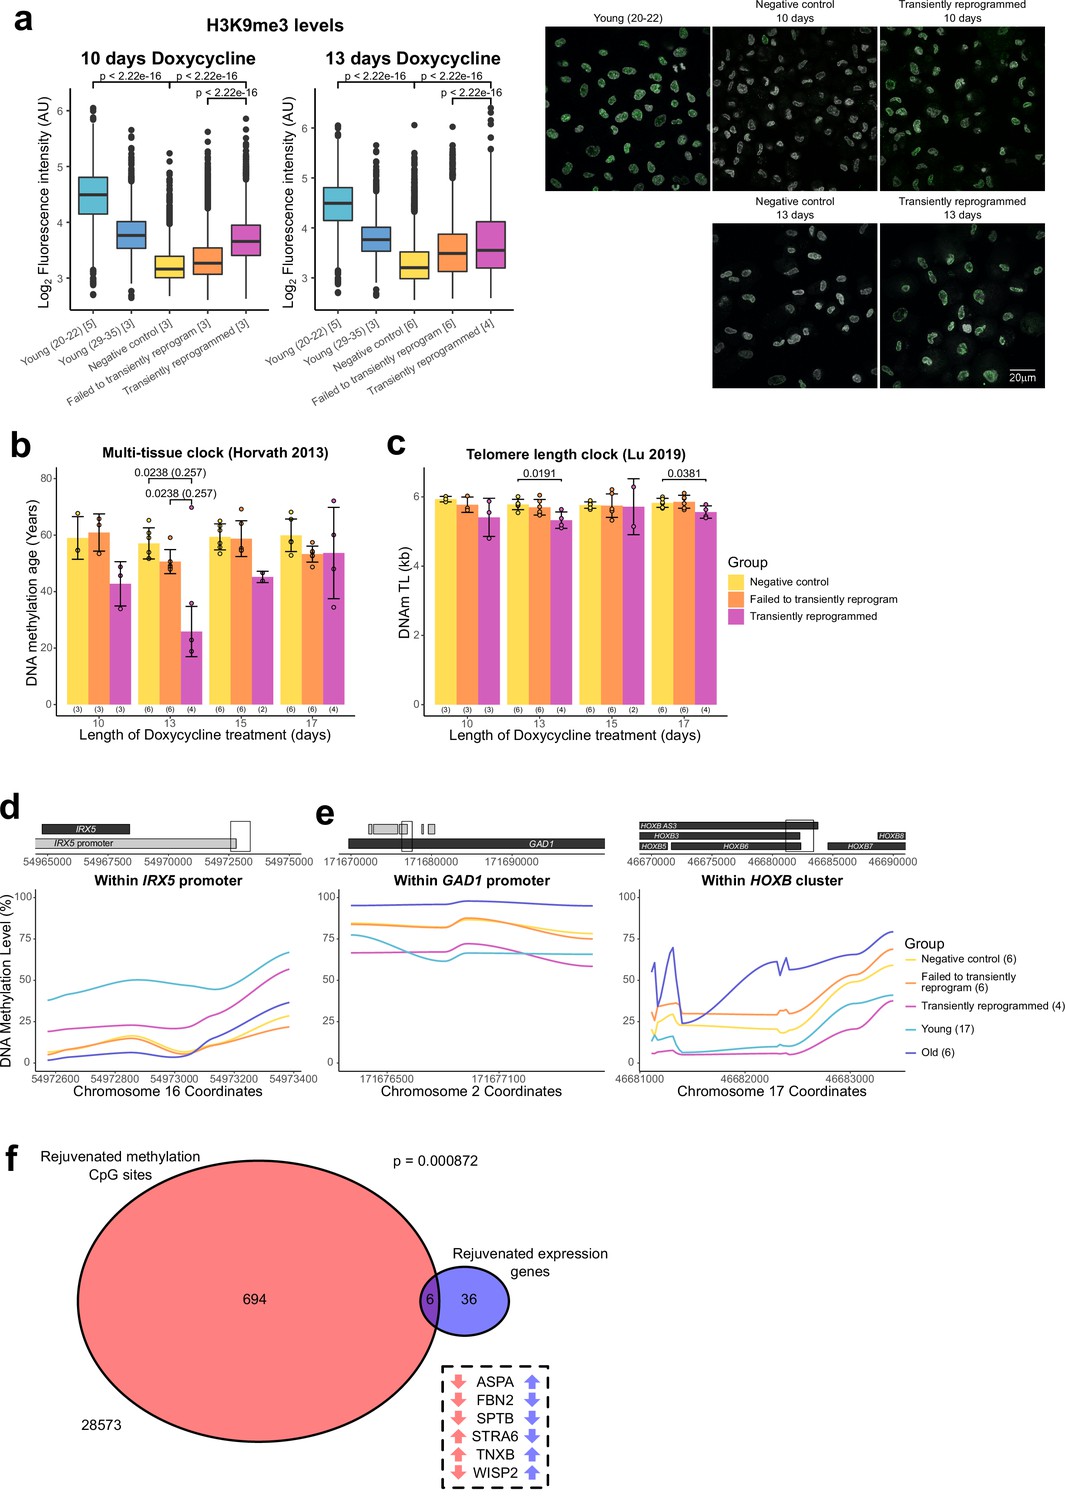
(A) Boxplots of the levels of H3K9me3 in individual cells calculated based on fluorescence intensity within nuclei (segmented using DAPI). The levels of H3K9me3 were found to decrease with age and increase after transient reprogramming for 10 or 13 days. Boxes represent upper and lower quartiles and central lines the median. The number of distinct samples in each group is indicated in square brackets. Representative images are included (right panel). H3K9me3 is colored in green and DAPI staining is colored in gray scale. Significance was calculated with a two-sided Mann-Whitney U-test. (B) Mean DNA methylation age of samples after transient reprogramming calculated using the multi-tissue clock (Horvath, 2013). DNA methylation age substantially reduced after 13 days of transient reprogramming. Shorter and longer lengths of transient reprogramming led to smaller reductions in DNA methylation age. Bars represent the mean and error bars represent the standard deviation. The outlier in the 13 days of transient reprogramming group was excluded from calculation of the mean and standard deviation. Significance was calculated with a two-sided Mann-Whitney U-test with (in brackets) and without the outlier. The number of distinct samples in each group is indicated in brackets beneath the bars. (C) Mean telomere length of samples after transient reprogramming calculated using the telomere length clock (O’Sullivan et al., 2010). Telomere length either did not change or was slightly reduced after transient reprogramming. Bars represent the mean and error bars represent the standard deviation. Significance was calculated with a two-sided Mann-Whitney U test. (D) Mean DNA methylation levels across a rejuvenated age-hypomethylated region. This region is found within the IRX5 promoter. Samples transiently reprogrammed for 13 days were pooled for visualization purposes. The number of distinct samples in each group is indicated in brackets. (E) Mean DNA methylation levels across rejuvenated age-hypermethylated regions. These regions are found within the GAD1 promoter and HOXB locus. Samples transiently reprogrammed for 13 days were pooled for visualization purposes. The number of distinct samples in each group is indicated in brackets. (F) The overlap in rejuvenated methylation CpG sites and rejuvenated expression genes. Rejuvenated CpG sites were annotated with the nearest gene for this overlap analysis. The universal set was restricted to genes that were annotated to CpG sites in the DNA methylation array. Fisher’s exact test was used to calculate the significance of the overlap. The six genes that were found in both sets are listed along with the direction of their DNA methylation (red) and gene expression (blue) change with age.
Figure 4—figure supplement 1
Optimal transient reprogramming can reverse age-associated changes in the epigenome.
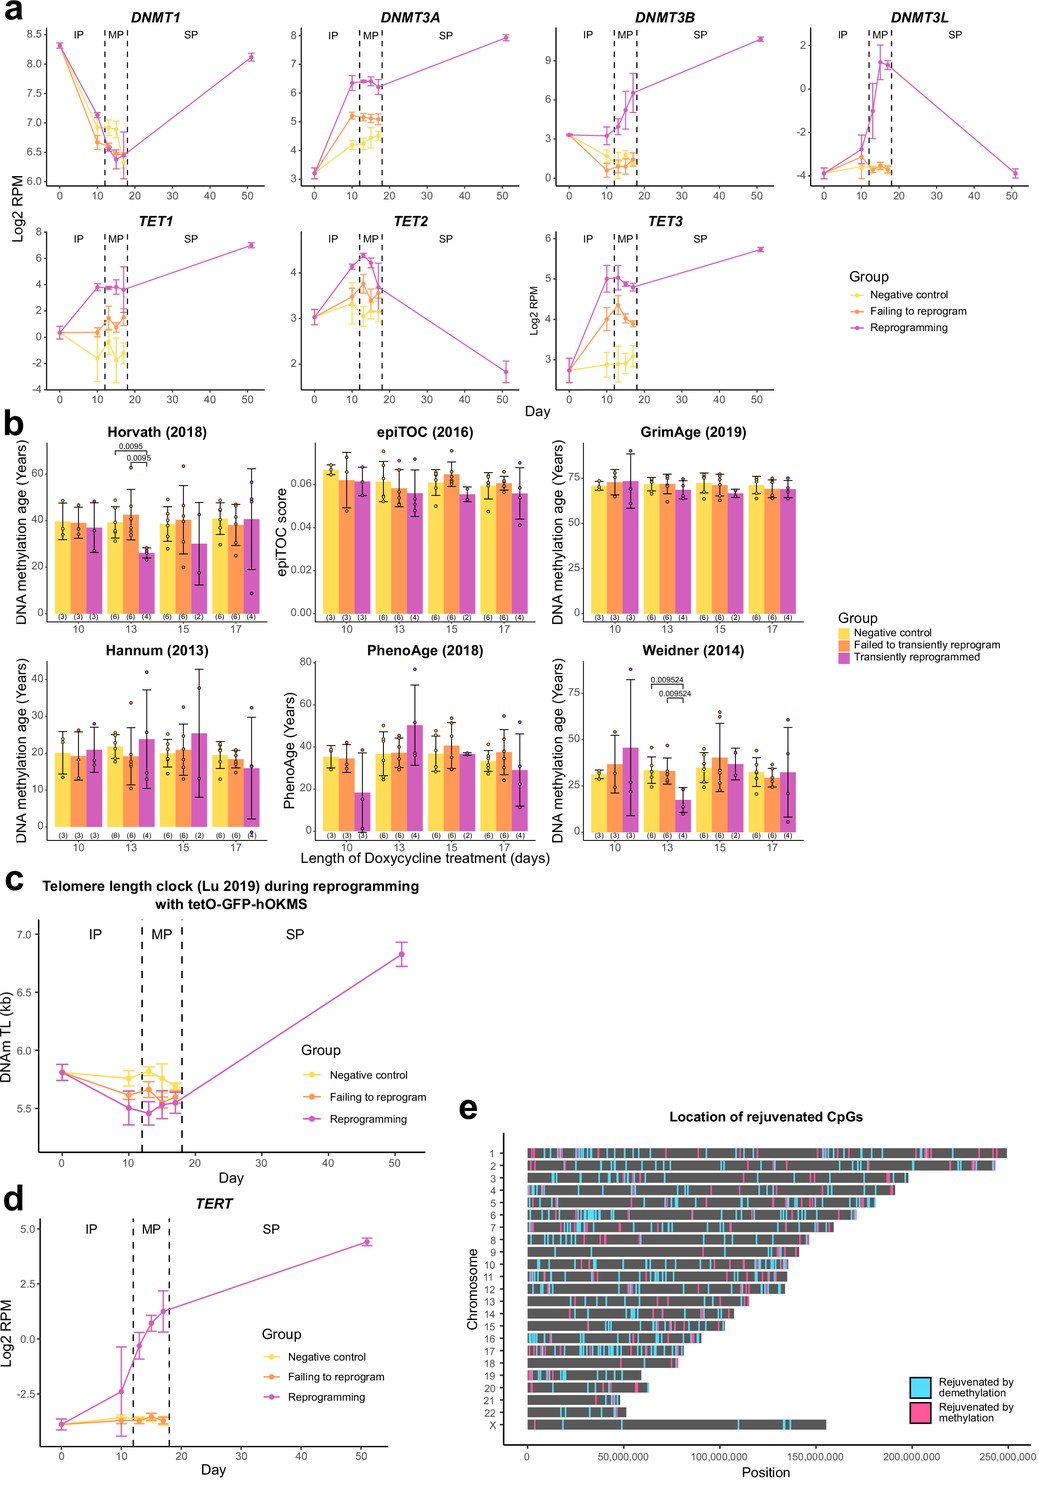
(A) The expression levels of DNA methyltransferases and TET enzymes throughout the reprogramming process where cells were transduced with our tetO-GFP-hOKMS vector and treated continuously with 2µg/ml of doxycycline. Reprogramming is divided into three distinct phases: initiation phase (IP), maturation phase (MP), and stabilization phase (SP). The de novo methyltransferases and TET enzymes are upregulated during the MP relative to negative controls. N=3 biological replicates per condition, where fibroblasts were derived from different donors. N=2 biological replicates for the day 17 reprogramming time point and the iPSC time point (day 51). (B) Mean DNA methylation age of samples after transient reprogramming calculated using multiple epigenetic clocks (Hannum et al., 2013; Horvath et al., 2018; Weidner et al., 2014; Yang et al., 2016; Lu et al., 2019a; Levine et al., 2018). DNA methylation age substantially reduced after 13 days of transient reprogramming for the skin and blood clock and the Weidner clock. Shorter and longer lengths of transient reprogramming led to smaller reductions in DNA methylation age. Other epigenetic clocks were unaffected by the four lengths of transient reprogramming. Bars represent the mean and error bars represent the standard deviation. Significance was calculated with the Mann-Whitney U-test. The number of distinct samples in each group is indicated in brackets. (C) Mean telomere length (calculated using the telomere length clock; Lu et al., 2019b) throughout the reprogramming process where cells were transduced with our tetO-GFP-hOKMS vector and treated continuously with 2 µg/ml of doxycycline. Reprogramming is divided into three distinct phases: IP, MP, and SP. Telomere length decreases during the IP and MP and begins to increase during the SP. Points represent the mean and error bars the standard deviation. N=3 biological replicates per condition, where fibroblasts were derived from different donors. N=2 biological replicates for the iPSC time point (day 51). (D) The expression of TERT throughout the reprogramming process where cells were transduced with our tetO-GFP-hOKMS vector. Reprogramming is divided into three distinct phases: IP, MP, and SP. Points represent the mean and error bars the standard deviation. TERT expression begins to increase during the MP and is weakly expressed at the end of the MP. TERT expression continues to increase during the SP. N=3 biological replicates per condition, where fibroblasts were derived from different donors. N=2 biological replicates for the day 17 reprogramming time point and the iPSC time point (day 51). (E) The location of rejuvenated CpG sites after 13 days of transient reprogramming. Sites rejuvenated by demethylation are colored in blue and sites rejuvenated by methylation are colored in pink. iPSC, induced pluripotent stem cell.
Author response image 1
Additional files
-
Supplementary file 1
A comparison of previous transient reprogramming methods.
- https://cdn.elifesciences.org/articles/71624/elife-71624-supp1-v2.xlsx
-
Supplementary file 2
The complete results of the Tukey’s range test that was used to compare the morphology ratio between the different stages and groups of MPTR.
- https://cdn.elifesciences.org/articles/71624/elife-71624-supp2-v2.xlsx
-
Supplementary file 3
The lists of fibroblast genes that were identified to either temporarily downregulate, temporarily upregulate or persist in their expression during MPTR.
- https://cdn.elifesciences.org/articles/71624/elife-71624-supp3-v2.xlsx
-
Transparent reporting form
- https://cdn.elifesciences.org/articles/71624/elife-71624-transrepform1-v2.docx
Download links
A two-part list of links to download the article, or parts of the article, in various formats.
Downloads (link to download the article as PDF)
Open citations (links to open the citations from this article in various online reference manager services)
Cite this article (links to download the citations from this article in formats compatible with various reference manager tools)
Multi-omic rejuvenation of human cells by maturation phase transient reprogramming
eLife 11:e71624.
https://doi.org/10.7554/eLife.71624


